Biological Variability and Impact of Oral Contraceptives on Vitamins B6, B12 and Folate Status in Women of Reproductive Age

Abstract
:1. Introduction
2. Experimental Section
2.1. Participants
2.2. Blood Collection and Analysis
2.3. Dietary and Exercise Data
2.4. Statistical Analyses
3. Results
3.1. Blood Analyses

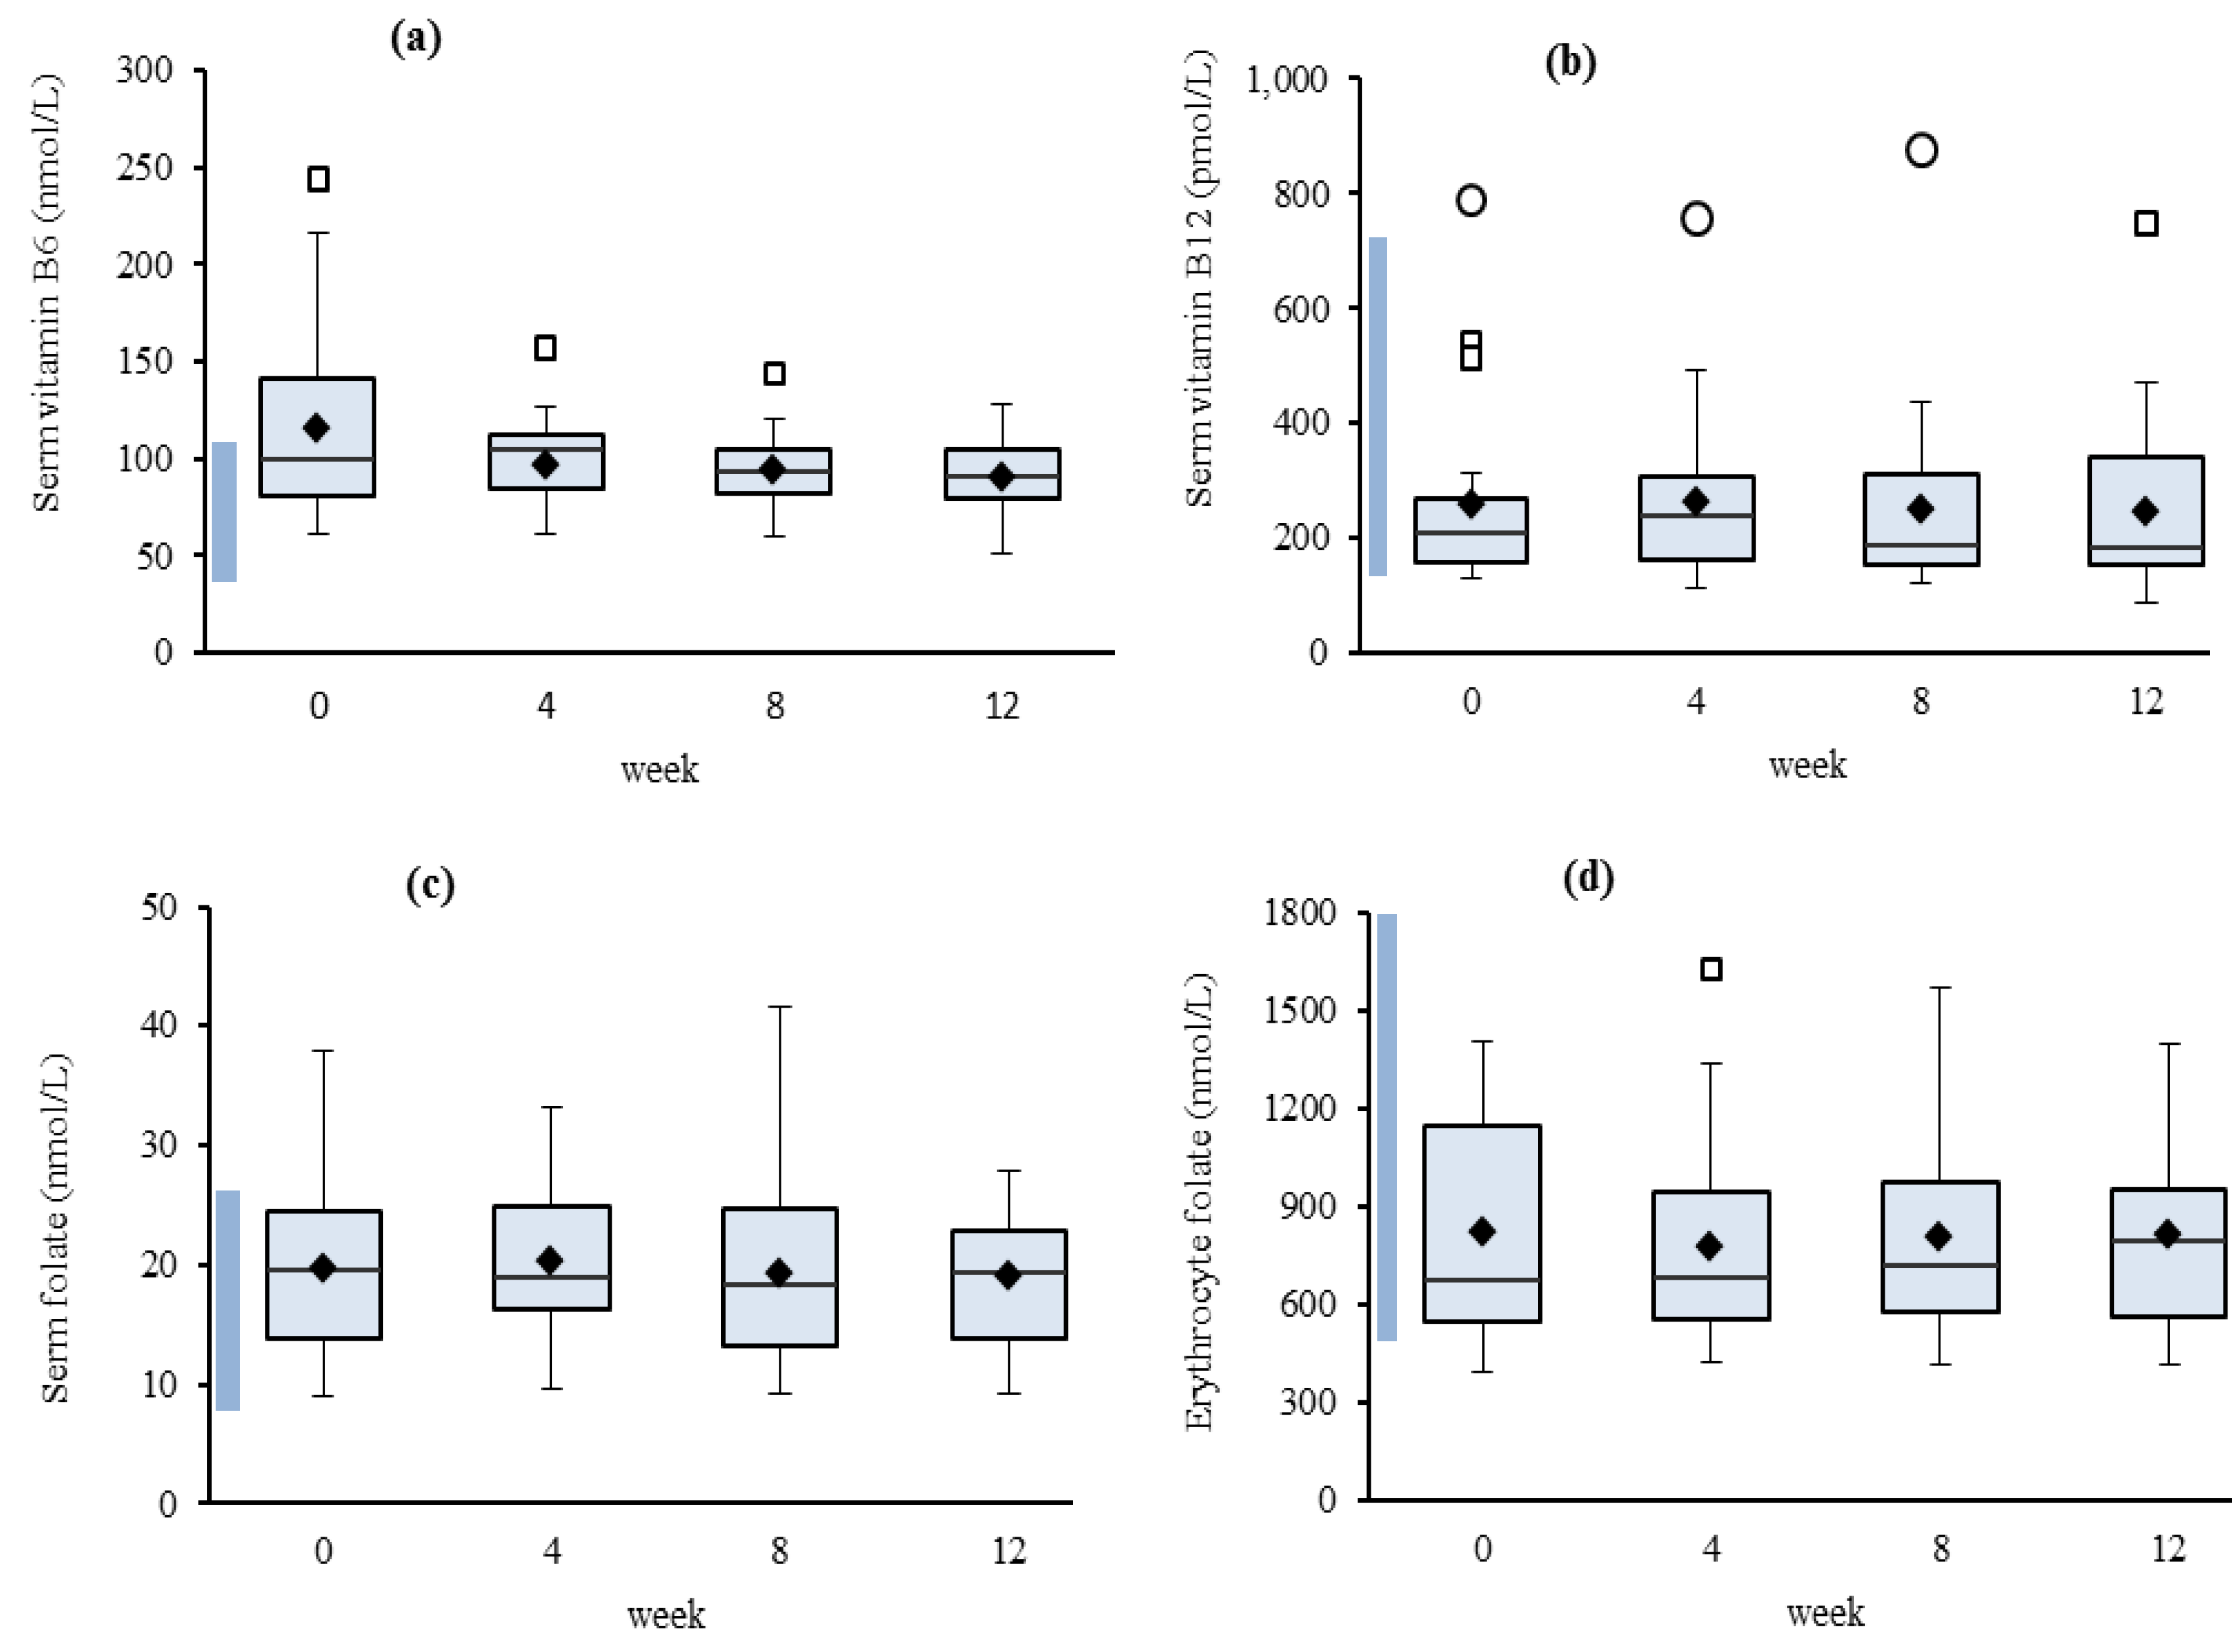
3.1.1. Variability

| CVG % | CVI % | CVI/CVG | RCV (95%) | |
|---|---|---|---|---|
| Serum | ||||
| Vitamin B6 (nmol/L) | 31.7 | 25.7 | 0.81 | 72.8 |
| Vitamin B12 (pmol/L) | 62.2 | 16.1 | 0.26 | 49.8 |
| Folate (nmol/L) | 36.8 | 20.4 | 0.55 | 60.7 |
| Erythrocyte | ||||
| Folate (nmol/L) | 39.1 | 16.1 | 0.41 | 49.8 |
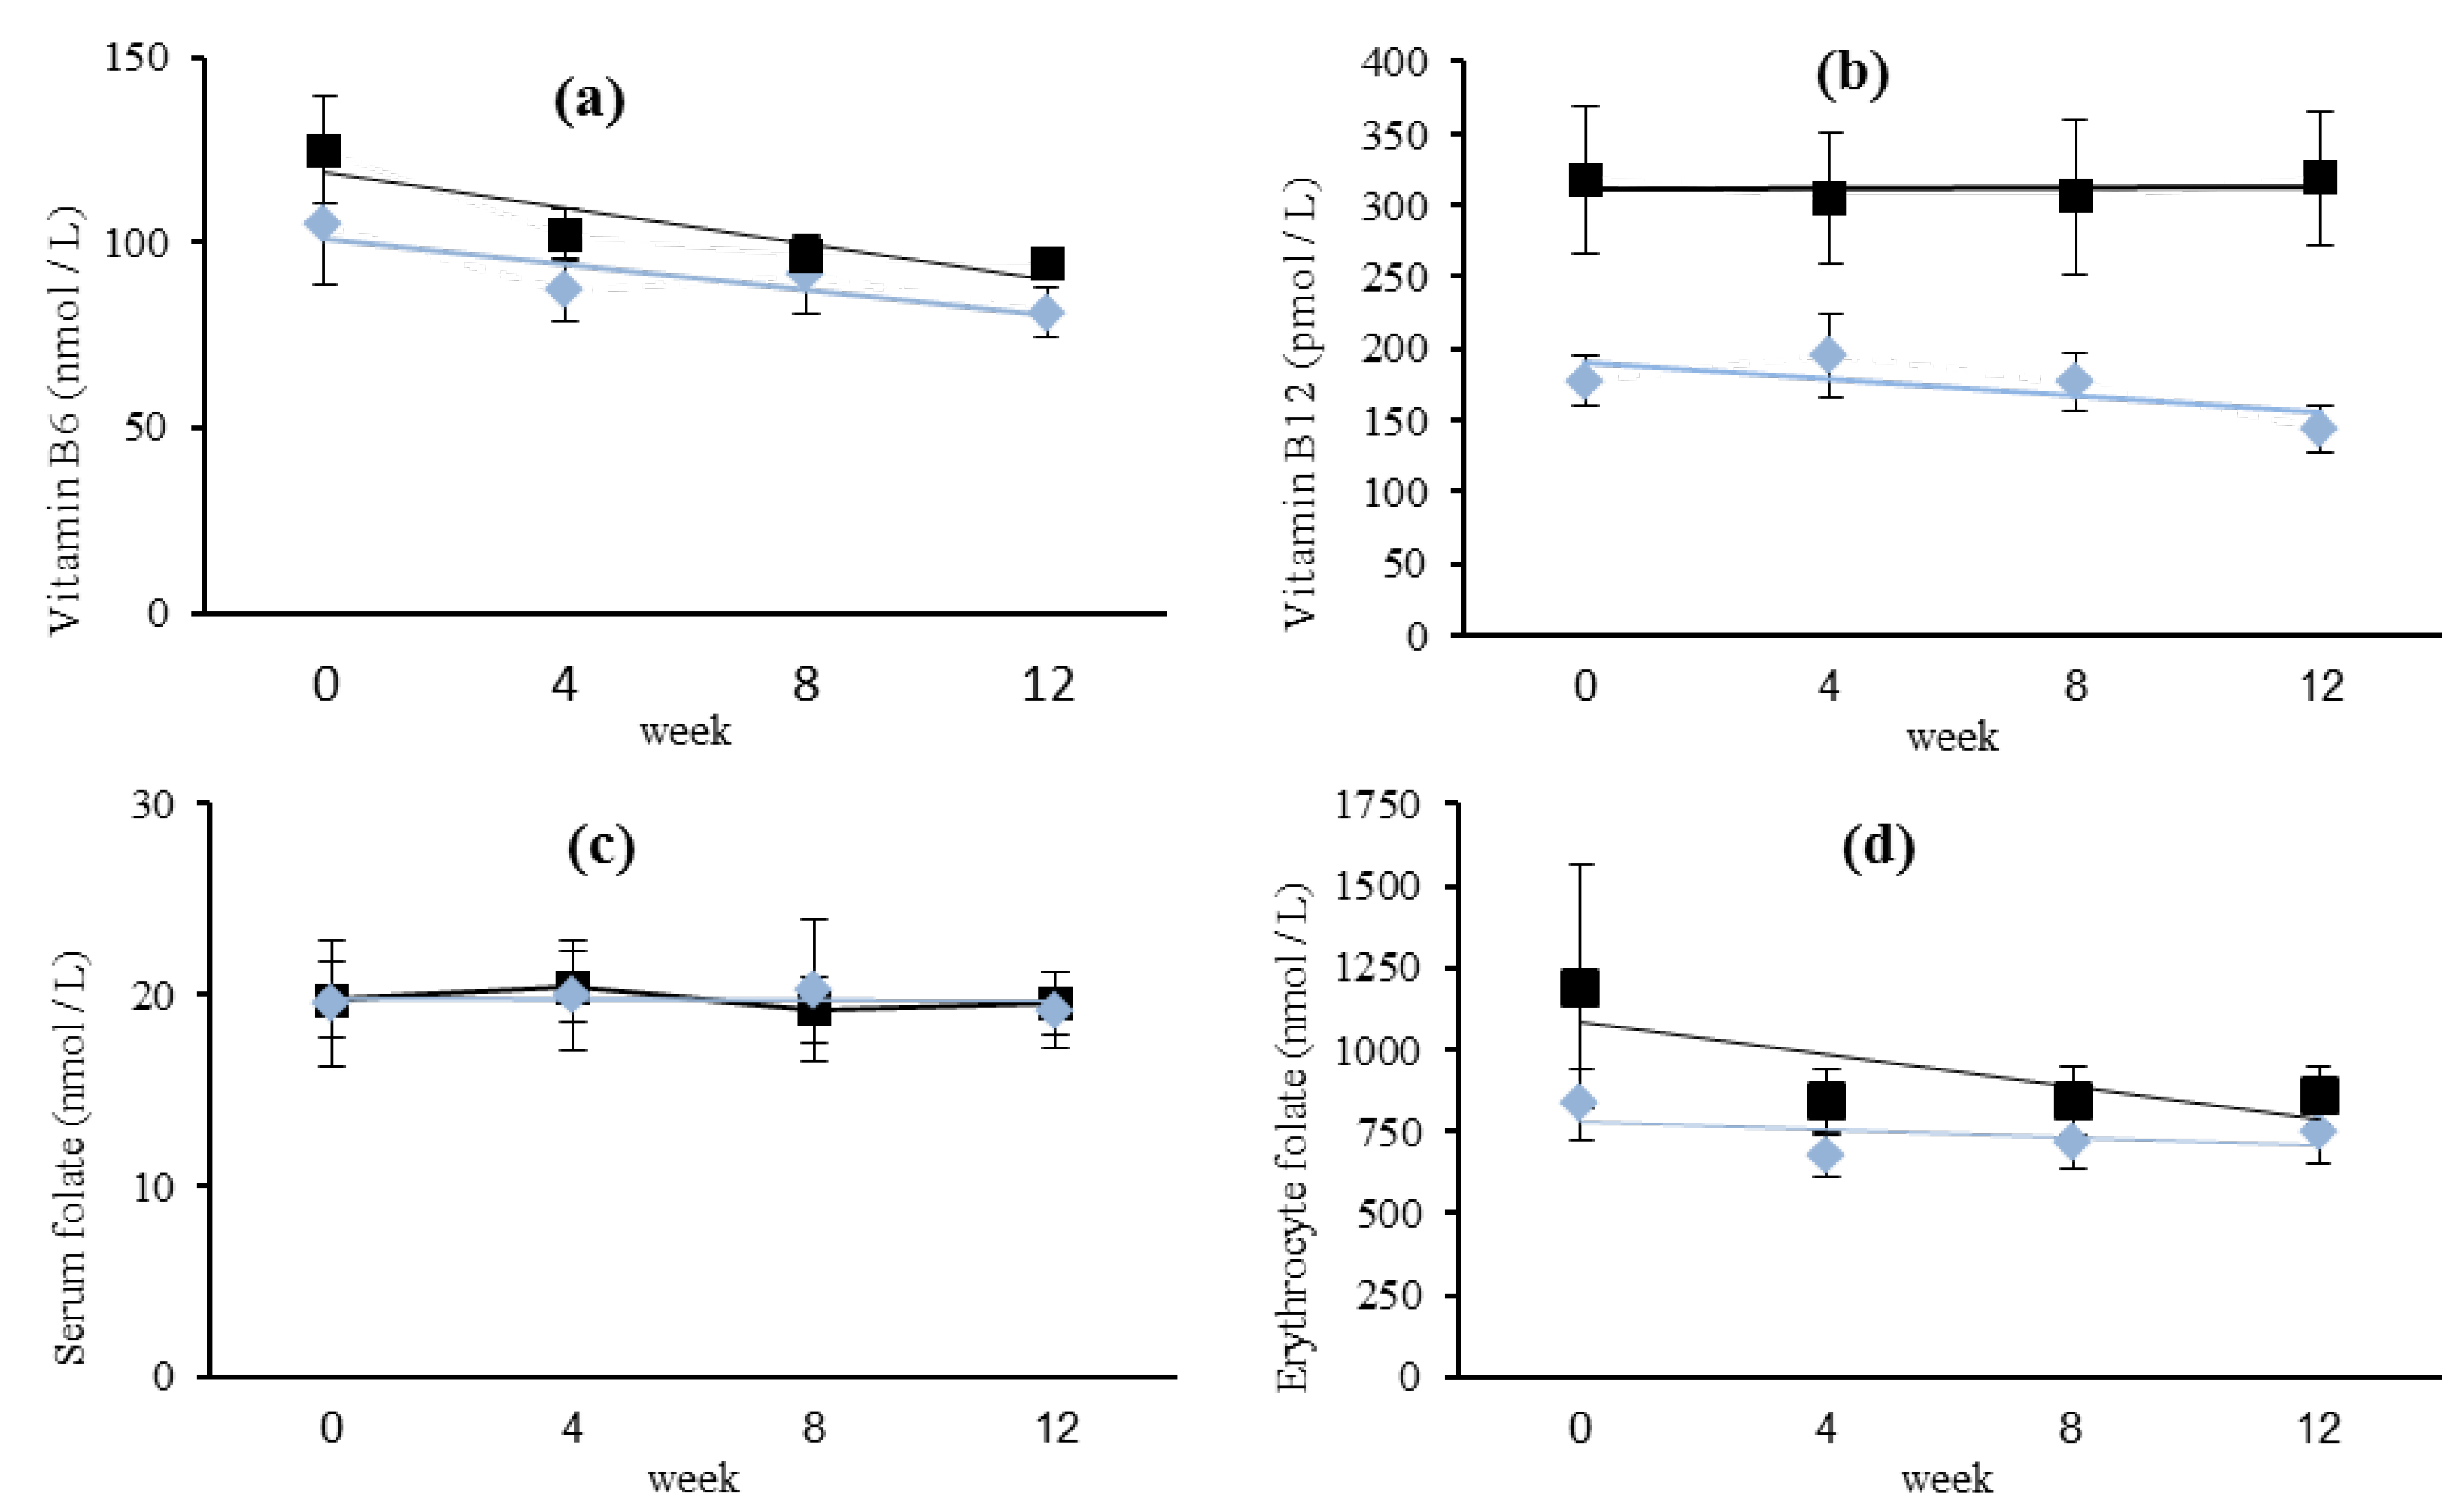
3.1.2. Relationships
 (n = 9) and non-OCP users ■ (n = 13). Missing data for one OCP user at four weeks.
(n = 9) and non-OCP users ■ (n = 13). Missing data for one OCP user at four weeks.
(n = 9) and non-OCP users ■ (n = 13). Missing data for one OCP user at four weeks.
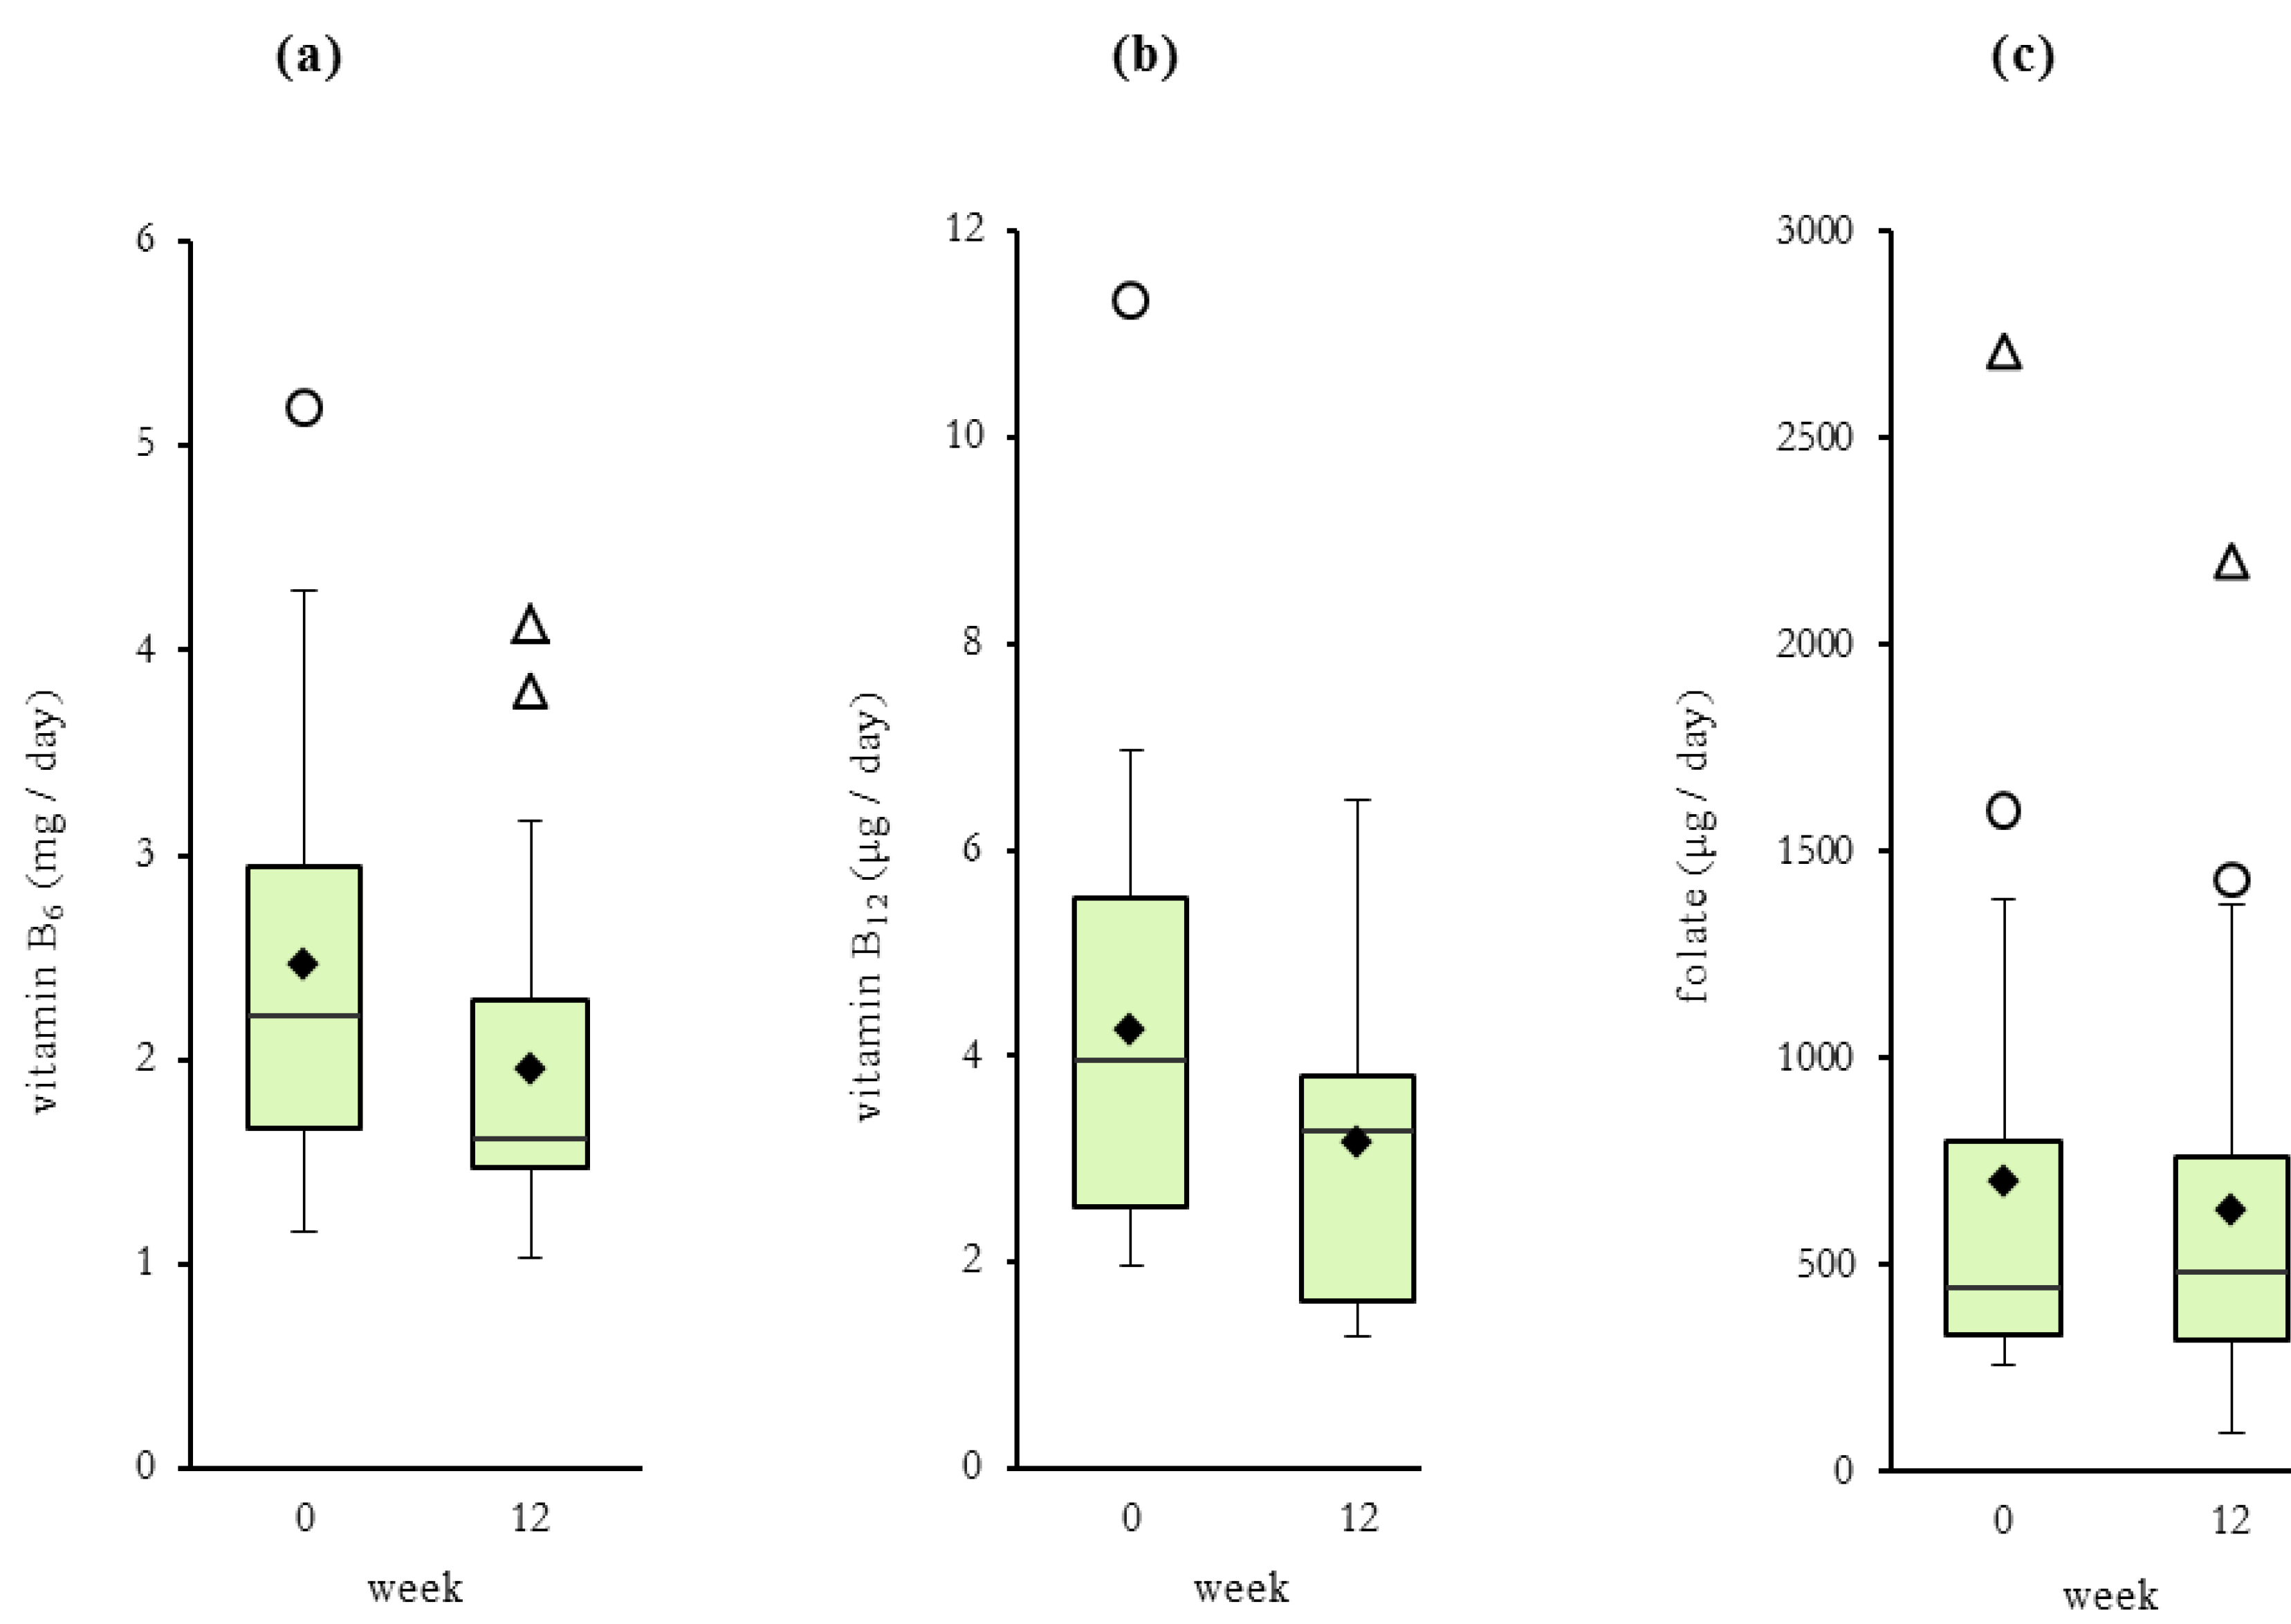
3.2. Dietary Analyses
| week 0 | week 12 | |||||||||
|---|---|---|---|---|---|---|---|---|---|---|
| Daily Vitamin Intake/MJ | Daily Vitamin Intake/MJ | |||||||||
| ID n = 22 | Age year | BMI kg/m2 | Energy MJ/day | Vit B6 mg | Vit B12 μg | Folate Eq μg | Energy MJ/day | Vit B6 mg | Vit B12 μg | Folate Eq μg |
| i | 18.5 | 24.3 | 22.6 | 0.19 | 0.31 | 31.38 | 16.3 | 0.14 | 0.22 | 37.14 |
| ii | 24.8 | 23.0 | 19.4 | 0.19 | 0.31 | 69.90 | 17.3 | 0.18 | 0.21 | 79.43 |
| iii | 26.3 | 19.5 | 15.8 | 0.10 | 0.14 a | 34.57 | 11.7 | 0.10 b | 0.14 | 38.47 |
| iv c | 25.9 | 25.4 | 9.5 | 0.24 | 0.39 | 168.56 | 8.0 | 0.25 | 0.54 | 95.35 |
| v c | 27.1 | 24.7 | 9.3 | 0.18 | 0.27 | 27.68 | 8.9 | 0.17 | 0.14 | 85.73 |
| vi c | 32.0 | 20.6 | 10.7 | 0.15 | 0.53 | 37.59 | 6.8 | 0.15 b | 0.32 | 56.56 |
| vii c | 20.0 | 23.3 | 10.7 | 0.17 | 0.22 a | 26.75 | 12.5 | 0.17 | 0.21 | 25.63 |
| viii | 23.1 | 19.0 | 12.2 | 0.19 | 0.48 | 223.19 | 7.7 | 0.21 | 0.60 | 287.99 |
| ix | 30.2 | 22.0 | 7.5 | 0.24 | 0.55 | 36.14 | 3.2 | 0.37 a | 0.49 | 28.78 |
| x c | 20.0 | 25.5 | 8.6 | 0.18 | 0.31 | 37.77 | 8.1 | 0.19 | 0.43 | 37.89 |
| xi c | 21.8 | 21.7 | 22.5 | 0.16 | 0.25 | 61.63 | 24.4 | 0.16 | 0.21 | 58.86 |
| xii c | 22.0 | 22.0 | 13.7 | 0.17 | 0.38 | 32.74 | 9.4 | 0.17 | 0.37 | 27.47 |
| xiii | 22.2 | 21.2 | 9.0 | 0.23 | 0.45 | 94.10 | 7.3 | 0.20 | 0.42 | 100.13 |
| xiv | 24.8 | 19.7 | 14.5 | 0.15 | 0.27 | 28.55 | 13.4 | 0.15 | 0.13 | 28.26 |
| xv | 26.8 | 22.8 | 11.3 | 0.10 a | 0.19 a | 38.62 | 14.5 | 0.10 | 0.26 | 36.19 |
| xvi c | 33.7 | 21.0 | 8.7 | 0.18 | 0.23 b | 43.87 | 7.0 | 0.19 | 0.19 | 90.79 |
| xvii | 25.3 | 24.5 | 12.9 | 0.20 | 0.31 | 53.24 | 11.0 | 0.18 | 0.26 | 38.07 |
| xviii c | 34.1 | 22.6 | 10.7 | 0.17 | 0.21 a | 30.56 | 9.1 | 0.15 | 0.15 | 39.75 |
| xix | 24.1 | 18.7 | 5.9 | 0.61 | 0.44 | 55.73 | 6.2 | 0.25 | 0.61 | 30.84 |
| xx | 23.5 | 20.1 | 16.0 | 0.17 | 0.20 | 49.83 | 26.2 | 0.09 | 0.24 | 35.25 |
| xxi | 24.3 | 18.7 | 25.5 | 0.20 | 0.44 | 21.00 | 9.6 | 0.43 | 0.16 | 67.98 |
| xxii | 24.0 | 20.3 | 13.7 | 0.21 | 0.39 | 28.67 | 10.9 | 0.21 | 0.60 | 15.33 |
| Mean | 25.2 | 21.9 | 13.2 | 0.20 | 0.33 | 56.00 | 11.3 | 0.19 | 0.31 | 61.00 |
| SD | 4.2 | 2.2 | 5.3 | 0.10 | 0.12 | 49.04 | 5.6 | 0.08 | 0.17 | 56.69 |
| Median | 24.6 | 21.9 | 11.7 | 0.18 | 0.31 | 37.68 | 9.5 | 0.18 | 0.25 | 38.27 |
| Min value | 18.5 | 18.7 | 5.9 | 0.10 | 0.14 | 21.00 | 3.2 | 0.09 | 0.13 | 15.33 |
| Max value | 34.1 | 25.5 | 25.5 | 0.61 | 0.55 | 223.19 | 26.2 | 0.43 | 0.61 | 287.99 |

| Rank a | Vitamin B6 | Vitamin B12 | Folate | |||
|---|---|---|---|---|---|---|
| food | % b | food | % b | food | % b | |
| beef and veal | 29 | beef and veal | 19 | reduced fat milk | 16 | |
| 2 | asian greens | 11 | lamb | 17 | tomato (raw) | 14 |
| 3 | carrot | 11 | egg | 13 | mixed green salad | 13 |
| 4 | reduced fat milk | 9 | fish | 13 | strawberries | 13 |
| 5 | banana | 9 | energy drinks | 12 | vegetarian lasagne | 13 |
4. Discussion
5. Conclusions
Acknowledgments
Conflicts of Interest
References
- Bartley, K.A.; Underwood, B.A.; Deckelbaum, R.J. A lifecycle micronutrient perspective for women’s health. Am. J. Clin. Nutr. 2005, 81, 1188–1193. [Google Scholar]
- Commonwealth Department of Health and Ageing Australia; Ministry of Health New Zealand; National Health and Medical Research Council. Nutrient Reference Values for Australia and New Zealand including Recommended Dietary Intakes. Available online: http://www.nhmrc.gov.au/_files_nhmrc/publications/attachments/n35.pdf (accessed on 9 August 2013).
- Truswell, A.S. The B Vitamins. In Essentials of Human Nutrition, 4th ed.; Mann, T., Ed.; Oxford University Press: New York, NY, USA, 2012; pp. 217–235. [Google Scholar]
- Spina Bifida and Anencephaly before and after Folic Acid Mandate—Unite States, 1995–1996 and 1999–2000. Available online: http://www.cdc.gov/mmwr/preview/mmwrhtml/mm5317a3.htm (accessed on 9 August 2013).
- Honein, M.A.; Paulozzi, L.J.; Mathews, T.J.; Erickson, J.D.; Wong, L.C. Impact of folic acid fortification of the US food supply on the occurrence of neural tube defects. J. Am. Med. Assoc. 2001, 285, 2981–2996. [Google Scholar] [CrossRef]
- O’Leary, F.; Samman, S. Vitamin B12 in health and disease. Nutrients 2010, 2, 299–316. [Google Scholar] [CrossRef]
- Kimura, N.; Fukuwatari, T.; Sasaki, R.; Hayakawa, F.; Shibata, K. Vitamin intake in Japanese women college students. J. Nutr. Sci. Vitaminol. 2010, 49, 149–155. [Google Scholar]
- Tucker, K.; Rich, S.; Rosenberg, I.; Acques, P.; Dallal, G.; Wilson, P.W.F.; Selhub, J. Plasma vitamin B12 concentrations relate to intake source in the framingham offspring study. Am. J. Clin. Nutr. 2000, 71, 514–522. [Google Scholar]
- McArthur, J.O.; Petocz, P.; Caterson, I.D.; Samman, S. A randomized controlled trial in young women of the effects of consuming pork meat or iron supplements on nutritional status and feeling of well-being. J. Am. Coll. Nutr. 2012, 31, 175–184. [Google Scholar] [CrossRef]
- Worsley, A.; Skizypiec, G. Teenage vegetarianism: Prevalence, social and cognitive contexts. Appetite 1998, 30, 151–170. [Google Scholar] [CrossRef]
- Combs, G.F., Jr. Vitamin B6. In The Vitamins: Fundamental Aspects in Nutrition and Health, 3rd ed.; Elsevier Academic Press: Burlington, VT, USA, 2008; pp. 313–329. [Google Scholar]
- Sydney South West Pathology Service Laboratory Handbook. Available online: http://www.sswahs.nsw.gov.au/sswps/default_hb.htm (accessed on 9 August 2013).
- Fayet, F.; Flood, V.; Petocz, P.; Samman, S. Relative and biomarker-based validity of a food frequency questionnaire that measures the intakes of vitamin B12, folate, iron, and zinc in young womem. Nutr. Res. 2011, 31, 14–20. [Google Scholar] [CrossRef]
- Craig, C.L.; Marshall, A.F.; Sjöström, M.; Bauman, A.E.; Booth, M.L.; Ainsworth, B.E.; Pratt, M.; Ekelund, U.; Yngve, A.; Sallis, J.F.; et al. International physical activity questionnaire: 12 Country reliability and validity. Med. Sci. Sports Exerc. 2003, 35, 1381–1395. [Google Scholar] [CrossRef]
- Fraser, C.G. Reference change values. Clin. Chem. Lab. Med. 2012, 50, 807–812. [Google Scholar]
- Minitab Statistical Software, version 16; Minitab Inc.: State College, PA, USA, 2010.
- IBM SPSS Statistics for Windows, version 19.0; IBM Corp: Armonk, NY, USA, 2010.
- Shibata, K.; Fukuwatari, T.; Watanabe, T.; Nishimuta, M. Intra- and inter-individual variations of blood and urinary water soluble vitamins in Japanese young adults consuming a semi-purified diet for 7 days. J. Nutr. Sci. Vitaminol. 2009, 55, 459–470. [Google Scholar] [CrossRef]
- Talwar, D.K.; Azharuddin, M.K.; Williamson, C.; Teoh, Y.P.; McMillan, D.C.; St. J. O’Reilly, D. Biological variation of vitamins in blood of healthy individuals. Clin. Chem. 2005, 51, 2145–2150. [Google Scholar] [CrossRef]
- McKinley, M.C.; Strain, J.J.; McParlin, J.; Scott, J.M.; McNulty, H. Plasma homocysteine is not subject to seasonal variation. Clin. Chem. 2001, 47, 1430–1436. [Google Scholar]
- Harris, E.K. Effects of intra- and inter-individual variation on the appropriate use of normal ranges. Clin. Chem. 1974, 20, 1535–1542. [Google Scholar]
- Manore, M.M. Vitamin B6 and exercise. Int. J. Sport Nutr. 1994, 4, 89–103. [Google Scholar]
- Kiley, J.; Hammond, C. Combined oral contraceptives: A comprehensive review. Clin. Obstet. Gynecol. 2007, 50, 868–877. [Google Scholar] [CrossRef]
- Prasad, A.S.; Oberleas, D.; Moghissi, K.S.; Stryker, J.C.; Lei, K.Y. Effect of oral contraceptive agents on nutrients: II. Vitamins. Am. J. Clin. Nutr. 1975, 28, 385–391. [Google Scholar]
- Lussana, F.; Zighetti, M.L.; Bucciarelli, P.; Cugno, M.; Cattaneo, M. Blood levels of homocysteine, folate, vitamin B6 and B12 in women using oral contraceptives compared to non-users. Thromb. Res. 2003, 112, 37–41. [Google Scholar] [CrossRef]
- Sütterlin, M.W.; Bussen, S.S.; Rieger, L.; Dietl, J.; Steck, T. Serum folate and vitamin B12 levels in women using modern oral contraceptives containing 20 mg ethinyl estradiol. Eur. J. Obstet. Gynecol. Reprod. Biol. 2003, 107, 57–61. [Google Scholar] [CrossRef]
- Green, T.J.; Houghton, L.A.; Donovan, U.; Gibson, R.S.; O’Connor, D.L. Oral contraceptives did not affect biochemical folate indexes and homocysteine concentrations in adolescent females. J. Am. Diet. Assoc. 1998, 98, 49–55. [Google Scholar] [CrossRef]
- Wilson, S.M.C.; Bivins, B.N.; Russell, K.A.; Bailey, L.B. Oral contraceptive use: Impact on folate, vitamin B6, and vitamin B12 status. Nutr. Rev. 2011, 69, 572–583. [Google Scholar] [CrossRef]
- Riedel, B.; Bjorke Monsen, A.L.; Ueland, P.M.; Schneede, J. Effects of oral contraceptives and hormone replacement therapy on markers of cobalamin status. Clin. Chem. 2005, 51, 778–781. [Google Scholar] [CrossRef]
- Shojania, A.M.; Wylie, B. The effect of oral contraceptives on vitamin B12 metabolism. Am. J. Obstet. Gynecol. 1979, 135, 129–134. [Google Scholar]
- Gardyn, J.; Mittelman, M.; Zlotnik, J.; Sela, B.A.; Cohen, A.M. Oral contraceptives can cause falsely low vitamin B12 levels. Acta Haematol. 2000, 104, 22–24. [Google Scholar] [CrossRef]
- Georgiou, C.C.; Betts, N.M.; Hoerr, S.I.; Keim, K.; Peters, P.K.; Stewart, B.; Voichick, J. Among young adults, college students and graduates practiced more healthful habits and made more healthful food choices than did non students. J. Am. Diet. Assoc. 1997, 97, 754–759. [Google Scholar] [CrossRef]
- Burrows, T.; Pursey, K.; Neve, M.; Stanwell, P. What are the health implications associated with the consumption of energy drinks? A systematic review. Nutr. Rev. 2013, 7, 135–148. [Google Scholar]
- Fayet, F.; Flood, V.; Petocz, P; Samman, S. Avoidance of meat and poultry decreases intakes of omega-3 fatty acids, vitamin B12, selenium and zinc in young women. J. Hum. Nutr. Diet. 2013. [Google Scholar] [CrossRef]
- Fayet, F.; Petocz, P.; Samman, S. Prevalence and correlates of dieting in college women: A cross sectional study. Int. J. Women’s Health 2012, 4, 405–411. [Google Scholar]
© 2013 by the authors; licensee MDPI, Basel, Switzerland. This article is an open access article distributed under the terms and conditions of the Creative Commons Attribution license (http://creativecommons.org/licenses/by/3.0/).
Share and Cite
McArthur, J.O.; Tang, H.; Petocz, P.; Samman, S. Biological Variability and Impact of Oral Contraceptives on Vitamins B6, B12 and Folate Status in Women of Reproductive Age. Nutrients 2013, 5, 3634-3645. https://doi.org/10.3390/nu5093634
McArthur JO, Tang H, Petocz P, Samman S. Biological Variability and Impact of Oral Contraceptives on Vitamins B6, B12 and Folate Status in Women of Reproductive Age. Nutrients. 2013; 5(9):3634-3645. https://doi.org/10.3390/nu5093634
Chicago/Turabian StyleMcArthur, Jennifer O., HoMan Tang, Peter Petocz, and Samir Samman. 2013. "Biological Variability and Impact of Oral Contraceptives on Vitamins B6, B12 and Folate Status in Women of Reproductive Age" Nutrients 5, no. 9: 3634-3645. https://doi.org/10.3390/nu5093634