The Role of Dietary Sugars and De novo Lipogenesis in Non-Alcoholic Fatty Liver Disease

Abstract
:1. Introduction
2. Dietary Sugars and Health
2.1. Public Health Recommendations
2.2. Dietary Fructose
3. Molecular Evidence for a Differential Role for Fructose in NAFLD Pathogenesis
3.1. Transcriptional Regulation of Lipogenic Enzyme Expression
3.2. Uric Acid
4. Dietary Sugar and NAFLD
4.1. Observational Data Associating Sugar Intake and NAFLD
4.2. Short-Term Sugar Interventions (≤7 days) and Liver Fat


| Reference | Participant Characteristics | Study Design | Duration of Intervention | Intervention Dose | Dose as % Energy Requirement | Comparator | Assessment, Units | % Change IHCL Post-Intervention | Significance |
|---|---|---|---|---|---|---|---|---|---|
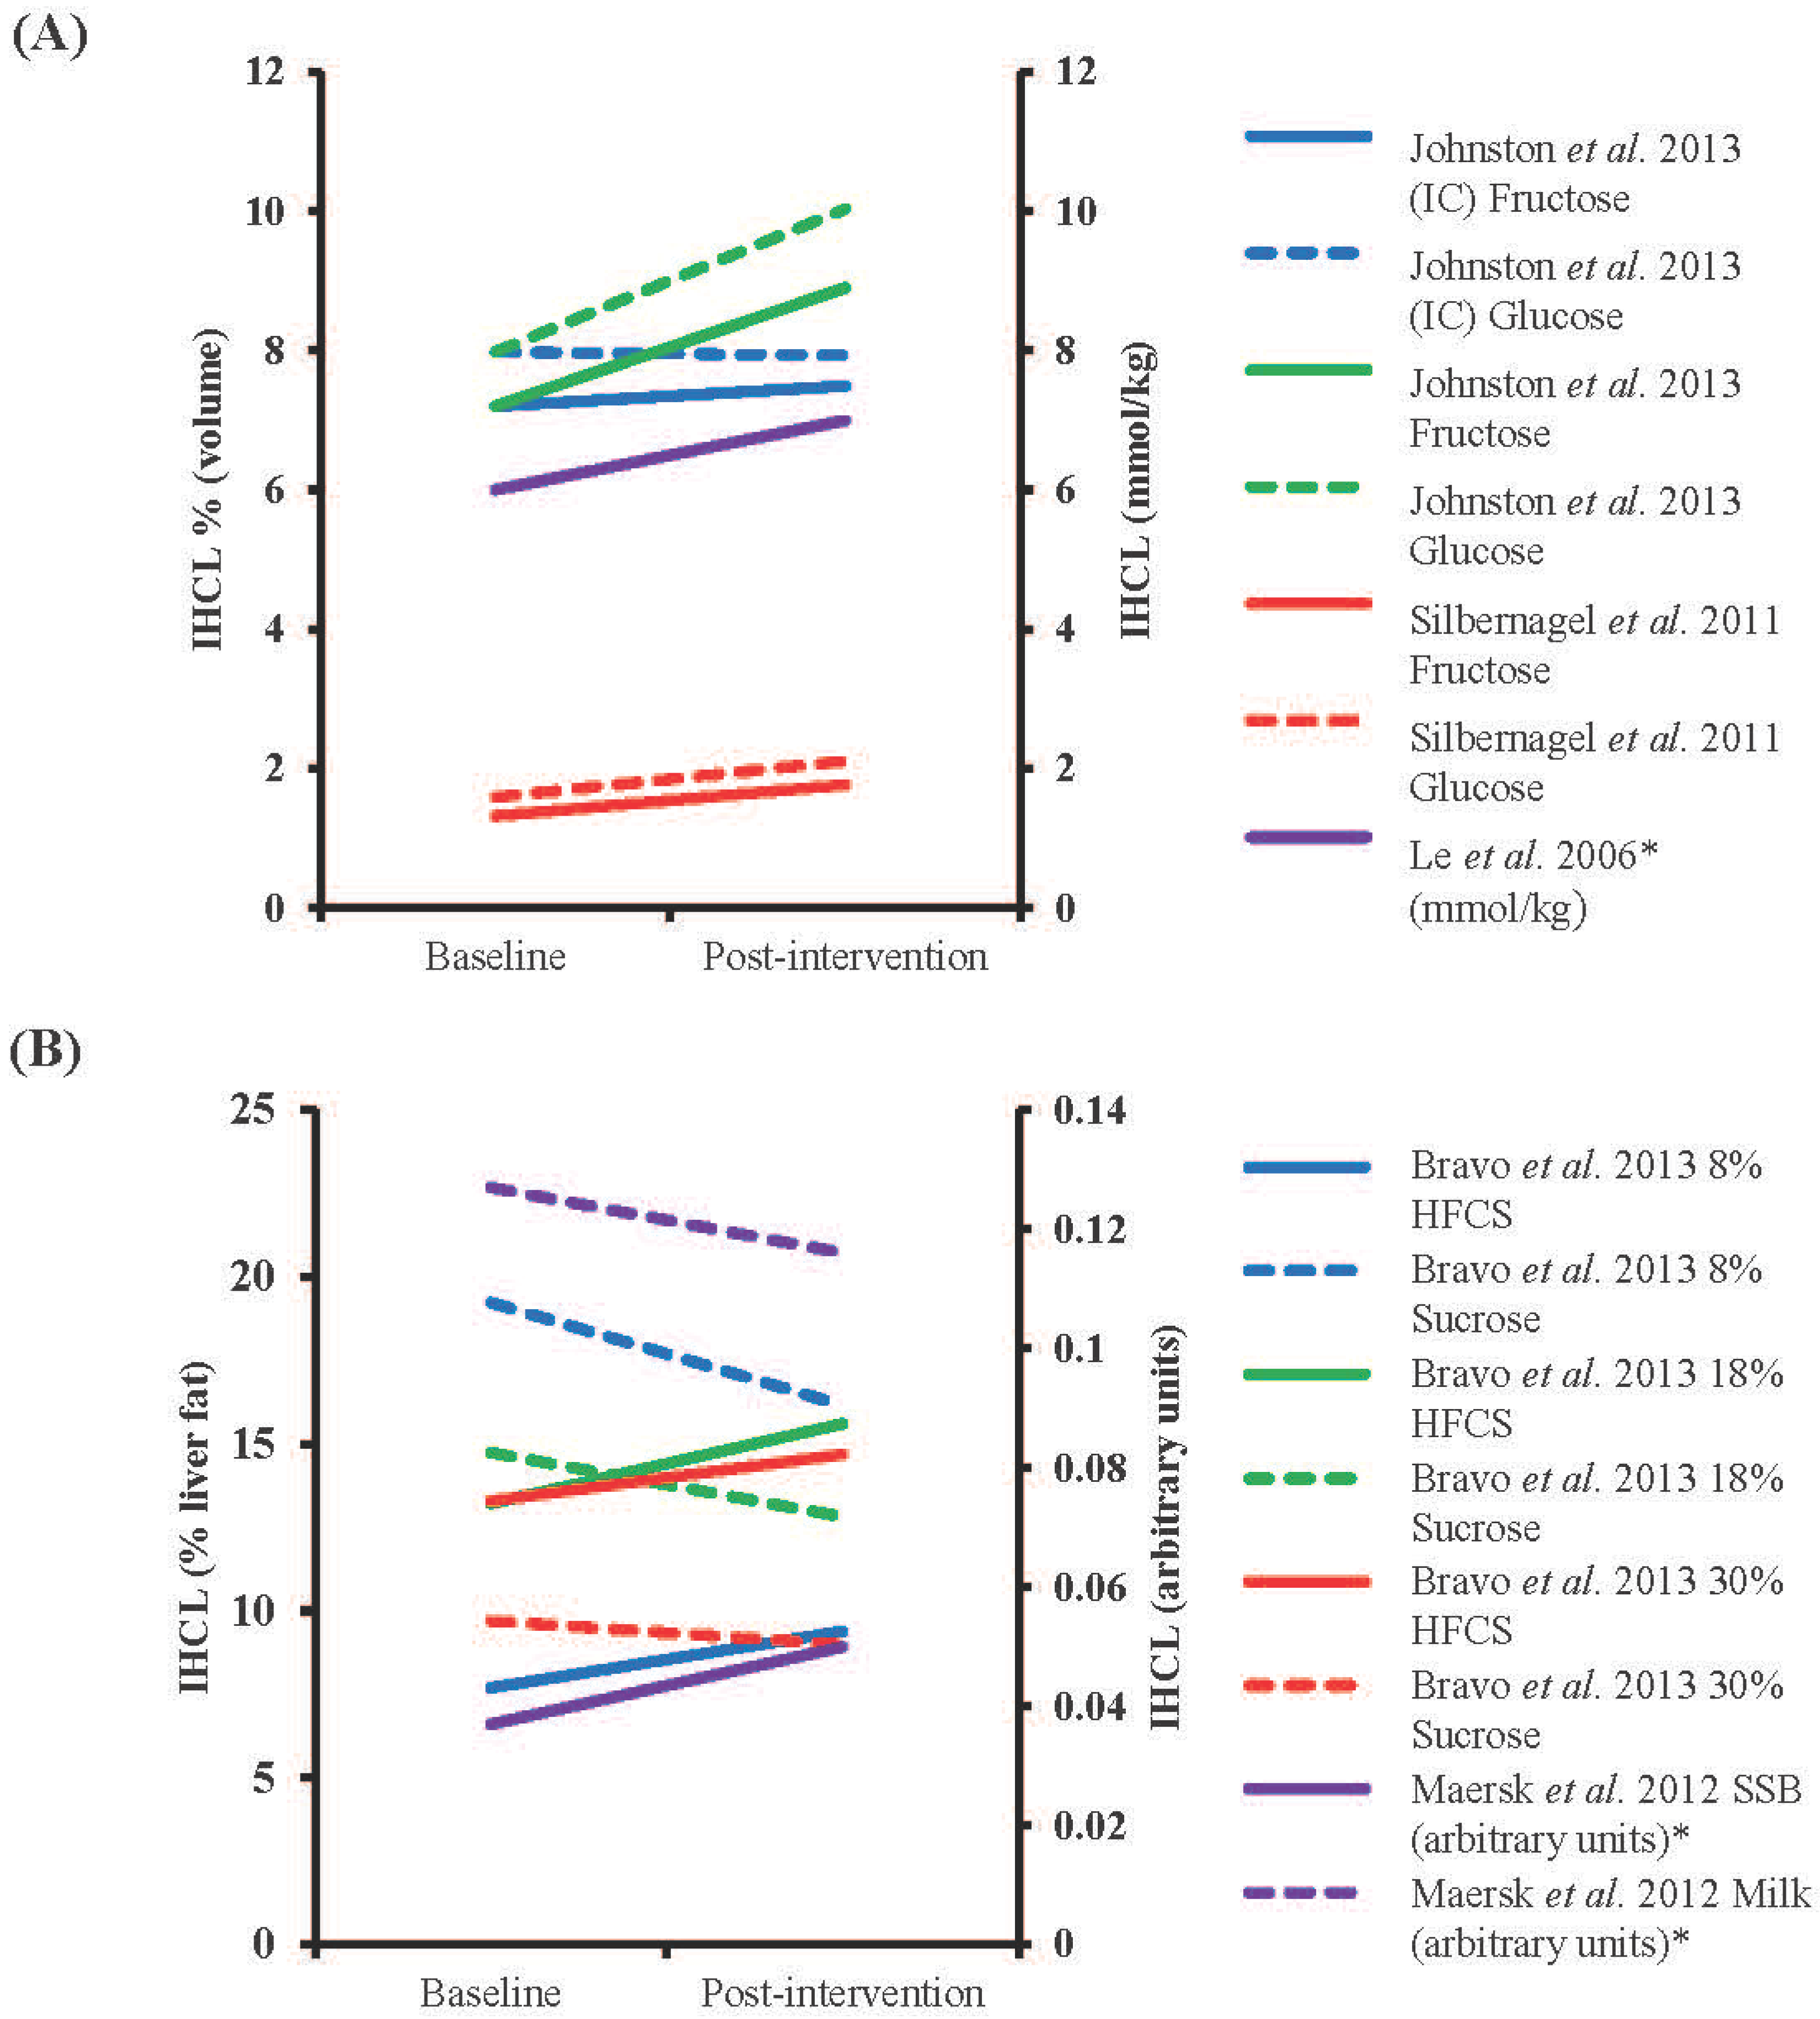
| Le et al., 2009 [15] | HM (n = 8) & male o/s T2D (n = 16), mean age 24 year (HM) and 25 year (o/s T2D), mean weight 71 kg (HM) and 75 kg (o/s T2D) | Randomized cross-over | 7 days (4–5 week washout) | 3.5 g/kg/day fructose | +35% | Control diet | 1H-MRS, volume % | 71% (HM) and 78% (o/s T2D) increase §,† | Absolute change p < 0.05 within groups |
| Lecoultre et al., 2013 [99] | Males (17 in fructose and 11 in glucose group), 23 year, 72 kg, mean BMI 22 kg/m2 | Randomized cross-over | 6–7 days (≥4 week washout) | 3 g/kg/day fructose or glucose | +~31% * | Control diet | 1H-MRS, mmol/kg | 113% (F) and 59% (G) increase | Absolute change p < 0.05 within groups, % change p < 0.05 between groups |
| Ngo Sock et al., 2010 [96] | Males (11), 25 year, 72 kg | Randomized cross-over | 7 days (2–3 weeks washout) | 3.5 g/kg/day fructose or glucose | +~36% * | Control diet | 1H-MRS, mmol/kg | 52% (F) and 58% (G) increase | Fructose p < 0.05 for % change vs. CD |
| Sobrecases et al., 2010 [98] | Males (12), 24 year, 23 kg/m2 | Cross-over | 7 days | 3.5 g/kg fat-free mass/d | +35% | Control diet | 1H-MRS, mmol/kg | 16% increase | p < 0.05 vs. CD (% change) |
| Theytaz et al., 2012 [97] | Males (9), 23 year, 23 kg/m2 | Randomized cross-over | 6 days (4–10 weeks washout) | 3 g/kg/day fructose | +~30% * | Control diet | 1H-MRS, volume % | 116% increase † | p < 0.05 vs. CD (absolute change) |
4.3. Long-Term Sugar Feeding and Liver Fat
4.4. Interventions Aimed at Reducing Fructose Intakes and Liver Fat

| Reference | Participant characteristics | Study design | Duration of Intervention | Intervention Dose | Dose as % Energy Requirements | Comparator | Assessment, Units | % Change IHCL Post-Intervention | Significance |
|---|---|---|---|---|---|---|---|---|---|
| Bravo et al., 2013 [104] | Males and females (n = 64 in total), mean age 42.2 year, mean BMI 23–35 kg/m2 | Randomized, partially blinded, parallel intervention | 10 weeks | 8%, 18% or 30% of energy intake as HFCS or sucrose | 8%, 18% or 30% | Baseline | CT, % liver fat content | 22, 18 and 11% increase (HFCS) and 16, 13 and 7% decrease (S) for 8, 18 and 30% supplementation † | NSD in absolute changes in any group |
| Johnston et al., 2013 [86] | Centrally obese males (15 in fructose and 17 in glucose group), 35 year (F) and 33 year (G), 30 kg/m2 (F) and 28.9 kg/m2 (G) | Randomized parallel intervention | 2 weeks | 25% of energy intake as glucose or fructose (IC) or same weight in addition to control diet (HC) | 25% (IC) or +25% (HC) | Baseline | 1H-MRS, volume % | After IC condition 4% increase (F) and 1% decrease (G), after HC condition 24% (F) and 26% (G) increase † | NSD after IC diet, absolute values of fructose and glucose p < 0.05 vs. baseline |
| Le et al., 2006 [101] | Males (7), 24.7 year, mean weight 69.3 kg | Parallel intervention | 4 weeks | 1.5 g/kg/day | +18% | Baseline | 1H-MRS, mmol/kg | 17% increase §,† | NSD in absolute changes |
| Maersk et al., 2012 [103] | Males and females (10 in SSB group and 12 in milk group), 39 year (SSB) and 38 year (milk), 31.3 kg/m2 (SSB) and 31.9 kg/m2 (milk) | Randomized parallel intervention | 6 months | 106 g/day SSB or equivalent energy as milk | +~16% (males) and +~20% (females) * | Baseline | 1H-MRS, arbitrary units | 36% increase after SSB, 9% decrease after milk § | p < 0.05 for % change between SSB and milk |
| Silbernagel et al., 2011 [102] | Males and females (10 in fructose and 10 in glucose groups), 30.5 year, 25.9 kg/m2 | Randomized, single-blinded parallel intervention | 4 weeks | 150 g/day fructose or glucose | +~25% | Baseline | 1H-MRS, volume % | 34% (F) and 33% (G) increase † | NSD in absolute changes |
5. Measurement of Hepatic De novo Lipogenesis
5.1. Deuterated Water
5.2. [13C]acetate
5.3. [13C]sugars
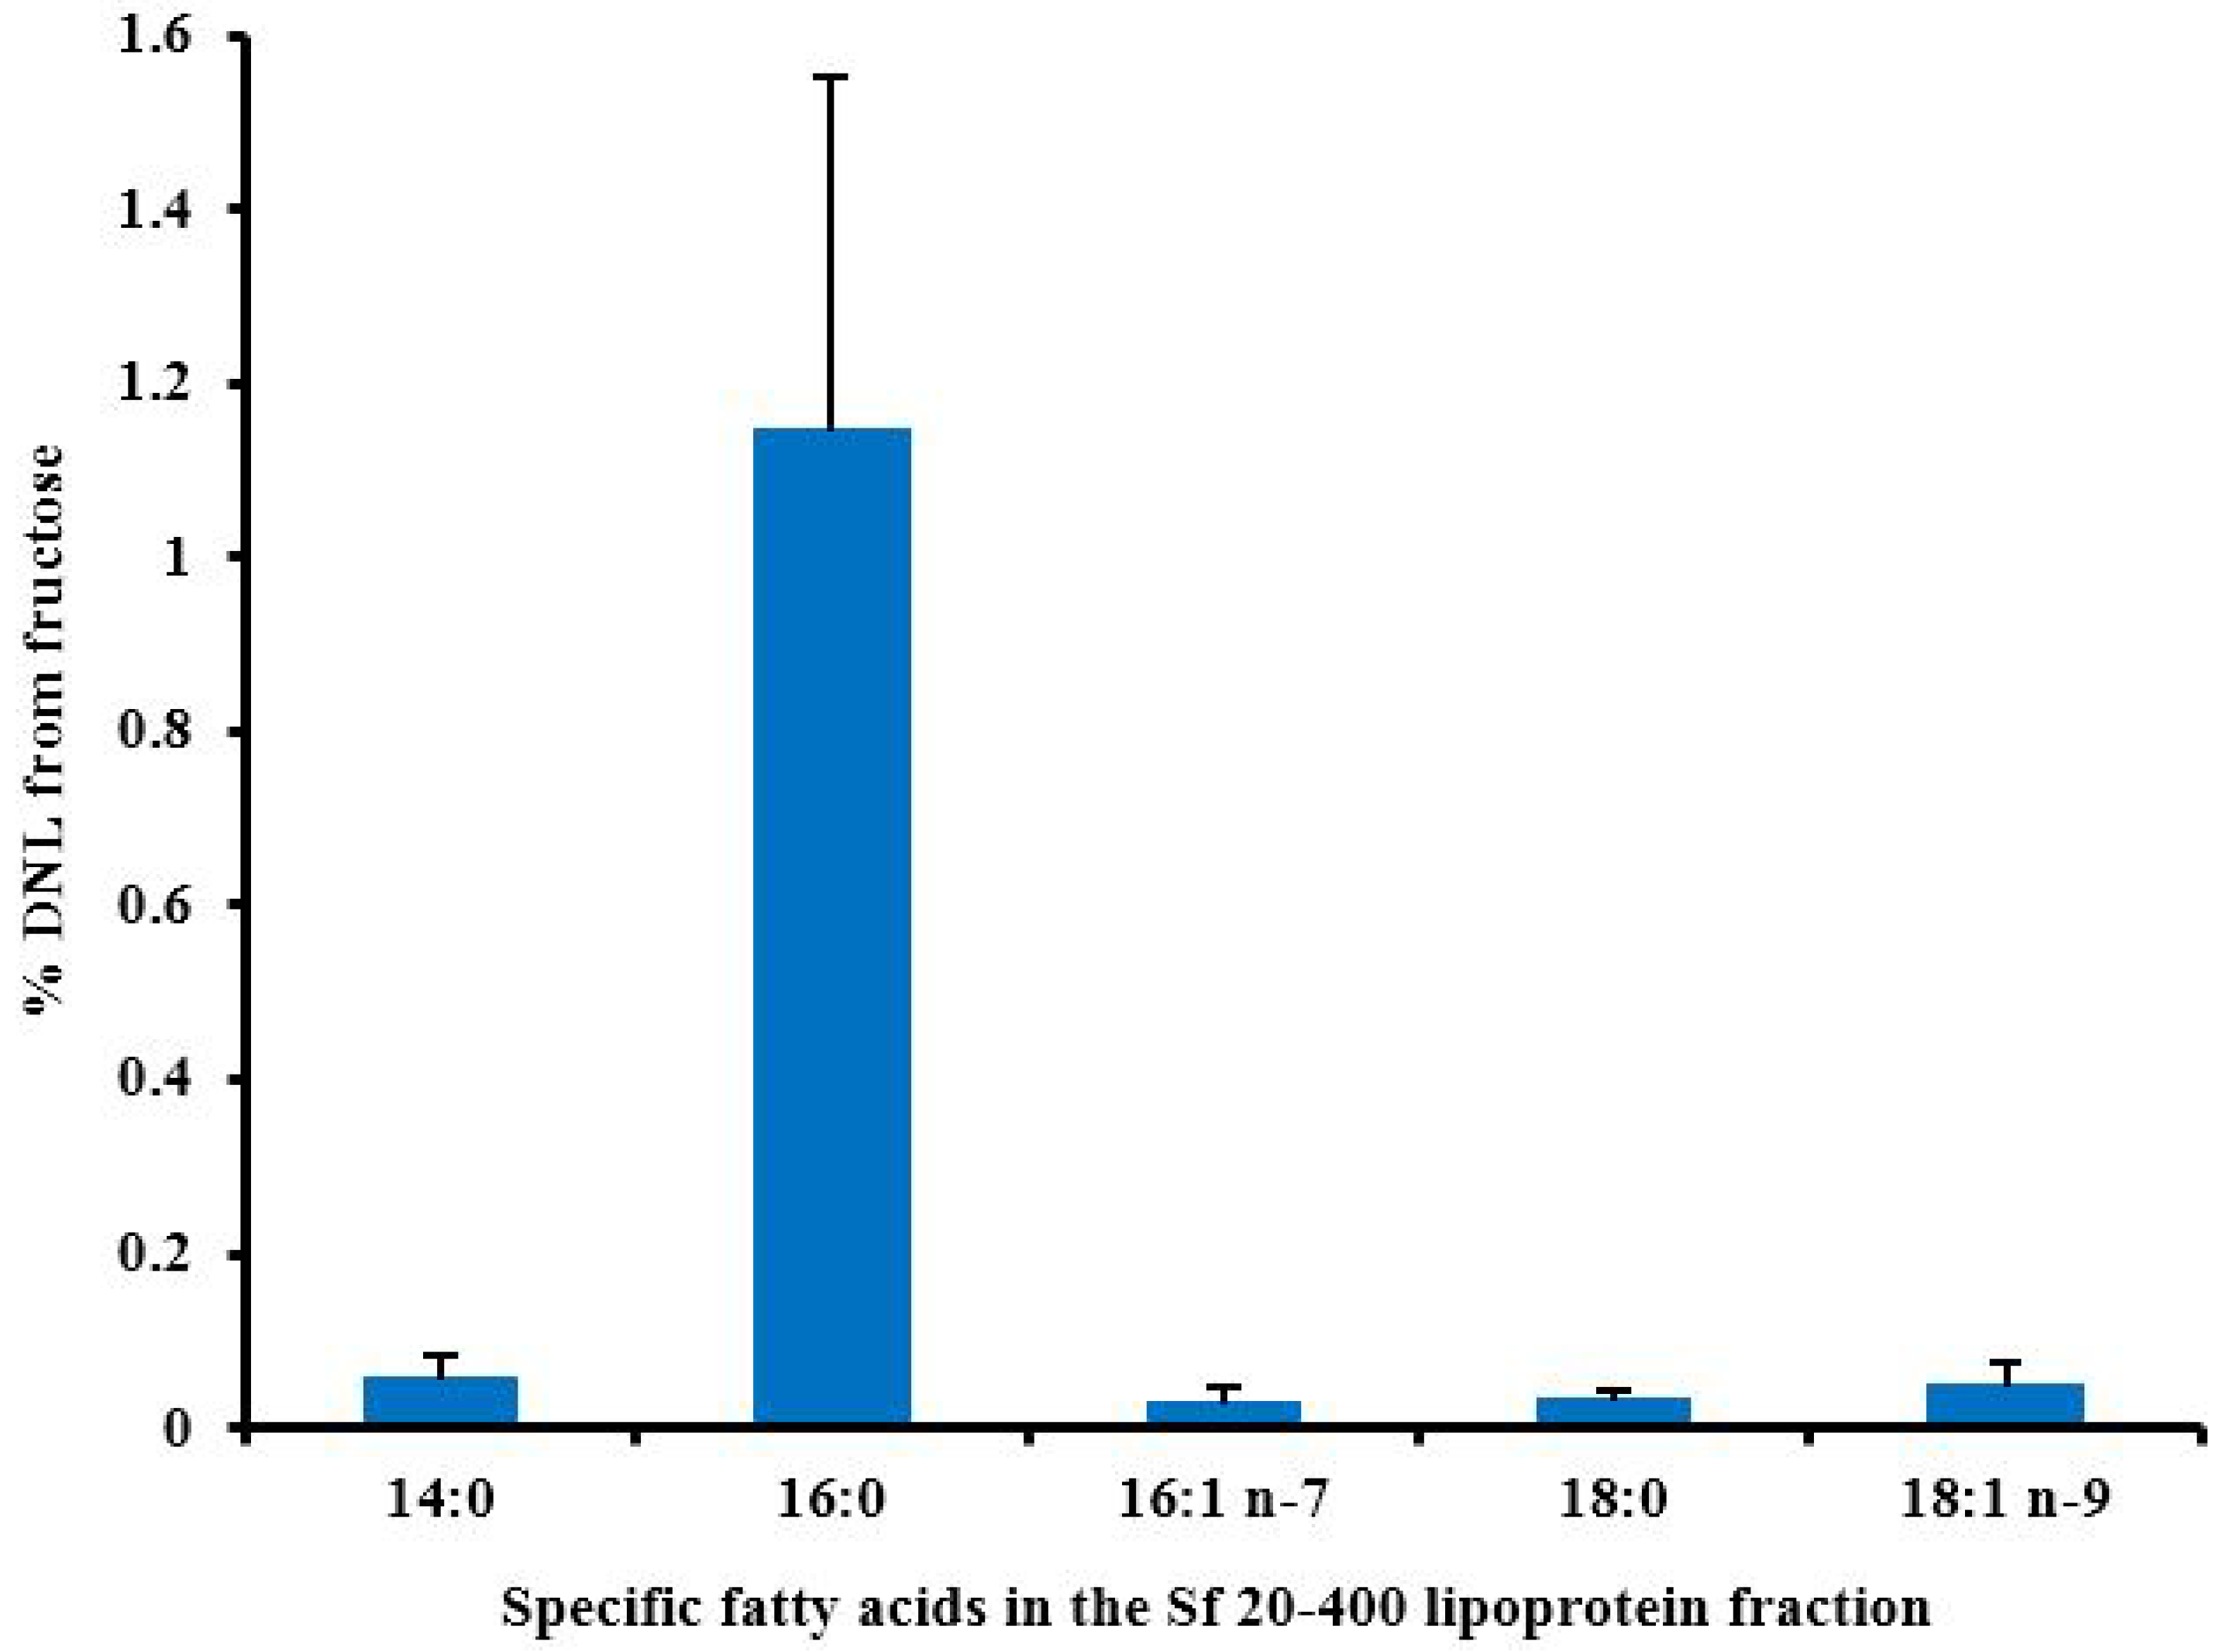
5.4. Fatty Acid Profile
6. The Contribution of DNL to Hepatic Lipid Accumulation
6.1. Metabolic Fate of Fructose

6.2. The Contribution of DNL to Liver Fat Accumulation
6.3. Hepatic DNL in Response to Fructose
7. Conclusions
Acknowledgments
Conflicts of Interest
References
- Loomba, R.; Sanyal, A.J. The global NAFLD epidemic. Nat. Rev. Gastroenterol. Hepatol. 2013, 10, 686–690. [Google Scholar] [CrossRef] [PubMed]
- Machado, M.; Marques-Vidal, P.; Cortez-Pinto, H. Hepatic histology in obese patients undergoing bariatric surgery. J. Hepatol. 2006, 45, 600–606. [Google Scholar] [CrossRef] [PubMed]
- Vernon, G.; Baranova, A.; Younossi, Z.M. Systematic review: The epidemiology and natural history of non-alcoholic fatty liver disease and non-alcoholic steatohepatitis in adults. Aliment. Pharmacol. Ther. 2011, 34, 274–285. [Google Scholar] [CrossRef] [PubMed]
- Moore, J.B. Non-alcoholic fatty liver disease: The hepatic consequence of obesity and the metabolic syndrome. Proc. Nutr. Soc. 2010, 69, 211–220. [Google Scholar] [CrossRef] [PubMed]
- Liu, C.J. Prevalence and risk factors for non-alcoholic fatty liver disease in Asian people who are not obese. J. Gastroenterol. Hepatol. 2012, 27, 1555–1560. [Google Scholar] [CrossRef] [PubMed]
- Guerrero, R.; Vega, G.L.; Grundy, S.M.; Browning, J.D. Ethnic differences in hepatic steatosis: An insulin resistance paradox? Hepatology 2009, 49, 791–801. [Google Scholar] [CrossRef] [PubMed]
- Nascimbeni, F.; Pais, R.; Bellentani, S.; Day, C.P.; Ratziu, V.; Loria, P.; Lonardo, A. From NAFLD in clinical practice to answers from guidelines. J. Hepatol. 2013, 59, 859–871. [Google Scholar] [CrossRef] [PubMed]
- Chalasani, N.; Younossi, Z.; Lavine, J.E.; Diehl, A.M.; Brunt, E.M.; Cusi, K.; Charlton, M.; Sanyal, A.J. The diagnosis and management of non-alcoholic fatty liver disease: Practice Guideline by the American Association for the Study of Liver Diseases, American College of Gastroenterology, and the American Gastroenterological Association. Hepatology 2012, 55, 2005–2023. [Google Scholar] [CrossRef] [PubMed]
- Neuschwander-Tetri, B.A. Carbohydrate intake and nonalcoholic fatty liver disease. Curr. Opin. Clin. Nutr. Metab. Care 2013, 16, 446–452. [Google Scholar] [CrossRef] [PubMed]
- Bray, G.A.; Popkin, B.M. Calorie-sweetened beverages and fructose: What have we learned 10 years later. Pediatr. Obes. 2013, 8, 242–248. [Google Scholar] [CrossRef] [PubMed]
- Vos, M.B.; Lavine, J.E. Dietary fructose in nonalcoholic fatty liver disease. Hepatology 2013, 57, 2525–2531. [Google Scholar] [CrossRef] [PubMed]
- Mancini, M.; Mattock, M.; Rabaya, E.; Chait, A.; Lewis, B. Studies of the mechanisms of carbohydrate-induced lipaemia in normal man. Atherosclerosis 1973, 17, 445–454. [Google Scholar] [CrossRef] [PubMed]
- Parks, E.J.; Skokan, L.E.; Timlin, M.T.; Dingfelder, C.S. Dietary sugars stimulate fatty acid synthesis in adults. J. Nutr. 2008, 138, 1039–1046. [Google Scholar] [PubMed]
- Stanhope, K.L.; Schwarz, J.M.; Keim, N.L.; Griffen, S.C.; Bremer, A.A.; Graham, J.L.; Hatcher, B.; Cox, C.L.; Dyachenko, A.; Zhang, W.; et al. Consuming fructose-sweetened, not glucose-sweetened, beverages increases visceral adiposity and lipids and decreases insulin sensitivity in overweight/obese humans. J. Clin. Investig. 2009, 119, 1322–1334. [Google Scholar] [CrossRef] [PubMed]
- Le, K.A.; Ith, M.; Kreis, R.; Faeh, D.; Bortolotti, M.; Tran, C.; Boesch, C.; Tappy, L. Fructose overconsumption causes dyslipidemia and ectopic lipid deposition in healthy subjects with and without a family history of type 2 diabetes. Am. J. Clin. Nutr. 2009, 89, 1760–1765. [Google Scholar] [CrossRef] [PubMed]
- Bergheim, I.; Weber, S.; Vos, M.; Kramer, S.; Volynets, V.; Kaserouni, S.; McClain, C.J.; Bischoff, S.C. Antibiotics protect against fructose-induced hepatic lipid accumulation in mice: Role of endotoxin. J. Hepatol. 2008, 48, 983–992. [Google Scholar] [CrossRef] [PubMed]
- Kawasaki, T.; Igarashi, K.; Koeda, T.; Sugimoto, K.; Nakagawa, K.; Hayashi, S.; Yamaji, R.; Inui, H.; Fukusato, T.; Yamanouchi, T. Rats fed fructose-enriched diets have characteristics of nonalcoholic hepatic steatosis. J. Nutr. 2009, 139, 2067–2071. [Google Scholar] [CrossRef] [PubMed]
- Tappy, L.; Le, K.A. Metabolic effects of fructose and the worldwide increase in obesity. Physiol. Rev. 2010, 90, 23–46. [Google Scholar] [CrossRef] [PubMed]
- Samuel, V.T. Fructose induced lipogenesis: From sugar to fat to insulin resistance. Trends Endocrinol. Metab. 2011, 22, 60–65. [Google Scholar] [CrossRef] [PubMed]
- Lanaspa, M.A.; Sanchez-Lozada, L.G.; Choi, Y.J.; Cicerchi, C.; Kanbay, M.; Roncal-Jimenez, C.A.; Ishimoto, T.; Li, N.; Marek, G.; Duranay, M.; et al. Uric acid induces hepatic steatosis by generation of mitochondrial oxidative stress: Potential role in fructose-dependent and -independent fatty liver. J. Biol. Chem. 2012, 287, 40732–40744. [Google Scholar] [CrossRef] [PubMed]
- Lanaspa, M.A.; Sanchez-Lozada, L.G.; Cicerchi, C.; Li, N.; Roncal-Jimenez, C.A.; Ishimoto, T.; Le, M.; Garcia, G.E.; Thomas, J.B.; Rivard, C.J.; et al. Uric acid stimulates fructokinase and accelerates fructose metabolism in the development of fatty liver. PLoS One 2012, 7, e47948. [Google Scholar] [CrossRef] [PubMed]
- Chiu, S.; Sievenpiper, J.L.; de Souza, R.J.; Cozma, A.I.; Mirrahimi, A.; Carleton, A.J.; Ha, V.; di Buono, M.; Jenkins, A.L.; Leiter, L.A.; et al. Effect of fructose on markers of non-alcoholic fatty liver disease (NAFLD): A systematic review and meta-analysis of controlled feeding trials. Eur. J. Clin. Nutr. 2014, 68, 416–423. [Google Scholar] [CrossRef] [PubMed]
- Chung, M.; Ma, J.; Patel, K.; Berger, S.; Lau, J.; Lichtenstein, A.H. Fructose, high-fructose corn syrup, sucrose, and nonalcoholic fatty liver disease or indexes of liver health: A systematic review and meta-analysis. Am. J. Clin. Nutr. 2014, 100, 833–849. [Google Scholar] [CrossRef] [PubMed]
- Laughlin, M.R.; Bantle, J.P.; Havel, P.J.; Parks, E.; Klurfeld, D.M.; Teff, K.; Maruvada, P. Clinical research strategies for fructose metabolism. Adv. Nutr. 2014, 5, 248–259. [Google Scholar] [CrossRef] [PubMed]
- White, J.S. Challenging the fructose hypothesis: New perspectives on fructose consumption and metabolism. Adv. Nutr. 2013, 4, 246–256. [Google Scholar] [CrossRef] [PubMed]
- Rippe, J.M.; Angelopoulos, T.J. Sucrose, high-fructose corn syrup, and fructose, their metabolism and potential health effects: What do we really know? Adv. Nutr. 2013, 4, 236–245. [Google Scholar] [CrossRef] [PubMed]
- Macdonald, I.A. Dietary strategies for the management of cardiovascular risk: Role of dietary carbohydrates. Proc. Nutr. Soc. 2014, 73, 167–171. [Google Scholar] [CrossRef] [PubMed]
- WHO. Guideline: Sugars Intake for Adults and Children: Draft Guidelines on Free Sugars Released for Public Consultation; WHO: Geneva, Switzerland, 2014. [Google Scholar]
- Scientific Advisory Committee on Nutrition. Draft Carbohydrates and Health Report; The Stationary Office: London, UK, 2014. [Google Scholar]
- Te Morenga, L.; Mallard, S.; Mann, J. Dietary sugars and body weight: Systematic review and meta-analyses of randomised controlled trials and cohort studies. BMJ 2013, 346, e7492. [Google Scholar] [CrossRef]
- Moynihan, P.J.; Kelly, S.A. Effect on caries of restricting sugars intake: Systematic review to inform WHO guidelines. J. Dent. Res. 2014, 93, 8–18. [Google Scholar] [CrossRef] [PubMed]
- US Department of Agriculture. Dietary Guidelines for Americans, 2010; US Government Printing Office: Washington, DC, USA, 2010.
- European Food Safety Authority. Scientific Opinion on Dietary Reference Values for carbohydrates and dietary fibre. EFSA J. 2010, 8, 1462. [Google Scholar]
- Van Buul, V.J.; Tappy, L.; Brouns, F.J. Misconceptions about fructose-containing sugars and their role in the obesity epidemic. Nutr. Res. Rev. 2014, 27, 119–130. [Google Scholar] [CrossRef] [PubMed]
- Marriott, B.P.; Cole, N.; Lee, E. National estimates of dietary fructose intake increased from 1977 to 2004 in the United States. J. Nutr. 2009, 139, 1228S–1235S. [Google Scholar] [CrossRef] [PubMed]
- Welsh, J.A.; Sharma, A.J.; Grellinger, L.; Vos, M.B. Consumption of added sugars is decreasing in the United States. Am. J. Clin. Nutr. 2011, 94, 726–734. [Google Scholar] [CrossRef] [PubMed]
- Bates, B.; Lennox, A.; Prentice, A.; Bates, C.J.; Swan, G. National Diet and Nutrition Survey: Headline Results from Years 1, 2 and 3 (combined) of the Rolling Programme 2008/09–2010/11; The Stationary Office: London, UK , 2012. [Google Scholar]
- Ahmadi-Abhari, S.; Luben, R.N.; Powell, N.; Bhaniani, A.; Chowdhury, R.; Wareham, N.J.; Forouhi, N.G.; Khaw, K.T. Dietary intake of carbohydrates and risk of type 2 diabetes: The European Prospective Investigation into Cancer-Norfolk study. Br. J. Nutr. 2014, 111, 342–352. [Google Scholar] [CrossRef] [PubMed]
- Zhang, Y.H.; An, T.; Zhang, R.C.; Zhou, Q.; Huang, Y.; Zhang, J. Very high fructose intake increases serum LDL-cholesterol and total cholesterol: A meta-analysis of controlled feeding trials. J. Nutr. 2013, 143, 1391–1398. [Google Scholar] [CrossRef] [PubMed]
- Kelishadi, R.; Mansourian, M.; Heidari-Beni, M. Association of fructose consumption and components of metabolic syndrome in human studies: A systematic review and meta-analysis. Nutrition 2014, 30, 503–510. [Google Scholar] [CrossRef] [PubMed]
- David Wang, D.; Sievenpiper, J.L.; de Souza, R.J.; Cozma, A.I.; Chiavaroli, L.; Ha, V.; Mirrahimi, A.; Carleton, A.J.; di Buono, M.; Jenkins, A.L.; et al. Effect of fructose on postprandial triglycerides: A systematic review and meta-analysis of controlled feeding trials. Atherosclerosis 2014, 232, 125–133. [Google Scholar] [CrossRef] [PubMed]
- Ha, V.; Sievenpiper, J.L.; de Souza, R.J.; Chiavaroli, L.; Wang, D.D.; Cozma, A.I.; Mirrahimi, A.; Yu, M.E.; Carleton, A.J.; Dibuono, M.; et al. Effect of fructose on blood pressure: A systematic review and meta-analysis of controlled feeding trials. Hypertension 2012, 59, 787–795. [Google Scholar] [CrossRef] [PubMed]
- Sievenpiper, J.L.; de Souza, R.J.; Mirrahimi, A.; Yu, M.E.; Carleton, A.J.; Beyene, J.; Chiavaroli, L.; di Buono, M.; Jenkins, A.L.; Leiter, L.A.; et al. Effect of fructose on body weight in controlled feeding trials: A systematic review and meta-analysis. Ann. Intern. Med. 2012, 156, 291–304. [Google Scholar] [CrossRef] [PubMed]
- Naismith, D.J. Differences in the metabolism of dietary carbohydrates studied in the rat. Proc. Nutr. Soc. 1971, 30, 259–265. [Google Scholar] [CrossRef] [PubMed]
- Bruckdorfer, K.R.; Khan, I.H.; Yudkin, J. Fatty acid synthetase activity in the liver and adipose tissue of rats fed with various carbohydrates. Biochem. J. 1972, 129, 439–446. [Google Scholar] [PubMed]
- Waddell, M.; Fallon, H.J. The effect of high-carbohydrate diets on liver triglyceride formation in the rat. J. Clin. Investig. 1973, 52, 2725–2731. [Google Scholar] [CrossRef] [PubMed]
- Topping, D.L.; Mayes, P.A. The immediate effects of insulin and fructose on the metabolism of the perfused liver. Changes in lipoprotein secretion, fatty acid oxidation and esterification, lipogenesis and carbohydrate metabolism. Biochem. J. 1972, 126, 295–311. [Google Scholar] [PubMed]
- Topping, D.L.; Mayes, P.A. Comparative effects of fructose and glucose on the lipid and carbohydrate metabolism of perfused rat liver. Br. J. Nutr. 1976, 36, 113–126. [Google Scholar] [CrossRef] [PubMed]
- Mayes, P.A. Intermediary metabolism of fructose. Am. J. Clin. Nutr. 1993, 58, 754S–765S. [Google Scholar] [PubMed]
- Noguchi, T.; Inoue, H.; Tanaka, T. Regulation of rat liver L-type pyruvate kinase mRNA by insulin and by fructose. Eur. J. Biochem. 1982, 128, 583–588. [Google Scholar] [CrossRef] [PubMed]
- Thompson, K.S.; Towle, H.C. Localization of the carbohydrate response element of the rat L-type pyruvate kinase gene. J. Biol. Chem. 1991, 266, 8679–8682. [Google Scholar] [PubMed]
- Wang, X.; Sato, R.; Brown, M.S.; Hua, X.; Goldstein, J.L. SREBP-1, a membrane-bound transcription factor released by sterol-regulated proteolysis. Cell 1994, 77, 53–62. [Google Scholar] [CrossRef] [PubMed]
- Yamashita, H.; Takenoshita, M.; Sakurai, M.; Bruick, R.K.; Henzel, W.J.; Shillinglaw, W.; Arnot, D.; Uyeda, K. A glucose-responsive transcription factor that regulates carbohydrate metabolism in the liver. Proc. Natl. Acad. Sci. USA 2001, 98, 9116–9121. [Google Scholar] [CrossRef] [PubMed]
- Shao, W.; Espenshade, P.J. Expanding roles for SREBP in metabolism. Cell Metab. 2012, 16, 414–419. [Google Scholar] [CrossRef] [PubMed]
- Postic, C.; Dentin, R.; Denechaud, P.D.; Girard, J. ChREBP, a transcriptional regulator of glucose and lipid metabolism. Annu. Rev. Nutr. 2007, 27, 179–192. [Google Scholar] [CrossRef] [PubMed]
- Poupeau, A.; Postic, C. Cross-regulation of hepatic glucose metabolism via ChREBP and nuclear receptors. Biochim. Biophys. Acta 2011, 1812, 995–1006. [Google Scholar] [CrossRef] [PubMed] [Green Version]
- Yoshikawa, T.; Shimano, H.; Yahagi, N.; Ide, T.; Amemiya-Kudo, M.; Matsuzaka, T.; Nakakuki, M.; Tomita, S.; Okazaki, H.; Tamura, Y.; et al. Polyunsaturated fatty acids suppress sterol regulatory element-binding protein 1c promoter activity by inhibition of liver X receptor (LXR) binding to LXR response elements. J. Biol. Chem. 2002, 277, 1705–1711. [Google Scholar] [CrossRef] [PubMed]
- Caron, S.; Huaman Samanez, C.; Dehondt, H.; Ploton, M.; Briand, O.; Lien, F.; Dorchies, E.; Dumont, J.; Postic, C.; Cariou, B.; et al. Farnesoid X receptor inhibits the transcriptional activity of carbohydrate response element binding protein in human hepatocytes. Mol. Cell. Biol. 2013, 33, 2202–2211. [Google Scholar] [CrossRef] [PubMed]
- Miyazaki, M.; Dobrzyn, A.; Man, W.C.; Chu, K.; Sampath, H.; Kim, H.J.; Ntambi, J.M. Stearoyl-CoA desaturase 1 gene expression is necessary for fructose-mediated induction of lipogenic gene expression by sterol regulatory element-binding protein-1c-dependent and -independent mechanisms. J. Biol. Chem. 2004, 279, 25164–25171. [Google Scholar] [CrossRef] [PubMed]
- Nagai, Y.; Yonemitsu, S.; Erion, D.M.; Iwasaki, T.; Stark, R.; Weismann, D.; Dong, J.; Zhang, D.; Jurczak, M.J.; Loffler, M.G.; et al. The role of peroxisome proliferator-activated receptor gamma coactivator-1 beta in the pathogenesis of fructose-induced insulin resistance. Cell Metab. 2009, 9, 252–264. [Google Scholar] [CrossRef] [PubMed]
- Iizuka, K.; Bruick, R.K.; Liang, G.; Horton, J.D.; Uyeda, K. Deficiency of carbohydrate response element-binding protein (ChREBP) reduces lipogenesis as well as glycolysis. Proc. Natl. Acad. Sci. USA 2004, 101, 7281–7286. [Google Scholar] [CrossRef] [PubMed]
- Erion, D.M.; Popov, V.; Hsiao, J.J.; Vatner, D.; Mitchell, K.; Yonemitsu, S.; Nagai, Y.; Kahn, M.; Gillum, M.P.; Dong, J.; et al. The role of the carbohydrate response element-binding protein in male fructose-fed rats. Endocrinology 2013, 154, 36–44. [Google Scholar] [PubMed]
- Benhamed, F.; Denechaud, P.D.; Lemoine, M.; Robichon, C.; Moldes, M.; Bertrand-Michel, J.; Ratziu, V.; Serfaty, L.; Housset, C.; Capeau, J.; et al. The lipogenic transcription factor ChREBP dissociates hepatic steatosis from insulin resistance in mice and humans. J. Clin. Investig. 2012, 122, 2176–2194. [Google Scholar] [CrossRef] [PubMed]
- Kohjima, M.; Enjoji, M.; Higuchi, N.; Kato, M.; Kotoh, K.; Yoshimoto, T.; Fujino, T.; Yada, M.; Yada, R.; Harada, N.; et al. Re-evaluation of fatty acid metabolism-related gene expression in nonalcoholic fatty liver disease. Int. J. Mol. Med. 2007, 20, 351–358. [Google Scholar] [PubMed]
- Higuchi, N.; Kato, M.; Shundo, Y.; Tajiri, H.; Tanaka, M.; Yamashita, N.; Kohjima, M.; Kotoh, K.; Nakamuta, M.; Takayanagi, R.; et al. Liver X receptor in cooperation with SREBP-1c is a major lipid synthesis regulator in nonalcoholic fatty liver disease. Hepatol. Res. 2008, 38, 1122–1129. [Google Scholar] [CrossRef] [PubMed]
- Ahn, S.B.; Jang, K.; Jun, D.W.; Lee, B.H.; Shin, K.J. Expression of Liver X Receptor Correlates with Intrahepatic Inflammation and Fibrosis in Patients with Nonalcoholic Fatty Liver Disease. Dig. Dis. Sci. 2014, 59, 2975–2982. [Google Scholar] [CrossRef] [PubMed]
- Lee, A.H.; Scapa, E.F.; Cohen, D.E.; Glimcher, L.H. Regulation of hepatic lipogenesis by the transcription factor XBP1. Science 2008, 320, 1492–1496. [Google Scholar] [PubMed]
- Plant, N.J. An introduction to systems toxicology. Toxicol. Res. 2014, in press. [Google Scholar]
- Fisher, C.P.; Kierzek, A.M.; Plant, N.J.; Moore, J.B. Systems biology approaches for studying the pathogenesis of non-alcoholic fatty liver disease. World J. Gastroenterol. 2014, 20, 15070–15078. [Google Scholar] [CrossRef] [PubMed]
- Gustafsson, D.; Unwin, R. The pathophysiology of hyperuricaemia and its possible relationship to cardiovascular disease, morbidity and mortality. BMC Nephrol. 2013, 14, 164. [Google Scholar] [CrossRef] [PubMed]
- Perheentupa, J.; Raivio, K. Fructose-induced hyperuricaemia. Lancet 1967, 2, 528–531. [Google Scholar] [CrossRef] [PubMed]
- Simkin, P.A. Hexose infusions in Cebus monkeys: Effects on uric acid metabolism. Metabolism 1972, 21, 1029–1036. [Google Scholar] [CrossRef] [PubMed]
- Narins, R.G.; Weisberg, J.S.; Myers, A.R. Effects of carbohydrates on uric acid metabolism. Metabolism 1974, 23, 455–465. [Google Scholar] [CrossRef] [PubMed]
- Gao, X.; Qi, L.; Qiao, N.; Choi, H.K.; Curhan, G.; Tucker, K.L.; Ascherio, A. Intake of added sugar and sugar-sweetened drink and serum uric acid concentration in US men and women. Hypertension 2007, 50, 306–312. [Google Scholar] [CrossRef] [PubMed]
- Zgaga, L.; Theodoratou, E.; Kyle, J.; Farrington, S.M.; Agakov, F.; Tenesa, A.; Walker, M.; McNeill, G.; Wright, A.F.; Rudan, I.; et al. The association of dietary intake of purine-rich vegetables, sugar-sweetened beverages and dairy with plasma urate, in a cross-sectional study. PLoS One 2012, 7, e38123. [Google Scholar] [CrossRef] [PubMed] [Green Version]
- Wang, D.D.; Sievenpiper, J.L.; de Souza, R.J.; Chiavaroli, L.; Ha, V.; Cozma, A.I.; Mirrahimi, A.; Yu, M.E.; Carleton, A.J.; Di Buono, M.; et al. The effects of fructose intake on serum uric acid vary among controlled dietary trials. J. Nutr. 2012, 142, 916–923. [Google Scholar] [CrossRef] [PubMed]
- Lonardo, A.; Loria, P.; Leonardi, F.; Borsatti, A.; Neri, P.; Pulvirenti, M.; Verrone, A.M.; Bagni, A.; Bertolotti, M.; Ganazzi, D.; et al. Fasting insulin and uric acid levels but not indices of iron metabolism are independent predictors of non-alcoholic fatty liver disease. A case-control study. Dig. Liver Dis. 2002, 34, 204–211. [Google Scholar] [CrossRef] [PubMed]
- Sartorio, A.; Del Col, A.; Agosti, F.; Mazzilli, G.; Bellentani, S.; Tiribelli, C.; Bedogni, G. Predictors of non-alcoholic fatty liver disease in obese children. Eur. J. Clin. Nutr. 2007, 61, 877–883. [Google Scholar] [CrossRef] [PubMed]
- Li, Y.; Xu, C.; Yu, C.; Xu, L.; Miao, M. Association of serum uric acid level with non-alcoholic fatty liver disease: A cross-sectional study. J. Hepatol. 2009, 50, 1029–1034. [Google Scholar] [CrossRef] [PubMed]
- Sertoglu, E.; Ercin, C.N.; Celebi, G.; Gurel, H.; Kayadibi, H.; Genc, H.; Kara, M.; Dogru, T. The relationship of serum uric acid with non-alcoholic fatty liver disease. Clin. Biochem. 2014, 47, 383–388. [Google Scholar] [CrossRef] [PubMed]
- Xie, Y.; Wang, M.; Zhang, Y.; Zhang, S.; Tan, A.; Gao, Y.; Liang, Z.; Shi, D.; Huang, Z.; Zhang, H.; et al. Serum uric acid and non-alcoholic fatty liver disease in non-diabetic Chinese men. PLoS One 2013, 8, e67152. [Google Scholar] [CrossRef] [PubMed]
- Sirota, J.C.; McFann, K.; Targher, G.; Johnson, R.J.; Chonchol, M.; Jalal, D.I. Elevated serum uric acid levels are associated with non-alcoholic fatty liver disease independently of metabolic syndrome features in the United States: Liver ultrasound data from the National Health and Nutrition Examination Survey. Metabolism 2013, 62, 392–399. [Google Scholar] [CrossRef] [PubMed]
- Xu, C.; Yu, C.; Xu, L.; Miao, M.; Li, Y. High serum uric acid increases the risk for nonalcoholic Fatty liver disease: A prospective observational study. PLoS One 2010, 5, e11578. [Google Scholar] [CrossRef] [PubMed]
- Abdelmalek, M.F.; Suzuki, A.; Guy, C.; Unalp-Arida, A.; Colvin, R.; Johnson, R.J.; Diehl, A.M. Increased fructose consumption is associated with fibrosis severity in patients with nonalcoholic fatty liver disease. Hepatology 2010, 51, 1961–1971. [Google Scholar] [CrossRef] [PubMed]
- Vos, M.B.; Colvin, R.; Belt, P.; Molleston, J.P.; Murray, K.F.; Rosenthal, P.; Schwimmer, J.B.; Tonascia, J.; Unalp, A.; Lavine, J.E. Correlation of vitamin E, uric acid, and diet composition with histologic features of pediatric NAFLD. J. Pediatr. Gastroenterol. Nutr. 2012, 54, 90–96. [Google Scholar] [CrossRef] [PubMed]
- Johnston, R.D.; Stephenson, M.C.; Crossland, H.; Cordon, S.M.; Palcidi, E.; Cox, E.F.; Taylor, M.A.; Aithal, G.P.; Macdonald, I.A. No difference between high-fructose and high-glucose diets on liver triacylglycerol or biochemistry in healthy overweight men. Gastroenterology 2013, 145, 1016–1025. [Google Scholar] [CrossRef] [PubMed]
- Lanaspa, M.A.; Ishimoto, T.; Li, N.; Cicerchi, C.; Orlicky, D.J.; Ruzycki, P.; Rivard, C.; Inaba, S.; Roncal-Jimenez, C.A.; Bales, E.S.; et al. Endogenous fructose production and metabolism in the liver contributes to the development of metabolic syndrome. Nat. Commun. 2013, 4, 2434. [Google Scholar] [PubMed]
- Ishimoto, T.; Lanaspa, M.A.; Le, M.T.; Garcia, G.E.; Diggle, C.P.; Maclean, P.S.; Jackman, M.R.; Asipu, A.; Roncal-Jimenez, C.A.; Kosugi, T.; et al. Opposing effects of fructokinase C and A isoforms on fructose-induced metabolic syndrome in mice. Proc. Natl. Acad. Sci. USA 2012, 109, 4320–4325. [Google Scholar] [CrossRef] [PubMed]
- Assy, N.; Nasser, G.; Kamayse, I.; Nseir, W.; Beniashvili, Z.; Djibre, A.; Grosovski, M. Soft drink consumption linked with fatty liver in the absence of traditional risk factors. Can. J. Gastroenterol. 2008, 22, 811–816. [Google Scholar] [PubMed]
- Abid, A.; Taha, O.; Nseir, W.; Farah, R.; Grosovski, M.; Assy, N. Soft drink consumption is associated with fatty liver disease independent of metabolic syndrome. J. Hepatol. 2009, 51, 918–924. [Google Scholar] [CrossRef] [PubMed]
- Ouyang, X.; Cirillo, P.; Sautin, Y.; McCall, S.; Bruchette, J.L.; Diehl, A.M.; Johnson, R.J.; Abdelmalek, M.F. Fructose consumption as a risk factor for non-alcoholic fatty liver disease. J. Hepatol. 2008, 48, 993–999. [Google Scholar] [CrossRef] [PubMed]
- Zelber-Sagi, S.; Nitzan-Kaluski, D.; Goldsmith, R.; Webb, M.; Blendis, L.; Halpern, Z.; Oren, R. Long term nutritional intake and the risk for non-alcoholic fatty liver disease (NAFLD): A population based study. J. Hepatol. 2007, 47, 711–717. [Google Scholar] [CrossRef] [PubMed]
- Thuy, S.; Ladurner, R.; Volynets, V.; Wagner, S.; Strahl, S.; Konigsrainer, A.; Maier, K.P.; Bischoff, S.C.; Bergheim, I. Nonalcoholic fatty liver disease in humans is associated with increased plasma endotoxin and plasminogen activator inhibitor 1 concentrations and with fructose intake. J. Nutr. 2008, 138, 1452–1455. [Google Scholar] [PubMed]
- Kanerva, N.; Sandboge, S.; Kaartinen, N.E.; Mannisto, S.; Eriksson, J.G. Higher fructose intake is inversely associated with risk of nonalcoholic fatty liver disease in older Finnish adults. Am. J. Clin. Nutr. 2014, 100, 1133–1138. [Google Scholar] [CrossRef] [PubMed]
- Mann, C.J. Observational research methods. Research design II: Cohort, cross sectional, and case-control studies. Emerg. Med. J. 2003, 20, 54–60. [Google Scholar] [CrossRef] [PubMed]
- Ngo Sock, E.T.; Le, K.A.; Ith, M.; Kreis, R.; Boesch, C.; Tappy, L. Effects of a short-term overfeeding with fructose or glucose in healthy young males. Br. J. Nutr. 2010, 103, 939–943. [Google Scholar] [CrossRef] [PubMed]
- Theytaz, F.; Noguchi, Y.; Egli, L.; Campos, V.; Buehler, T.; Hodson, L.; Patterson, B.W.; Nishikata, N.; Kreis, R.; Mittendorfer, B.; et al. Effects of supplementation with essential amino acids on intrahepatic lipid concentrations during fructose overfeeding in humans. Am. J. Clin. Nutr. 2012, 96, 1008–1016. [Google Scholar] [CrossRef] [PubMed]
- Sobrecases, H.; Le, K.A.; Bortolotti, M.; Schneiter, P.; Ith, M.; Kreis, R.; Boesch, C.; Tappy, L. Effects of short-term overfeeding with fructose, fat and fructose plus fat on plasma and hepatic lipids in healthy men. Diabetes Metab. 2010, 36, 244–246. [Google Scholar] [CrossRef] [PubMed]
- Lecoultre, V.; Egli, L.; Carrel, G.; Theytaz, F.; Kreis, R.; Schneiter, P.; Boss, A.; Zwygart, K.; Le, K.A.; Bortolotti, M.; et al. Effects of fructose and glucose overfeeding on hepatic insulin sensitivity and intrahepatic lipids in healthy humans. Obesity 2013, 21, 782–785. [Google Scholar] [CrossRef] [PubMed]
- Scientific Advisory Committee on Nutrition. Dietary Reference Values for Energy; The Stationary Office: London, UK, 2012. [Google Scholar]
- Le, K.A.; Faeh, D.; Stettler, R.; Ith, M.; Kreis, R.; Vermathen, P.; Boesch, C.; Ravussin, E.; Tappy, L. A 4-wk high-fructose diet alters lipid metabolism without affecting insulin sensitivity or ectopic lipids in healthy humans. Am. J. Clin. Nutr. 2006, 84, 1374–1379. [Google Scholar] [PubMed]
- Silbernagel, G.; Machann, J.; Unmuth, S.; Schick, F.; Stefan, N.; Haring, H.U.; Fritsche, A. Effects of 4-week very-high-fructose/glucose diets on insulin sensitivity, visceral fat and intrahepatic lipids: An exploratory trial. Br. J. Nutr. 2011, 106, 79–86. [Google Scholar] [CrossRef] [PubMed]
- Maersk, M.; Belza, A.; Stodkilde-Jorgensen, H.; Ringgaard, S.; Chabanova, E.; Thomsen, H.; Pedersen, S.B.; Astrup, A.; Richelsen, B. Sucrose-sweetened beverages increase fat storage in the liver, muscle, and visceral fat depot: A 6-mo randomized intervention study. Am. J. Clin. Nutr. 2012, 95, 283–289. [Google Scholar] [CrossRef] [PubMed]
- Bravo, S.; Lowndes, J.; Sinnett, S.; Yu, Z.; Rippe, J. Consumption of sucrose and high-fructose corn syrup does not increase liver fat or ectopic fat deposition in muscles. Appl. Physiol. Nutr. Metab. 2013, 38, 681–688. [Google Scholar] [CrossRef] [PubMed]
- Volynets, V.; Machann, J.; Kuper, M.A.; Maier, I.B.; Spruss, A.; Konigsrainer, A.; Bischoff, S.C.; Bergheim, I. A moderate weight reduction through dietary intervention decreases hepatic fat content in patients with non-alcoholic fatty liver disease (NAFLD): A pilot study. Eur. J. Nutr. 2013, 52, 527–535. [Google Scholar] [CrossRef] [PubMed]
- Jin, R.; Welsh, J.A.; Le, N.A.; Holzberg, J.; Sharma, P.; Martin, D.R.; Vos, M.B. Dietary fructose reduction improves markers of cardiovascular disease risk in Hispanic-American adolescents with NAFLD. Nutrients 2014, 6, 3187–3201. [Google Scholar] [CrossRef] [PubMed]
- Koopman, K.E.; Caan, M.W.; Nederveen, A.J.; Pels, A.; Ackermans, M.T.; Fliers, E.; la Fleur, S.E.; Serlie, M.J. Hypercaloric diets with increased meal frequency, but not meal size, increase intrahepatic triglycerides: A randomized controlled trial. Hepatology 2014, 60, 545–553. [Google Scholar] [CrossRef] [PubMed]
- Green, C.; Hodson, L. The influence of dietary fat on liver fat accumulation. Nutrients 2014, 6, 5018–5033. [Google Scholar] [CrossRef] [PubMed]
- Heath, R.B.; Karpe, F.; Milne, R.W.; Burdge, G.C.; Wootton, S.A.; Frayn, K.N. Selective partitioning of dietary fatty acids into the VLDL TG pool in the early postprandial period. J. Lipid Res. 2003, 44, 2065–2072. [Google Scholar] [CrossRef] [PubMed]
- Chong, M.F.; Fielding, B.A.; Frayn, K.N. Mechanisms for the acute effect of fructose on postprandial lipemia. Am. J. Clin. Nutr. 2007, 85, 1511–1520. [Google Scholar] [PubMed]
- Donnelly, K.L.; Smith, C.I.; Schwarzenberg, S.J.; Jessurun, J.; Boldt, M.D.; Parks, E.J. Sources of fatty acids stored in liver and secreted via lipoproteins in patients with nonalcoholic fatty liver disease. J. Clin. Investig. 2005, 115, 1343–1351. [Google Scholar] [CrossRef] [PubMed]
- Lambert, J.E.; Ryan, E.A.; Thomson, A.B.; Clandinin, M.T. De novo lipogenesis and cholesterol synthesis in humans with long-standing type 1 diabetes are comparable to non-diabetic individuals. PLoS One 2013, 8, e82530. [Google Scholar] [CrossRef] [PubMed]
- Hellerstein, M.K.; Christiansen, M.; Kaempfer, S.; Kletke, C.; Wu, K.; Reid, J.S.; Mulligan, K.; Hellerstein, N.S.; Shackleton, C.H. Measurement of de novo hepatic lipogenesis in humans using stable isotopes. J. Clin. Investig. 1991, 87, 1841–1852. [Google Scholar] [CrossRef] [PubMed]
- Wilke, M.S.; French, M.A.; Goh, Y.K.; Ryan, E.A.; Jones, P.J.; Clandinin, M.T. Synthesis of specific fatty acids contributes to VLDL-triacylglycerol composition in humans with and without type 2 diabetes. Diabetologia 2009, 52, 1628–1637. [Google Scholar] [CrossRef] [PubMed]
- Hudgins, L.C.; Hellerstein, M.; Seidman, C.; Neese, R.; Diakun, J.; Hirsch, J. Human fatty acid synthesis is stimulated by a eucaloric low fat, high carbohydrate diet. J. Clin. Investig. 1996, 97, 2081–2091. [Google Scholar] [CrossRef] [PubMed]
- Peter, A.; Cegan, A.; Wagner, S.; Elcnerova, M.; Konigsrainer, A.; Konigsrainer, I.; Haring, H.U.; Schleicher, E.D.; Stefan, N. Relationships between hepatic stearoyl-CoA desaturase-1 activity and mRNA expression with liver fat content in humans. Am. J. Physiol. Endocrinol. Metab. 2011, 300, E321–E326. [Google Scholar] [CrossRef] [PubMed]
- Kotronen, A.; Seppanen-Laakso, T.; Westerbacka, J.; Kiviluoto, T.; Arola, J.; Ruskeepaa, A.L.; Oresic, M.; Yki-Jarvinen, H. Hepatic stearoyl-CoA desaturase (SCD)-1 activity and diacylglycerol but not ceramide concentrations are increased in the nonalcoholic human fatty liver. Diabetes 2009, 58, 203–208. [Google Scholar] [CrossRef] [PubMed]
- McNamara, R.K.; Magrisso, I.J.; Hofacer, R.; Jandacek, R.; Rider, T.; Tso, P.; Benoit, S.C. Omega-3 fatty acid deficiency augments risperidone-induced hepatic steatosis in rats: Positive association with stearoyl-CoA desaturase. Pharmacol. Res. 2012, 66, 283–291. [Google Scholar] [CrossRef] [PubMed]
- Jain, M.; Ngoy, S.; Sheth, S.A.; Swanson, R.A.; Rhee, E.P.; Liao, R.; Clish, C.B.; Mootha, V.K.; Nilsson, R. A systematic survey of lipids across mouse tissues. Am. J. Physiol. Endocrinol. Metab. 2014, 306, E854–E868. [Google Scholar] [CrossRef] [PubMed]
- Musso, G.; Gambino, R.; Cassader, M. Cholesterol metabolism and the pathogenesis of non-alcoholic steatohepatitis. Prog. Lipid Res. 2013, 52, 175–191. [Google Scholar] [CrossRef] [PubMed]
- Debosch, B.J.; Chen, Z.; Saben, J.L.; Finck, B.N.; Moley, K.H. Glucose transporter 8 (GLUT8) mediates fructose-induced de novo lipogenesis and macrosteatosis. J. Biol. Chem. 2014, 289, 10989–10998. [Google Scholar] [CrossRef] [PubMed]
- Sun, S.Z.; Empie, M.W. Fructose metabolism in humans—What isotopic tracer studies tell us. Nutr. Metab. 2012, 9, 89. [Google Scholar] [CrossRef]
- Lambert, J.E.; Ramos-Roman, M.A.; Browning, J.D.; Parks, E.J. Increased de novo lipogenesis is a distinct characteristic of individuals with nonalcoholic fatty liver disease. Gastroenterology 2014, 146, 726–735. [Google Scholar] [CrossRef] [PubMed]
- Diraison, F.; Moulin, P.; Beylot, M. Contribution of hepatic de novo lipogenesis and reesterification of plasma non esterified fatty acids to plasma triglyceride synthesis during non-alcoholic fatty liver disease. Diabetes Metab. 2003, 29, 478–485. [Google Scholar] [CrossRef] [PubMed]
- Faeh, D.; Minehira, K.; Schwarz, J.M.; Periasamy, R.; Park, S.; Tappy, L. Effect of fructose overfeeding and fish oil administration on hepatic de novo lipogenesis and insulin sensitivity in healthy men. Diabetes 2005, 54, 1907–1913. [Google Scholar] [CrossRef] [PubMed]
- Fielding, B.A.; Umpleby, A.M. Stable isotopes in Nutrition Research. In Nutrition Research Methodologies; Lovegrove, J.A., Hodson, L., Sharma, S., Lanham-New, S.A., Eds.; Wiley Blackwell: Oxford, UK, 2015; in press. [Google Scholar]
© 2014 by the authors; licensee MDPI, Basel, Switzerland. This article is an open access article distributed under the terms and conditions of the Creative Commons Attribution license (http://creativecommons.org/licenses/by/4.0/).
Share and Cite
Moore, J.B.; Gunn, P.J.; Fielding, B.A. The Role of Dietary Sugars and De novo Lipogenesis in Non-Alcoholic Fatty Liver Disease. Nutrients 2014, 6, 5679-5703. https://doi.org/10.3390/nu6125679
Moore JB, Gunn PJ, Fielding BA. The Role of Dietary Sugars and De novo Lipogenesis in Non-Alcoholic Fatty Liver Disease. Nutrients. 2014; 6(12):5679-5703. https://doi.org/10.3390/nu6125679
Chicago/Turabian StyleMoore, J. Bernadette, Pippa J. Gunn, and Barbara A. Fielding. 2014. "The Role of Dietary Sugars and De novo Lipogenesis in Non-Alcoholic Fatty Liver Disease" Nutrients 6, no. 12: 5679-5703. https://doi.org/10.3390/nu6125679