Alcohol Consumption and Risk of Glioma: A Meta-Analysis of 19 Observational Studies


Abstract
:1. Introduction
2. Material and Methods
2.1. Search Strategy
2.2. Inclusion Criteria
2.3. Data Extraction and Assessment of Methodological Quality
2.4. Statistical Analysis
3. Results
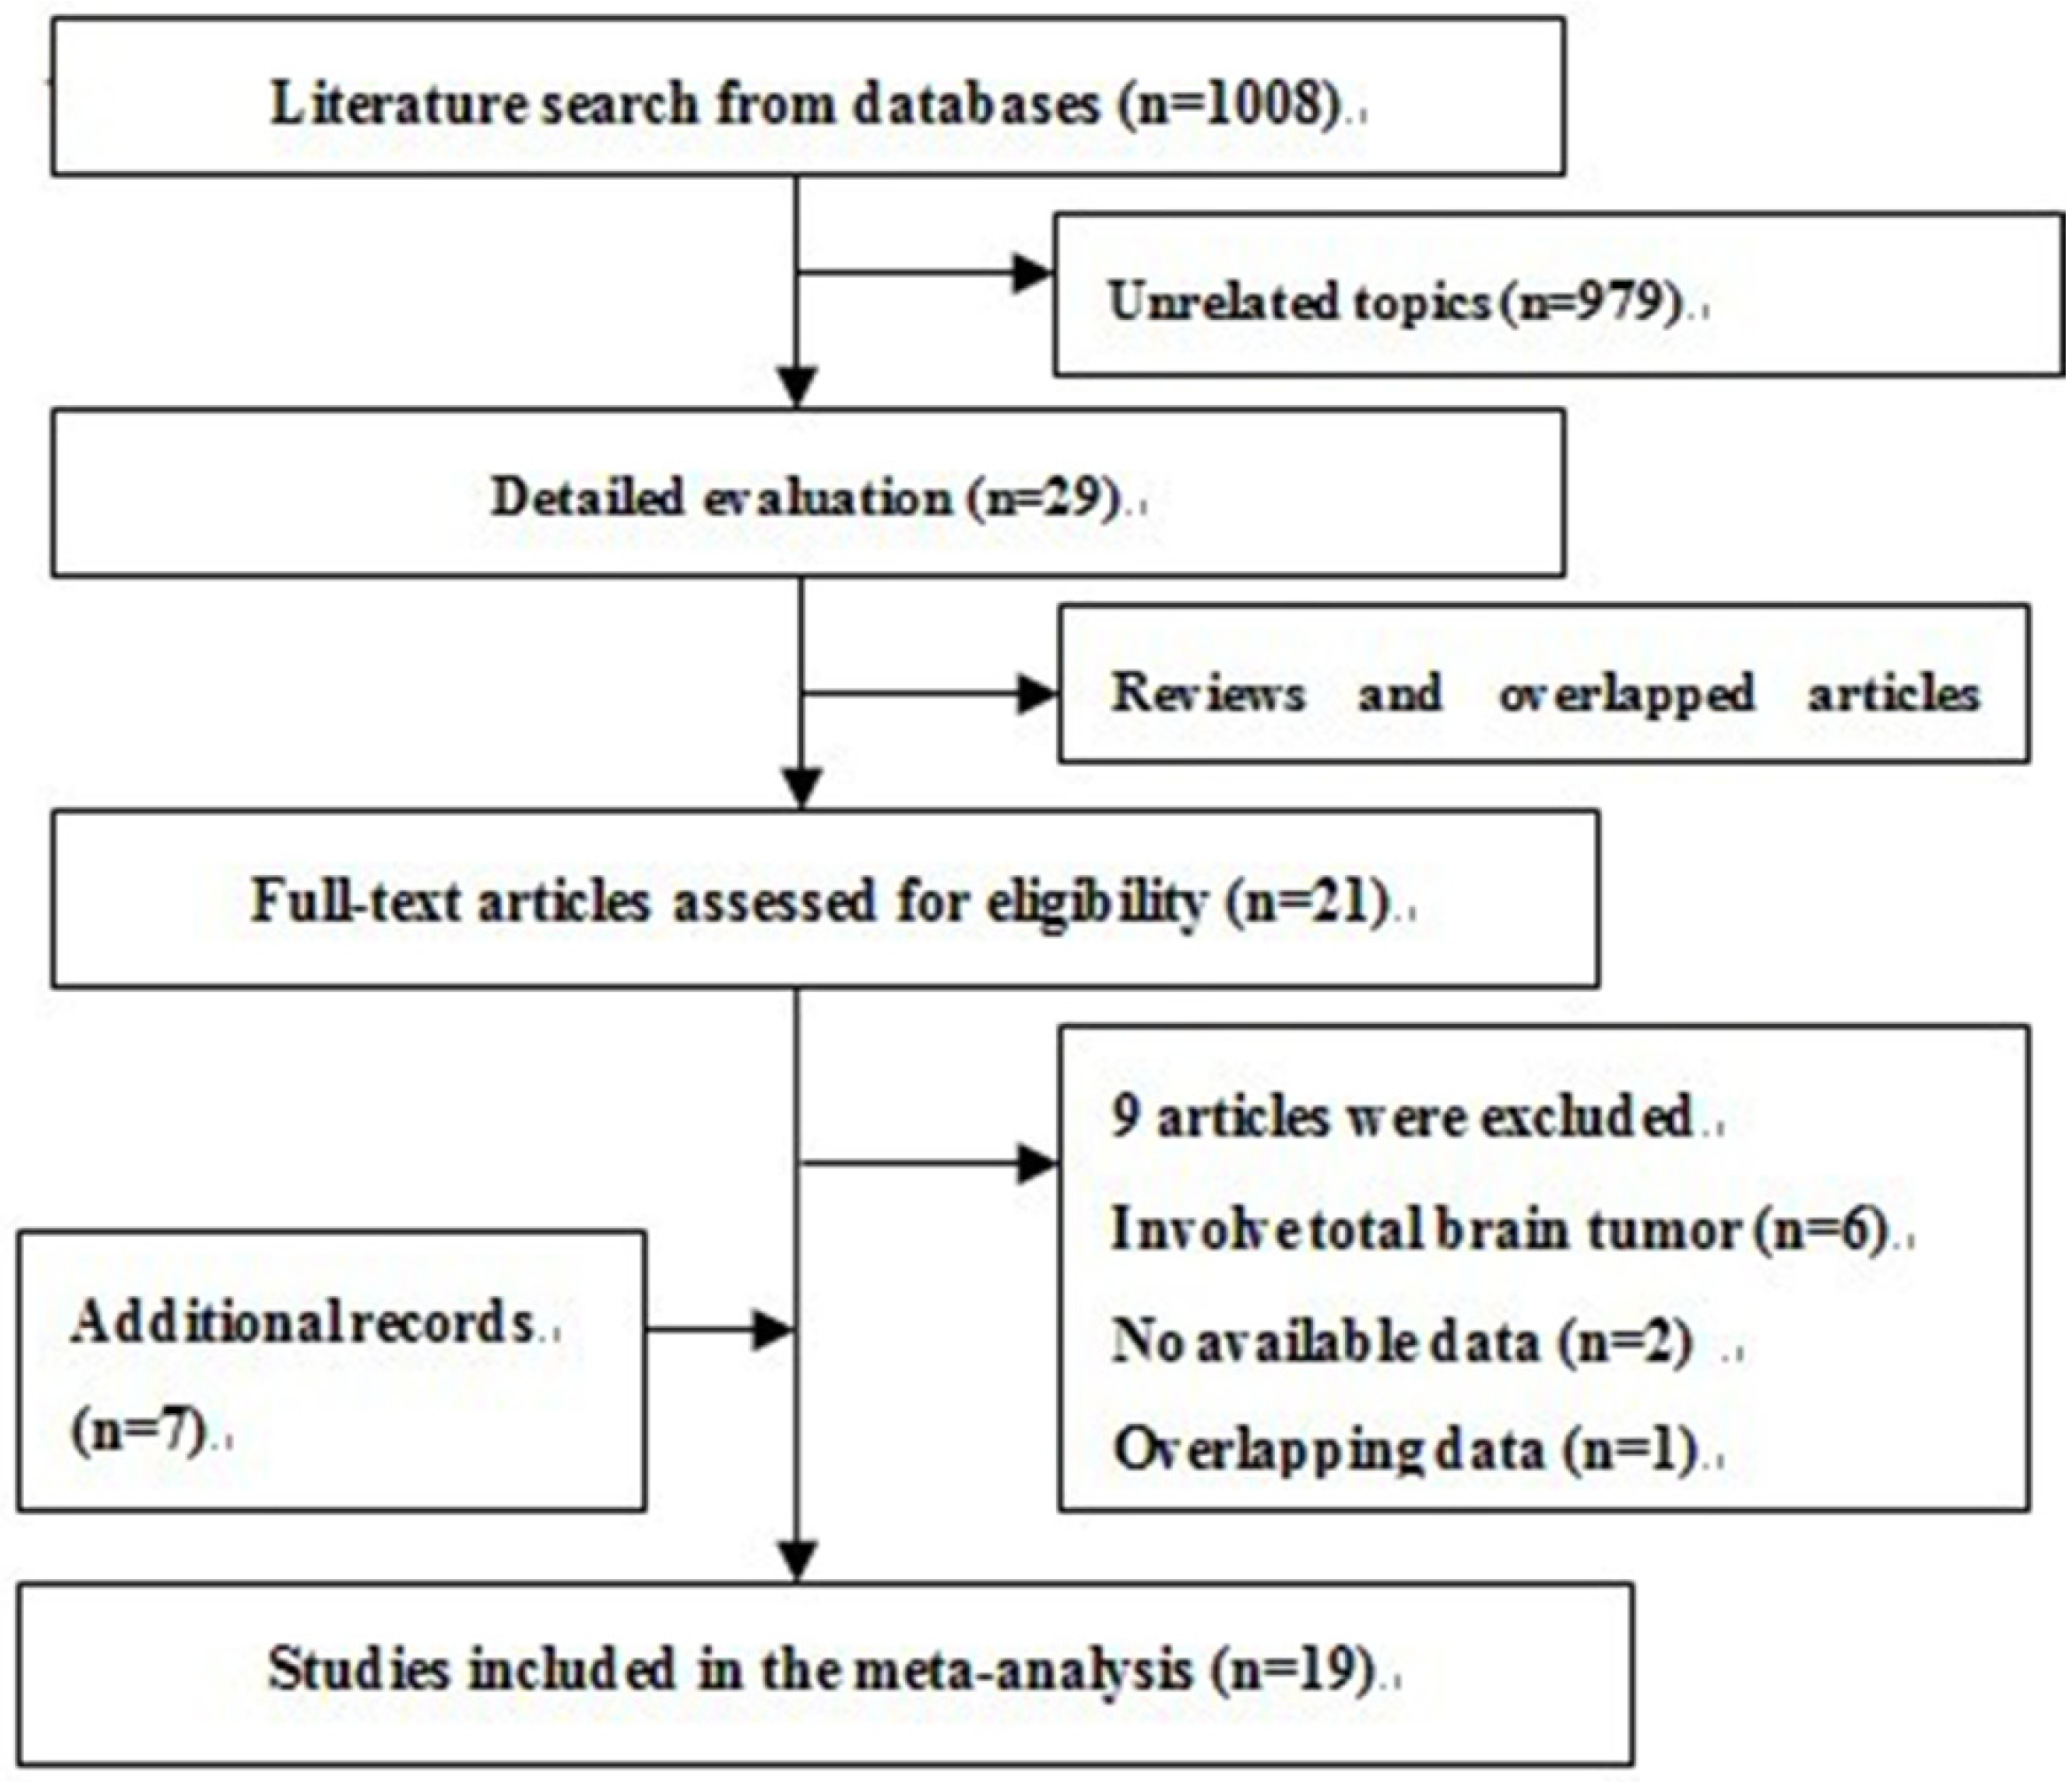
3.1. Search Results and Description of Studies


| Study | Country | Study Design | Sample Size | Case Diagnosis | Exposure Variables | Exposure Assessment † | Matching or Adjustments ‡ | Study Quality |
|---|---|---|---|---|---|---|---|---|
| Choi, 1970 [27] | USA | HCC | 55/55 | Medical records | Total alcohol | a | 1,2,3,4,14 | 5 |
| Musicco, 1982 [28] | Italy | HCC | 47/196 | Medical records | Wine | a | 1,2,4 | 5 |
| Ahlbom, 1986 [29] | Sweden | PCC | 78/92 | Medical records | Total alcohol | c | 1,2,4 | 6 |
| Burch, 1987 [30] | Canada | HCC | 215/215 | Pathology reports | Beer, wine, spirits | a | 1,2,4,9,20 | 5 |
| Preston-Martin, 1989 [31] | USA | PCC | 202/202 | Pathology reports | Beer, wine, spirits | a | 1,2,4 | 6 |
| Mills, 1989 [32] | USA | Cohort | 21/34,000 | Cancer registry | Total alcohol | c | 1,2 | 6 |
| Hochberg, 1990 [33] | USA | PCC | 160/128 | Medical records | Beer | b, c | 1,2,4,10 | 7 |
| Ryan, 1992 [34] | Australia | PCC | 110/417 | Medical records | Total alcohol (beer, wine, spirits) | a, c | 1,2,4 | 6 |
| Zampieri, 1994 [35] | Italy | HCC | 195/195 | Pathology reports | Wine | a | 1,2,4,14,20 | 6 |
| Hurley, 1996 [36] | Australia | PCC | 416/420 | Pathology reports | Total alcohol (beer, wine, spirits) | a | 1,2,20 | 6 |
| Blowers, 1997 [37] | USA | PCC | 94/94 | Cancer registry | Beer | a | 1,3 | 6 |
| Hu, 1998 [38] | China | HCC | 218/436 | Pathology reports | Beer, spirits | a | 1,2,4,5,9,15,16 | 6 |
| Efird, 2004 [39] | USA | Cohort | 130/133,811 | Cancer registry | Total alcohol (beer, wine, spirits) | c | 1,2,3,5,6,8 | 7 |
| Ruder, 2006 [40] | USA | PCC | 798/1175 | Pathology reports | Total alcohol | a, b | 1,2,4,5 | 7 |
| Benson, 2008 [41] | UK | Cohort | 646/1,249,670 | Cancer registry | Total alcohol | c | 1,4,6,10,11,12, 13,14,17,18, 19 | 6 |
| Gousias, 2009 [42] | Greece | HCC | 56/82 | Medical records | Total alcohol | a | 1,2,4 | 5 |
| Baglietto, 2011 [43] | Australia | Cohort | 67/39,766 | Cancer registry | Total alcohol (beer, wine) | a | 2,4,5,8,16 | 8 |
| Cabaniols, 2011 [44] | France | HCC | 122/122 | Pathology reports | Total alcohol | a, c | 1,2 | 5 |
| McCarthy, 2011 [15] | USA, Sweden, Denmark | PCC/HCC | 617/1260 | Pathology reports | Total alcohol | a, b, c | 1,2,3,4,20 | 5 |
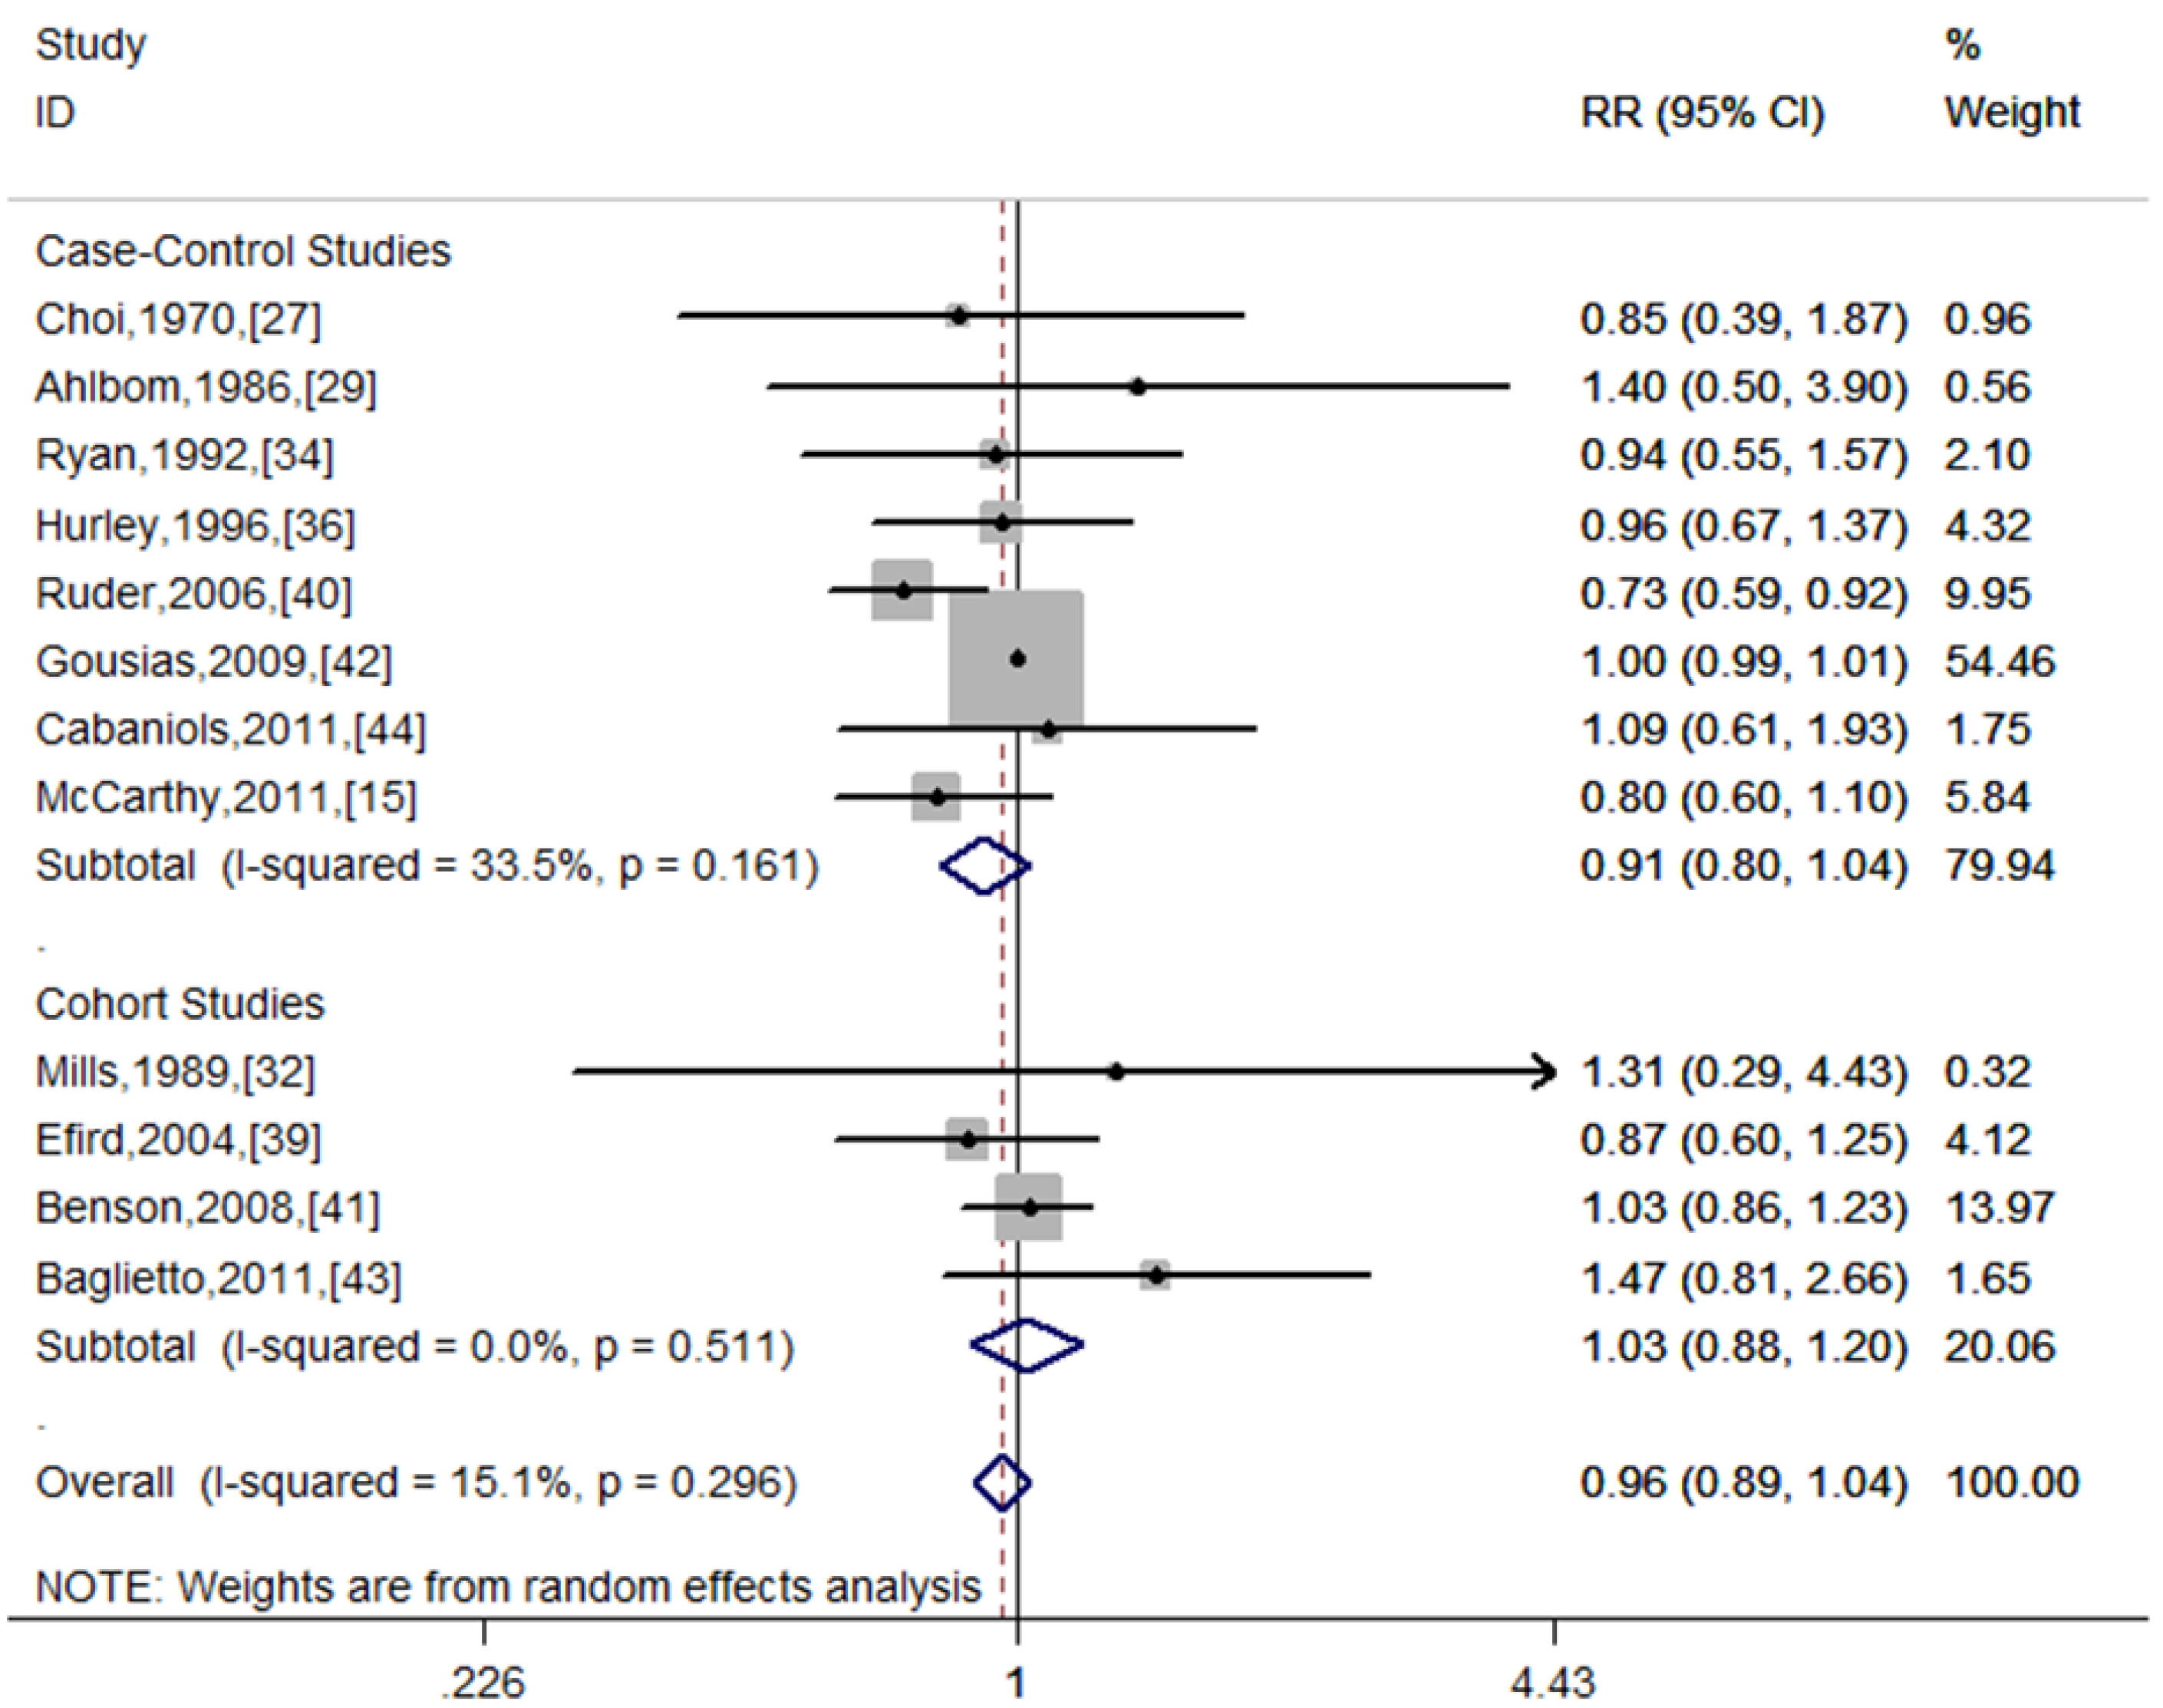
3.2. Overall Association of Alcohol Consumption and Risk of Glioma

3.3. Stratifying Analysis
| Group | Number of Studies | Summary Effect | Heterogeneity | ||
|---|---|---|---|---|---|
| RR (95% CI) | p Value | I2 | p | ||
| All studies | 12 | 0.96 (0.89–1.04) | 0.312 | 15.1% | 0.296 |
| Study design | |||||
| Case-control | 8 | 0.91 (0.80–1.04) | 0.164 | 33.5% | 0.161 |
| PB | 4 | 0.82 (0.68–0.99) | 0.034 | 3.2% | 0.377 |
| HB | 3 | 1.00 (0.99–1.01) | 1.000 | 0.0% | 0.882 |
| Cohort | 4 | 1.03 (0.88–1.20) | 0.734 | 0.0% | 0.511 |
| Geographic area | |||||
| Europe | 4 | 1.00 (0.99–1.01) | 0.977 | 0.0% | 0.896 |
| North America | 4 | 0.78 (0.65–0.93) | 0.007 | 0.0% | 0.773 |
| Asia/Australia | 3 | 1.04 (0.80–1.35) | 0.777 | 0.0% | 0.441 |
| Adjustment status | |||||
| Adjusted | 7 | 0.86 (0.74–1.00) | 0.058 | 11.5% | 0.342 |
| Unadjusted | 5 | 1.00 (0.99–1.01) | 0.988 | 0.0% | 0.947 |
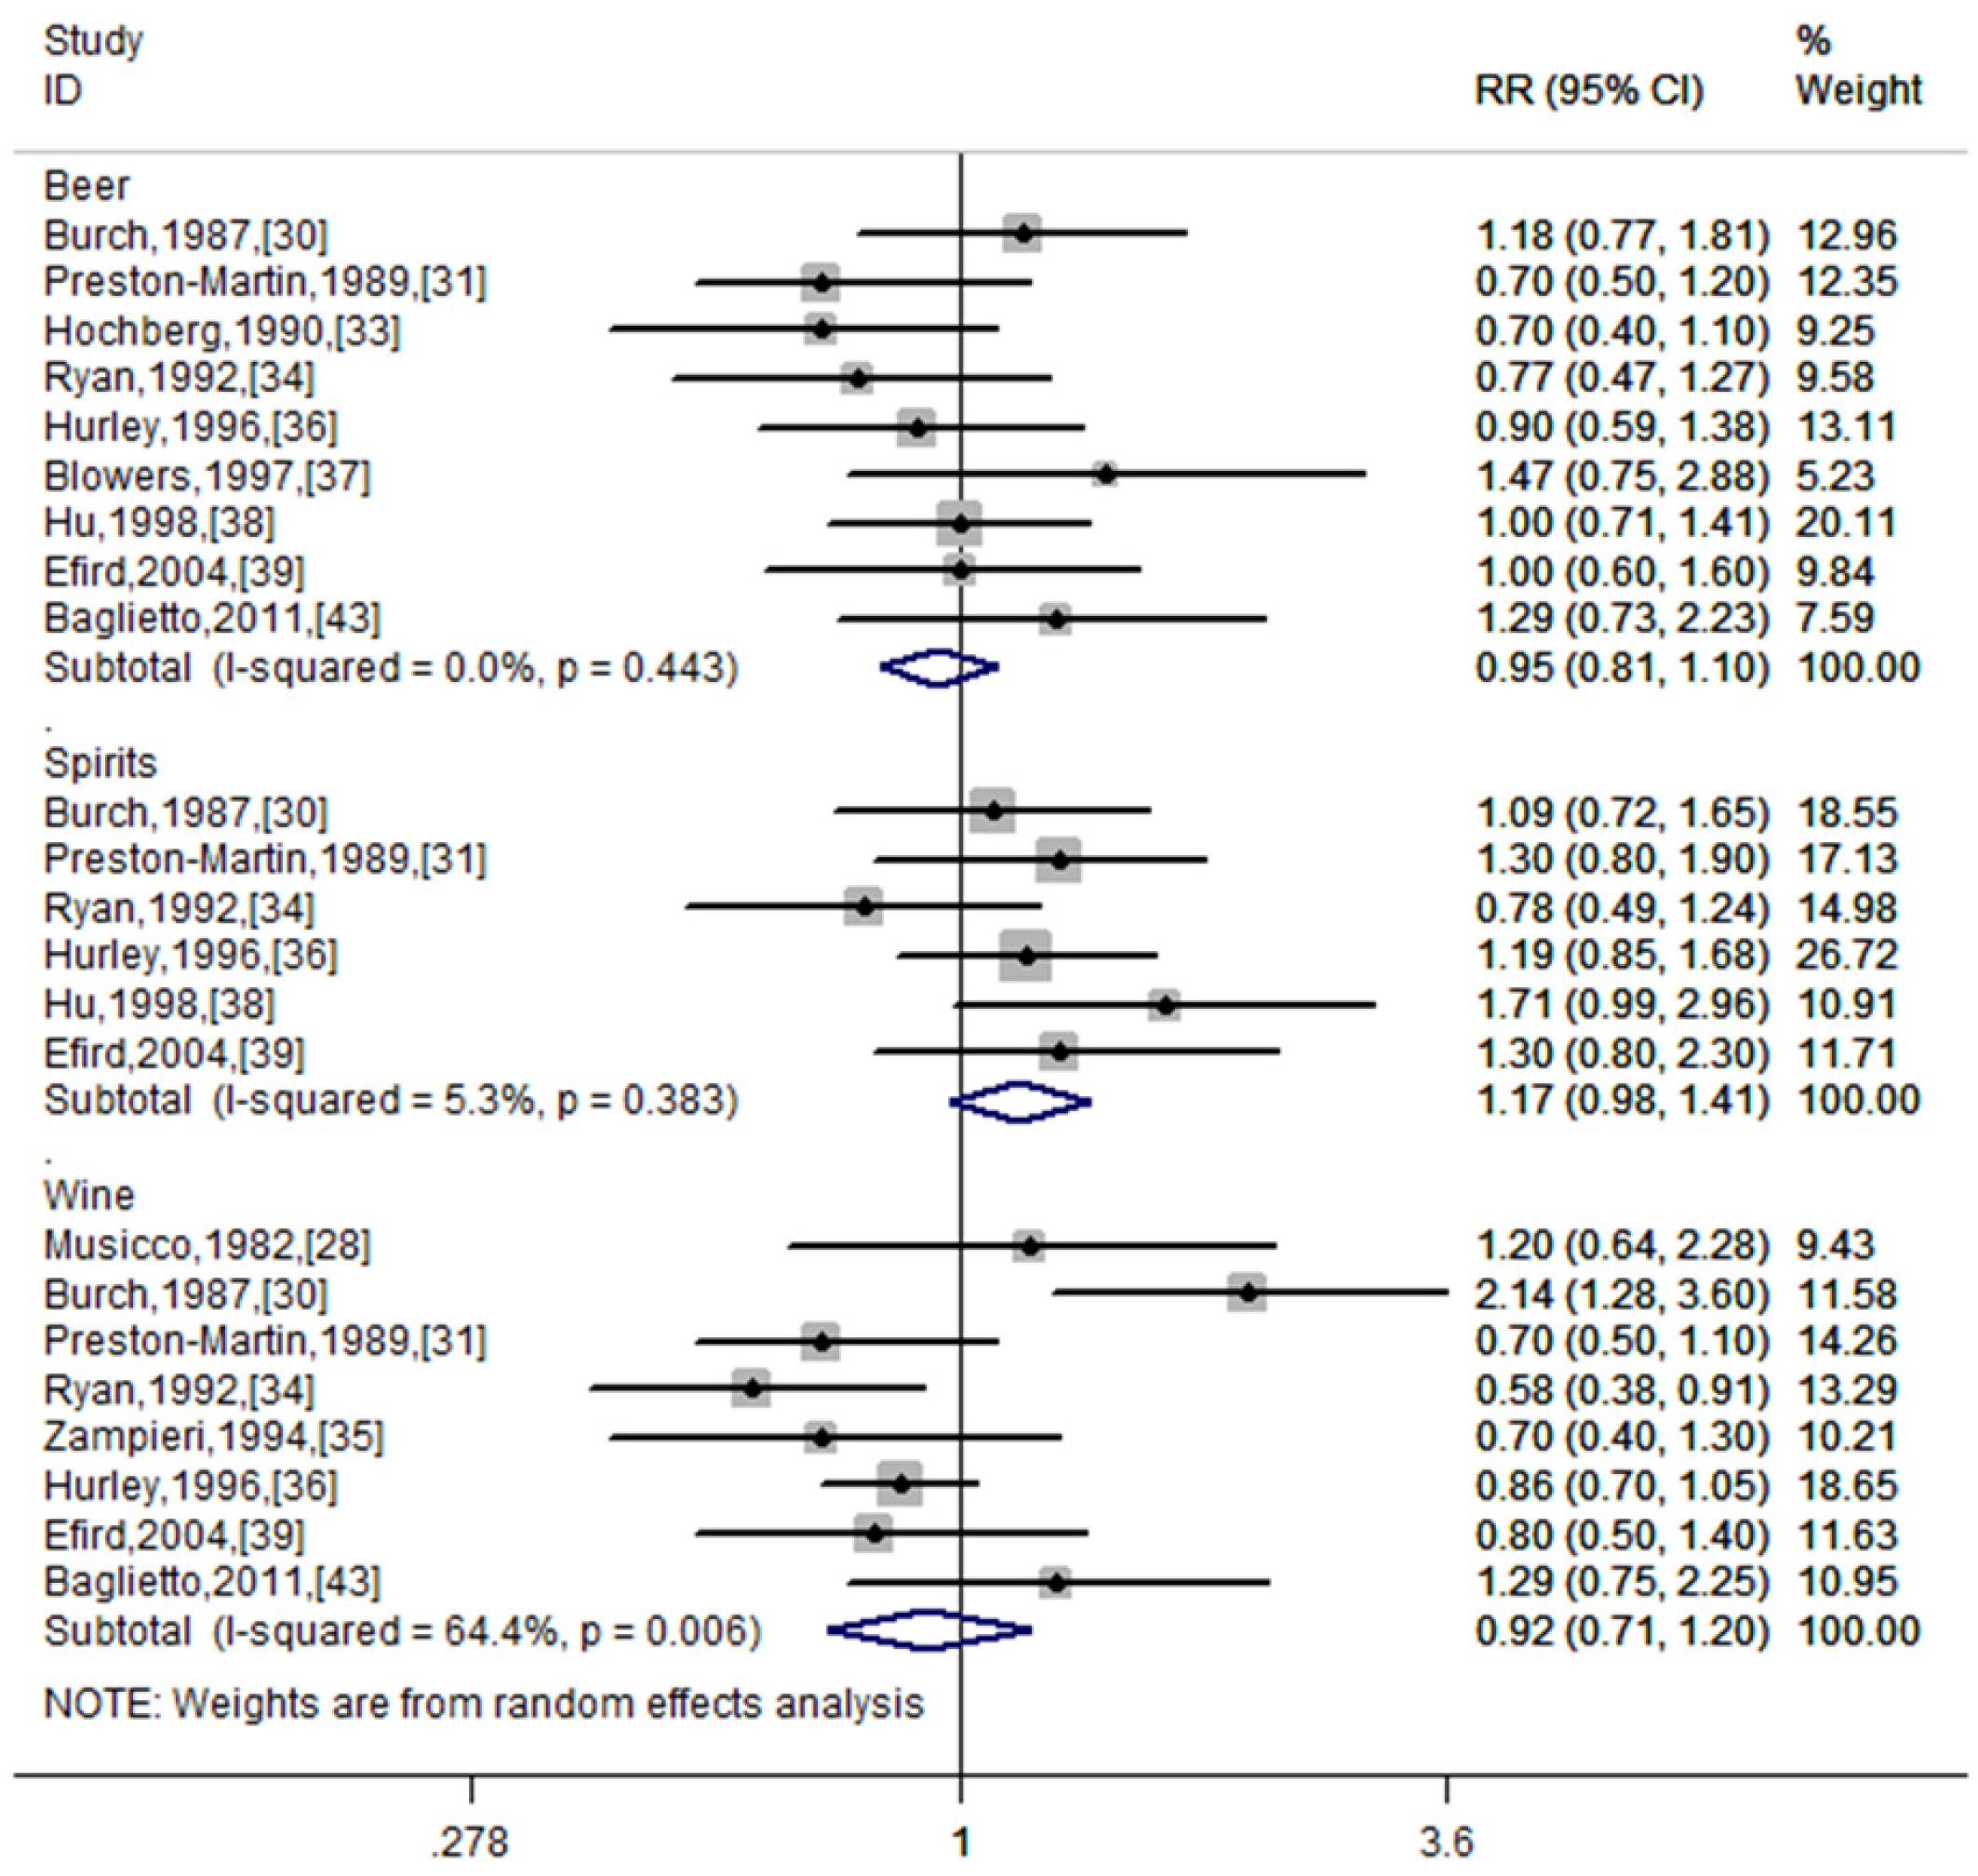
| Type of alcohol | |||||
| Beer | 9 | 0.95 (0.81–1.10) | 0.484 | 0.0% | 0.443 |
| Wine | 8 | 0.92 (0.71–1.20) | 0.548 | 64.4% | 0.006 |
| Spirits | 6 | 1.17 (0.98–1.41) | 0.09 | 5.3% | 0.383 |
| Study quality | |||||
| High | 8 | 0.94 (0.81–1.09) | 0.383 | 23.1% | 0.245 |
| Low | 4 | 1.00 (0.99–1.01) | 0.962 | 0.0% | 0.507 |

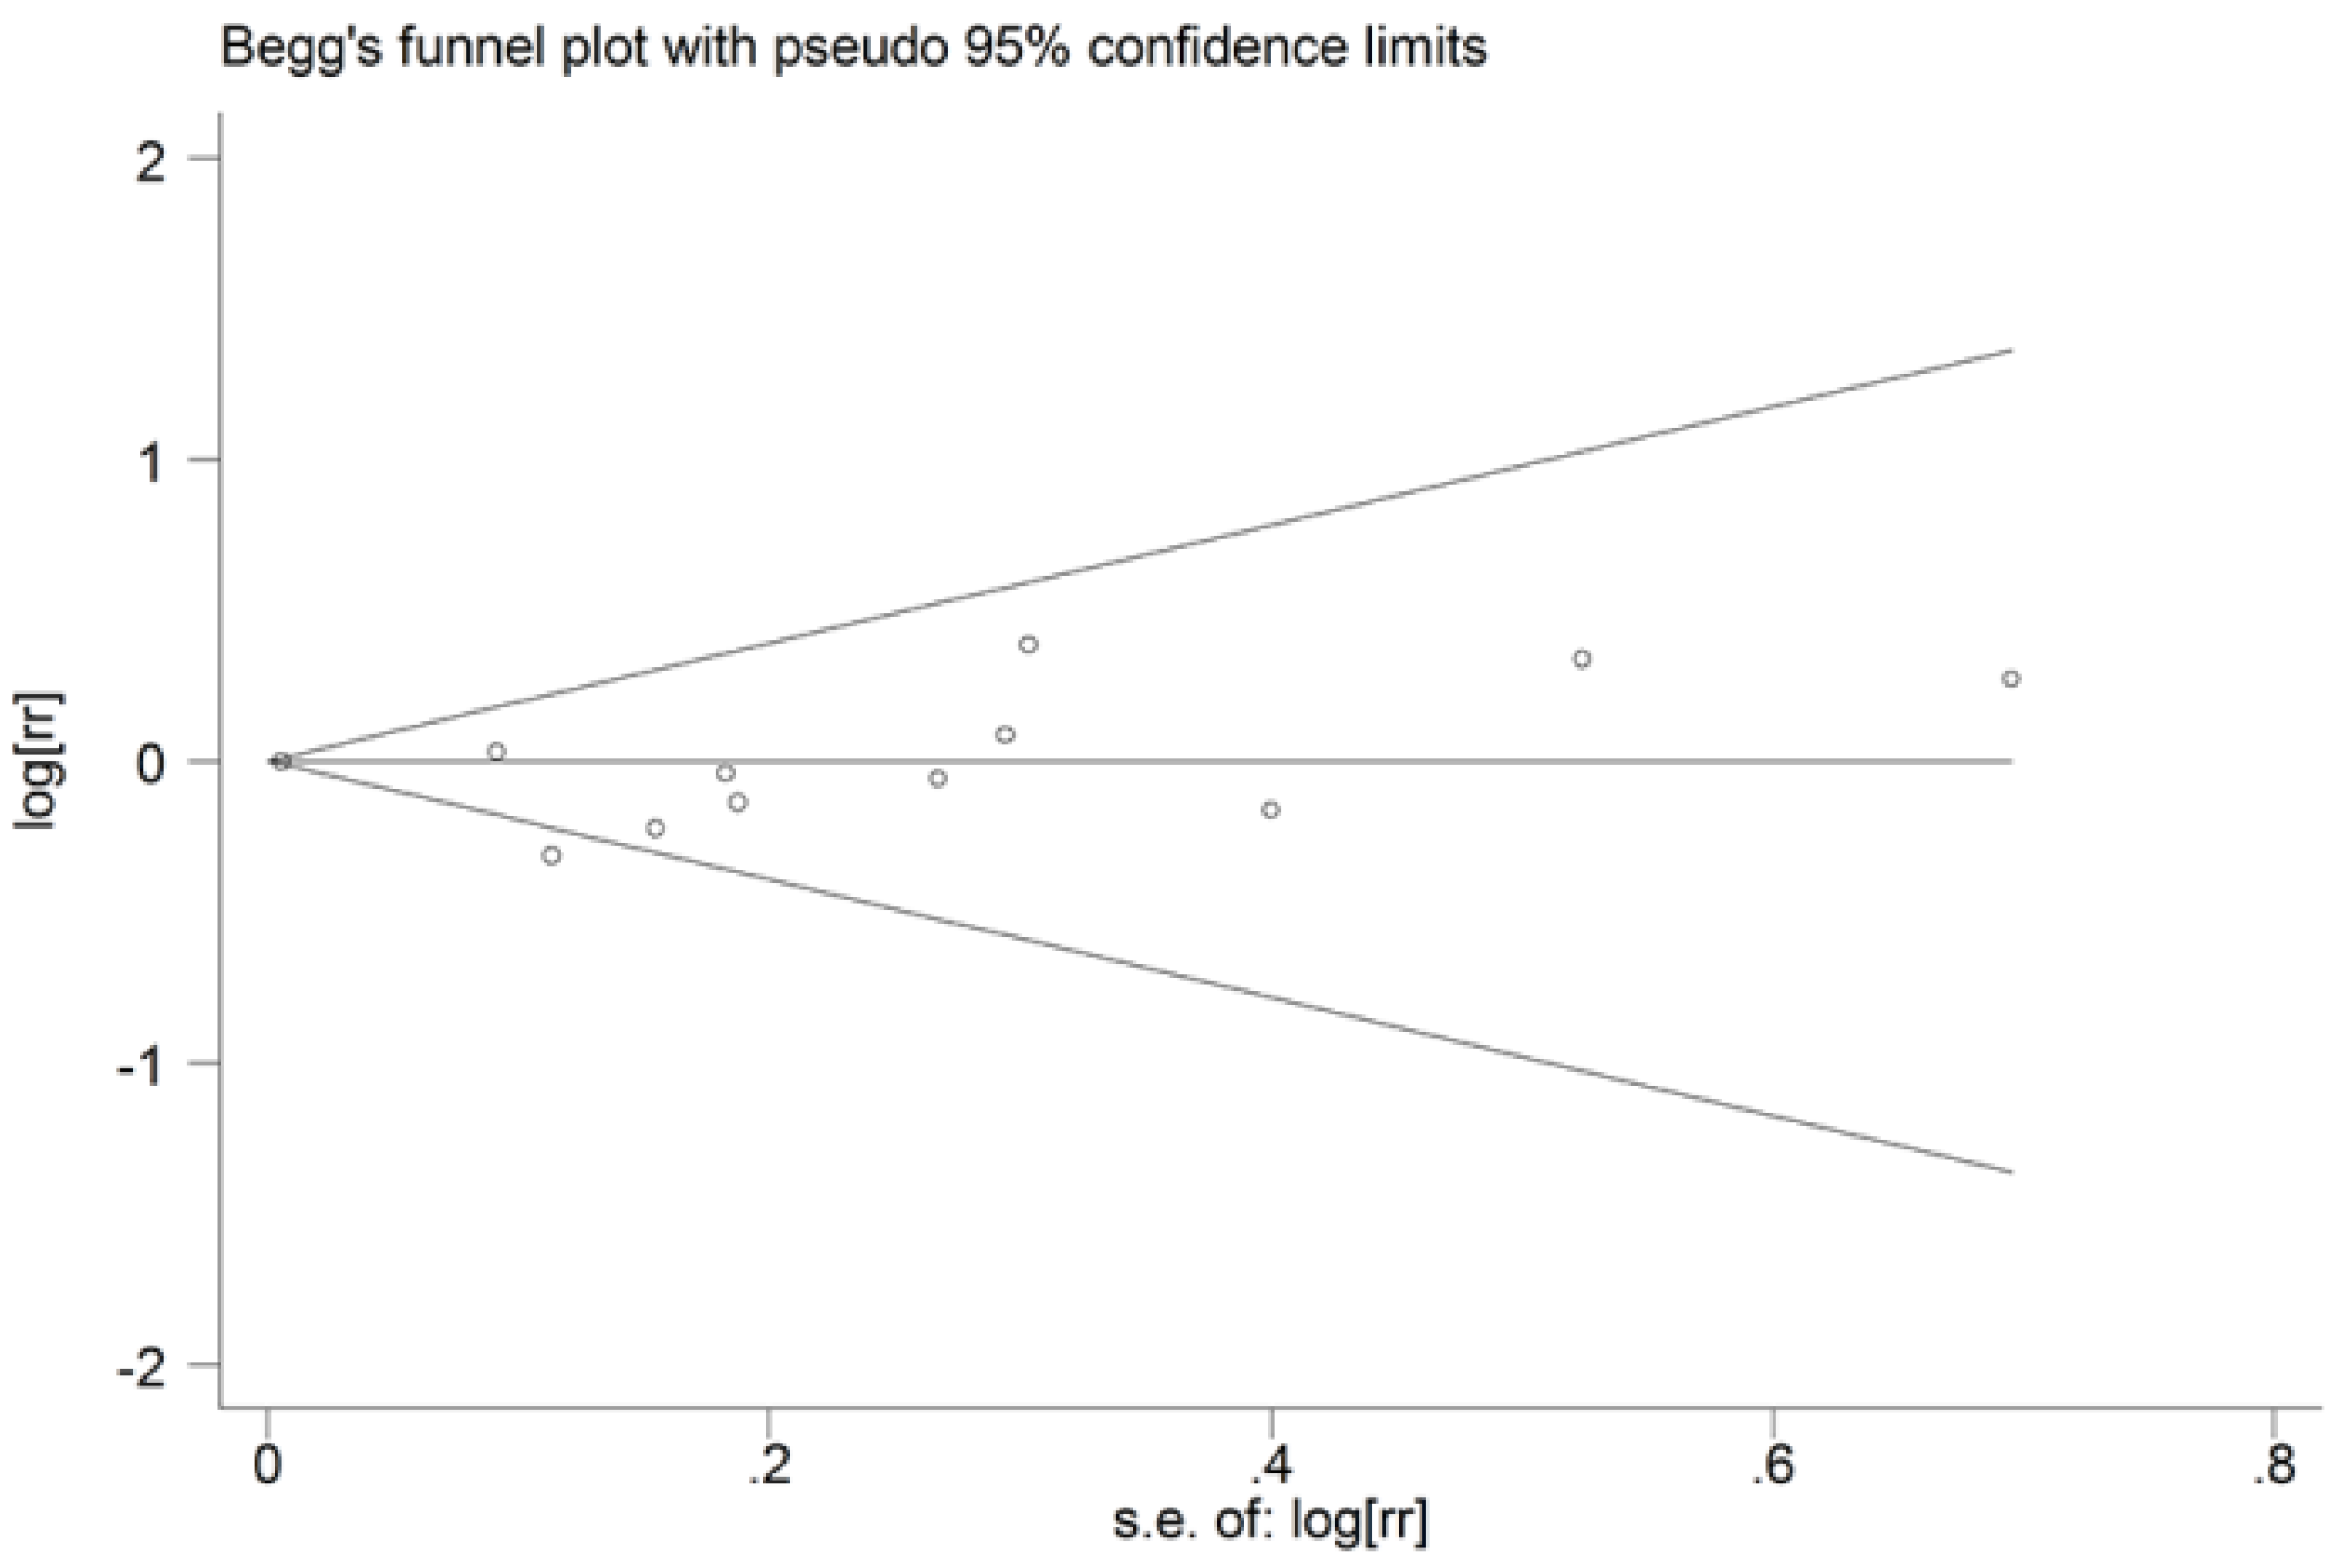
3.4. Sensitivity Analysis and Publication Bias

4. Discussion
5. Conclusions
Conflicts of Interest
References
- Schwartzbaum, J.A.; Fisher, J.L.; Aldape, K.D.; Wrensch, M. Epidemiology and molecular pathology of glioma. Nat. Clin. Pract. Neurol. 2006, 2, 494–503. [Google Scholar]
- Ohgaki, H. Epidemiology of brain tumors. Methods Mol. Biol. 2009, 472, 323–342. [Google Scholar] [CrossRef]
- Testino, G. The burden of cancer attributable to alcohol consumption. Maedica 2011, 6, 313–320. [Google Scholar]
- Boffetta, P.; Hashibe, M.; La Vecchia, C.; Zatonski, W.; Rehm, J. The burden of cancer attributable to alcohol drinking. Int. J. Cancer 2006, 119, 884–887. [Google Scholar] [CrossRef]
- Boffetta, P.; Hashibe, M. Alcohol and cancer. Lancet Oncol. 2006, 7, 149–156. [Google Scholar] [CrossRef]
- Wells, G.A.; Shea, B.; O’Connell, D.; Peterson, J.; Welch, V.; Tugwell, P. The Newcastle-Ottawa Scale (NOS) for Assessing the Quality of Nonrandomised Studies in Meta-Analyses. Available online: http://www.ohri.ca/programs/clinical_epidemiology/oxford.htm (accessed on 8 August 2013).
- STATA, version 11.0; StataCrop: College Station, TX, USA, 2009.
- Greenland, S. Quantitative methods in the review of epidemiologic literature. Epidemiol. Rev. 1987, 9, 1–30. [Google Scholar]
- DerSimonian, R.; Laird, N. Meta-analysis in clinical trials. Control. Clin. Trials 1986, 7, 177–188. [Google Scholar]
- Higgins, J.P.; Thompson, S.G. Quantifying heterogeneity in a meta-analysis. Stat. Med. 2002, 21, 1539–1558. [Google Scholar] [CrossRef]
- Higgins, J.P.; Thompson, S.G.; Deeks, J.J.; Altman, D.G. Measuring inconsistency in meta-analyses. BMJ 2003, 327, 557–560. [Google Scholar] [CrossRef] [Green Version]
- Qi, Z.-Y.; Shao, C.; Zhang, X.; Hui, G.-Z.; Wang, Z. Exogenous and endogenous hormones in relation to glioma in women: A meta-analysis of 11 case-control studies. PLoS One 2013, 8, e68695. [Google Scholar]
- Egger, M.; Davey Smith, G.; Schneider, M.; Minder, C. Bias in meta-analysis detected by a simple, graphical test. BMJ 1997, 315, 629–634. [Google Scholar] [CrossRef]
- Begg, C.B.; Mazumdar, M. Operating characteristics of a rank correlation test for publication bias. Biometrics 1994, 50, 1088–1101. [Google Scholar] [CrossRef]
- McCarthy, B.J.; Rankin, K.M.; Aldape, K.; Bondy, M.L.; Brännström, T.; Broholm, H.; Feychting, M.; Il’yasova, D.; Inskip, P.D.; Johansen, C. Risk factors for oligodendroglial tumors: A pooled international study. Neuro Oncol. 2011, 13, 242–250. [Google Scholar] [CrossRef]
- Galeone, C.; Malerba, S.; Rota, M.; Bagnardi, V.; Negri, E.; Scotti, L.; Bellocco, R.; Corrao, G.; Boffetta, P.; La Vecchia, C. A meta-analysis of alcohol consumption and the risk of brain tumours. Ann. Oncol. 2013, 24, 514–523. [Google Scholar] [CrossRef]
- Hamling, J.; Lee, P.; Weitkunat, R.; Ambuhl, M. Facilitating meta-analyses by deriving relative effect and precision estimates for alternative comparisons from a set of estimates presented by exposure level or disease category. Stat. Med. 2008, 27, 954–970. [Google Scholar] [CrossRef]
- Carpenter, A.V.; Flanders, W.; Frome, E.; Cole, P.; Fry, S.A. Brain cancer and nonoccupational risk factors: A case-control study among workers at two nuclear facilities. Am. J. Public Health 1987, 77, 1180–1182. [Google Scholar] [CrossRef]
- Guo, W.D.; Linet, M.S.; Chow, W.H.; Li, J.Y.; Blot, W.J. Diet and serum markers in relation to primary brain tumor risk in China. Nutr. Cancer 1994, 22, 143–150. [Google Scholar] [CrossRef]
- Kaplan, S.; Modan, B. Nutritional factors in the etiology of brain tumors potential role of nitrosamines, fat, and cholesterol. Am. J. Epidemiol. 1997, 146, 832–841. [Google Scholar] [CrossRef]
- Hu, J.; La Vecchia, C.; Negri, E.; Chatenoud, L.; Bosetti, C.; Jia, X.; Liu, R.; Huang, G.; Bi, D.; Wang, C. Diet and brain cancer in adults: A case-control study in Northeast China. Int. J. Cancer 1999, 81, 20–23. [Google Scholar] [CrossRef]
- Allen, N.E.; Beral, V.; Casabonne, D.; Kan, S.W.; Reeves, G.K.; Brown, A.; Green, J. Moderate alcohol intake and cancer incidence in women. J. Natl. Cancer Inst. 2009, 101, 296–305. [Google Scholar] [CrossRef]
- Kim, M.K.; Ko, M.J.; Han, J.T. Alcohol consumption and mortality from all-cause and cancers among 1.34 million Koreans: The results from the Korea national health insurance corporation’s health examinee cohort in 2000. Cancer Causes Control 2010, 21, 2295–2302. [Google Scholar] [CrossRef]
- Boeing, H.; Schlehofer, B.; Blettner, M.; Wahrendorf, J. Dietary carcinogens and the risk for glioma and meningioma in Germany. Int. J. Cancer 1993, 53, 561–565. [Google Scholar] [CrossRef]
- Lee, M.; Wrensch, M.; Miike, R. Dietary and tobacco risk factors for adult onset glioma in the San Francisco Bay Area (California, USA). Cancer Causes Control 1997, 8, 13–24. [Google Scholar] [CrossRef]
- Giles, G.G.; McNeil, J.J.; Donnan, G.; Webley, C.; Staples, M.P.; Ireland, P.D.; Hurley, S.F.; Salzberg, M. Dietary factors and the risk of glioma in adults: Results of a case-control study in melbourne, Australia. Int. J. Cancer 1994, 59, 357–362. [Google Scholar] [CrossRef]
- Choi, N.W.; Schuman, L.M.; Gullen, W.H. Epidemiology of primary central nervous system neoplasms. II. Case-control study. Am. J. Epidemiol. 1970, 91, 467–485. [Google Scholar]
- Musicco, M.; Filippini, G.; Bordo, B.M.; Melotto, A.; Morello, G.; Berrino, F. Gliomas and occupational exposure to carcinogens: Case-control study. Am. J. Epidemiol. 1982, 116, 782–790. [Google Scholar]
- Ahlbom, A.; Navier, I.L.; Norell, S.; Olin, R.; Spännare, B. Nonoccupational risk indicators for astrocytomas in adults. Am. J. Epidemiol. 1986, 124, 334–337. [Google Scholar]
- Burch, J.D.; Craib, K.J.; Choi, B.C.; Miller, A.B.; Risch, H.A.; Howe, G.R. An exploratory case-control study of brain tumors in adults. J. Natl. Cancer Inst. 1987, 78, 601–609. [Google Scholar]
- Preston-Martin, S.; Mack, W.; Henderson, B.E. Risk factors for gliomas and meningiomas in males in Los Angeles County. Cancer Res. 1989, 49, 6137–6143. [Google Scholar]
- Mills, P.; Preston-Martin, S.; Annegers, J.; Beeson, W.; Phillips, R.; Fraser, G. Risk factors for tumors of the brain and cranial meninges in Seventh-Day Adventists. Neuroepidemiology 1989, 8, 266–275. [Google Scholar] [CrossRef]
- Hochberg, F.; Toniolo, P.; Cole, P. Nonoccupational risk indicators of glioblastoma in adults. J. Neurooncol. 1990, 8, 55–60. [Google Scholar]
- Ryan, P.; Lee, M.W.; North, J.B.; McMichael, A.J. Risk factors for tumors of the brain and meninges: Results from the Adelaide Adult Brain Tumor Study. Int. J. Cancer 1992, 51, 20–27. [Google Scholar] [CrossRef]
- Zampieri, P.; Meneghini, F.; Grigoletto, F.; Gerosa, M.; Licata, C.; Casentini, L.; Longatti, P.L.; Padoan, A.; Mingrino, S. Risk factors for cerebral glioma in adults: A case-control study in an Italian population. J. Neurooncol. 1994, 19, 61–67. [Google Scholar] [CrossRef]
- Hurley, S.F.; McNeil, J.J.; Donnan, G.A.; Forbes, A.; Salzberg, M.; Giles, G.G. Tobacco smoking and alcohol consumption as risk factors for glioma: A case-control study in Melbourne, Australia. J. Epidemiol. Community Health 1996, 50, 442–446. [Google Scholar] [CrossRef]
- Blowers, L.; Preston-Martin, S.; Mack, W.J. Dietary and other lifestyle factors of women with brain gliomas in Los Angeles County (California, USA). Cancer Causes Control 1997, 8, 5–12. [Google Scholar] [CrossRef]
- Hu, J.; Johnson, K.C.; Mao, Y.; Guo, L.; Zhao, X.; Jia, X.; Bi, D.; Huang, G.; Liu, R. Risk factors for glioma in adults: A case-control study in northeast China. Cancer Detect. Prev. 1997, 22, 100–108. [Google Scholar]
- Efird, J.T.; Friedman, G.D.; Sidney, S.; Klatsky, A.; Habel, L.A.; Udaltsova, N.V.; van Den Eeden, S.; Nelson, L.M. The risk for malignant primary adult-onset glioma in a large, multiethnic, managed-care cohort: Cigarette smoking and other lifestyle behaviors. J. Neurooncol. 2004, 68, 57–69. [Google Scholar] [CrossRef]
- Ruder, A.; Waters, M.; Carreon, T.; Butler, M.; Davis-King, K.; Calvert, G.; Schulte, P.; Ward, E.; Connally, L.; Lu, J.; et al. The Upper Midwest Health Study: A case-control study of primary intracranial gliomas in farm and rural residents. J. Agric. Saf. Health 2006, 12, 255–274. [Google Scholar] [CrossRef]
- Benson, V.; Pirie, K.; Green, J.; Casabonne, D.; Beral, V. Lifestyle factors and primary glioma and meningioma tumours in the Million Women Study cohort. Br. J. Cancer 2008, 99, 185–190. [Google Scholar] [CrossRef]
- Gousias, K.; Markou, M.; Voulgaris, S.; Goussia, A.; Voulgari, P.; Bai, M.; Polyzoidis, K.; Kyritsis, A.; Alamanos, Y. Descriptive epidemiology of cerebral gliomas in northwest Greece and study of potential predisposing factors, 2005–2007. Neuroepidemiology 2009, 33, 89–95. [Google Scholar] [CrossRef]
- Baglietto, L.; Giles, G.G.; English, D.R.; Karahalios, A.; Hopper, J.L.; Severi, G. Alcohol consumption and risk of glioblastoma; evidence from the Melbourne Collaborative Cohort Study. Int. J. Cancer 2011, 128, 1929–1934. [Google Scholar] [CrossRef]
- Cabaniols, C.; Giorgi, R.; Chinot, O.; Ferahta, N.; Spinelli, V.; Alla, P.; Barrie, M.; Lehucher-Michel, M.-P. Links between private habits, psychological stress and brain cancer: A case–control pilot study in France. J. Neurooncol. 2011, 103, 307–316. [Google Scholar] [CrossRef]
- Claus, E.B.; Calvocoressi, L.; Bondy, M.L.; Wrensch, M.; Wiemels, J.L.; Schildkraut, J.M. Exogenous hormone use, reproductive factors, and risk of intracranial meningioma in females: Clinical article. J. Neurosurg. 2013, 118, 649–656. [Google Scholar] [CrossRef]
- Hu, J.; Little, J.; Xu, T.; Zhao, X.; Guo, L.; Jia, X.; Huang, G.; Bi, D.; Liu, R. Risk factors for meningioma in adults: A case-control study in northeast China. Int. J. Cancer 1999, 83, 299–304. [Google Scholar] [CrossRef]
- Johnson, D.R.; Olson, J.E.; Vierkant, R.A.; Hammack, J.E.; Wang, A.H.; Folsom, A.R.; Virnig, B.A.; Cerhan, J.R. Risk factors for meningioma in postmenopausal women: Results from the Iowa Women’s Health Study. Neuro Oncol. 2011, 13, 1011–1019. [Google Scholar] [CrossRef]
- McKinley, B.P.; Michalek, A.M.; Fenstermaker, R.A.; Plunkett, R.J. The impact of age and gender on the incidence of glial tumors in New York state from 1976–1995. J. Neurosurg. 2000, 93, 932–939. [Google Scholar] [CrossRef]
© 2014 by the authors; licensee MDPI, Basel, Switzerland. This article is an open access article distributed under the terms and conditions of the Creative Commons Attribution license (http://creativecommons.org/licenses/by/3.0/).
Share and Cite
Qi, Z.-Y.; Shao, C.; Yang, C.; Wang, Z.; Hui, G.-Z. Alcohol Consumption and Risk of Glioma: A Meta-Analysis of 19 Observational Studies. Nutrients 2014, 6, 504-516. https://doi.org/10.3390/nu6020504
Qi Z-Y, Shao C, Yang C, Wang Z, Hui G-Z. Alcohol Consumption and Risk of Glioma: A Meta-Analysis of 19 Observational Studies. Nutrients. 2014; 6(2):504-516. https://doi.org/10.3390/nu6020504
Chicago/Turabian StyleQi, Zhen-Yu, Chuan Shao, Chao Yang, Zhong Wang, and Guo-Zhen Hui. 2014. "Alcohol Consumption and Risk of Glioma: A Meta-Analysis of 19 Observational Studies" Nutrients 6, no. 2: 504-516. https://doi.org/10.3390/nu6020504