Polymorphisms in Genes Involved in Fatty Acid β-Oxidation Interact with Dietary Fat Intakes to Modulate the Plasma TG Response to a Fish Oil Supplementation


Abstract
:1. Introduction
2. Experimental Section
2.1. Participants
2.2. Study Design and Diets
2.3. Anthropometric Measurements
2.4. Biochemical Parameters
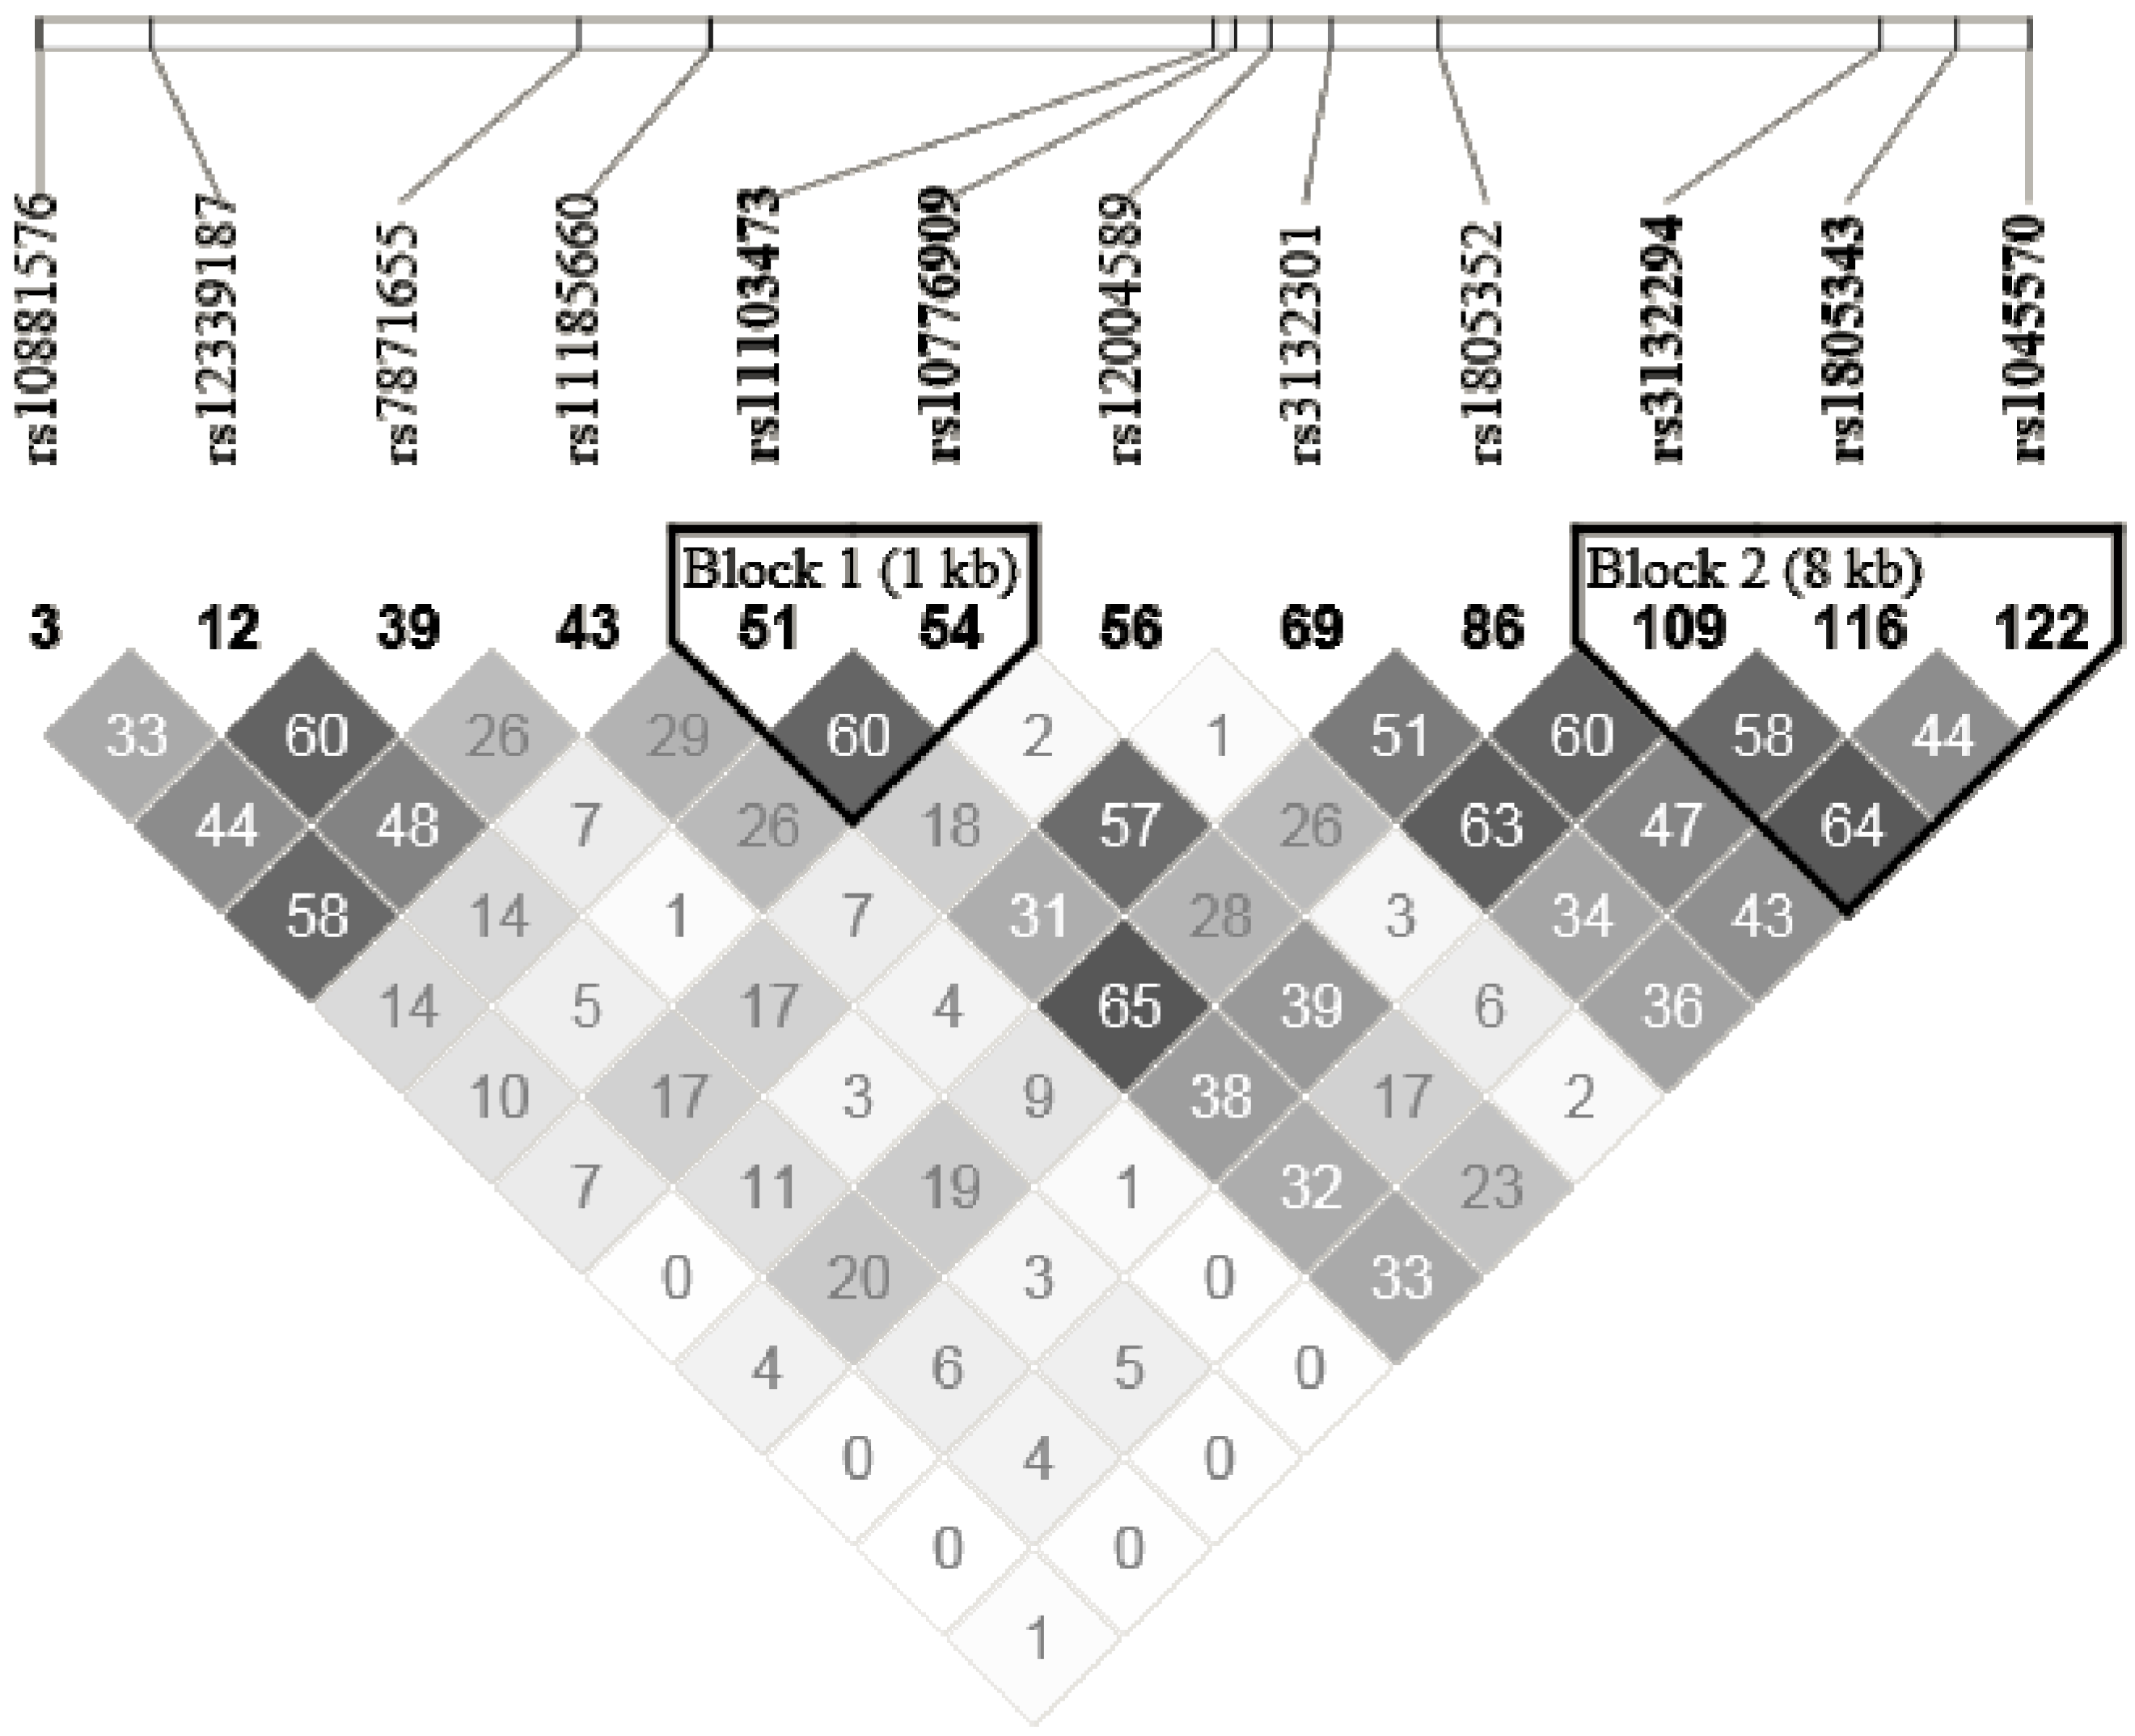
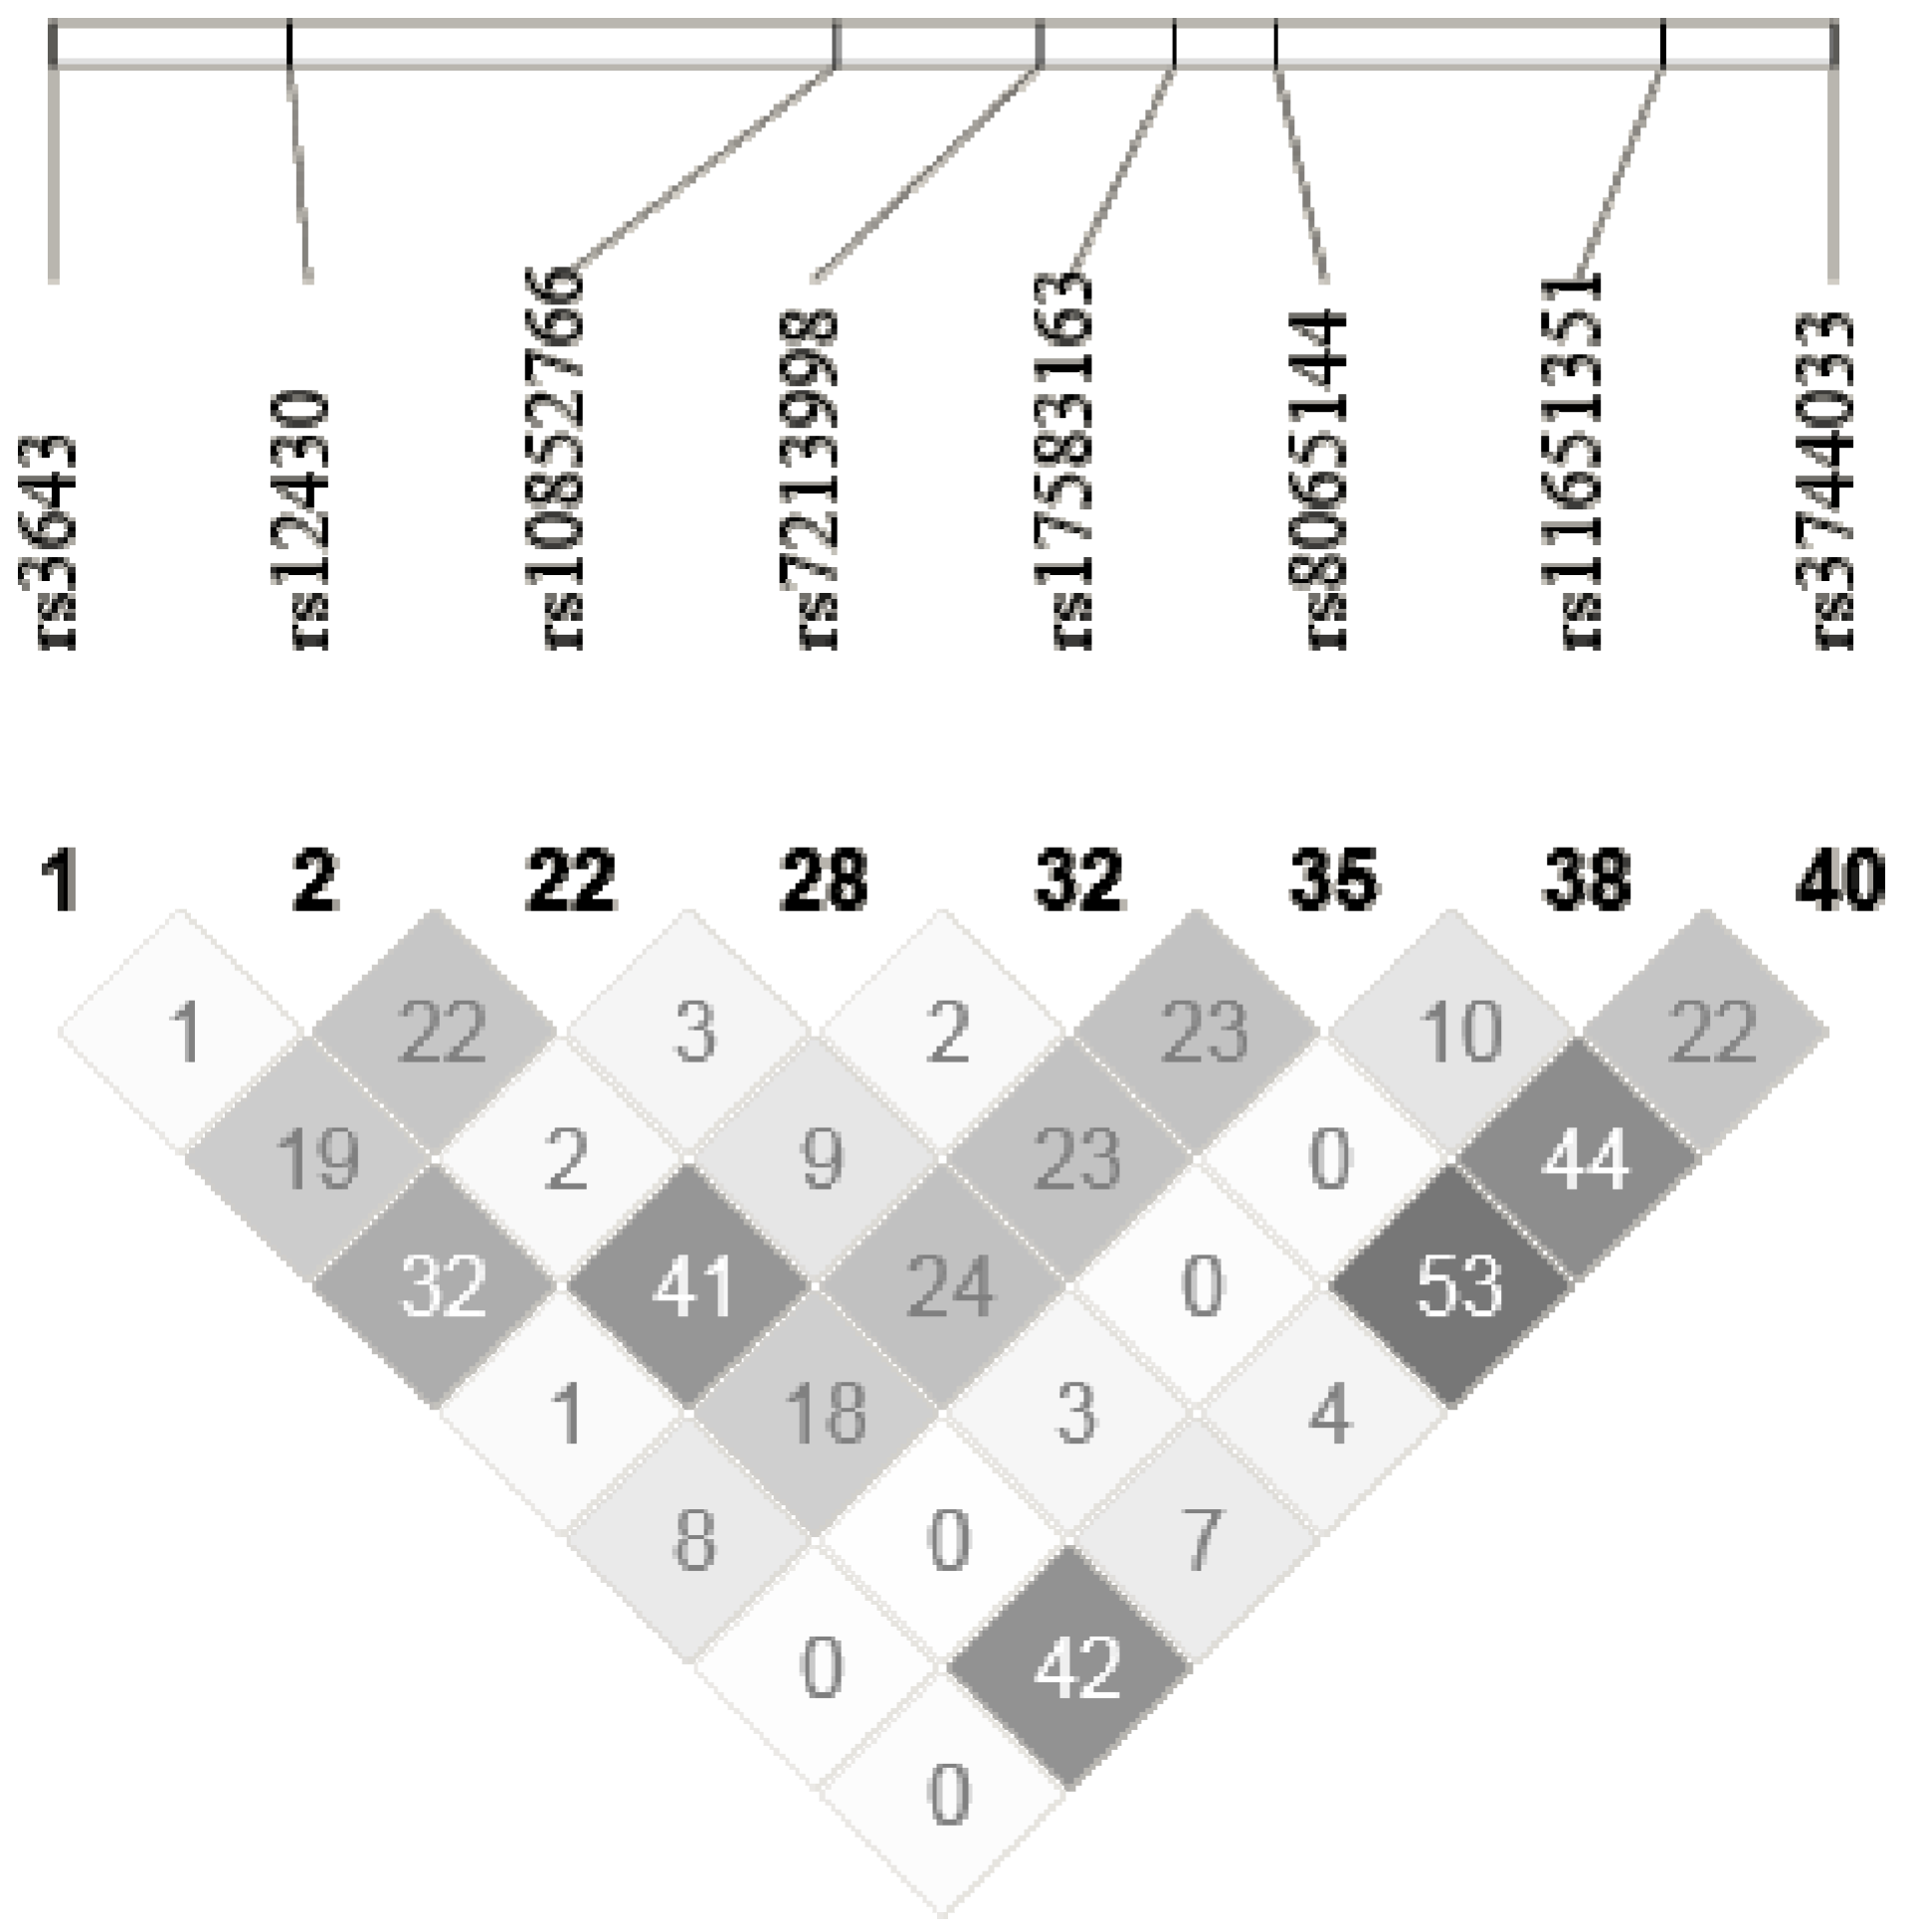
2.5. SNPs Selection and Genotyping


2.6. Gene Expression Assessment
2.7. Statistical Analyses
3. Results
3.1. Characteristics of the Study Population, Genetic Variants and Dietary Intakes

| Variables | Men (n = 96) | Women (n = 112) | Means ± SD * |
|---|---|---|---|
| Age (years) | 31.2 ± 8.1 | 30.5 ± 9.2 | 30.8 ± 8.7 |
| BMI (kg/m2) | 27.5 ± 3.6 | 28.2 ± 3.8 | 27.8 ± 3.7 |
| Waist circumference (cm) | 94.9 ± 11.0 | 92.0 ± 10.4 | 93.3 ± 10.8 |
| Systolic blood pressure (mmHg) | 118.09 ± 11.40 | 106.79 ± 13.29 | 112.03 ± 13.64 |
| (n = 111) | (n = 207) | ||
| Diastolic blood pressure (mmHg) | 70.53 ± 9.13 | 68.68 ± 9.19 | 69.54 ± 9.19 |
| (n = 111) | (n = 207) | ||
| Fasting glucose (mmol/L) | 5.09 ± 0.44 | 4.83 ± 0.56 | 4.95 ± 0.52 |
| (n = 208) | |||
| Fasting insulin (pmol/L) | 79.50 ± 32.19 | 85.04 ± 38.20 | 82.51 ± 35.61 |
| (n = 206) | |||
| (n = 94) | |||
| Total-C (mmol/L) | 4.80 ± 0.99 | 4.83 ± 1.02 | 4.82 ± 1.01 |
| LDL-C (mmol/L) | 2.91 ± 0.87 | 2.70 ± 0.86 | 2.79 ± 0.87 |
| (n = 95) | (n = 207) | ||
| HDL-C (mmol/L) | 1.29 ± 0.31 | 1.61 ± 0.39 | 1.46 ± 0.39 |
| Triglycerides (mmol/L) | 1.32 ± 0.74 | 1.15 ± 0.53 | 1.23 ± 0.64 |
| ApoB (g/L) | 0.89 ± 0.25 | 0.84 ± 0.25 | 0.86 ± 0.25 |
| (n = 95) | (n = 207) |
| Genes | dbSNP No. 1 | Sequence 2 | Position | MAF | Genotype Frequency | ||
|---|---|---|---|---|---|---|---|
| RXRA | rs10881576 | GCGGGTG[C/T]GGACCGC | Intron | 0.28 | C/C | C/T | T/T |
| (n = 106) | (n = 86) | (n = 16) | |||||
| 0.51 | 0.414 | 0.077 | |||||
| rs7871655 | CAGAATT[C/G]CGGGTGA | Intron | 0.26 | G/G | C/G | C/C | |
| (n = 110) | (n = 87) | (n = 11) | |||||
| 0.529 | 0.418 | 0.053 | |||||
| rs12339187 | GGACCAG[A/G]TGTTTTA | Intron | 0.17 | A/A | A/G | G/G | |
| (n = 143) | (n = 60) | (n = 5) | |||||
| 0.688 | 0.289 | 0.024 | |||||
| rs11185660 | CTGTGTC[C/T]CTGGAGA | Intron | 0.27 | T/T | C/T | C/C | |
| (n = 109) | (n = 87) | (n = 12) | |||||
| 0.524 | 0.418 | 0.058 | |||||
| rs11103473 | TCTCTCC[A/T]AACTATT | Intron | 0.36 | A/A | A/T | T/T | |
| (n = 81) | (n = 105) | (n = 22) | |||||
| 0.389 | 0.505 | 0.106 | |||||
| rs10776909 | GTGGGGA[C/T]TTTGAGT | Intron | 0.23 | C/C | C/T | T/T | |
| (n = 120) | (n = 80) | (n = 8) | |||||
| 0.577 | 0.385 | 0.039 | |||||
| rs12004589 | GCTCCCT[G/T]CATGGCC | Intron | 0.08 | G/G | G/T | T/T | |
| (n = 178) | (n = 28) | (n = 2) | |||||
| 0.856 | 0.135 | 0.01 | |||||
| rs3132301 | TGCTGAG[C/T]CCCCCAG | Intron | 0.22 | C/C | C/T | T/T | |
| (n = 125) | (n = 76) | (n = 7) | |||||
| 0.601 | 0.365 | 0.034 | |||||
| rs1805352 | ATAGGGA[A/C]AAACCTG | Intron | 0.31 | A/A | A/C | C/C | |
| (n = 97) | (n = 95) | (n = 16) | |||||
| 0.466 | 0.457 | 0.077 | |||||
| rs3132294 | GAACACT[A/G]TGAACCG | Intron | 0.23 | G/G | A/G | A/A | |
| (n = 121) | (n = 77) | (n = 10) | |||||
| 0.582 | 0.37 | 0.048 | |||||
| rs1805343 | CTTGCCC[A/G]GCCCTCA | Intron | 0.37 | A/A | A/G | G/G | |
| (n = 85) | (n = 93) | (n = 30) | |||||
| 0.409 | 0.447 | 0.144 | |||||
| rs1045570 | CGTGGCC[G/T]CAGGTGC | 3′UTR | 0.16 | G/G | G/T | T/T | |
| (n = 146) | (n = 57) | (n = 5) | |||||
| 0.702 | 0.274 | 0.024 | |||||
| CPT1A | rs3019598 | GTGCCCC[C/T]GTTACCT | Intron | 0.35 | C/C | C/T | T/T |
| (n = 88) | (n = 93) | (n = 27) | |||||
| 0.423 | 0.447 | 0.13 | |||||
| rs897048 | GCTGTCA[C/G]ACCGGGC | Intron | 0.19 | C/C | C/G | G/G | |
| (n = 134) | (n = 68) | (n = 6) | |||||
| 0.644 | 0.327 | 0.029 | |||||
| rs7942147 | GGACACC[A/C]TGTGGCA | Intron | 0.16 | C/C | A/C | A/A | |
| (n = 144) | (n = 60) | (n = 4) | |||||
| 0.692 | 0.289 | 0.019 | |||||
| rs4930248 | TCAGGGT[C/T]GCTTTGG | Intron | 0.44 | T/T | C/T | C/C | |
| (n = 62) | (n = 108) | (n = 38) | |||||
| 0.298 | 0.519 | 0.183 | |||||
| rs11228364 | CTTCGAG[C/T]GCAGATC | Intron | 0.1 | C/C | C/T | T/T | |
| (n = 169) | (n = 36) | (n = 3) | |||||
| 0.813 | 0.173 | 0.014 | |||||
| rs11228368 | CCAGAAG[A/G]GGGCACA | Intron | 0.5 | G/G | A/G | A/A | |
| (n = 52) | (n = 105) | (n = 51) | |||||
| 0.25 | 0.505 | 0.245 | |||||
| rs10896371 | CTCGTTC[C/T]CACAAAT | Intron | 0.14 | T/T | C/T | C/C | |
| (n = 153) | (n = 51) | (n = 4) | |||||
| 0.736 | 0.245 | 0.019 | |||||
| rs1017640 | CTGGCCA[C/T]GTAATCA | Intron | 0.1 | C/C | C/T | T/T | |
| (n = 169) | (n = 37) | (n = 2) | |||||
| 0.813 | 0.178 | 0.01 | |||||
| rs613084 | TTCAGTG[A/C]CACACCC | Intron | 0.35 | C/C | A/C | A/A | |
| (n = 89) | (n = 93) | (n = 26) | |||||
| 0.428 | 0.447 | 0.125 | |||||
| ACADVL | rs2017365 | GGCACAT[A/G]GTCTCTG | NearGene-5 | 0.38 | A/A | A/G | G/G |
| (n = 81) | (n = 96) | (n = 31) | |||||
| 0.389 | 0.462 | 0.149 | |||||
| ACAA2 | rs529556 | ACTTTTT[C/T]AGGACTC | Intron | 0.43 | T/T | C/T | C/C |
| (n = 76) | (n = 85) | (n = 47) | |||||
| 0.365 | 0.409 | 0.226 | |||||
| rs10502901 | AAGCTAA[A/T]CTGTGTG | Intron | 0.06 | T/T | A/T | A/A | |
| (n = 184) | (n = 24) | (n = 0) | |||||
| 0.885 | 0.115 | 0 | |||||
| rs631536 | ATTGACT[A/G]TGGTTAC | Intron | 0.14 | A/A | A/G | G/G | |
| (n = 150) | (n = 56) | (n = 2) | |||||
| 0.721 | 0.269 | 0.01 | |||||
| rs1942421 | CTGTTCT[C/T]TCTTAAC | Intron | 0.36 | C/C | C/T | T/T | |
| (n = 91) | (n = 84) | (n = 33) | |||||
| 0.438 | 0.404 | 0.159 | |||||
| rs2276168 | AGTATCA[A/T]CACAAGG | Intron | 0.23 | A/A | A/T | T/T | |
| (n = 128) | (n = 66) | (n = 14) | |||||
| 0.615 | 0.317 | 0.067 | |||||
| rs7237253 | CCTTATA[A/G]TCATATT | 3′UTR | 0.1 | A/A | A/G | G/G | |
| (n = 170) | (n = 36) | (n = 2) | |||||
| 0.817 | 0.173 | 0.01 | |||||
| ABCD2 | rs4072006 | GAGAATG[A/G]CTAGAGG | NearGene-5 | 0.13 | G/G | A/G | A/G |
| (n = 159) | (n = 46) | (n = 3) | |||||
| 0.764 | 0.221 | 0.014 | |||||
| rs10877201 | CTATAAT[C/T]CTTTAAC | Intron | 0.2 | C/C | C/T | T/T | |
| (n = 132) | (n = 68) | (n = 8) | |||||
| 0.635 | 0.327 | 0.039 | |||||
| rs12582802 | GAGGTTT[A/G]TTTCCAA | Intron | 0.06 | A/A | A/G | G/G | |
| (n = 186) | (n = 21) | (n = 1) | |||||
| 0.894 | 0.101 | 0.005 | |||||
| rs4294600 | ACTAAAT[A/G]TCACTCA | 3′UTR | 0.12 | G/G | A/G | A/A | |
| (n = 161) | (n = 44) | (n = 3) | |||||
| 0.774 | 0.212 | 0.014 | |||||
| rs11172696 | AGGGAAA[C/T]ATTGTAT | Intron | 0.08 | T/T | C/T | C/C | |
| (n = 177) | (n = 29) | (n = 2) | |||||
| 0.851 | 0.139 | 0.01 | |||||
| rs10877173 | ACAAGTT[C/T]GGCTTTT | Intron | 0.07 | T/T | C/T | C/C | |
| (n = 184) | (n = 21) | (n = 3) | |||||
| 0.885 | 0.101 | 0.014 | |||||
| rs7133376 | GGTAAAG[A/G]TGTATGA | Intron | 0.2 | G/G | A/G | A/A | |
| (n = 132) | (n = 67) | (n = 9) | |||||
| 0.635 | 0.322 | 0.043 | |||||
| rs7968837 | ATATTAA[A/C]TTTACCA | 3′UTR | 0.27 | C/C | A/C | A/A | |
| (n = 109) | (n = 86) | (n = 13) | |||||
| 0.524 | 0.414 | 0.063 | |||||
| ACOX1 | rs10852766 | AAGAAAG[C/T]GCTCAGT | Intron | 0.43 | C/C | C/T | T/T |
| (n = 74) | (n = 90) | (n = 44) | |||||
| 0.356 | 0.433 | 0.212 | |||||
| rs3744033 | GCCTTCA[A/G]GGAGAAG | Intron | 0.17 | A/A | A/G | G/G | |
| (n = 142) | (n = 60) | (n = 6) | |||||
| 0.683 | 0.289 | 0.029 | |||||
| rs12430 | TCCCAGA[C/T]GTAGCAC | 3′UTR | 0.11 | C/C | C/T | T/T | |
| (n = 165) | (n = 39) | (n = 4) | |||||
| 0.793 | 0.188 | 0.019 | |||||
| rs8065144 | AAGCCTC[A/G]AAAATGG | Intron | 0.36 | A/A | A/G | G/G | |
| (n = 89) | (n = 90) | (n = 29) | |||||
| 0.428 | 0.433 | 0.139 | |||||
| rs11651351 | CTATTGC[C/T]GATCTCC | Intron | 0.05 | C/C | C/T | T/T | |
| (n = 188) | (n = 20) | (n = 0) | |||||
| 0.904 | 0.096 | 0 | |||||
| rs3643 | GTAGTTT[C/T]GCTTACC | 3′UTR | 0.12 | T/T | C/T | C/C | |
| (n = 166) | (n = 36) | (n = 6) | |||||
| 0.798 | 0.173 | 0.029 | |||||
| rs7213998 | TCTGAAA[C/T]GTCAGAG | Intron | 0.11 | C/C | C/T | T/T | |
| (n = 169) | (n = 34) | (n = 5) | |||||
| 0.813 | 0.164 | 0.024 | |||||
| rs17583163 | GATTTCC[C/T]CTGATGA | Intron | 0.08 | T/T | C/T | C/C | |
| (n = 176) | (nn = 1) | ||||||
| 0.846 | 0.149 | 0.005 | |||||
| ACAA1 | rs5875 | TACCATG[A/T]CATCAGT | 3′UTR | 0.14 | T/T | A/T | A/A |
| (n = 155) | (n = 48) | (n = 5) | |||||
| 0.745 | 0.231 | 0.024 | |||||
| rs2239621 | CCTTCTA[C/T]TCCTATG | Intron | 0.32 | C/C | C/T | T/T | |
| (n = 97) | (n = 90) | (n = 21) | |||||
| 0.466 | 0.433 | 0.101 | |||||
| rs156265 | TGGCCTT[C/G]TCCTTCT | Exon (missense Glu→Asp) | 0.16 | C/C | C/G | G/G | |
| (n = 149) | (n = 53) | (n = 6) | |||||
| 0.716 | 0.255 | 0.029 | |||||
| Dietary Intakes | Pre-Supplementation (n = 207) | Post-Supplementation (n = 208) | p-Value (Without n-3 PUFA) * | p-Value (With n-3 PUFA) * | |
|---|---|---|---|---|---|
| Without n-3 PUFA Supplements | Without n-3 PUFA Supplements | With n-3 PUFA Supplements | |||
| Energy (kcal) | 2273 ± 590 | 2144 ± 566 | 2186 ± 566 | <0.0001 | 0.006 |
| Carbohydrate (%) | 50.5 ± 7.2 | 49.4 ± 7.7 | 48.6 ± 7.8 | <0.05 | 0.0009 |
| Protein (%) | 17.4 ± 3.3 (n = 206) | 17.5 ± 3.4 | 17.0 ± 3.2 | 0.66 | 0.12 |
| Total fat (%) | 32.6 ± 6.0 | 33.3 ± 6.4 | 35.3 ± 6.3 | 0.15 | <0.0001 |
| SFA (%) | 11.2 ± 3.6 | 11.5 ± 3.3 | 10.4 ± 3.0 | 0.13 | 0.001 |
| MUFA (%) | 11.9 ± 2.8 | 12.0 ± 3.2 | 12.0 ± 3.3 | 0.45 | 0.65 |
| PUFA (%) | 5.9 ± 2.0 | 5.8 ± 2.1 | 7.0 ± 2.1 | 0.56 | <0.0001 |
3.2. Associations between Dietary Fat Intakes and the Plasma TG Response
3.3. Associations between tSNPs, Relative Gene Expression Levels and the Plasma TG Response Following Fish Oil Supplementation
3.4. Gene-Diet Interaction Effects on the Plasma TG Response and on the Gene Expression Response Following Fish Oil Supplementation
| Gene | tSNP | Genotype | β (Interaction Term) 1 | P Genotype 2 | P Dietary Fat Intake 2 | P Interaction Effect 2 |
|---|---|---|---|---|---|---|
| Total fat intakes (%) | ||||||
| RXRA | rs11185660 | C/C | 3.70 ± 1.16 | 0.004 | 0.0009 | 0.004 |
| C/T | 1.02 ± 0.61 | |||||
| T/T | 0 | |||||
| Saturated fat intakes (%) | ||||||
| RXRA | rs10881576 | T/T | 8.52 ± 2.61 | 0.007 | 0.0004 | 0.004 |
| C/T | 1.84 ± 1.21 | |||||
| C/C | 0 | |||||
| rs12339187 | A/G + G/G | 3.20 ± 1.25 | 0.02 | 0.005 | 0.01 | |
| A/A | 0 | |||||
| rs11185660 | C/C | 9.39 ± 2.66 | 0.003 | <0.0001 | 0.002 | |
| C/T | 1.69 ± 1.23 | |||||
| T/T | 0 | |||||
| Polyunsaturated fat intakes (%) | ||||||
| ACOX1 | rs17583163 | C/C + C/T | 6.79 ± 2.34 | 0.02 | 0.09 | 0.004 |
| T/T | 0 | |||||
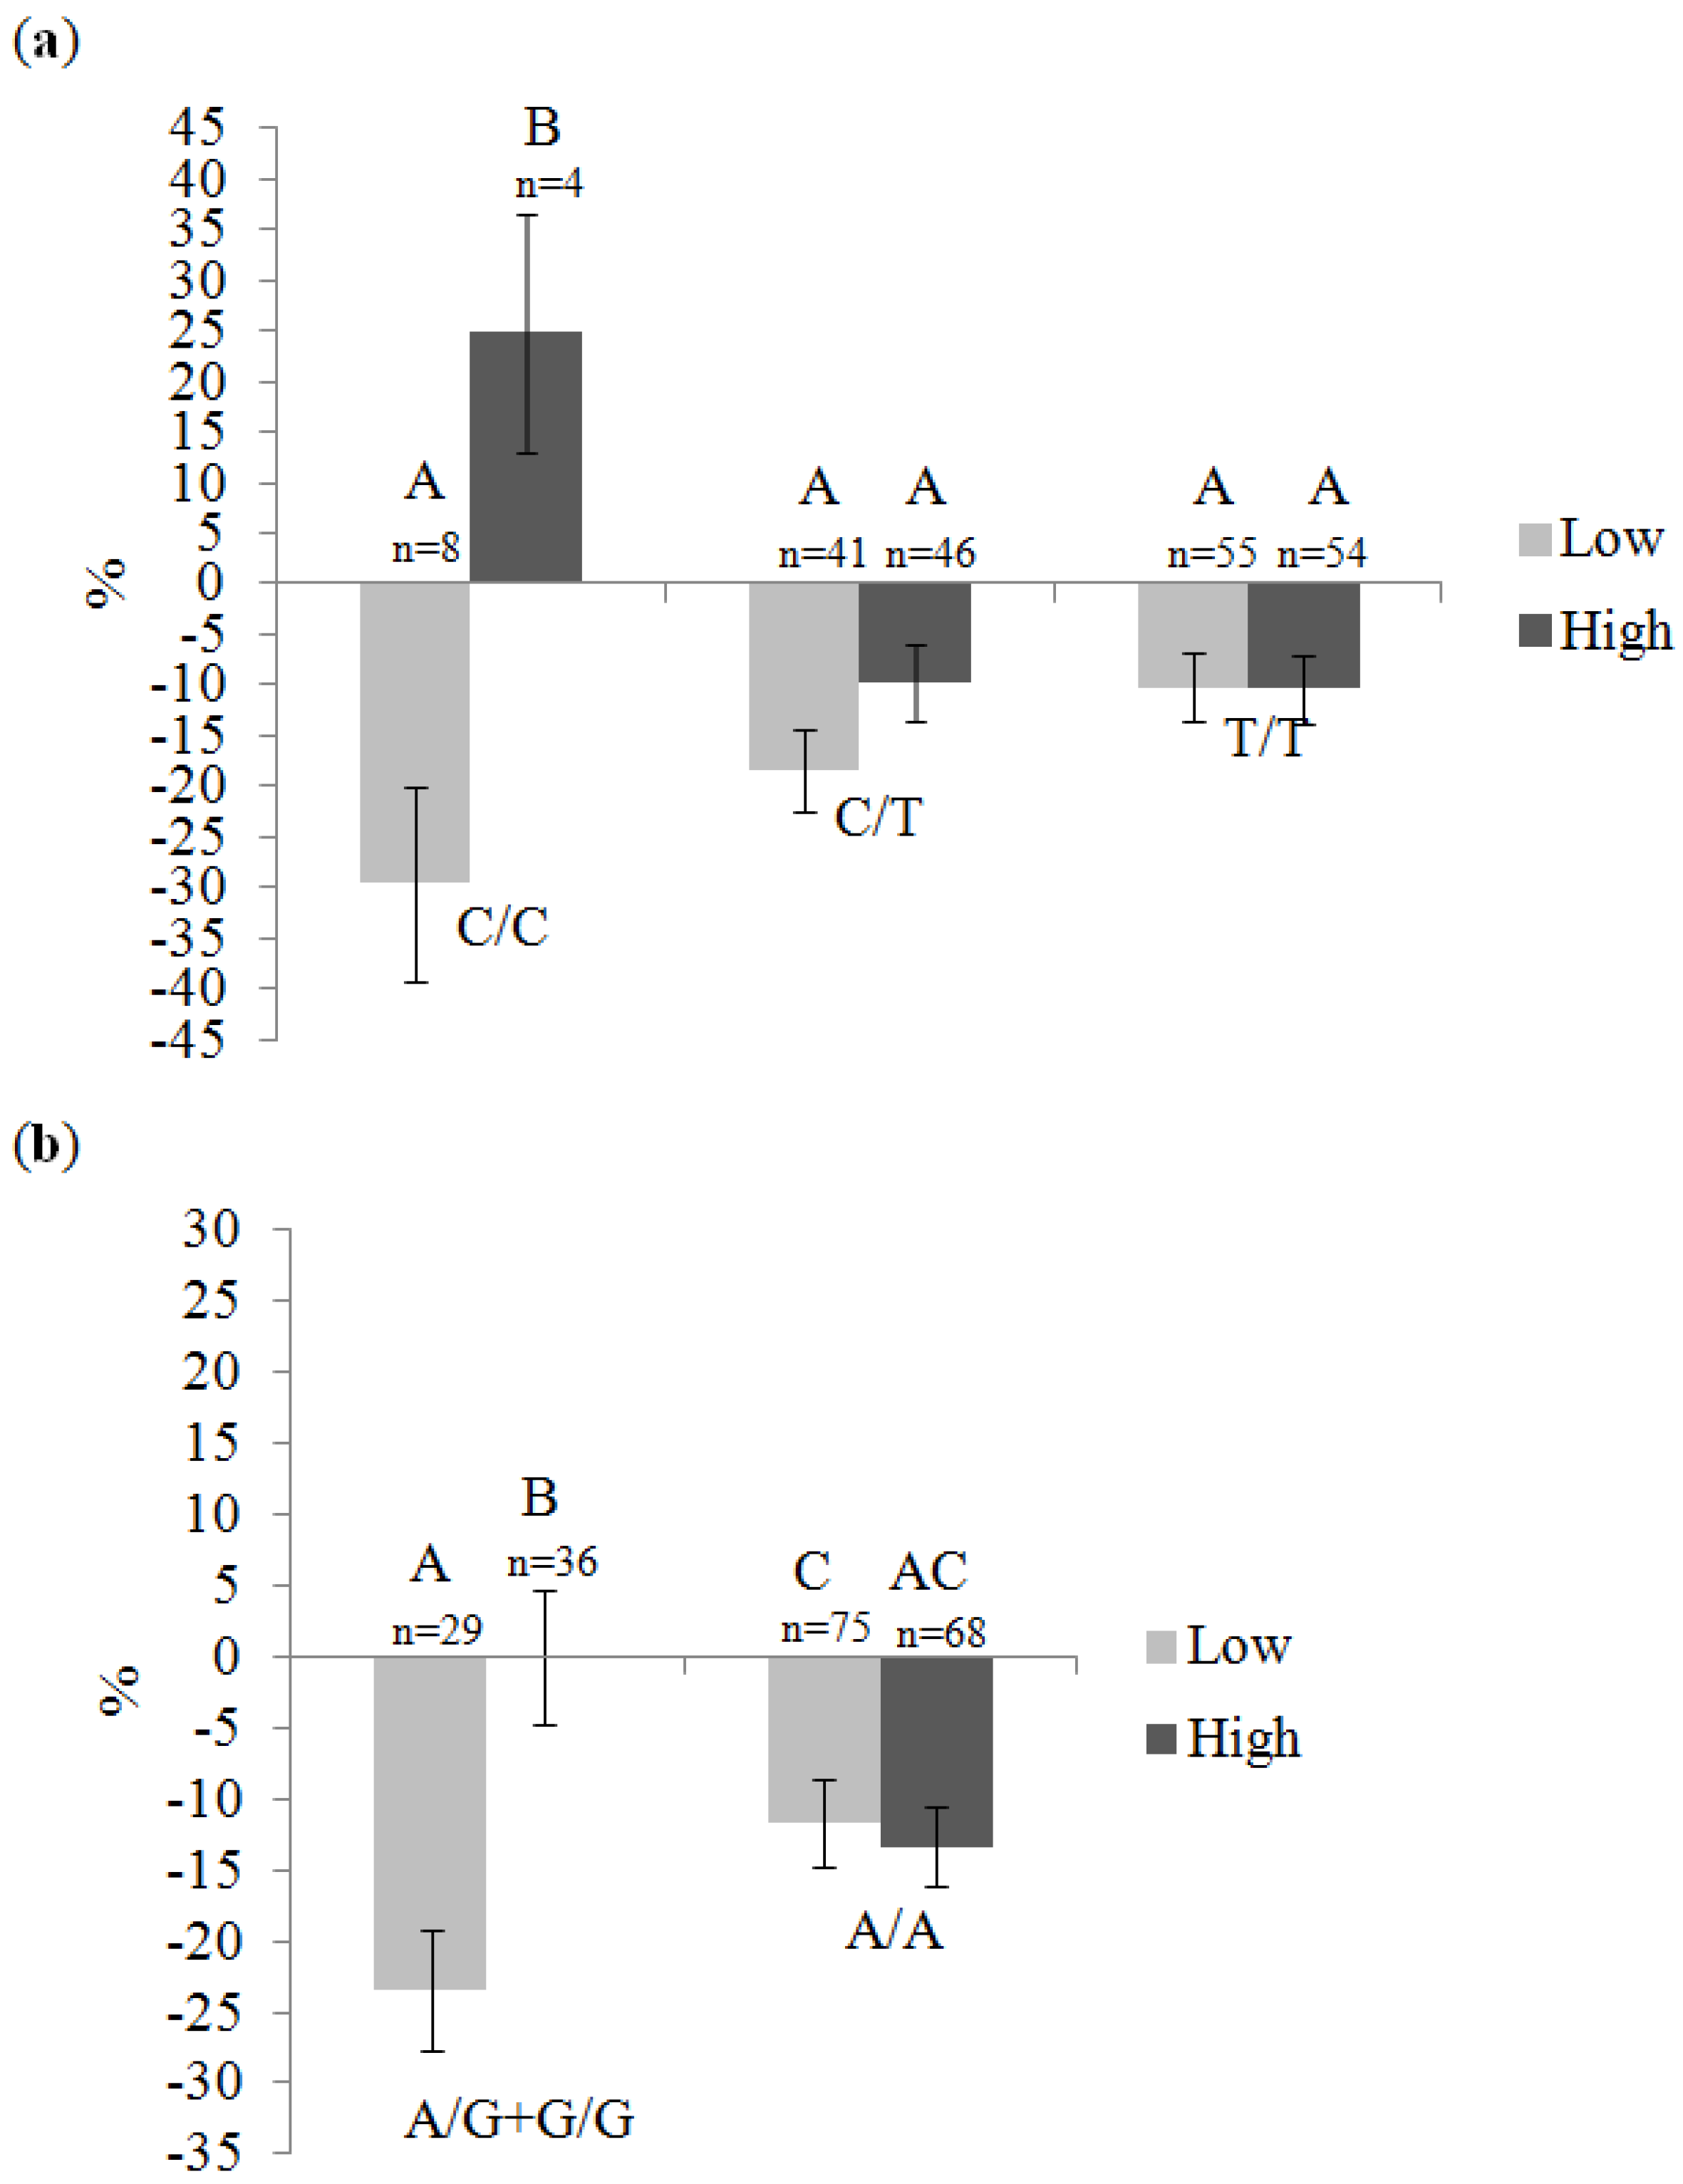
| Gene | SNP | Genotype | Total Fat Intake 1 | p 2 | |
|---|---|---|---|---|---|
| Low (≤35.23%) | High (>35.23%) | ||||
| RXRA | rs11185660 | C/C | 1.12-fold (n = 7) | −1.14-fold (n = 5) | 0.52 |
| C/T | −1.05-fold (n = 43) | −1.04-fold (n = 44) | 0.86 | ||
| T/T | 1.05-fold (n = 54) | −1.08-fold (n = 53) | 0.01 | ||
| Gene | SNP | Genotype | Saturated Fat Intake 1 | p 2 | |
| Low (≤10.48%) | High (>10.48%) | ||||
| RXRA | rs12339187 | A/G + G/G | −1.07-fold (n = 29) | −1.05-fold (n = 36) | 0.92 |
| A/A | 1.04-fold (n = 74) | −1.06-fold (n = 67) | 0.06 | ||
4. Discussion
5. Conclusions
Supplementary Files
Acknowledgments
Conflicts of Interest
References
- National Cholesterol Education Program (NCEP) Expert Panel on Detection, Evaluation, and Treatment of High Blood Cholesterol in Adults (Adult Treatment Panel III). Third Report of the National Cholesterol Education Program (NCEP) Expert Panel on Detection, Evaluation, and Treatment of High Blood Cholesterol in Adults (Adult Treatment Panel III) final report. Circulation 2002, 106, 3143–3421. [Google Scholar]
- Elder, S.J.; Lichtenstein, A.H.; Pittas, A.G.; Roberts, S.B.; Fuss, P.J.; Greenberg, A.S.; McCrory, M.A.; Bouchard, T.J., Jr.; Saltzman, E.; Neale, M.C. Genetic and environmental influences on factors associated with cardiovascular disease and the metabolic syndrome. J. Lipid Res. 2009, 50, 1917–1926. [Google Scholar] [CrossRef]
- Jermendy, G.; Horvath, T.; Littvay, L.; Steinbach, R.; Jermendy, A.L.; Tarnoki, A.D.; Tarnoki, D.L.; Metneki, J.; Osztovits, J. Effect of genetic and environmental influences on cardiometabolic risk factors: A twin study. Cardiovasc. Diabetol. 2011, 10, 96. [Google Scholar] [CrossRef] [Green Version]
- Sacks, F.M.; Katan, M. Randomized clinical trials on the effects of dietary fat and carbohydrate on plasma lipoproteins and cardiovascular disease. Am. J. Med. 2002, 113, 13S–24S. [Google Scholar]
- Singh, A.; Schwartzbard, A.; Gianos, E.; Berger, J.S.; Weintraub, H. What should we do about Hypertriglyceridemia in Coronary Artery Disease Patients? Curr. Treat. Options Cardiovasc. Med. 2013, 15, 104–117. [Google Scholar] [CrossRef]
- Sullivan, S. Implications of diet on nonalcoholic fatty liver disease. Curr. Opin. Gastroenterol. 2010, 26, 160–164. [Google Scholar] [CrossRef]
- Lottenberg, A.M.; Afonso, M.S.; Lavrador, M.S.; Machado, R.M.; Nakandakare, E.R. The role of dietary fatty acids in the pathology of metabolic syndrome. J. Nutr. Biochem. 2012, 23, 1027–1040. [Google Scholar] [CrossRef]
- Fabbrini, E.; Magkos, F.; Mohammed, B.S.; Pietka, T.; Abumrad, N.A.; Patterson, B.W.; Okunade, A.; Klein, S. Intrahepatic fat, not visceral fat, is linked with metabolic complications of obesity. Proc. Natl. Acad. Sci. USA 2009, 106, 15430–15435. [Google Scholar] [CrossRef]
- Caslake, M.J.; Miles, E.A.; Kofler, B.M.; Lietz, G.; Curtis, P.; Armah, C.K.; Kimber, A.C.; Grew, J.P.; Farrell, L.; Stannard, J.; et al. Effect of sex and genotype on cardiovascular biomarker response to fish oils: The FINGEN Study. Am. J. Clin. Nutr. 2008, 88, 618–629. [Google Scholar]
- Madden, J.; Williams, C.M.; Calder, P.C.; Lietz, G.; Miles, E.A.; Cordell, H.; Mathers, J.C.; Minihane, A.M. The impact of common gene variants on the response of biomarkers of cardiovascular disease (CVD) risk to increased fish oil fatty acids intakes. Annu. Rev. Nutr. 2011, 31, 203–234. [Google Scholar] [CrossRef]
- Cormier, H.; Rudkowska, I.; Paradis, A.M.; Thifault, E.; Garneau, V.; Lemieux, S.; Couture, P.; Vohl, M.C. Association between polymorphisms in the fatty acid desaturase gene cluster and the plasma triacylglycerol response to an n-3 PUFA supplementation. Nutrients 2012, 4, 1026–1041. [Google Scholar] [CrossRef]
- Shearer, G.C.; Savinova, O.V.; Harris, W.S. Fish oil—How does it reduce plasma triglycerides? Biochim. Biophys. Acta 2012, 1821, 843–851. [Google Scholar] [CrossRef]
- Jump, D.B. n-3 Polyunsaturated fatty acid regulation of hepatic gene transcription. Curr. Opin. Lipidol. 2008, 19, 242–247. [Google Scholar] [CrossRef]
- Pyper, S.R.; Viswakarma, N.; Yu, S.; Reddy, J.K. PPARalpha: Energy combustion, hypolipidemia, inflammation and cancer. Nucl. Recept. Signal. 2010, 8, e002. [Google Scholar]
- Guo, Y.; Jolly, R.A.; Halstead, B.W.; Baker, T.K.; Stutz, J.P.; Huffman, M.; Calley, J.N.; West, A.; Gao, H.; Searfoss, G.H.; et al. Underlying mechanisms of pharmacology and toxicity of a novel PPAR agonist revealed using rodent and canine hepatocytes. Toxicol. Sci. 2007, 96, 294–309. [Google Scholar]
- Fourcade, S.; Savary, S.; Albet, S.; Gauthe, D.; Gondcaille, C.; Pineau, T.; Bellenger, J.; Bentejac, M.; Holzinger, A.; Berger, J.; et al. Fibrate induction of the adrenoleukodystrophy-related gene (ABCD2): Promoter analysis and role of the peroxisome proliferator-activated receptor PPARα. Eur. J. Biochem. 2001, 268, 3490–3500. [Google Scholar] [CrossRef]
- Lima, L.O.; Almeida, S.; Hutz, M.H.; Fiegenbaum, M. PPARA, RXRA, NR1I2 and NR1I3 gene polymorphisms and lipid and lipoprotein levels in a Southern Brazilian population. Mol. Biol. Rep. 2013, 40, 1241–1247. [Google Scholar] [CrossRef]
- Peloso, G.M.; Demissie, S.; Collins, D.; Mirel, D.B.; Gabriel, S.B.; Cupples, L.A.; Robins, S.J.; Schaefer, E.J.; Brousseau, M.E. Common genetic variation in multiple metabolic pathways influences susceptibility to low HDL-cholesterol and coronary heart disease. J. Lipid Res. 2010, 51, 3524–3532. [Google Scholar] [CrossRef]
- Shi, H.; Yu, X.; Li, Q.; Ye, X.; Gao, Y.; Ma, J.; Cheng, J.; Lu, Y.; Du, W.; Du, J.; et al. Association between PPAR-gamma and RXR-α gene polymorphism and metabolic syndrome risk: A case-control study of a Chinese Han population. Arch. Med. Res. 2012, 43, 233–242. [Google Scholar] [CrossRef]
- Lemas, D.J.; Wiener, H.W.; O’Brien, D.M.; Hopkins, S.; Stanhope, K.L.; Havel, P.J.; Allison, D.B.; Fernandez, J.R.; Tiwari, H.K.; Boyer, B.B. Genetic polymorphisms in carnitine palmitoyltransferase 1A gene are associated with variation in body composition and fasting lipid traits in Yup’ik Eskimos. J. Lipid Res. 2012, 53, 175–184. [Google Scholar] [CrossRef]
- Robitaille, J.; Houde, A.; Lemieux, S.; Perusse, L.; Gaudet, D.; Vohl, M.C. Variants within the muscle and liver isoforms of the carnitine palmitoyltransferase I (CPT1) gene interact with fat intake to modulate indices of obesity in French-Canadians. J. Mol. Med. 2007, 85, 129–137. [Google Scholar] [CrossRef]
- Lohman, T.; Roche, A.; Martorell, R. Anthropometric Standardization Reference Manual; Human Kinetics Publishers: Champaign, IL, USA, 1988; pp. 39–80. [Google Scholar]
- McNamara, J.R.; Schaefer, E.J. Automated enzymatic standardized lipid analyses for plasma and lipoprotein fractions. Clin. Chim. Acta 1987, 166, 1–8. [Google Scholar] [CrossRef]
- Burstein, M.; Samaille, J. On a rapid determination of the cholesterol bound to the serum α- and β-lipoproteins. Clin. Chim. Acta 1960, 5, 609. [Google Scholar] [CrossRef]
- Albers, J.J.; Warnick, G.R.; Wiebe, D.; King, P.; Steiner, P.; Smith, L.; Breckenridge, C.; Chow, A.; Kuba, K.; Weidman, S.; et al. Multi-laboratory comparison of three heparin-Mn2+ precipitation procedures for estimating cholesterol in high-density lipoprotein. Clin. Chem. 1978, 24, 853–856. [Google Scholar]
- Friedewald, W.T.; Levy, R.I.; Fredrickson, D.S. Estimation of the concentration of low-density lipoprotein cholesterol in plasma, without use of the preparative ultracentrifuge. Clin. Chem. 1972, 18, 499–502. [Google Scholar]
- Laurell, C.B. Quantitative estimation of proteins by electrophoresis in agarose gel containing antibodies. Anal. Biochem. 1966, 15, 45–52. [Google Scholar] [CrossRef]
- Livak, K.J. Allelic discrimination using fluorogenic probes and the 5’ nuclease assay. Genet. Anal. 1999, 14, 143–149. [Google Scholar] [CrossRef]
- SAS/STAT® software, version 9.3; SAS Institute Inc.: Cary, NC, USA, 2011.
- Schmittgen, T.D.; Livak, K.J. Analyzing real-time PCR data by the comparative C(T) method. Nat. Protoc. 2008, 3, 1101–1108. [Google Scholar] [CrossRef]
- Livak, K.J.; Schmittgen, T.D. Analysis of relative gene expression data using real-time quantitative PCR and the 2(-Delta Delta C(T)) Method. Methods 2001, 25, 402–408. [Google Scholar] [CrossRef]
- Vue d’ensemble des Habitudes Alimentaires des Canadiens. Available online: http://www5.statcan.gc.ca/bsolc/olc-cel/olc-cel?catno=82-620-MIF2006002&lang=fra (accessed on 3 March 2013).
- Les Adultes Canadiens Comblent-Ils leur Besoins en Nutriments Uniquement Grâce à L’alimentation? Available online: http://www.hc-sc.gc.ca/fn-an/surveill/nutrition/commun/art-nutr-adult-fra.php (accessed on 5 May 2013).
- Harden, C.J.; Jones, A.N.; Maya-Jimenez, T.; Barker, M.E.; Hepburn, N.J.; Garaiova, I.; Plummer, S.F.; Corfe, B.M. Effect of different long-chain fatty acids on cholecystokinin release in vitro and energy intake in free-living healthy males. Br. J. Nutr. 2012, 108, 755–758. [Google Scholar] [CrossRef]
- Holden, J.D. Hawthorne effects and research into professional practice. J. Eval. Clin. Pract. 2001, 7, 65–70. [Google Scholar]
- Hayhurst, G.P.; Lee, Y.H.; Lambert, G.; Ward, J.M.; Gonzalez, F.J. Hepatocyte nuclear factor 4α (nuclear receptor 2A1) is essential for maintenance of hepatic gene expression and lipid homeostasis. Mol. Cell Biol. 2001, 21, 1393–1403. [Google Scholar] [CrossRef]
- Ceccarelli, V.; Nocentini, G.; Riccardi, C.; Ayroldi, E.; Di, N.P.; Roberti, R.; Binaglia, L.; Vecchini, A. Effect of dietary saturated fatty acids on HNF-4α DNA binding activity and ApoCIII mRNA in sedentary rat liver. Mol. Cell Biochem. 2011, 347, 29–39. [Google Scholar] [CrossRef]
- Harris, W.S.; Bulchandani, D. Why do omega-3 fatty acids lower serum triglycerides? Curr. Opin. Lipidol. 2006, 17, 387–393. [Google Scholar]
- Mozaffarian, D.; Wu, J.H. Omega-3 fatty acids and cardiovascular disease: effects on risk factors, molecular pathways, and clinical events. J. Am. Coll. Cardiol. 2011, 58, 2047–2067. [Google Scholar] [CrossRef]
- Ahuja, H.S.; Szanto, A.; Nagy, L.; Davies, P.J. The retinoid X receptor and its ligands: Versatile regulators of metabolic function, cell differentiation and cell death. J. Biol. Regul. Homeost. Agents 2003, 17, 29–45. [Google Scholar]
- Xu, H.E.; Lambert, M.H.; Montana, V.G.; Parks, D.J.; Blanchard, S.G.; Brown, P.J.; Sternbach, D.D.; Lehmann, J.M.; Wisely, G.B.; Willson, T.M.; et al. Molecular recognition of fatty acids by peroxisome proliferator-activated receptors. Mol. Cell 1999, 3, 397–403. [Google Scholar]
- Varanasi, U.; Chu, R.; Huang, Q.; Castellon, R.; Yeldandi, A.V.; Reddy, J.K. Identification of a peroxisome proliferator-responsive element upstream of the human peroxisomal fatty acyl coenzyme A oxidase gene. J. Biol. Chem. 1996, 271, 2147–2155. [Google Scholar]
- Baillie, R.A.; Takada, R.; Nakamura, M.; Clarke, S.D. Coordinate induction of peroxisomal acyl-CoA oxidase and UCP-3 by dietary fish oil: A mechanism for decreased body fat deposition. Prostaglandins Leukot. Essent. Fatty Acids 1999, 60, 351–356. [Google Scholar] [CrossRef]
- McGarry, J.D.; Sen, A.; Esser, V.; Woeltje, K.F.; Weis, B.; Foster, D.W. New insights into the mitochondrial carnitine palmitoyltransferase enzyme system. Biochimie 1991, 73, 77–84. [Google Scholar]
- Flachs, P.; Horakova, O.; Brauner, P.; Rossmeisl, M.; Pecina, P.; Franssen-van, H.N.; Ruzickova, J.; Sponarova, J.; Drahota, Z.; Vlcek, C.; et al. Polyunsaturated fatty acids of marine origin upregulate mitochondrial biogenesis and induce β-oxidation in white fat. Diabetologia 2005, 48, 2365–2375. [Google Scholar] [CrossRef]
- Radler, U.; Stangl, H.; Lechner, S.; Lienbacher, G.; Krepp, R.; Zeller, E.; Brachinger, M.; Eller-Berndl, D.; Fischer, A.; Anzur, C.; et al. A combination of (omega-3) polyunsaturated fatty acids, polyphenols and l-carnitine reduces the plasma lipid levels and increases the expression of genes involved in fatty acid oxidation in human peripheral blood mononuclear cells and HepG2 cells. Ann. Nutr. Metab. 2011, 58, 133–140. [Google Scholar] [CrossRef]
© 2014 by the authors; licensee MDPI, Basel, Switzerland. This article is an open access article distributed under the terms and conditions of the Creative Commons Attribution license (http://creativecommons.org/licenses/by/3.0/).
Share and Cite
Bouchard-Mercier, A.; Rudkowska, I.; Lemieux, S.; Couture, P.; Vohl, M.-C. Polymorphisms in Genes Involved in Fatty Acid β-Oxidation Interact with Dietary Fat Intakes to Modulate the Plasma TG Response to a Fish Oil Supplementation. Nutrients 2014, 6, 1145-1163. https://doi.org/10.3390/nu6031145
Bouchard-Mercier A, Rudkowska I, Lemieux S, Couture P, Vohl M-C. Polymorphisms in Genes Involved in Fatty Acid β-Oxidation Interact with Dietary Fat Intakes to Modulate the Plasma TG Response to a Fish Oil Supplementation. Nutrients. 2014; 6(3):1145-1163. https://doi.org/10.3390/nu6031145
Chicago/Turabian StyleBouchard-Mercier, Annie, Iwona Rudkowska, Simone Lemieux, Patrick Couture, and Marie-Claude Vohl. 2014. "Polymorphisms in Genes Involved in Fatty Acid β-Oxidation Interact with Dietary Fat Intakes to Modulate the Plasma TG Response to a Fish Oil Supplementation" Nutrients 6, no. 3: 1145-1163. https://doi.org/10.3390/nu6031145