Article

DNA Hypermethylation of the Serotonin Receptor Type-2A Gene Is Associated with a Worse Response to a Weight Loss Intervention in Subjects with Metabolic Syndrome

by
Aurora Perez-Cornago
1,
Maria L. Mansego
1,
María Angeles Zulet
1,2 and
José Alfredo Martinez
1,2,*
1
Department of Nutrition, Food Science and Physiology, Center for Nutrition Research, University of Navarra, C/Irunlarrea 1, 31008-Pamplona, Spain
2
CIBER Fisiopatología Obesidad y Nutrición (CIBERObn), Instituto de Salud Carlos III, Santiago de Compostela 15706, Spain
*
Author to whom correspondence should be addressed.
Nutrients 2014, 6(6), 2387-2403; https://doi.org/10.3390/nu6062387
Submission received: 11 April 2014 / Revised: 11 June 2014 / Accepted: 16 June 2014 / Published: 23 June 2014
(This article belongs to the Special Issue Nutritional Epigenetics)

Abstract

:
Understanding the regulation of gene activities depending on DNA methylation has been the subject of much recent study. However, although polymorphisms of the HTR2A gene have been associated with both obesity and psychiatric disorders, the role of HTR2A gene methylation in these illnesses remains uncertain. The aim of this study was to evaluate the association of HTR2A gene promoter methylation levels in white blood cells (WBC) with obesity traits and depressive symptoms in individuals with metabolic syndrome (MetS) enrolled in a behavioural weight loss programme. Analyses were based on 41 volunteers (mean age 49 ± 1 year) recruited within the RESMENA study. Depressive symptoms (as determined using the Beck Depression Inventory), anthropometric and biochemical measurements were analysed at the beginning and after six months of weight loss treatment. At baseline, DNA from WBC was isolated and cytosine methylation in the HTR2A gene promoter was quantified by a microarray approach. In the whole-study sample, a positive association of HTR2A gene methylation with waist circumference and insulin levels was detected at baseline. Obesity measures significantly improved after six months of dietary treatment, where a lower mean HTR2A gene methylation at baseline was associated with major reductions in body weight, BMI and fat mass after the treatment. Moreover, mean HTR2A gene methylation at baseline significantly predicted the decrease in depressive symptoms after the weight loss treatment. In conclusion, this study provides newer evidence that hypermethylation of the HTR2A gene in WBC at baseline is significantly associated with a worse response to a weight-loss intervention and with a lower decrease in depressive symptoms after the dietary treatment in subjects with MetS.

1. Introduction

Depressive disorders are a significant cause of disability in developed countries and their prevalence is expected to increase in the coming years [1]. This psychiatric disease has been suggested to be often related to the metabolic syndrome (MetS), a state characterized by a combination of central obesity, peripheral insulin resistance, hypertension and serum lipid abnormalities [2,3]. Different theories exist concerning the MetS-depression relationship, but most suggest that it is bidirectional and mediated by several common mechanisms, such as low-grade inflammation, unhealthy dietary habits and genetic factors [4,5].
Indeed, lifestyle and genetic factors affect both depression and MetS [6,7]. Moreover, recent studies have provided evidence that the pathogenesis of these diseases may be also influenced by epigenetic marks [8,9]. In this context, epigenetics is defined as the study of heritable changes in gene expression that, unlike polymorphisms, occur without changes in the DNA sequence and are not permanent [6]. Therefore, epigenetic mechanisms may be capable of explaining some interactions between genetic and environmental factors (e.g., diet, physical activity or drugs), regulating gene expression over the entire lifetime of the organism [10]. Epigenetic changes include multiple processes such as covalent histone modifications, chromatin folding or microRNA abnormalities or DNA methylation of cytosine-phosphate-guanine (CpG) residues, which is probably the issue which has most extensively been studied [6,10]. Whole-genome analysis has often shown an inverse association between DNA methylation and gene expression, especially in the promoter region [11]. Moreover, DNA methylation has been demonstrated to be a predictive tool in the assessment of responses to a nutritional intervention [9,12].
Serotonin (5-HT) is a monoamine neurotransmitter involved in the regulation of important functions such as body temperature, sleep, pain, mood or energy balance [13,14]. Thus, disturbances of the serotonergic pathway have been implicated in both MetS and depressive disorders [13]. There are multiple 5-HT receptors, each with several subtypes and different biological roles [15]. Among them the serotonin 2A receptor, which is encoded by the 5-hydroxytryptamine receptor 2A (HTR2A) gene [16], has been involved in the pathogenesis of major psychiatric disorders and obesity [17,18]. In addition to several single nucleotide polymorphisms (SNPs) that have been reported for the HTR2A gene [18], DNA methylation factors have also been implicated in the regulation of HTR2A gene expression [19]. However, results have been both diverse and inconclusive [16,20,21].
The goal of the present study was to assess the association of HTR2A gene promoter methylation levels with obesity measures (e.g., BMI, body weight or fat mass) and depressive symptoms. We tested this hypothesis by determining HTR2A gene promoter methylation levels in white blood cells (WBC) of subjects with MetS enrolled in a behavioural weight-loss programme, and then by comparing these methylation levels with both baseline and follow-up obesity traits and depressive symptoms.

2. Materials and Methods

2.1. Subjects and Study Protocol

The present research is a secondary analysis of the RESMENA (Metabolic Syndrome Reduction in Navarra) project which is a randomized controlled trial, focused on improving MetS features through two dietary strategies (the control and the RESMENA diets) designed for weight loss during a six-month period [9,22,23,24,25]. Both diets were designed following the same energy restriction (−30% of the studied requirements), cholesterol (>300 mg/day) and fibre content (20–25 g/day). The control diet was based on the American Heart Association (AHA) guidelines, including 3–5 meals/day, a macronutrient distribution of 55% total caloric value (TCV) from carbohydrates, 15% proteins and 30% lipids. On the other hand, the RESMENA diet was designed with a higher meal frequency, consisting of 7 meals/day, and a macronutrient distribution of 40% TCV from carbohydrates, 30% proteins and 30% lipids, as described elsewhere [23].
In this analysis within the RESMENA study, 41 Caucasian adults of the two arms of the study were pooled [23,24,25,26]. The study was approved by the Ethics Committee of the University of Navarra (065/2009) and appropriately registered at Clinical Trials.gov; NCT01087086. Each participant provided written informed consent for participation in agreement with the Declaration of Helsinki. This research was performed following the CONSORT 2010 guidelines. This study was conducted in the Metabolic Unit of the University of Navarra in Pamplona, Spain, over a period of 23 months (from January 2010 to November 2011) [23]. Details of the design and methods of this trial have been reported elsewhere [26].

2.2. Anthropometry and Blood Pressure

Anthropometric measurements were taken with participants in fasting conditions and wearing only their underwear and using previously validated procedures [26]. Body mass index (BMI) was determined as the body weight divided by the squared height (kg/m2). Systolic (SBP) and diastolic (DBP) blood pressures were measured following standardized World Health Organization criteria [27]. Body composition was specifically measured by a dual-energy X-ray absorptiometry (DEXA Lunar Prodigy, GE Medical Systems, Madison, WI, USA). Anthropometric measurements as well as blood pressure determinations were carried out at the beginning and at the end point of the intervention.

2.3. Biochemical Analysis

Venous blood samples were taken at baseline and at the end of the study after a 12 h overnight fast period by venipuncture. The EDTA–plasma and serum samples as well as WBC were separated from whole blood by centrifugation at 3500 rpm, 5 °C, 15 min (Model 5804R, Eppendorf, Germany), and were frozen immediately at −80 °C until assay (WBC in buffy-coat with and without Trizol reagent (Invitrogen, Carlsbad, CA, USA) as described elsewhere [9,28,29].
Serum glucose, total cholesterol, triglycerides, and non-esterified fatty acids (NEFAs) were measured in a Pentra autoanalyser C-200 (HORIBA ABX, Madrid, Spain) with commercially available kits. Serum fasting insulin was measured by an enzyme immunoassay kit (Mercodia, Uppsala, Sweden).

2.4. Psychological Assessment

Symptoms of depression were assessed at the beginning and at the end of the study using the validated Spanish version of the Beck Depression Inventory (BDI) as published elsewhere [30]. The BDI is a 21-item test that measures the presence and degree of depressive symptoms in respondents. Scores can range from 0 to 63, with a score of 10 or higher indicating moderate depressive symptoms. Question number 19 of the test, relating to weight loss, was discarded from all the analyses given that losing weight is considered a manifestation of depression. However, in our volunteers, it was considered a positive aspect because they were enrolled in a weight loss treatment programme [23].

2.5. DNA Isolation and DNA Methylation Study
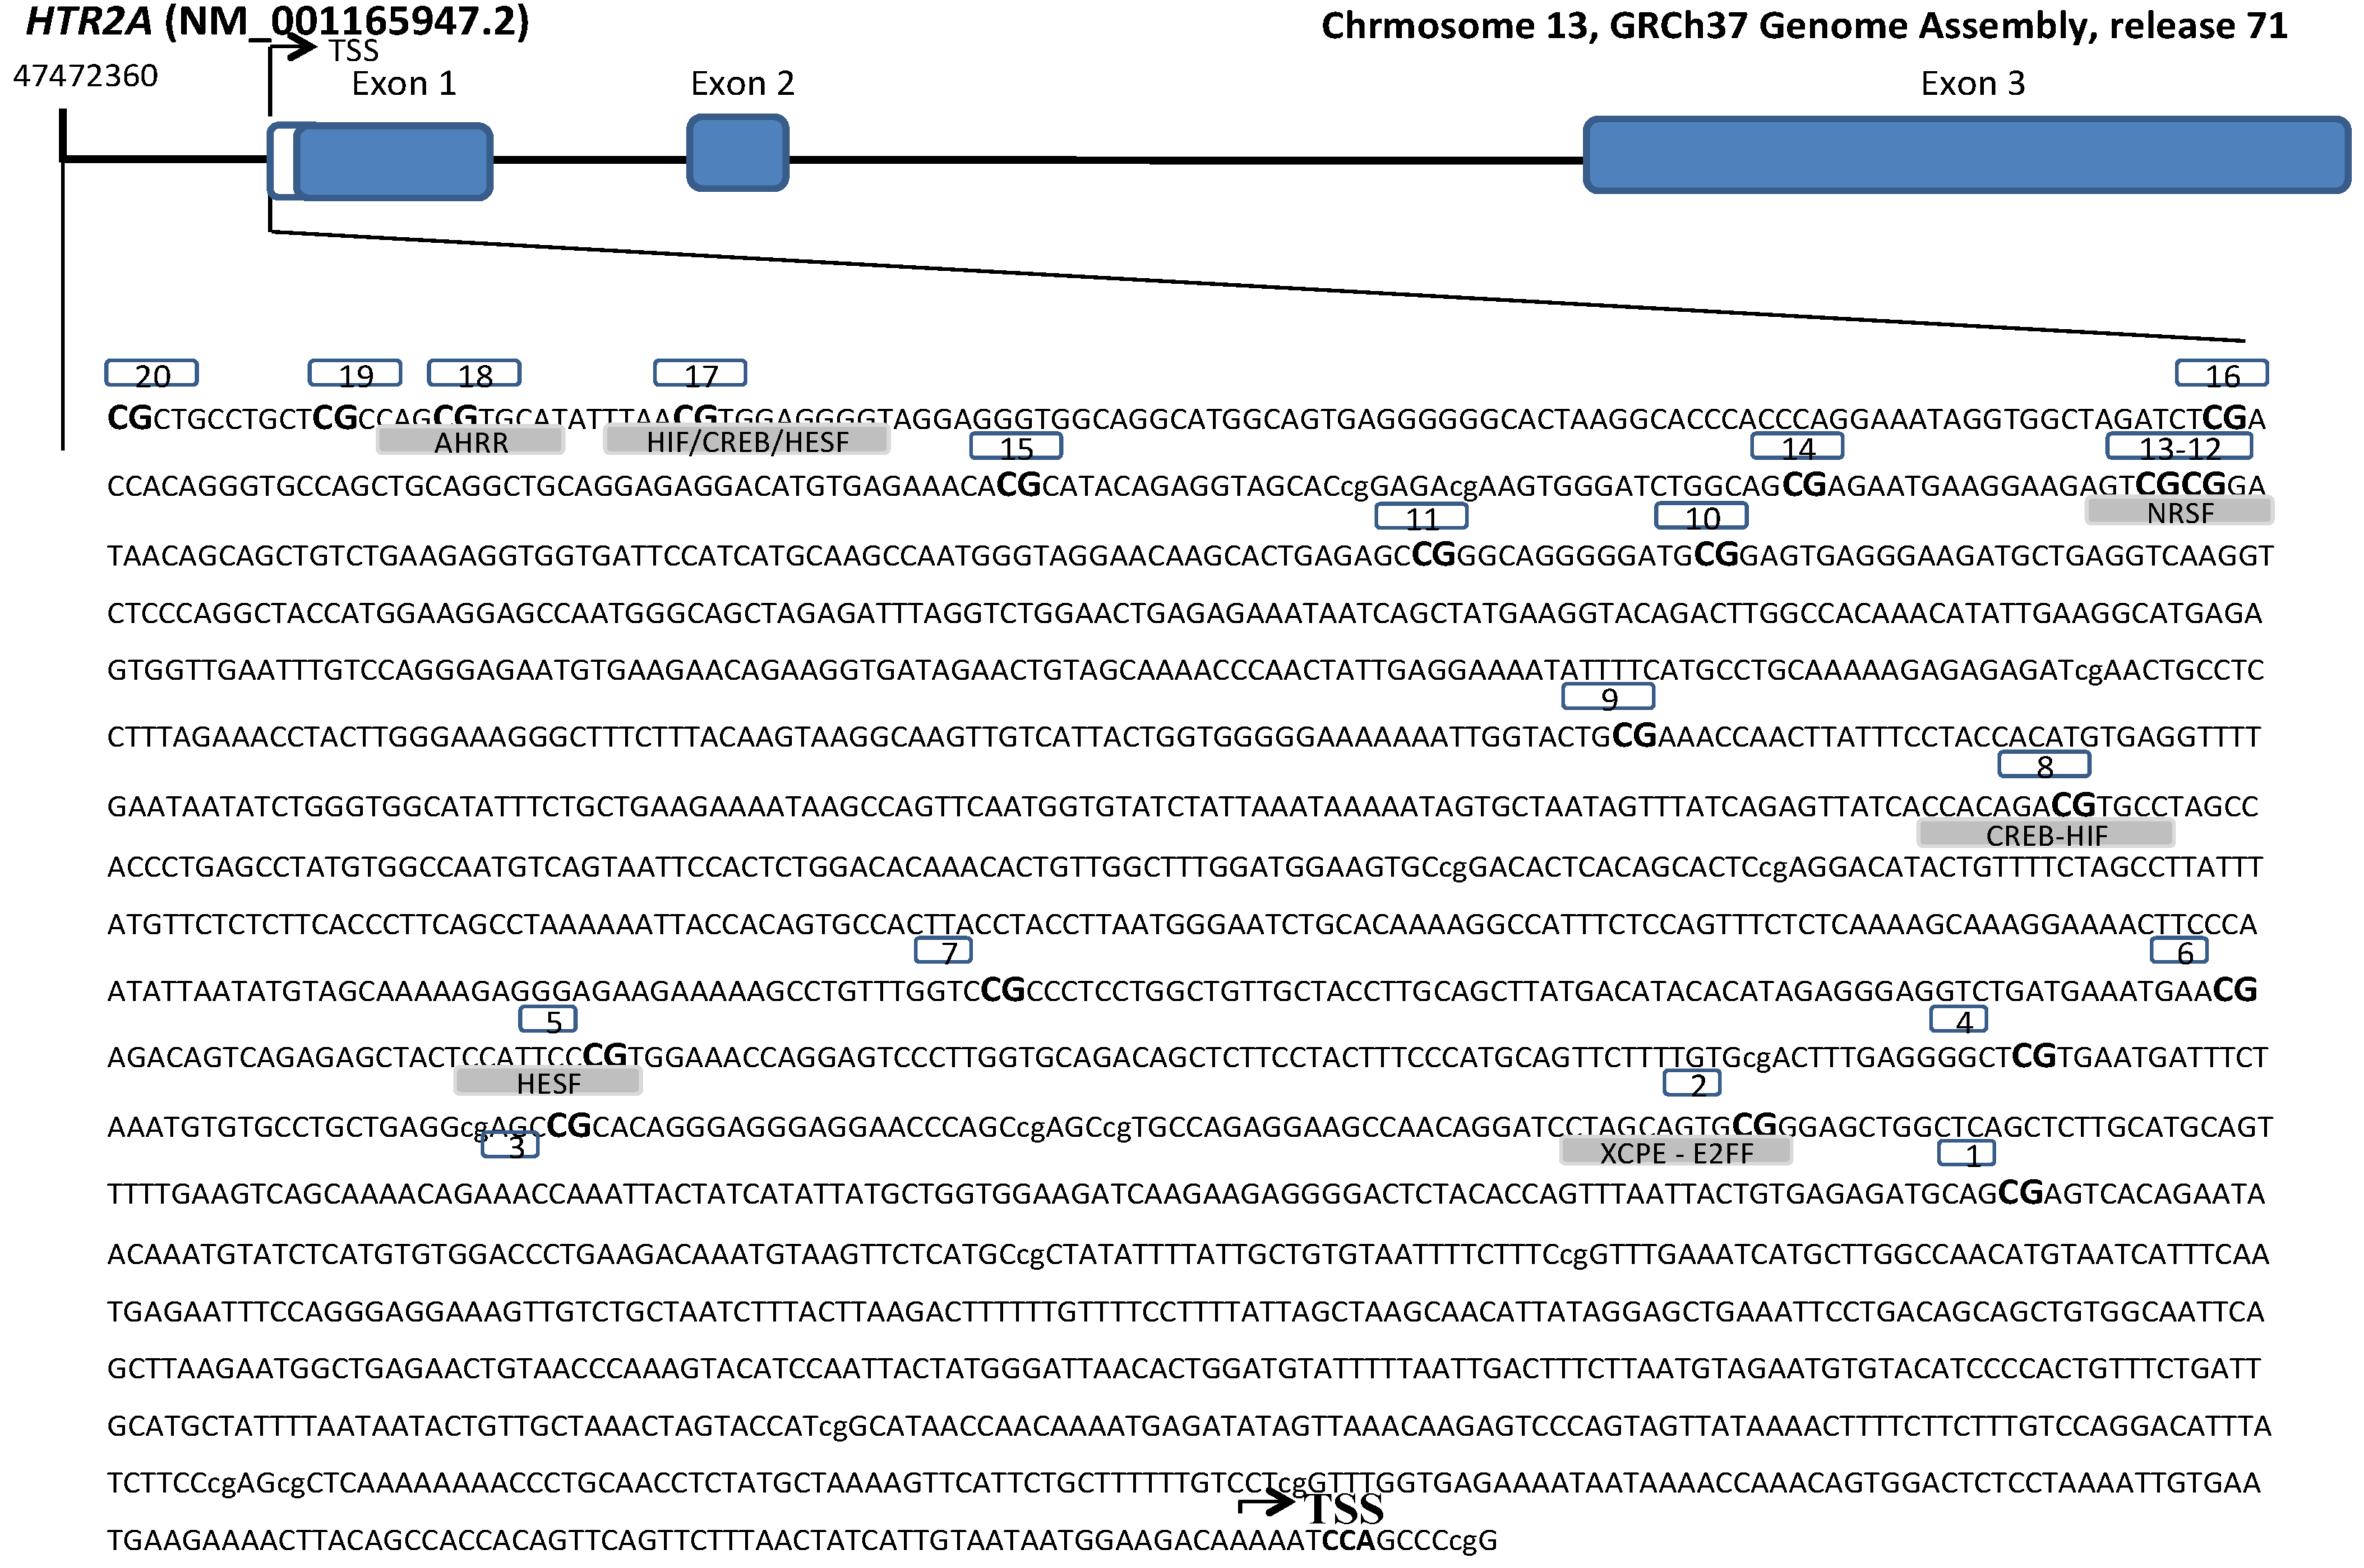
Genomic DNA from WBC was obtained using the Master Pure kit (Epicenter, Madison, WI, USA), and its quality was assessed with PicoGreen dsDNA Quantitation Reagent (Invitrogen, Carlsbad, CA, USA). A total of 500 ng of DNA were modified using EZ-96 DNA Methylation Kit (Zymo Research Corporation, Orange, CA, UDA) according to the manufacturer’s instructions, thus converting cytosine into uracil.
Array-based specific DNA methylation analysis was performed with the Infinium Human Methylation 450K bead chip technology (Illumina, San Diego, CA, USA). Bisulfite-treated genomic DNA was whole-genome amplified, hybridized to HumanMethylation450 BeadChips (Illumina, San Diego, CA, USA) and scanned using the Illumina iScanSQ platform. The intensity of the images was extracted with the GenomeStudio Methylation Software Module (version 1.9.0, Illumina, San Diego, CA, USA). β-Values were computed using the formula β-value = M/(U + M) where M and U are the raw “methylated” and “unmethylated” signals, respectively. β-Values were corrected for type I and type II bias using the peak-based correction. The data were normalized in R using a categorical Subset Quantile Normalization method (SQN) and probes associated to X and Y chromosomes were filtered out using the pipeline developed by Touleimat and Tost [31]. Probes containing SNPs with a minor allele frequency (MAF) >0.001 in Iberian population in Spain were removed from the analysis. The methylation status of 20 CpG sites of the HTR2A gene that codes for the HTR2A receptor were selected from the Illumina array and analysed separately. Specific CpG sites located in the transcriptional regulatory region (promoter, 5′-untranslated region and exon 1) were included (Figure 1). Reference names and characteristics of the selected CpG were reported (Table 1).
Figure 1. Genomic localization and nucleotide sequence of the 20 CpGs sites covered by the Illumina array for the study of DNA methylation levels of 5-hydroxytryptamine (serotonin) receptor 2A promoter (from −2188 to +10 pb). Transcription Start Site (TSS). Putative consensus sequences for nine transcriptional factors (AHRR: AHR-related factors, HIF: Hypoxia inducible factor, CREB: cAMP-responsive element binding proteins, HESF: Vertebrate homologs of enhancer of split complex (Basic helix-loop-helix domain containing, class B, 2 (secondary DNA binding preference)), NRSF: Neuron-restrictive silencer factor, XCPE: X gene core promoter element 1, E2FF: E2F transcription factor 6, ZF57: KRAB domain zinc finger protein 57, DMTE: Drosophila motif ten element), found with MatInspector.
Nutrients 06 02387 g001
Table 1. Information of the selected CpG sites for HTR2A gene.
CpG ID 1Illumina IDCHR Position 2Reference 3
1cg1589438913:47470857c.-688
2cg0225078713:47470989c.-820
3cg0647613113:47471052c.-883
4cg1618853213:47471090c.-921
5cg0936169113:47471169c.-1000
6cg1151428813:47471197c.-1028
7cg2706814313:47471264c.-1095
8cg1032343313:47471562c.-1393
9cg0202707913:47471705c.-1536
10cg0119253813:47472050c.-1881
11cg0162054013:47472064c.-1895
12cg0602066113:47472138c.-1969
13cg0979809013:47472140c.-1971
14cg2432039813:47472158c.-1989
15cg1820081013:47472200c.-2031
16cg1569205213:47472250c.-2081
17cg2411852113:47472330c.-2161
18cg2388136813:47472343c.-2174
19cg0550682913:47472349c.-2180
20cg0707529913:47472360c.-2191
1 Studied CpG identifier; 2 Genome assembly: GRCh37, Ensemble release 73.37; 3 It begins in the first nucleotide of exon 1.

2.6. Analysis of Gene Expression by Quantitative Real-Time PCR

Total RNA from WBC was extracted using Trizol reagent (Invitrogen, Carlsbad, CA, USA) according to the manufacturer’s instructions. The integrity of isolated RNA was also evaluated by Experion (BioRad, Hercules, CA, USA), following the manufacturer’s instructions. Briefly, denatured RNA samples (1 μL) were mixed with sample buffer provided, and 6 μL of each mixed sample was loaded in RNA StdSens chips (Bio-Rad) for analysis. In all samples, we also evaluated the RNA quality indicator number (RQI) and this was considered as optimal (ranging from 7.9 to 10). Furthermore, HTR2A transcript expression levels were assessed using quantitative real-time RT-PCR (qPCR). cDNA was synthesized from total RNA (1 μg) of the entire cohort individuals using High Capacity cDNA Reverse Transcription Kit with RNase Inhibitor following the manufacturer’s instructions (Life Technologies, Foster city, CA, USA). The transcript levels for HTR2A gene and one housekeeper gene were measured using an ABI Prism 7900HT Fast Real-Time PCR system with a 384-well format and TaqMan Gene Expression Assays (Life Technologies, Foster city, CA, USA) (HTR2A: Hs01033524_m1 and GAPDH: Hs02758991_g1). The ΔΔCT method was used for quantification (ABI) and the fold changes are reported as 2−ΔΔCT [32].

2.7. In Silico Sequence Analysis

Human genomic DNA sequences, from 2188 bp upstream to +1 pb of the transcription Start Site (TSS) of the HTR2A gene, were downloaded from the NCBI database (GenBank: NG_013011.1, 13:47472360-13: 47469640) [33]. Possible transcription factor-binding sites were predicted on genomic DNA sequences using MatInspector software (Genomatix Software GmbH, Munich, Germany), which is a specifically designed tool for promoter analysis [34].

2.8. Statistical Analyses

Results are shown as mean ± SEM. Data normality was determined by the Shapiro-Wilk test. The mean methylation value of the HTR2A gene promoter region, including the 20 CpGs, was calculated. Baseline characteristics of participants according to tertiles of mean HTR2A gene methylation were compared. Means and SEM for each variable across the HTR2A gene methylation tertiles were calculated, with the differences among them assessed using one-way analysis of variance. Pearson correlations were fitted to evaluate the potential correlations of HTR2A transcriptional regulatory region methylation with all sites across the promoter region, gene expression and changes in anthropometric measurements and depressive symptoms. Body weight, WC, BMI and fat mass were divided by medians and the differences between groups were analysed using a Student’s t-test. Moreover, multiple testing correction (Benjamini–Hochberg) analyses were performed when appropriate. Statistical analyses were performed using STATA version 12.0 (StataCorp., College Station, TX, USA). p-Value < 0.05 was considered as statistically significant.

3. Results

The CpG sites were located within the HTR2A promoter region, a 2198 bp region positioned from −2188 to +10 (Figure 1). The transcription factor binding sites in the activation regions of the HTR2A promoter were screened by using MatInspector. These analyses showed that the promoter region contained a consensus binding motif in the studied CpG sites for seven transcription factors (AHRR, HIF, CREB, HESF, NRSF, XCPE, E2FF) (see Figure 1 and supplementary data S1). Mean DNA methylation levels revealed a high correlation with some of the CpG sites for the HTR2A gene (supplementary data S2). Moreover, DNA methylation levels of CpG sites within the promoter region were associated in some different regions. These distinct areas might imply the presence of specific response elements of gene regulatory machinery in the gene promoter.
The baseline anthropometric, biochemical and psychological characteristics of the whole-study sample (n = 41) stratified by tertiles of baseline mean HTR2A gene promoter methylation levels are presented (Table 2). In this context, those individuals in the upper category of mean HTR2A methylation levels had a higher waist circumference (WC) and insulin levels. Nevertheless, no association between HTR2A methylation levels and depressive symptoms was observed at the beginning of the study.
Table 2. Anthropometric, biochemical and psychological characteristics of the whole-study sample stratified bytertilesof mean HTR2A methylation levels at baseline.
VariablesMean HTR2A Gene Methylation %p Trend
Low (n = 14)Medium (n = 14)High (n = 13)
Body weight (kg)97.6 ± 4.6106.4 ± 4.6110.7 ± 4.80.059
BMI (kg/m2)37.0 ± 1.037.0 ± 1.037.0 ± 1.00.995
Waist circumference (cm)110.8 ± 3.0114.0 ± 3.0120.5 ± 3.10.027
Total fat mass (kg)43.8 ± 2.445.9 ± 2.445.4 ± 2.50.682
Truncal fat mass (kg)26.1 ± 1.827.6 ± 1.826.2 ± 1.90.993
SBP (mmHg)150.3 ± 4.8151.2 ± 4.8148.1 ± 4.90.733
DBP (mmHg)85.4 ± 2.287.3 ± 2.284.8 ± 2.30.784
Glucose (mg/dL)9.8 ± 1.57.4 ± 1.511.1 ± 1.60.498
Insulin (μU/mL)11.0 ± 2.318.1 ± 2.321.7 ± 2.40.004
TC (mg/dL)225.1 ± 12.4211.1 ± 12.9205.1 ± 12.90.280
Triglycerides (mg/dL)166.8 ± 29.9224.6 ± 31.1247.3 ± 31.10.079
NEFA (nmol/L)0.58 ± 0.050.50 ± 0.050.56 ± 0.050.705
BDI score9.8 ± 1.98.3 ± 1.910.9 ± 1.90.636
Data expressed as mean ± SEM. Bold numbers indicate statistical significance (P < 0.05). Abbreviations: BDI, Beck Depression Inventory; BMI, body mass index; DBP, diastolic blood pressure; HTR2A, 5-hydroxytryptamine receptor 2A; NEFA, non-esterified fatty acids; SBP, systolic blood pressure; STAI, State Trait Anxiety Inventory; TC, total cholesterol. Low ≤ 0.556; Medium = 0.557–0.585; High ≥ 0.587.
The 20 selected CpG methylation sites of the HTR2A gene showed few associations with baseline body weight, WC, BMI and fat mass (supplementary data S3). After the six-month weight-loss treatment, body weight, WC, BMI, fat mass and depressive symptoms significantly decreased in all subjects (Figure 2). Changes in body weight, WC, BMI and fat mass were divided by medians showing that those participants with a greater response to the dietary treatment had lower HTR2A gene promoter methylation levels (Figure 3). Moreover, Pearson correlation analyses between mean HTR2A gene methylation levels and changes in anthropometric parameters confirmed these findings, since positive correlations between mean HTR2A gene methylation levels and changes in body weight, BMI and fat mass, though not in WC, were found.
Figure 2. Anthropometric, body composition measurements and in depressive symptoms in the whole-study sample before and after the dietary treatment n = 32–34. Data are expressed as mean (CI 95%). Abbreviations: BDI, Beck depression inventory; BMI, body mass index; WC, waist circumference. * p < 0.05. ** p < 0.001.
Nutrients 06 02387 g002
Figure 3. Association of baseline mean HTR2A gene methylation (%) with changes (six-month baseline) in anthropometric and body composition measurements divided by their medians in the whole-study sample n = 34. Δ = six-month baseline. Data are expressed as mean (CI 95%). Abbreviations: BMI, body mass index; WC, waist circumference. <P50 = high responders; >P50 = low responders to the dietary treatment. * p < 0.05.
Nutrients 06 02387 g003
Pearson correlation analyses were performed to assess the relationship between baseline HTR2A gene methylation levels and changes in body weight, WC, BMI and fat mass after the six-month dietary treatment. The analysis of the 20 selected CpG methylation sites of the HTR2A gene showed that CpG 4, CpG 7 and CpG 17 sites were also positively related to changes in body weight, BMI and fat mass (Table 3). However, after applying a multiple comparison correction, the statistical significance was attenuated. In addition, no association between HTR2A gene methylation with changes in insulin and triglyceride levels was observed.
Table 3. Pearson correlation analyses between changes (six-month baseline) in body weight, BMI and fat mass with the baseline methylation (%) of HTR2A gene.
Δ Body WeightΔ WCΔ BMIΔ Fat Mass (kg)
BaselineCpG SitesrUncorrected p-ValuerUncorrected p-ValuerUncorrected p-ValuerUncorrected p-Value
cg1589438910.1100.537−0.1170.5100.1270.4740.1670.346
cg022507872−0.0630.725−0.0830.639−0.0630.7230.0080.963
cg0647613130.2840.1030.0800.6520.2860.1000.3810.026 *
cg1618853240.3790.027 *0.1240.4830.3830.025 *0.4150.015 *
cg093616915−0.1950.268−0.1880.287−0.1980.261−0.1530.386
cg115142886−0.1430.418−0.1540.383−0.1440.414−0.1450.412
cg2706814370.3690.032 *0.1160.5130.3970.020 *0.3820.025 *
cg1032343380.2920.0940.0520.7690.3500.0420.2490.155
cg0202707990.0110.9510.1600.3650.0090.9570.0420.815
cg01192538100.2250.2010.1930.2740.2300.1900.2140.225
cg0162054011−0.0700.694−0.2510.152−0.0140.937−0.0730.680
cg06020661120.1770.3160.2060.2430.1960.2670.1960.267
cg0979809013−0.0420.814−0.0540.762−0.0370.837−0.0590.740
cg24320398140.3380.0510.2660.1280.3770.028 *0.3430.047
cg18200810150.3100.0750.2220.2060.3600.037 *0.3220.063
cg15692052160.0910.608−0.0250.8900.1210.4940.1030.563
cg24118521170.3420.0470.2800.1080.3810.026 *0.4140.015 *
cg23881368180.2970.0870.2690.1240.3190.0660.2910.095
cg05506829190.2800.1080.2520.1510.2970.0880.2680.125
cg07075299200.2960.0890.2500.1530.3070.0780.3010.084
Data are shown as r and p values from Pearson correlations analysis. Δ = 6-month baseline. Abbreviations: BMI, body mass index; HTR2A; 5-hydroxytryptamine receptor 2A; WC, waist circumference. * p-Value < 0.05 after correcting for Benjamini–Hochberg multiple comparisons.
Interestingly, higher methylation levels of both the HTR2A gene promoter and HTR2A CpG17 site at baseline were related to a less marked decrease in depressive symptoms after the nutritional intervention (Figure 4).
The gene expression analysis showed very low concentrations in WBC and only revealed values for 20 participants. No association was found between gene expression and the HTR2A gene promoter methylation levels (r = −0.257, p = 0.274), or the methylation of HTR2A CpG 17 site (r = 0.094, p = 0.693).
Figure 4. Association of the decrease (six-month baseline) in depressive symptoms with baseline (A) mean HTR2A methylation; (B) methylation levels of HTR2A CpG17 site; in the whole-study sample n = 32. Change = six-month baseline. Abbreviations: HTR2A; 5-hydroxytryptamine receptor 2A.
Nutrients 06 02387 g004

4. Discussion

This study showed a positive association between baseline methylation levels of the HTR2A gene in peripheral WBC and both initial and subsequent changes in anthropometric variables, suggesting a regulatory action of this gene on methylation levels in the improvement of obesity measures (e.g., body weight). Moreover, the baseline methylation levels of the HTR2A gene promoter region were associated with a decrease in depressive manifestations after the weight loss treatment.
In order to detect putative consensus transcription factor binding sites in the entire HTR2A coding region, a computer analysis of this region using MatInspector was carried out [34]. This analysis showed that the HTR2A CpG 17 site matches a core-binding motif for CREB, HESF and HIF. A growing literature has related environmental factors to serotonin release acting on diverse serotonin receptors, by the mediation of CREB, which may activate the expression of many genes to produce different proteins involved in neural growth, synapse formation, and long-lasting structural changes, which may be related to depression [20,21]. As for the HESF transcription factor, it has been involved in neuronal excitability in the brain [35]. Moreover, HIF is a key regulator of oxygen homeostasis and has been reported to play a role in the transcriptional regulation of low-grade inflammation, tissue-protective signaling pathways or weight loss [36,37]. Since it has been proposed that low-grade inflammation promotes both obesity and depression [4], it might be hypothesised that methylation of HTR2A could interact with obesity and depressive disorders by hindering the binding of HIF, HESF and CREB to the HTR2A gene promoter region.
Interestingly, the CpG methylation of a promoter region may be a mechanism implicated in gene inactivation by blocking its transcription [38]. Nonetheless, in this study, we failed to find an association between promoter methylation levels and gene expression, although this might be due to the fact that not all samples could be read. One factor that might explain this unexpected finding is that the promoter region CpG 17 site, an important transcription factor binding site of HTR2A gene, was highly methylated and may have caused a very low HTR2A gene expression in our sample. Moreover, other studies have found that DNA methylation is involved in the regulation of HTR2A expression [19]. On the other hand, a previous study has reported very low concentrations of HTR2A gene expression in peripheral blood mononuclear cells, and also an increase of HTR2A gene expression after clinical improvement of depressive symptoms [39]. Indeed, this research proposed HTR2A gene as a potential biomarker for clinical improvement of depression.
Diet is considered an important environmental factor that affects DNA methylation [6,28]. In this sense, the dietary levels of methyl-donor precursors (vitamins of the B complex or certain amino acids) have been shown to be important in the prevention of psychiatric diseases and obesity [40,41]. In this context, a balance of DNA methylation levels is important for the correct functioning of the central nervous system [40]. Moreover, DNA methylation changes in peripheral WBC have been proposed as a useful biomarker for different diseases [13,38].
On the other hand, one of the most widely studied SNPs of the HTR2A gene is rs6311 (−1438G > A), which has been related to many diseases and conditions such as schizophrenia, alcohol dependence, diabetes and obesity [42,43]. For example, it has been suggested that this SNP influences glucose homeostasis [42] and also obesity traits (BMI and abdominal obesity) in obese subjects [44]. In the present study, we found that hypermethylation of the HTR2A gene was associated with higher baseline WC and insulin levels. Interestingly, those subjects with higher methylation of HTR2A gene and also the HTR2A CpG 17 site, showed a less marked decrease in body weight, BMI and fat mass after the six-month dietary treatment. No previous study has analysed DNA methylation levels of HTR2A gene in a population with metabolic syndrome enrolled in a weight loss treatment. These results therefore could not be compared. On the other hand, SNPs have not been genotyped in this study. Hence, if the methylation levels are tagging a SNP, this may explain why DNA methylation was not associated with gene expression, as this SNP influences translation efficiency [20,21].
In addition, the HTR2A gene has been directly associated with major depressive disorder [45]. Some studies have reported that HTR2A expression is decreased in the brain of patients with schizophrenia and in those who have committed suicide [21,46,47]. Moreover, antipsychotic treatment has been linked with lower DNA methylation and increased expression of the HTR2A gene [21]. Unfortunately, methylation of cytosines of the HTR2A promoter gene in major depressive disorders has not been sufficiently investigated to date [16]. In this sense, it might be suggested that the average methylation of both the HTR2A gene and HTR2A CpG 17 site predicted the decrease in depressive symptoms.
Under the assumption of an inverse association between DNA methylation and gene expression [38], the density of 5-HT2A receptors might mirror, in part, HTR2A methylation. In this sense, lower density of platelet 5-HT2A receptors has been observed in adolescents with eating disorders [48]. Moreover, progressive reductions of brain 5-HT2A receptor density have been proposed as an indicator of schizophrenia [47]. In contrast, results from animal models found that higher 5-HT2A receptor gene expression was linked to obesity [49] and also elevated 5-HT2A receptors in frontal cortex specimens were observed in depressed subjects [50]. Hence, the involvement of 5-HT2A receptors in depressive disorders remains to be elucidated.
Some limitations of the study should be mentioned. Firstly, since the sample size is not very large, the risk of type II errors (failing to detect real differences) was high. Type II errors are frequent when adjustments are used in conjunction with a small effect or a small sample [51]. Therefore, with the aim of avoiding type II errors, no covariates were included in the analysis carried out in this study. Our approach is consistent with previous investigations that reported that when it is important to discover new facts, as is our case, we may be willing to accept more type I errors in order to avoid type II errors [52,53]. Hence, in this study, the probability of type II errors is low because important statistical differences were found despite the small sample size. However, further studies with a large sample size are clearly needed to verify our findings. Secondly, HTR2A methylation levels were not measured at the end of the intervention and so it is not possible to confirm whether the dietary treatment had an effect on HTR2A gene methylation levels. Thirdly, we failed to find an association between promoter methylation levels and gene expression in WBC. Gene expression varies depending on the tissue or cell type [54], and it is possible that HTR2A gene is not widely expressed in WBC. Moreover, other studies have found that DNA methylation is involved in the regulation of HTR2A expression [19]. In addition, validation of these results with other reliable standards such as pyrosequencing or bisulfite sequencing might be considered in future studies.
On the other hand, the strengths of this study are: its novelty; the techniques used for DNA methylation quantification, which are known to be the gold standard for epigenetic studies; and its relevance for future dietary intervention trials.

5. Conclusions

In summary, this study provides novel evidence that hypermethylation of the HTR2A gene in WBC at baseline is significantly associated with a worse response to a weight-loss intervention and a less marked decrease in depressive symptoms in subjects with MetS. These results, if confirmed, would suggest that HTR2A gene methylation in WBC could serve as a useful biomarker to predict weight loss and improvement of depressive symptoms after an energy-restricted dietary treatment. However, replication in a larger cohort is warranted in order to confirm these findings and to better understand the possible biological mechanisms explaining these associations.

Supplementary Files

  • Supplementary File 1:

    Supplementary Information (DOCX, 52 KB)

  • Acknowledgment

    We wish to thank our physician Blanca E. Martinez de Morentin, our nurse Salome Perez and the technician Veronica Ciaurriz for excellent technical assistance as well as the volunteers who participated in this study. We acknowledge Shauna Drumm (native English speaker) and Paul Miller (from the institute of Modern Languages of the University of Navarra) for reviewing the final version of the manuscript.
    This work was supported by Health Department of the Government of Navarra (48/2009) and the Linea Especial about Nutrition, Obesity and Health (University of Navarra LE/97). Also CIBERobn and RETICS schemes are gratefully credited. The pre-doctoral research grant to A.P.C. from the Asociación de Amigos Universidad de Navarra is gratefully acknowledged. M.L.M. holds a Juan de la Cierva fellowship from Spanish Ministry of Economic and Competitiveness.

    Author Contributions

    A.P.-C: contributed to the data collection, design, analysis, and writing of the manuscript. M.L.M.: was involved in the design, analysis, and editing of the manuscript, M.A.Z. and JAM: were responsible for the general coordination, design, financial management and editing of the manuscript. All authors read and approved the final manuscript.

    Conflicts of Interest

    The authors declare no conflict of interests.

    References

    1. Richards, D. Prevalence and clinical course of depression: A review. Clin. Psychol. Rev. 2011, 31, 1117–1125. [Google Scholar] [CrossRef]
    2. Alberti, K.G.; Eckel, R.H.; Grundy, S.M.; Zimmet, P.Z.; Cleeman, J.I.; Donato, K.A.; Fruchart, J.C.; James, W.P.; Loria, C.M.; Smith, S.C., Jr. Harmonizing the metabolic syndrome: A joint interim statement of the international diabetes federation task force on epidemiology and prevention; national heart, lung, and blood institute; american heart association; world heart federation; international atherosclerosis society; and international association for the study of obesity. Circulation 2009, 120, 1640–1645. [Google Scholar] [CrossRef]
    3. Lichtman, J.H.; Froelicher, E.S.; Blumenthal, J.A.; Carney, R.M.; Doering, L.V.; Frasure-Smith, N.; Freedland, K.E.; Jaffe, A.S.; Leifheit-Limson, E.C.; Sheps, D.S.; et al. Depression as a risk factor for poor prognosis among patients with acute coronary syndrome: Systematic review and recommendations: A scientific statement from the american heart association. Circulation 2014, 129, 1350–1369. [Google Scholar] [CrossRef]
    4. Pan, A.; Keum, N.; Okereke, O.I.; Sun, Q.; Kivimaki, M.; Rubin, R.R.; Hu, F.B. Bidirectional association between depression and metabolic syndrome: A systematic review and meta-analysis of epidemiological studies. Diabetes Care 2012, 35, 1171–1180. [Google Scholar]
    5. Bondy, B. Common genetic factors for depression and cardiovascular disease. Dialogues Clin. Neurosci. 2007, 9, 19–28. [Google Scholar]
    6. Campion, J.; Milagro, F.I.; Martinez, J.A. Individuality and epigenetics in obesity. Obes. Rev. 2009, 10, 383–392. [Google Scholar]
    7. Schroeder, M.; Krebs, M.O.; Bleich, S.; Frieling, H. Epigenetics and depression: Current challenges and new therapeutic options. Curr. Opin. Psychiatry 2010, 23, 588–592. [Google Scholar] [CrossRef]
    8. Philibert, R.A.; Sandhu, H.; Hollenbeck, N.; Gunter, T.; Adams, W.; Madan, A. The relationship of 5HTT (SLC6A4) methylation and genotype on mrna expression and liability to major depression and alcohol dependence in subjects from the iowa adoption studies. Am. J. Med. Genet. B 2008, 147, 543–549. [Google Scholar]
    9. De la Iglesia-González, R.; Mansego-Talavera, M.; Sánchez-Muniz, F.J.; Zulet-Alzórriz, M.; Martinez-Hernández, J. Arylesterase activity is associated with antioxidant intake and paraoxonase 1 (PON1) gene methylation in metabolic syndrome patients following an energy restricted diet. EXCLI J. 2014, 13, 416–426. [Google Scholar]
    10. Ordovas, J.M.; Smith, C.E. Epigenetics and cardiovascular disease. Nat. Rev. Cardiol. 2010, 7, 510–519. [Google Scholar] [CrossRef]
    11. Terry, M.B.; Delgado-Cruzata, L.; Vin-Raviv, N.; Wu, H.C.; Santella, R.M. DNA methylation in white blood cells: Association with risk factors in epidemiologic studies. Epigenetics 2011, 6, 828–837. [Google Scholar] [CrossRef]
    12. Moleres, A.; Campion, J.; Milagro, F.I.; Marcos, A.; Campoy, C.; Garagorri, J.M.; Gomez-Martinez, S.; Martinez, J.A.; Azcona-Sanjulian, M.C.; Marti, A. Differential DNA methylation patterns between high and low responders to a weight loss intervention in overweight or obese adolescents: The evasyon study. FASEB J. 2013, 27, 2504–2512. [Google Scholar] [CrossRef]
    13. Berger, M.; Gray, J.A.; Roth, B.L. The expanded biology of serotonin. Annu. Rev. Med. 2009, 60, 355–366. [Google Scholar] [CrossRef]
    14. Stunes, A.K.; Reseland, J.E.; Hauso, O.; Kidd, M.; Tommeras, K.; Waldum, H.L.; Syversen, U.; Gustafsson, B.I. Adipocytes express a functional system for serotonin synthesis, reuptake and receptor activation. Diabetes Obes. Metab. 2011, 13, 551–558. [Google Scholar]
    15. Fidalgo, S.; Ivanov, D.K.; Wood, S.H. Serotonin: From top to bottom. Biogerontology 2013, 14, 21–45. [Google Scholar] [CrossRef]
    16. Fabbri, C.; Marsano, A.; Serretti, A. Genetics of serotonin receptors and depression: State of the art. Curr. Drug Targets 2013, 14, 531–548. [Google Scholar] [CrossRef]
    17. Li, P.; Tiwari, H.K.; Lin, W.Y.; Allison, D.B.; Chung, W.K.; Leibel, R.L.; Yi, N.; Liu, N. Genetic association analysis of 30 genes related to obesity in a european american population. Int. J. Obes. 2014, 38, 724–729. [Google Scholar]
    18. Falkenberg, V.R.; Gurbaxani, B.M.; Unger, E.R.; Rajeevan, M.S. Functional genomics of serotonin receptor 2A (HTR2A): Interaction of polymorphism, methylation, expression and disease association. Neuromolecular Med. 2011, 13, 66–76. [Google Scholar] [CrossRef]
    19. Polesskaya, O.O.; Aston, C.; Sokolov, B.P. Allele c-specific methylation of the 5-HT2A receptor gene: Evidence for correlation with its expression and expression of DNA methylase DNMT1. J. Neurosci. Res. 2006, 83, 362–373. [Google Scholar] [CrossRef]
    20. Ghadirivasfi, M.; Nohesara, S.; Ahmadkhaniha, H.R.; Eskandari, M.R.; Mostafavi, S.; Thiagalingam, S.; Abdolmaleky, H.M. Hypomethylation of the serotonin receptor type-2A gene (HTR2A) at T102C polymorphic site in DNA derived from the saliva of patients with schizophrenia and bipolar disorder. Am. J. Med. Genet. B 2011, 156, 536–545. [Google Scholar] [CrossRef]
    21. Abdolmaleky, H.M.; Yaqubi, S.; Papageorgis, P.; Lambert, A.W.; Ozturk, S.; Sivaraman, V.; Thiagalingam, S. Epigenetic dysregulation of HTR2A in the brain of patients with schizophrenia and bipolar disorder. Schizophr. Res. 2011, 129, 183–190. [Google Scholar] [CrossRef]
    22. Perez-Cornago, A.; Zulet, M.; Martinez, J. Association between mood and diet quality in subjects with metabolic syndrome participating in a behavioural weight-loss program: A cross-sectional assessment. Nutr. Neurosci. 2014. [Google Scholar] [CrossRef]
    23. Perez-Cornago, A.; Lopez-Legarrea, P.; de la Iglesia, R.; Lahortiga, F.; Martinez, J.A.; Zulet, M.A. Longitudinal relationship of diet and oxidative stress with depressive symptoms in patients with metabolic syndrome after following a weight loss treatment: The RESMENA project. Clin. Nutr. 2013. [Google Scholar] [CrossRef]
    24. Perez-Cornago, A.; de la Iglesia, R.; Lopez-Legarrea, P.; Abete, I.; Navas-Carretero, S.; Lacunza, C.I.; Lahortiga, F.; Martinez-Gonzalez, M.A.; Martinez, J.A.; Zulet, M.A. A decline in inflammation is associated with less depressive symptoms after a dietary intervention in metabolic syndrome patients: A longitudinal study. Nutr. J. 2014, 13, 36. [Google Scholar] [CrossRef]
    25. Perez-Cornago, A.; Ramírez, M.; Zulet, M.; Martinez, J.A. Effect of dietary restriction on peripheral monoamines and anxiety symptoms in obese subjects with metabolic syndrome. Psychoneuroendocrinology 2014, 47, 98–106. [Google Scholar] [CrossRef]
    26. Zulet, M.A.; Bondia-Pons, I.; Abete, I.; de la Iglesia, R.; Lopez-Legarrea, P.; Forga, L.; Navas-Carretero, S.; Martinez, J.A. The reduction of the metabolyc syndrome in navarra-spain (RESMENA-S) study: A multidisciplinary strategy based on chrononutrition and nutritional education, together with dietetic and psychological control. Nutr. Hosp. 2011, 26, 16–26. [Google Scholar]
    27. Whitworth, J.A.; Chalmers, J. World health organisation-international society of hypertension (WHO/ISH) hypertension guidelines. Clin. Exp. Hypertens. 2004, 26, 747–752. [Google Scholar] [CrossRef]
    28. Hermsdorff, H.H.; Mansego, M.L.; Campion, J.; Milagro, F.I.; Zulet, M.A.; Martinez, J.A. TNF-alpha promoter methylation in peripheral white blood cells: Relationship with circulating tnfalpha, truncal fat and n-6 pufa intake in young women. Cytokine 2013, 64, 265–271. [Google Scholar] [CrossRef]
    29. Lopez-Legarrea, P.; Mansego, M.L.; Zulet, M.A.; Martinez, J.A. Serpine1, PAI-1 protein coding gene, methylation levels and epigenetic relationships with adiposity changes in obese subjects with metabolic syndrome features under dietary restriction. J. Clin. Biochem. Nutr. 2013, 53, 139–144. [Google Scholar] [CrossRef]
    30. Conde, C.; Useros, E. Adaptación castellana de la escala de evaluación conductual para la depresión de beck. Rev. Psiqiat Psicol. Med. 1975, 12, 217–236. [Google Scholar]
    31. Touleimat, N.; Tost, J. Complete pipeline for Infinium(®) Human Methylation 450K BeadChip data processing using subset quantile normalization for accurate DNA methylation estimation. Epigenomics 2012, 4, 325–341. [Google Scholar] [CrossRef]
    32. Livak, K.J.; Schmittgen, T.D. Analysis of relative gene expression data using real-time quantitative PCR and the 2−ΔΔCT method. Methods 2001, 25, 402–408. [Google Scholar] [CrossRef]
    33. National Center of Biotechnology Information. Available online: http://www.ncbi.nlm.nih.gov/ (accessed on 12 January 2014).
    34. Quandt, K.; Frech, K.; Karas, H.; Wingender, E.; Werner, T. Matind and matinspector: New fast and versatile tools for detection of consensus matches in nucleotide sequence data. Nucleic Acids Res. 1995, 23, 4878–4884. [Google Scholar] [CrossRef]
    35. Jiang, X.; Tian, F.; Du, Y.; Copeland, N.G.; Jenkins, N.A.; Tessarollo, L.; Wu, X.; Pan, H.; Hu, X.Z.; Xu, K.; et al. BHLHB2 controls bdnf promoter 4 activity and neuronal excitability. J. Neurosci. 2008, 28, 1118–1130. [Google Scholar] [CrossRef]
    36. Rosenberger, P.; Schwab, J.M.; Mirakaj, V.; Masekowsky, E.; Mager, A.; Morote-Garcia, J.C.; Unertl, K.; Eltzschig, H.K. Hypoxia-inducible factor-dependent induction of netrin-1 dampens inflammation caused by hypoxia. Nat. Immunol. 2009, 10, 195–202. [Google Scholar] [CrossRef]
    37. Urdampilleta, A.; Gonzalez-Muniesa, P.; Portillo, M.P.; Martinez, J.A. Usefulness of combining intermittent hypoxia and physical exercise in the treatment of obesity. J. Physiol. Biochem. 2012, 68, 289–304. [Google Scholar] [CrossRef]
    38. Milagro, F.I.; Mansego, M.L.; de Miguel, C.; Martinez, J.A. Dietary factors, epigenetic modifications and obesity outcomes: Progresses and perspectives. Mol. Asp. Med. 2013, 34, 782–812. [Google Scholar] [CrossRef]
    39. Belzeaux, R.; Formisano-Treziny, C.; Loundou, A.; Boyer, L.; Gabert, J.; Samuelian, J.C.; Feron, F.; Naudin, J.; Ibrahim, E.C. Clinical variations modulate patterns of gene expression and define blood biomarkers in major depression. J. Psychiatr. Res. 2010, 44, 1205–1213. [Google Scholar] [CrossRef]
    40. Abdolmaleky, H.M.; Smith, C.L.; Faraone, S.V.; Shafa, R.; Stone, W.; Glatt, S.J.; Tsuang, M.T. Methylomics in psychiatry: Modulation of gene-environment interactions may be through DNA methylation. Am. J. Med. Genet B 2004, 127B, 51–59. [Google Scholar] [CrossRef]
    41. Cordero, P.; Gomez-Uriz, A.M.; Campion, J.; Milagro, F.I.; Martinez, J.A. Dietary supplementation with methyl donors reduces fatty liver and modifies the fatty acid synthase DNA methylation profile in rats fed an obesogenic diet. Genes Nutr. 2013, 8, 105–113. [Google Scholar] [CrossRef]
    42. Kring, S.I.; Werge, T.; Holst, C.; Toubro, S.; Astrup, A.; Hansen, T.; Pedersen, O.; Sorensen, T.I. Polymorphisms of serotonin receptor 2A and 2C genes and comt in relation to obesity and type 2 diabetes. PLoS One 2009, 4, e6696. [Google Scholar]
    43. Cao, J.; Liu, X.; Han, S.; Zhang, C.K.; Liu, Z.; Li, D. Association of the HTR2A gene with alcohol and heroin abuse. Hum. Genet 2014, 133, 357–365. [Google Scholar] [CrossRef]
    44. Sorli, J.V.; Frances, F.; Gonzalez, J.I.; Guillen, M.; Portoles, O.; Sabater, A.; Coltell, O.; Corella, D. Impact of the −1438 G > A polymorphism in the serotonin 2A receptor gene on anthropometric profile and obesity risk: A case-control study in a Spanish Mediterranean population. Appetite 2008, 50, 260–265. [Google Scholar]
    45. Mandelli, L.; Serretti, A. Gene environment interaction studies in depression and suicidal behavior: An update. Neurosci. Biobehav. Rev. 2013, 37, 2375–2397. [Google Scholar] [CrossRef]
    46. Garbett, K.; Gal-Chis, R.; Gaszner, G.; Lewis, D.A.; Mirnics, K. Transcriptome alterations in the prefrontal cortex of subjects with schizophrenia who committed suicide. Neuropsychopharmacol Hung 2008, 10, 9–14. [Google Scholar]
    47. Hurlemann, R.; Matusch, A.; Kuhn, K.U.; Berning, J.; Elmenhorst, D.; Winz, O.; Kolsch, H.; Zilles, K.; Wagner, M.; Maier, W.; et al. 5-HT2A receptor density is decreased in the at-risk mental state. Psychopharmacology 2008, 195, 579–590. [Google Scholar]
    48. Sigurdh, J.; Allard, P.; Spigset, O.; Hagglof, B. Platelet serotonin transporter and 5-HT2A receptor binding in adolescents with eating disorders. Int. J. Neurosci. 2013, 123, 333–338. [Google Scholar] [CrossRef]
    49. Nonogaki, K.; Nozue, K.; Oka, Y. Increased hypothalamic 5-HT2A receptor gene expression and effects of pharmacologic 5-HT2A receptor inactivation in obese Ay mice. Biochem. Biophys. Res. Commun. 2006, 351, 1078–1082. [Google Scholar] [CrossRef]
    50. Shelton, R.C.; Sanders-Bush, E.; Manier, D.H.; Lewis, D.A. Elevated 5-HT2A receptors in postmortem prefrontal cortex in major depression is associated with reduced activity of protein kinase A. Neuroscience 2009, 158, 1406–1415. [Google Scholar] [CrossRef]
    51. Smith, R.A.; Levine, T.R.; Lachlan, K.A.; Fediuk, T.A. The high cost of complexity in experimental design and data analysis: Type I and type II error rates in multiway anova. Hum. Commun. Res. 2002, 28, 515–530. [Google Scholar]
    52. Keppel, G.; Wickens, T. Design and Analysis: A Researcher’s Handbook, 4th ed.; Pearson Prentice Hall: Upper Saddle River, NJ, USA, 2004. [Google Scholar]
    53. Cohen, J.; Cohen, P.; West, S.; Aiken, L. Applied Multiple Regression/Correlation Analysis for the Behavioral Sciences, 3rd ed.; Routledge: Mahwah, NJ, USA, 2002. [Google Scholar]
    54. Milagro, F.I.; Martinez, J.A. Epigenetics of obesity and weight loss. Endocrinol. Nutr. 2013, 60, 12–14. [Google Scholar] [CrossRef]

    Share and Cite

    MDPI and ACS Style

    Perez-Cornago, A.; Mansego, M.L.; Zulet, M.A.; Martinez, J.A. DNA Hypermethylation of the Serotonin Receptor Type-2A Gene Is Associated with a Worse Response to a Weight Loss Intervention in Subjects with Metabolic Syndrome. Nutrients 2014, 6, 2387-2403. https://doi.org/10.3390/nu6062387

    AMA Style

    Perez-Cornago A, Mansego ML, Zulet MA, Martinez JA. DNA Hypermethylation of the Serotonin Receptor Type-2A Gene Is Associated with a Worse Response to a Weight Loss Intervention in Subjects with Metabolic Syndrome. Nutrients. 2014; 6(6):2387-2403. https://doi.org/10.3390/nu6062387

    Chicago/Turabian Style

    Perez-Cornago, Aurora, Maria L. Mansego, María Angeles Zulet, and José Alfredo Martinez. 2014. "DNA Hypermethylation of the Serotonin Receptor Type-2A Gene Is Associated with a Worse Response to a Weight Loss Intervention in Subjects with Metabolic Syndrome" Nutrients 6, no. 6: 2387-2403. https://doi.org/10.3390/nu6062387

    Article Metrics

    Back to TopTop