Comparison of Site-Specific Bone Mineral Densities between Endurance Runners and Sprinters in Adolescent Women


Abstract
:1. Introduction
2. Materials and Methods
2.1. Study Design and Recruitment
2.2. BMD and Body Composition
2.3. Menstrual State and Stress Fracture History
2.4. Food Frequency Questionnaire
2.5. Physical Activity and Running Distance
2.6. Statistical Analysis
3. Results
3.1. Subject Characteristics
3.2. Comparison between Endurance Runners and Sprinters
3.3. Effect of Covariates on the BMD of Different Sites
4. Discussion
4.1. The Difference between the BMD of Sprinters and Endurance Runners
4.2. Relationship between Muscle Mass and BMD
4.3. Effect of Site-Specificity in Vitamin D
4.4. Study Limitations
5. Conclusions
Acknowledgments
Author Contributions
Conflicts of Interest
References
- Kohrt, W.M.; Bloomfield, S.A.; Little, K.D.; Nelson, M.E.; Yingling, V.R. American College of Sports Medicine Position Stand: Physical activity and bone health. Med. Sci. Sports Exerc. 2004, 36, 1985–1996. [Google Scholar] [CrossRef] [PubMed]
- Gibbs, J.C.; Williams, N.I.; de Souza, M.J. Prevalence of individual and combined components of the female athlete triad. Med. Sci. Sports Exerc. 2013, 45, 985–996. [Google Scholar] [CrossRef] [PubMed]
- Mountjoy, M.; Sundgot-Borgen, J.; Burke, L.; Carter, S.; Constantini, N.; Lebrun, C.; Meyer, N.; Sherman, R.; Steffen, K.; Budgett, R.; et al. The IOC consensus statement: Beyond the Female Athlete Triad—Relative Energy Deficiency in Sport (RED-S). Br. J. Sports Med. 2014, 48, 491–497. [Google Scholar] [CrossRef] [PubMed]
- Williams, P.T. Lower prevalence of hypertension, hypercholesterolemia, and diabetes in marathoners. Med. Sci. Sports Exerc. 2009, 41, 523–529. [Google Scholar] [CrossRef] [PubMed]
- Chakravarty, E.F.; Hubert, H.B.; Lingala, V.B.; Fries, J.F. Reduced disability and mortality among aging runners: A 21-year longitudinal study. Arch. Intern. Med. 2008, 168, 1638–1646. [Google Scholar] [CrossRef] [PubMed]
- Barrack, M.T.; Rauh, M.J.; Nichols, J.F. Prevalence of and traits associated with low BMD among female adolescent runners. Med. Sci. Sports Exerc. 2008, 40, 2015–2021. [Google Scholar] [CrossRef] [PubMed]
- Tenforde, A.S.; Fredericson, M.; Sayres, L.C.; Cutti, P.; Sainani, K.L. Identifying sex-specific risk factors for low bone mineral density in adolescent runners. Am. J. Sports Med. 2015, 43, 1494–1504. [Google Scholar] [CrossRef] [PubMed]
- Bilanin, J.E.; Blanchard, M.S.; Russek-Cohen, E. Lower vertebral bone density in male long distance runners. Med. Sci. Sports Exerc. 1989, 21, 66–70. [Google Scholar] [CrossRef] [PubMed]
- Hind, K.; Truscott, J.G.; Evans, J.A. Low lumbar spine bone mineral density in both male and female endurance runners. Bone 2006, 39, 880–885. [Google Scholar] [CrossRef] [PubMed]
- Kusy, K.; Zielinski, J. Sprinters versus long-distance runners: how to grow old healthy. Exerc. Sport Sci. Rev. 2015, 43, 57–64. [Google Scholar] [CrossRef] [PubMed]
- Bennell, K.L.; Malcolm, S.A.; Khan, K.M.; Thomas, S.A.; Reid, S.J.; Brukner, P.D.; Ebeling, P.R.; Wark, J.D. Bone mass and bone turnover in power athletes, endurance athletes, and controls: A 12-month longitudinal study. Bone 1997, 20, 477–484. [Google Scholar] [CrossRef]
- Wosk, J.; Voloshin, A. Wave attenuation in skeletons of young healthy persons. J. Biomech. 1981, 14, 261–267. [Google Scholar] [CrossRef]
- Barrack, M.T.; Rauh, M.J.; Nichols, J.F. Cross-sectional evidence of suppressed bone mineral accrual among female adolescent runners. J. Bone Miner. Res. 2010, 25, 1850–1857. [Google Scholar] [CrossRef] [PubMed]
- Gordon, C.M.; Bachrach, L.K.; Carpenter, T.O.; Crabtree, N.; El-Hajj Fuleihan, G.; Kutilek, S.; Lorenc, R.S.; Tosi, L.L.; Ward, K.A.; Ward, L.M.; et al. Dual energy X-ray absorptiometry interpretation and reporting in children and adolescents: The 2007 ISCD Pediatric Official Positions. J. Clin. Densitom. 2008, 11, 43–58. [Google Scholar] [CrossRef] [PubMed]
- The American Congress of Obstetricians and Gynecologists (ACOG). Menstruation in girls and adolescents: Using the menstrual cycle as a vital sign. Obstet. Gynecol. 2006, 108, 1323–1328. [Google Scholar]
- Takahashi, K.; Yoshiyama, Y.; Kaimoto, T.; Kunii, D.; Komatsu, T.; Yamamoto, S. Validation of a food frequency questionair based on food groups for estimating individual nutrient intake. Jpn. J. Nutr. Diet. 2001, 59, 221–232. [Google Scholar] [CrossRef]
- Valimaki, V.V.; Alfthan, H.; Lehmuskallio, E.; Loyttyniemi, E.; Sahi, T.; Suominen, H.; Valimaki, M.J. Risk factors for clinical stress fractures in male military recruits: A prospective cohort study. Bone 2005, 37, 267–273. [Google Scholar] [CrossRef] [PubMed]
- Heaney, R.P.; Abrams, S.; Dawson-Hughes, B.; Looker, A.; Marcus, R.; Matkovic, V.; Weaver, C. Peak bone mass. Osteoporos. Int. 2000, 11, 985–1009. [Google Scholar] [CrossRef] [PubMed]
- Groothausen, J.; Siemer, H.; Kemper, H.C.G.; Twisk, J.; Welten, D.C. Influence of peak strain on lumbar bone mineral density: An analysis of 15-year physical activity in young males and females. Pediatr. Exerc. Sci. 1997, 9, 159–173. [Google Scholar] [CrossRef]
- Frost, H.M. Why do marathon runners have less bone than weight lifters? A vital-biomechanical view and explanation. Bone 1997, 20, 183–189. [Google Scholar] [CrossRef]
- Winters, K.M.; Adams, W.C.; Meredith, C.N.; Loan, M.D.; Lasley, B.L. Bone density and cyclic ovarian function in trained runners and active controls. Med. Sci. Sports Exerc. 1996, 28, 776–785. [Google Scholar] [CrossRef] [PubMed]
- Burrows, M.; Nevill, A.M.; Bird, S.; Simpson, D. Physiological factors associated with low bone mineral density in female endurance runners. Br. J. Sports Med. 2003, 37, 67–71. [Google Scholar] [CrossRef] [PubMed]
- Ackerman, K.E.; Nazem, T.; Chapko, D.; Russell, M.; Mendes, N.; Taylor, A.P.; Bouxsein, M.L.; Misra, M. Bone microarchitecture is impaired in adolescent amenorrheic athletes compared with eumenorrheic athletes and nonathletic controls. J. Clin. Endocrinol. Metab. 2011, 96, 3123–3133. [Google Scholar] [CrossRef] [PubMed]
- Grinspoon, S.; Baum, H.; Lee, K.; Anderson, E.; Herzog, D.; Klibanski, A. Effects of short-term recombinant human insulin-like growth factor I administration on bone turnover in osteopenic women with anorexia nervosa. J. Clin. Endocrinol. Metab. 1996, 81, 3864–3870. [Google Scholar] [PubMed]
- Magkos, F.; Yannakoulia, M.; Kavouras, S.A.; Sidossis, L.S. The type and intensity of exercise have independent and additive effects on bone mineral density. Int. J. Sports Med. 2007, 28, 773–779. [Google Scholar] [CrossRef] [PubMed]
- Doyle, F.; Brown, J.; Lachance, C. Relation between bone mass and muscle weight. Lancet 1970, 1, 391–393. [Google Scholar] [CrossRef]
- Rauch, F.; Bailey, D.A.; Baxter-Jones, A.; Mirwald, R.; Faulkner, R. The ‘muscle-bone unit’ during the pubertal growth spurt. Bone 2004, 34, 771–775. [Google Scholar] [CrossRef] [PubMed]
- Takahashi, N.; Udagawa, N.; Suda, T. Vitamin D endocrine system and osteoclasts. BoneKEy Rep. 2014, 3, 495. [Google Scholar] [CrossRef] [PubMed]
- Li, D.; Hitchcock, C.L.; Barr, S.I.; Yu, T.; Prior, J.C. Negative spinal bone mineral density changes and subclinical ovulatory disturbances—Prospective data in healthy premenopausal women with regular menstrual cycles. Epidemiol. Rev. 2014, 36, 137–147. [Google Scholar] [CrossRef] [PubMed]
- Hartard, M.; Kleinmond, C.; Wiseman, M.; Weissenbacher, E.R.; Felsenberg, D.; Erben, R.G. Detrimental effect of oral contraceptives on parameters of bone mass and geometry in a cohort of 248 young women. Bone 2007, 40, 444–450. [Google Scholar] [CrossRef] [PubMed]

| Endurance Runners (n = 16) | Sprinters (n = 21) | |
|---|---|---|
| Age | 16.3 ± 0.8 | 16.0 ± 0.7 |
| Menstrual abnormality (%) | 56.3 | 23.8 ** |
| Height (cm) | 156.7 ±3.7 | 158.8 ± 4.5 |
| Weight (kg) | 47.6 ± 4.6 | 50.7 ± 5.3 |
| BMI (kg/m2) | 19.4 ± 1.5 | 20.1 ± 1.9 |
| Fat mass (%) | 19.9 ±4.6 | 19.5 ± 4.4 |
| Endurance Runners (n = 14) | Sprinters (n = 21) | |
|---|---|---|
| Practice time (min/day) | 99.6 ± 38.7 | 109.7 ± 33.1 |
| Running distance (km/week) | 58.5 ± 27.1 | 10.4 ± 5.3 ** |
| Endurance Runners (n = 16) | Sprinters (n = 21) | |
|---|---|---|
| Energy (kcal/day) | 1927 ± 336 | 2099 ± 625 |
| Protein (g/day) | 70.0 ± 15.1 | 70.2 ± 20.5 |
| Fat (g/day) | 65.1 ± 18.1 | 78.1 ± 30.3 |
| Carbohydrate (g/day) | 258.5 ± 55.6 | 271.8 ± 78.8 |
| Calcium (mg/day) | 582 ± 205 | 595 ± 270 |
| Magnesium (mg/day) | 242 ± 52 | 232 ± 92 |
| Phosphorus (mg/day) | 1052 ± 251 | 1059 ± 345 |
| Iron (mg/day) | 7.5 ± 1.6 | 7.4 ± 3.1 |
| Vitamin A (μg/day) | 578 ± 161 | 553 ± 210 |
| Vitamin D (μg/day) | 6.4 ± 2.9 | 5.2 ± 2.9 |
| Vitamin K (μg/day) | 216 ± 65 | 182 ± 84 |
| Vitamin B1 (mg/day) | 0.97 ± 0.21 | 1.00 ± 0.35 |
| Vitamin B2 (mg/day) | 1.14 ± 0.32 | 1.21 ± 0.41 |
| Vitamin B6 (mg/day) | 1.09 ± 0.22 | 1.03 ± 0.40 |
| Vitamin B12 (μg/day) | 6.0 ± 2.3 | 5.4 ± 2.6 |
| Vitamin C (mg/day) | 104 ± 25 | 88 ± 43 |
| Endurance Runners (n = 16) | Sprinters (n = 21) | ||
|---|---|---|---|
| FFM | Arms (kg) | 3.2 ± 0.3 | 3.6 ± 0.4 ** |
| Legs (kg) | 12.5 ± 1.3 | 13.7 ± 1.1 ** | |
| Torso (kg) | 17.0 ±1.7 | 17.8 ± 1.3 | |
| Gynoid (kg) | 5.4 ± 0.5 | 5.9 ± 0.5 ** | |
| Total body (kg) | 36.0 ± 3.2 | 38.3 ± 2.6 * | |
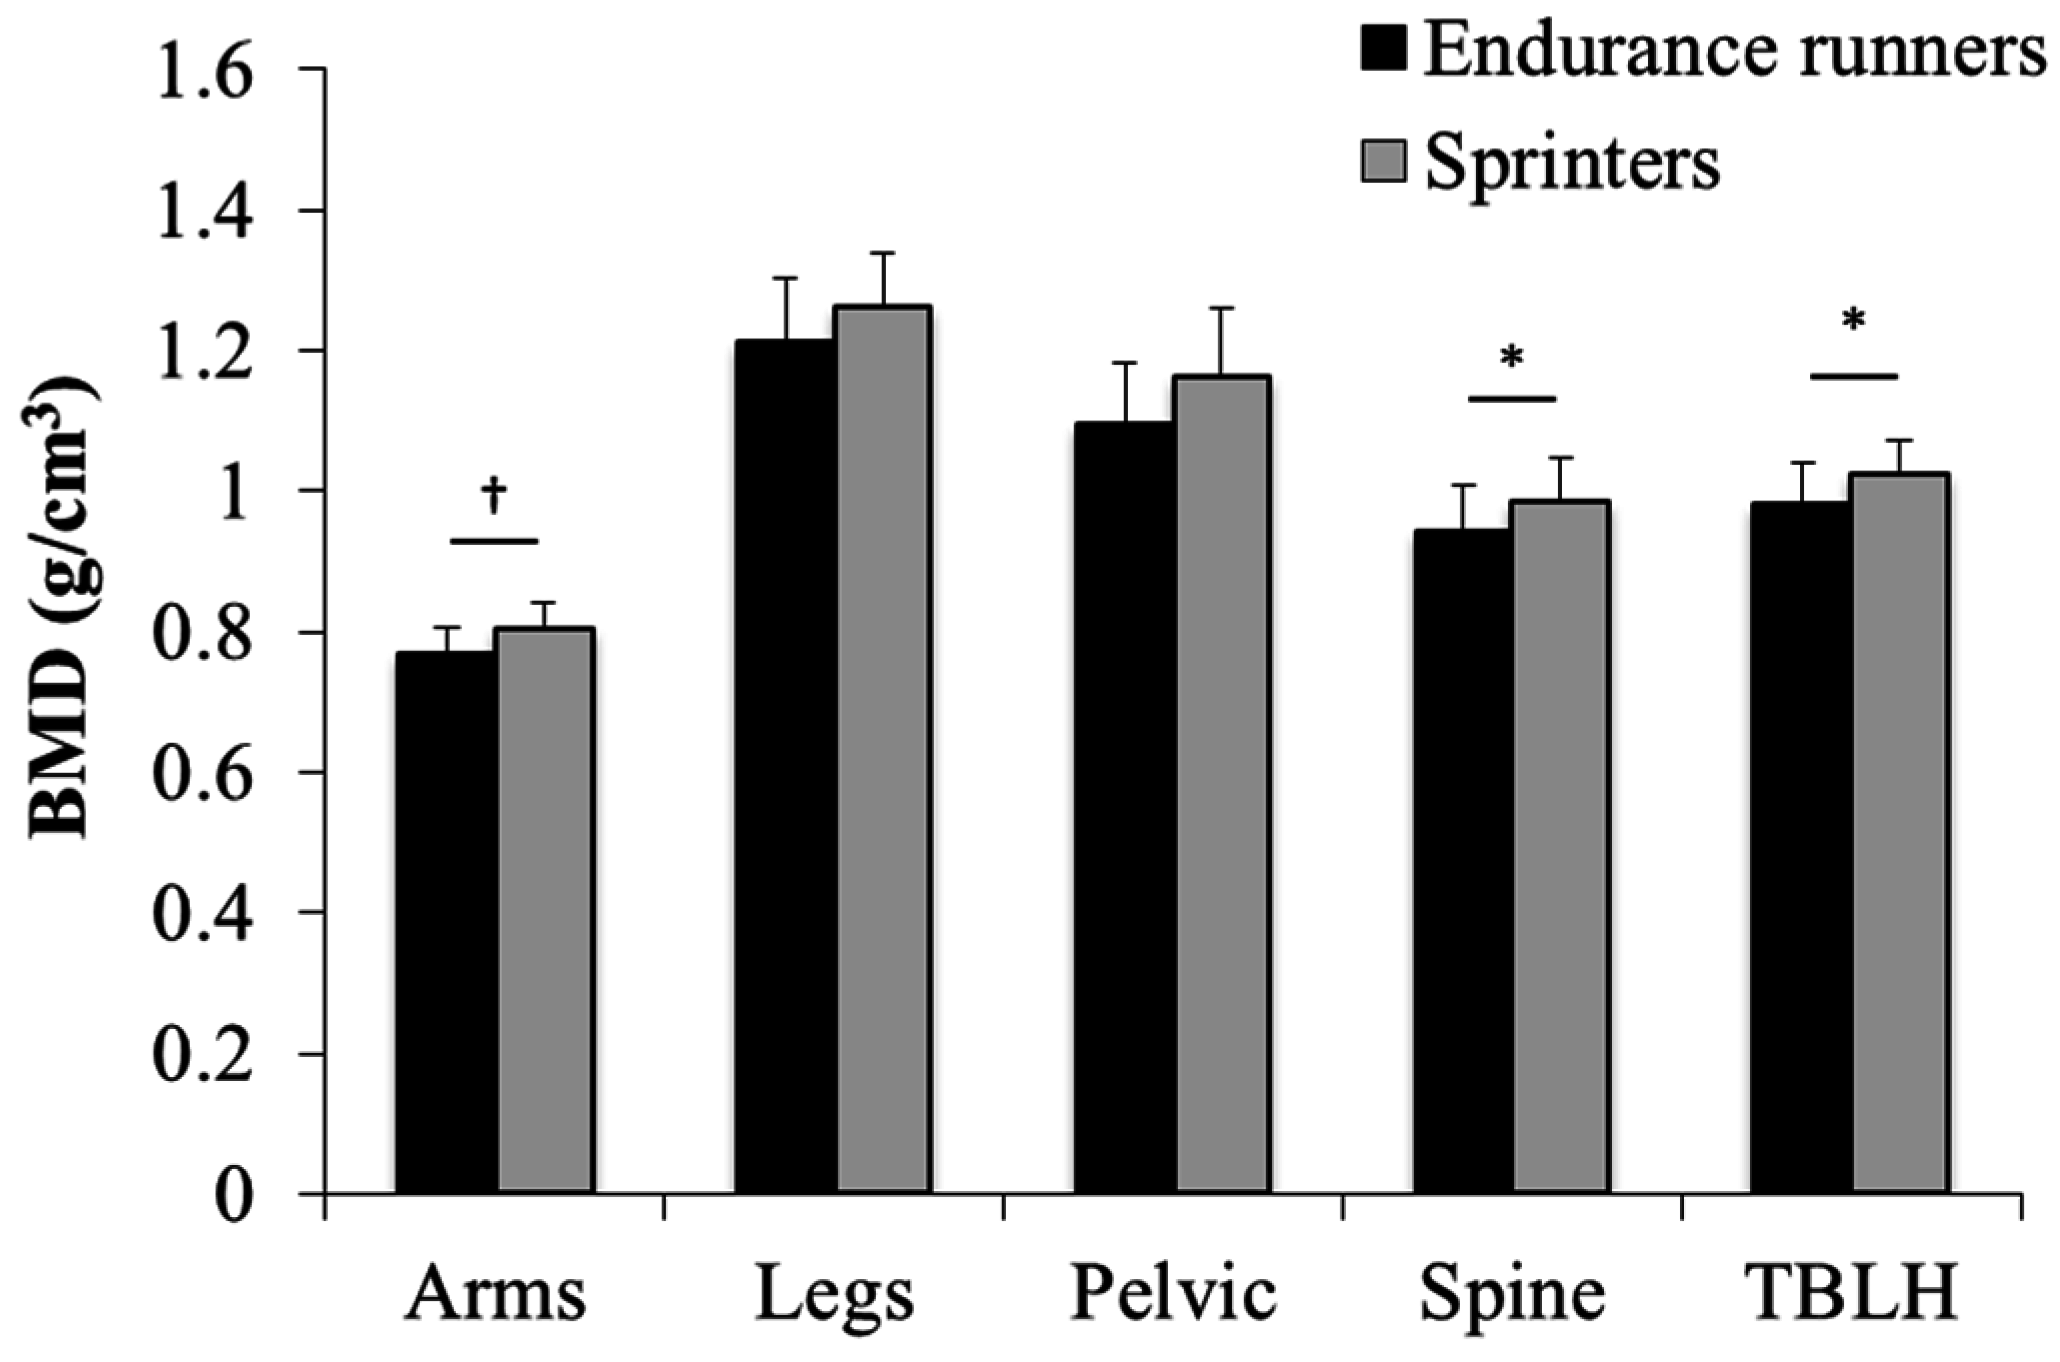
| BMD | Arms (g/cm2) | 0.767 ± 0.039 | 0.805 ± 0.038 ** |
| Legs (g/cm2) | 1.211 ± 0.091 | 1.262 ± 0.077 | |
| Pelvic (g/cm2) | 1.097 ± 0.086 | 1.163 ± 0.099 * | |
| Spine (g/cm2) | 0.942 ± 0.064 | 0.985 ± 0.062 * | |
| TBLH (g/cm2) | 0.981 ± 0.061 | 1.023 ± 0.050 * |
| Arms | Legs | Pelvic | Spine | TBLH | |
|---|---|---|---|---|---|
| Age | 0.48 | 1.74 | 2.61 | 0.06 | 0.48 |
| Height | 0.34 | 0.06 | 0.01 | 0.00 | 0.06 |
| FFM (each site) | 11.37 ** | 4.83 * | 7.49 * | 0.05 | 4.13 † |
| Fat-mass (each site) | 0.86 | 0.10 | 3.45 | 0.21 | 0.25 |
| Menstrual abnormality | 0.40 | 2.05 | 0.14 | 1.31 | 0.86 |
| Menarche | 6.13 * | 1.78 | 0.17 | 1.04 | 1.61 |
| Stress fracture history | 2.00 | 0.97 | 0.18 | 0.88 | 1.29 |
| Vitamin D intake | 4.82 * | 1.49 | 8.08 ** | 4.31 * | 4.04 † |
© 2016 by the authors; licensee MDPI, Basel, Switzerland. This article is an open access article distributed under the terms and conditions of the Creative Commons Attribution (CC-BY) license (http://creativecommons.org/licenses/by/4.0/).
Share and Cite
Ikedo, A.; Ishibashi, A.; Matsumiya, S.; Kaizaki, A.; Ebi, K.; Fujita, S. Comparison of Site-Specific Bone Mineral Densities between Endurance Runners and Sprinters in Adolescent Women. Nutrients 2016, 8, 781. https://doi.org/10.3390/nu8120781
Ikedo A, Ishibashi A, Matsumiya S, Kaizaki A, Ebi K, Fujita S. Comparison of Site-Specific Bone Mineral Densities between Endurance Runners and Sprinters in Adolescent Women. Nutrients. 2016; 8(12):781. https://doi.org/10.3390/nu8120781
Chicago/Turabian StyleIkedo, Aoi, Aya Ishibashi, Saori Matsumiya, Aya Kaizaki, Kumiko Ebi, and Satoshi Fujita. 2016. "Comparison of Site-Specific Bone Mineral Densities between Endurance Runners and Sprinters in Adolescent Women" Nutrients 8, no. 12: 781. https://doi.org/10.3390/nu8120781