Which Diet-Related Behaviors in Childhood Influence a Healthier Dietary Pattern? From the Ewha Birth and Growth Cohort

 ,
,
Abstract
:1. Introduction
2. Methods
2.1. Study Subjects
2.2. Dietary Data and Dietary Pattern Analysis
2.3. Dietary Habits
- DH1. Do you eat more than two servings of milk or dairy products every day?
- DH2. Do you eat meat, fish, egg, beans, or tofu with every meal?
- DH3. Do you eat vegetables other than kimchi with every meal?
- DH4. Do you eat one serving size of fruit or drink one portion of fruit juice every day?
- DH5. Do you eat more than two servings of fried or stir-fried food every week?
- DH6. Do you eat more than two servings of fatty meat (e.g., bacon, ribs, eel) every week?
- DH7. Do you generally add table salt or soy sauce to food?
- DH8. Do you eat three regular meals per day?
- DH9. Do you eat ice cream, cake, snacks, and soda (e.g., cola, cider) as snacks more than twice a week?
- DH10. Do you eat a variety of food every day?
2.4. Other Variables
2.5. Statistical Analysis
3. Results
4. Discussion
5. Conclusions
Supplementary Materials
Acknowledgments
Author Contributions
Conflicts of Interest
References
- Patterson, E.; Wärnberg, J.; Kearney, J.; Sjöström, M. The tracking of dietary intakes of children and adolescents in Sweden over six years: The European Youth Heart Study. Int. J. Behav. Nutr. Phys. Act. 2009, 6, 91. [Google Scholar] [CrossRef] [PubMed]
- Burke, V.; Beilin, L.J.; Dunbar, D. Family lifestyle and parental body mass index as predictors of body mass index in Australian children: A longitudinal study. Int. J. Obes. Relat. Metab. Disord. 2001, 25, 147–157. [Google Scholar] [CrossRef] [PubMed]
- Wang, Y.; Bentley, M.E.; Zhai, F.; Popkin, B.M. Tracking of dietary intake patterns of Chinese from childhood to adolescence over a six-year follow-up period. J. Nutr. 2002, 132, 430–438. [Google Scholar] [PubMed]
- Emmett, P.M.; Jones, L.R.; Northstone, K. Dietary patterns in the Avon longitudinal study of parents and children. Nutr. Rev. 2015, 73, 207–230. [Google Scholar] [CrossRef] [PubMed]
- Northstone, K.; Emmett, P.M. Are dietary patterns stable throughout early and mid-childhood? A birth cohort study. Br. J. Nutr. 2008, 100, 1069–1076. [Google Scholar] [CrossRef] [PubMed]
- Lipsky, L.M.; Haynie, D.L.; Liu, D.; Chaurasia, A.; Gee, B.; Li, K.; Iannotti, R.J.; Simons-Morton, B. Trajectories of eating behaviors in a nationally representative cohort of U.S. adolescents during the transition to young adulthood. Int. J. Behav. Nutr. Phys. Act. 2015, 12, 138. [Google Scholar] [CrossRef] [PubMed]
- Mikkilä, V.; Räsänen, L.; Raitakari, O.T.; Pietinen, P.; Viikari, J. Consistent dietary patterns identified from childhood to adulthood: The cardiovascular risk in young Finns study. Br. J. Nutr. 2005, 93, 923–931. [Google Scholar] [CrossRef] [PubMed]
- Birch, L.; Savage, J.S.; Ventura, A. Influences on the development of children’s eating behaviours: From infancy to adolescence. Can. J. Diet. Pract. Res. 2007, 68, s1–s56. [Google Scholar] [PubMed]
- Racey, M.; O’Brien, C.; Douglas, S.; Marquez, O.; Hendrie, G.; Newton, G. Systematic review of school-based interventions to modify dietary behavior: Does intervention intensity impact effectiveness? J. Sch. Health 2016, 86, 452–463. [Google Scholar] [CrossRef] [PubMed]
- Evans, C.E.; Christian, M.S.; Cleghorn, C.L.; Greenwood, D.C.; Cade, J.E. Systematic review and meta-analysis of school-based interventions to improve daily fruit and vegetable intake in children aged 5 to 12 years. Am. J. Clin. Nutr. 2012, 96, 889–901. [Google Scholar] [CrossRef] [PubMed]
- Hoffmann, K.; Schulze, M.B.; Schienkiewitz, A.; Nöthlings, U.; Boeing, H. Application of a new statistical method to derive dietary patterns in nutritional epidemiology. Am. J. Epidemiol. 2004, 159, 935–944. [Google Scholar] [CrossRef] [PubMed]
- Hu, F.B. Dietary pattern analysis: A new direction in nutritional epidemiology. Curr. Opin. Lipidol. 2002, 13, 3–9. [Google Scholar] [CrossRef] [PubMed]
- Borges, C.A.; Rinaldi, A.E.; Conde, W.L.; Mainardi, G.M.; Behar, D.; Slater, B. Dietary patterns: A literature review of the methodological characteristics of the main step of the multivariate analyzes. Rev. Bras. Epidemiol. 2015, 18, 837–857. [Google Scholar] [CrossRef] [PubMed]
- Leventakou, V.; Sarri, K.; Georgiou, V.; Chatzea, V.; Frouzi, E.; Kastelianou, A.; Gatzou, A.; Kogevinas, M.; Chatzi, L. Early life determinants of dietary patterns in preschool children: Rhea mother-child cohort, Crete, Greece. Eur. J. Clin. Nutr. 2016, 70, 60–65. [Google Scholar] [CrossRef] [PubMed]
- Pisa, P.T.; Pedro, T.M.; Kahn, K.; Tollman, S.M.; Pettifor, J.M.; Norris, S.A. Nutrient patterns and their association with socio-demographic, lifestyle factors and obesity risk in rural South African adolescents. Nutrients 2015, 7, 3464–3482. [Google Scholar] [CrossRef] [PubMed]
- Lee, H.A.; Park, E.A.; Cho, S.J.; Kim, H.S.; Kim, Y.J.; Lee, H.; Gwak, H.S.; Kim, K.N.; Chang, N.; Ha, E.H.; et al. Mendelian randomization analysis of the effect of maternal homocysteine during pregnancy, as represented by maternal MTHFR C677T genotype, on birth weight. J. Epidemiol. 2013, 23, 371–375. [Google Scholar] [CrossRef] [PubMed]
- Lee, H.A.; Kim, Y.J.; Lee, H.; Gwak, H.S.; Hong, Y.S.; Kim, H.S.; Park, E.A.; Cho, S.J.; Ha, E.H.; Park, H. The preventive effect of breast-feeding for longer than 6 months on early pubertal development among children aged 7–9 years in Korea. Public Health Nutr. 2015, 18, 3300–3307. [Google Scholar] [CrossRef] [PubMed]
- Oh, S.Y.; Chung, J.; Kim, M.; Kwon, S.O.; Cho, B. Antioxidant nutrient intakes and corresponding biomarkers associated with the risk of atopic dermatitis in young children. Eur. J. Clin. Nutr. 2010, 64, 245–252. [Google Scholar] [CrossRef] [PubMed]
- Chung, J.; Kwon, S.O.; Ahn, H.; Hwang, H.; Hong, J.S.; Oh, S.Y. Association between dietary patterns and atopic dermatitis in relation to GSTM1 and GSTT1 polymorphisms in young children nutrients. Nutrients 2015, 7, 9440–9452. [Google Scholar] [CrossRef] [PubMed]
- Shin, K.O.; Oh, S.Y.; Park, H.S. Empirically derived major dietary patterns and their associations with overweight in Korean preschool children. Br. J. Nutr. 2007, 98, 416–421. [Google Scholar] [CrossRef] [PubMed]
- Ambrosini, G.L.; Emmett, P.M.; Northstone, K.; Jebb, S.A. Tracking a dietary pattern associated with increased adiposity in childhood and adolescence. Obesity (Silver Spring) 2014, 22, 458–465. [Google Scholar] [CrossRef] [PubMed]
- Kim, W.Y.; Cho, M.S.; Lee, H.S. Development and validation of mini dietary assessment index for Koreans. Korean J. Nutr. 2003, 36, 82–92. [Google Scholar]
- Park, S.; Cho, S.C.; Hong, Y.C.; Oh, S.Y.; Kim, J.W.; Shin, M.S.; Kim, B.N.; Yoo, H.J.; Cho, I.H.; Bhang, S.Y. Association between dietary behaviors and attention-deficit/hyperactivity disorder and learning disabilities in school-aged children. Psychiatry Res. 2012, 198, 468–476. [Google Scholar] [CrossRef] [PubMed]
- Gorgulho, B.M.; Pot, G.K.; Sarti, F.M.; Marchioni, D.M. Indices for the assessment of nutritional quality of meals: A systematic review. Br. J. Nutr. 2016, 115, 2017–2024. [Google Scholar] [CrossRef] [PubMed]
- Alissa, E.M.; Ferns, G.A. Dietary fruits and vegetables and cardiovascular diseases risk. Crit. Rev. Food Sci. Nutr. 2015. [Google Scholar] [CrossRef] [PubMed]
- Hung, H.C.; Joshipura, K.J.; Jiang, R.; Hu, F.B.; Hunter, D.; Smith-Warner, S.A.; Colditz, G.A.; Rosner, B.; Spiegelman, D.; Willett, W.C. Fruit and vegetable intake and risk of major chronic disease. JNCI J. Natl. Cancer Inst. 2004, 96, 1577–1584. [Google Scholar] [CrossRef] [PubMed]
- Jang, Y.A.; Lee, H.S.; Kim, B.H.; Lee, Y.; Lee, H.J.; Moon, J.J.; Kim, C.I. Revised dietary guidelines for Koreans. Asia Pac. J. Clin. Nutr. 2008, 17, 55–58. [Google Scholar]
- Im, J.G.; Kim, S.H.; Lee, G.Y.; Joung, H.; Park, M.J. Inadequate calcium intake is highly prevalent in Korean children and adolescents: The Korea National Health and Nutrition Examination Survey (KNHANES) 2007–2010. Public Health Nutr. 2014, 17, 2489–2495. [Google Scholar] [CrossRef] [PubMed]
- Kim, S.; Moon, S.; Popkin, B.M. The nutrition transition in South Korea. Am. J. Clin. Nutr. 2000, 71, 44–53. [Google Scholar] [PubMed]
- Woo, H.D.; Shin, A.; Kim, J. Dietary patterns of Korean adults and the prevalence of metabolic syndrome: A cross-sectional study. PLoS ONE 2014, 9, e111593. [Google Scholar] [CrossRef] [PubMed]
- Striegel-Moore, R.H.; Thompson, D.; Affenito, S.G.; Franko, D.L.; Obarzanek, E.; Barton, B.A.; Schreiber, G.B.; Daniels, S.R.; Schmidt, M.; Crawford, P.B. Correlates of beverage intake in adolescent girls: The National Heart, Lung, and Blood Institute Growth and Health Study. J. Pediatr. 2006, 148, 183–187. [Google Scholar] [CrossRef] [PubMed]
- Demory-Luce, D.; Morales, M.; Nicklas, T.; Baranowski, T.; Zakeri, I.; Berenson, G. Changes in food group consumption patterns from childhood to young adulthood: The Bogalusa Heart Study. J. Am. Diet. Assoc. 2004, 104, 1684–1691. [Google Scholar] [CrossRef] [PubMed]
- Northstone, K.; Emmett, P. Multivariate analysis of diet in children at four and seven years of age and associations with socio-demographic characteristics. Eur. J. Clin. Nutr. 2005, 59, 751–760. [Google Scholar] [CrossRef] [PubMed]
- Béghin, L.; Dauchet, L.; De Vriendt, T.; Cuenca-García, M.; Manios, Y.; Toti, E.; Plada, M.; Widhalm, K.; Repasy, J.; Huybrechts, I.; et al. Influence of parental socio-economic status on diet quality of European adolescents: Results from the HELENA study. Br. J. Nutr. 2014, 111, 1303–1312. [Google Scholar] [CrossRef] [PubMed]
- Darmon, N.; Drewnowski, A. Does social class predict diet quality? Am. J. Clin. Nutr. 2008, 87, 1107–1117. [Google Scholar] [PubMed]

| Healthy Intake | Animal Food Intake | Snack Intake | ||||
|---|---|---|---|---|---|---|
| 7 Years | 9 Years | 7 Years | 9 Years | 7 Years | 9 Years | |
| Variance | 13.83% | 15.12% | 10.23% | 16.20% | 8.21% | 7.77% |
| Yellow vegetables | 0.840 | 0.820 | 0.070 | 0.108 | −0.020 | 0.050 |
| Green vegetables | 0.800 | 0.795 | 0.149 | 0.105 | 0.045 | 0.074 |
| White vegetables | 0.475 | 0.417 | 0.268 | 0.014 | −0.040 | 0.057 |
| Mushrooms | 0.802 | 0.677 | −0.066 | 0.081 | −0.037 | 0.126 |
| Beans | 0.476 | 0.522 | 0.181 | 0.089 | 0.198 | 0.091 |
| Potatoes | 0.280 | 0.468 | 0.071 | 0.056 | 0.227 | 0.277 |
| Fruit | 0.271 | 0.341 | 0.160 | 0.038 | 0.151 | 0.148 |
| Nuts | 0.222 | 0.418 | 0.200 | 0.090 | 0.044 | 0.150 |
| Shellfish | 0.106 | 0.019 | 0.798 | 0.948 | 0.073 | 0.047 |
| White fish | 0.092 | 0.009 | 0.714 | 0.938 | 0.152 | 0.022 |
| Blue fish | 0.144 | 0.200 | 0.598 | 0.909 | 0.257 | 0.063 |
| Meat | 0.444 | 0.081 | 0.587 | 0.853 | 0.125 | 0.239 |
| Eggs | 0.276 | 0.136 | 0.120 | 0.400 | 0.268 | −0.007 |
| Rice | 0.066 | 0.089 | 0.224 | −0.037 | 0.063 | 0.072 |
| Bread | 0.108 | 0.078 | −0.023 | 0.033 | 0.712 | 0.399 |
| Jam | −0.006 | 0.192 | 0.023 | 0.005 | 0.617 | 0.396 |
| Soda | 0.047 | 0.226 | 0.094 | 0.024 | 0.394 | 0.559 |
| Milk | 0.235 | 0.388 | 0.028 | 0.065 | 0.346 | 0.459 |
| Candy | −0.047 | 0.048 | 0.109 | 0.011 | 0.339 | 0.509 |
| Pizza | −0.030 | 0.042 | 0.240 | 0.059 | 0.322 | 0.424 |
| Noodles | 0.054 | 0.070 | 0.175 | 0.075 | 0.251 | 0.433 |
| Seaweed | 0.089 | 0.529 | 0.138 | 0.083 | 0.234 | 0.127 |
| Potential Factor at 7 Years | Dietary Pattern Scores at 7 Years Old | Dietary Pattern Scores at 9 Years Old | ||||||||||
|---|---|---|---|---|---|---|---|---|---|---|---|---|
| Healthy Intake | Animal Food Intake | Snack Intake | Healthy Intake | Animal Food Intake | Snack Intake | |||||||
| β | S.E. | β | S.E. | β | S.E. | β | S.E. | β | S.E. | β | S.E. | |
| Sex | −0.010 | 0.06 | 0.183 a | 0.06 | −0.078 | 0.10 | −0.027 | 0.10 | 0.056 | 0.13 | 0.127 | 0.18 |
| Monthly household income | 0.023 | 0.04 | 0.003 | 0.04 | 0.014 | 0.07 | 0.037 | 0.07 | 0.068 | 0.09 | 0.186 | 0.13 |
| Body mass index (BMI) | −0.007 | 0.02 | −0.0002 | 0.02 | −0.016 | 0.03 | −0.011 | 0.03 | −0.021 | 0.04 | 0.005 | 0.05 |
| Maternal obesity | 0.007 | 0.08 | −0.002 | 0.08 | −0.222 | 0.14 | −0.051 | 0.14 | 0.022 | 0.18 | 0.007 | 0.24 |
| Watching television (TV) | −0.043 | 0.04 | 0.057 | 0.04 | 0.152 a | 0.07 | −0.004 | 0.07 | −0.052 | 0.09 | 0.015 | 0.13 |
| Eating breakfast every day | 0.242 a | 0.10 | −0.071 | 0.10 | −0.071 | 0.17 | 0.091 | 0.16 | 0.206 | 0.20 | −0.296 | 0.28 |
| Healthy dietary habits | ||||||||||||
| DH1 | 0.071 | 0.05 | 0.036 | 0.05 | 0.129 | 0.08 | 0.026 | 0.07 | −0.0004 | 0.09 | 0.152 | 0.13 |
| DH2 | −0.002 | 0.05 | 0.071 | 0.05 | 0.016 | 0.09 | −0.048 | 0.09 | 0.007 | 0.11 | −0.114 | 0.16 |
| DH3 | 0.068 | 0.05 | 0.026 | 0.05 | −0.226 a | 0.08 | −0.153 | 0.08 | −0.067 | 0.10 | −0.435 a | 0.14 |
| DH4 | 0.048 | 0.05 | −0.043 | 0.05 | 0.117 | 0.09 | 0.154 | 0.08 | −0.120 | 0.10 | 0.028 | 0.14 |
| DH8 | 0.075 | 0.06 | 0.069 | 0.06 | −0.069 | 0.11 | −0.083 | 0.10 | 0.069 | 0.13 | 0.063 | 0.18 |
| DH10 | 0.190 a | 0.05 | 0.047 | 0.05 | 0.114 | 0.08 | 0.166 a | 0.07 | −0.021 | 0.09 | 0.123 | 0.13 |
| Unhealthy dietary habits | ||||||||||||
| DH5 | 0.064 | 0.05 | 0.021 | 0.05 | −0.047 | 0.08 | −0.129 | 0.07 | −0.035 | 0.09 | −0.245 | 0.13 |
| DH6 | −0.038 | 0.05 | −0.154 a | 0.05 | −0.105 | 0.08 | −0.047 | 0.08 | −0.048 | 0.11 | 0.250 | 0.15 |
| DH7 | −0.005 | 0.06 | −0.127 a | 0.06 | −0.152 | 0.10 | −0.027 | 0.10 | −0.052 | 0.12 | −0.358 a | 0.17 |
| DH9 | 0.010 | 0.04 | −0.007 | 0.04 | −0.113 | 0.07 | 0.006 | 0.07 | 0.024 | 0.08 | −0.160 | 0.12 |
| Dietary Pattern Scores | Tracking Coefficient † | At 7 Years | At 9 Years ‡ | Differences of Dietary Pattern Scores ‡ | Paired t Test p | |||
|---|---|---|---|---|---|---|---|---|
| Mean | S.D. | Mean | S.D. | Mean | S.D. | |||
| Healthy intake | 0.369 a | −0.106 | 0.498 | 0.062 | 0.613 | 0.176 | 0.624 | <0.001 |
| Animal food intake | 0.215 b | −0.091 | 0.479 | 0.123 | 0.691 | 0.204 | 0.717 | <0.001 |
| Snack intake | 0.526 a | −0.003 | 0.861 | 0.213 | 0.969 | 0.161 | 0.864 | 0.02 |
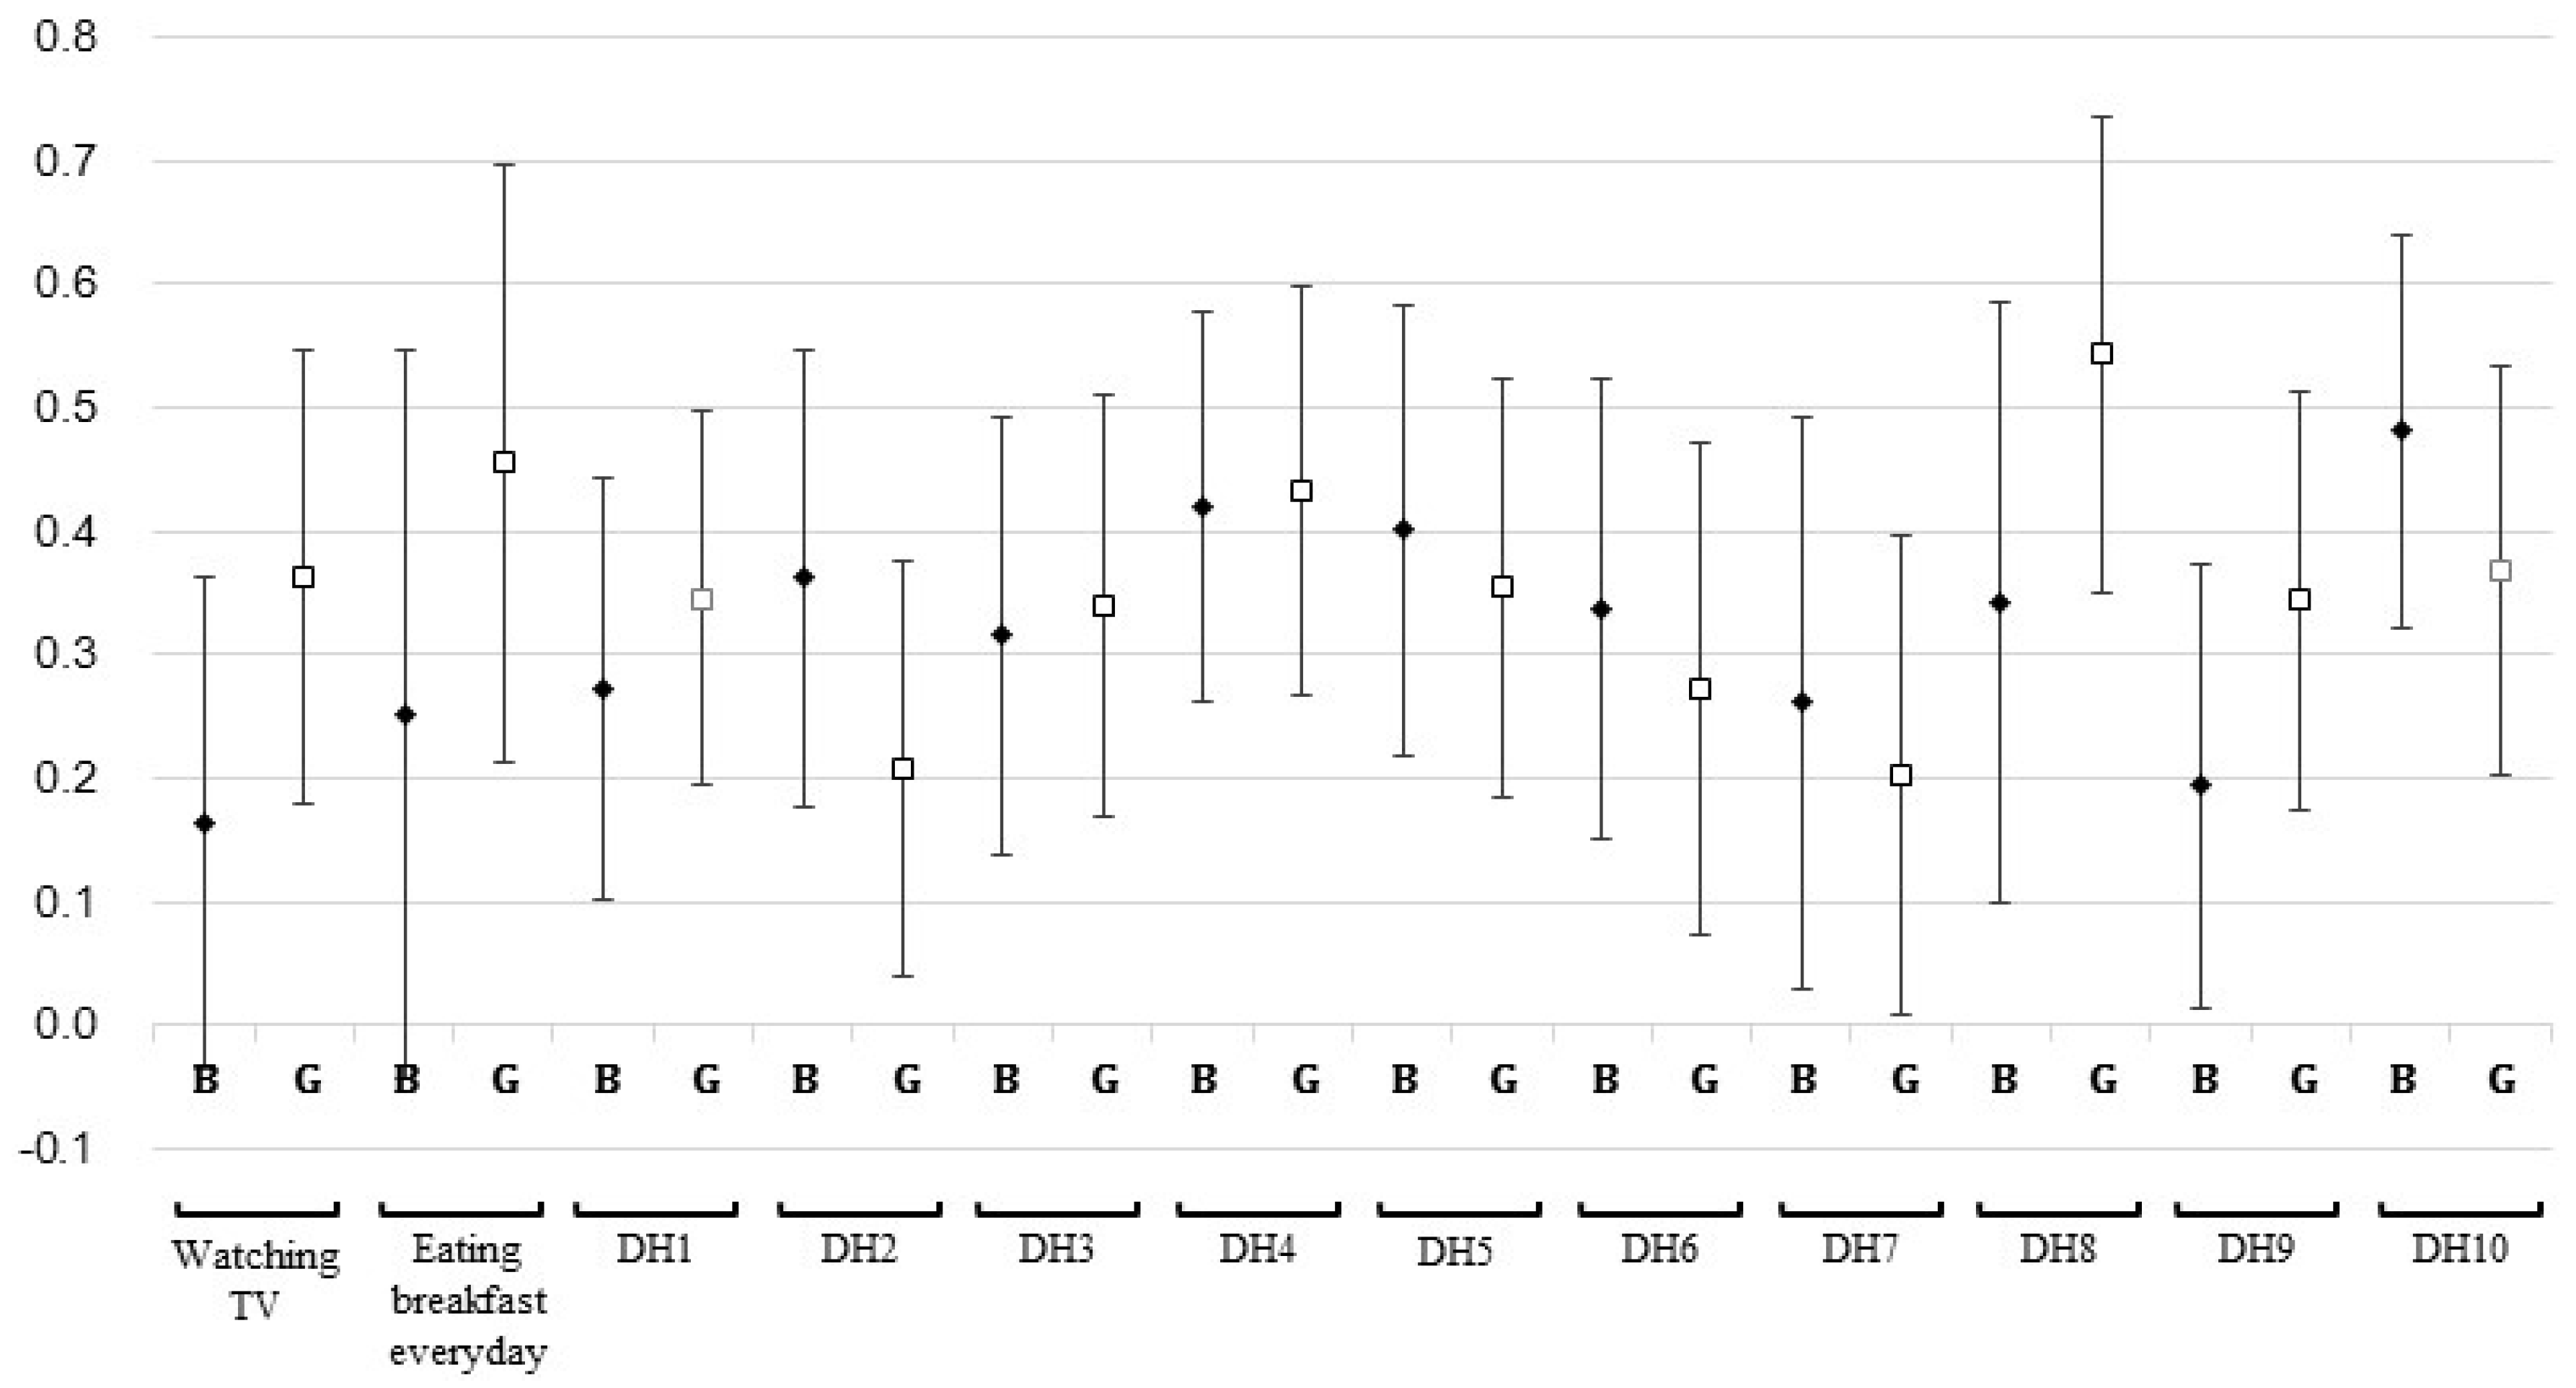
| Sex-Adjusted Weighted Kappa | Stable | Increased | Decreased | ||||
|---|---|---|---|---|---|---|---|
| n | % | n | % | n | % | ||
| Watching TV | 0.271 | 75 | 56.39 | 27 | 20.30 | 31 | 23.31 |
| Eating breakfast | 0.373 | 128 | 83.12 | 9 | 5.84 | 17 | 11.04 |
| Healthy dietary habits | |||||||
| DH1 | 0.314 | 75 | 49.02 | 30 | 19.61 | 48 | 31.37 |
| DH2 | 0.277 | 82 | 53.95 | 34 | 22.37 | 36 | 23.68 |
| DH3 | 0.328 | 83 | 54.25 | 39 | 25.49 | 31 | 20.26 |
| DH4 | 0.427 | 90 | 59.21 | 25 | 16.45 | 37 | 24.34 |
| DH8 | 0.466 | 115 | 75.66 | 18 | 11.84 | 19 | 12.5 |
| DH10 | 0.427 | 88 | 57.52 | 42 | 27.45 | 23 | 15.03 |
| Unhealthy dietary habits | |||||||
| DH5 | 0.376 | 90 | 59.21 | 27 | 17.76 | 35 | 23.03 |
| DH6 | 0.307 | 97 | 63.4 | 27 | 17.65 | 29 | 18.95 |
| DH7 | 0.227 | 101 | 66.01 | 25 | 16.34 | 27 | 17.65 |
| DH9 | 0.273 | 74 | 48.68 | 41 | 26.97 | 37 | 24.34 |
| Difference in Dietary Pattern 1 Score | Difference in Dietary Pattern 2 Score | Difference in Dietary Pattern 3 Score | |||||
|---|---|---|---|---|---|---|---|
| β | S.E. | β | S.E. | β | S.E. | ||
| Eating breakfast | increased | −0.057 | 0.23 | −0.483 | 0.29 | 0.251 | 0.35 |
| decreased | −0.175 | 0.17 | −0.375 | 0.23 | −0.013 | 0.27 | |
| Healthy dietary habits | |||||||
| DH1 | increased | 0.374 a | 0.15 | 0.122 | 0.20 | 0.240 | 0.23 |
| decreased | 0.143 | 0.13 | 0.255 | 0.17 | 0.130 | 0.20 | |
| DH2 | increased | −0.089 | 0.14 | 0.152 | 0.18 | 0.060 | 0.21 |
| decreased | −0.215 | 0.14 | −0.233 | 0.17 | −0.134 | 0.21 | |
| DH3 | increased | 0.272 a | 0.13 | −0.136 | 0.17 | 0.278 | 0.20 |
| decreased | 0.167 | 0.15 | 0.078 | 0.19 | 0.263 | 0.23 | |
| DH4 | increased | −0.073 | 0.15 | 0.128 | 0.20 | 0.021 | 0.24 |
| decreased | −0.196 | 0.13 | −0.042 | 0.17 | −0.174 | 0.20 | |
| DH8 | increased | −0.108 | 0.17 | 0.141 | 0.23 | −0.140 | 0.26 |
| decreased | 0.037 | 0.17 | 0.235 | 0.22 | −0.073 | 0.25 | |
| DH10 | increased | 0.117 | 0.13 | 0.099 | 0.17 | 0.090 | 0.20 |
| decreased | −0.301 a | 0.15 | 0.021 | 0.20 | −0.285 | 0.23 | |
| Unhealthy dietary habits | |||||||
| DH5 | increased | 0.153 | 0.14 | 0.046 | 0.19 | 0.219 | 0.22 |
| decreased | −0.310 a | 0.14 | −0.199 | 0.18 | −0.261 | 0.22 | |
| DH6 | increased | 0.095 | 0.15 | −0.090 | 0.19 | −0.176 | 0.22 |
| decreased | −0.070 | 0.14 | 0.166 | 0.19 | −0.033 | 0.22 | |
| DH7 | increased | −0.137 | 0.16 | −0.287 | 0.20 | −0.081 | 0.23 |
| decreased | −0.051 | 0.14 | 0.009 | 0.18 | 0.047 | 0.22 | |
| DH9 | increased | −0.010 | 0.13 | −0.227 | 0.17 | 0.019 | 0.20 |
| decreased | 0.239 | 0.14 | 0.390 a | 0.18 | 0.348 | 0.21 | |
© 2016 by the authors; licensee MDPI, Basel, Switzerland. This article is an open access article distributed under the terms and conditions of the Creative Commons Attribution (CC-BY) license (http://creativecommons.org/licenses/by/4.0/).
Share and Cite
Lee, H.A.; Hwang, H.J.; Oh, S.Y.; Park, E.A.; Cho, S.J.; Kim, H.S.; Park, H. Which Diet-Related Behaviors in Childhood Influence a Healthier Dietary Pattern? From the Ewha Birth and Growth Cohort. Nutrients 2017, 9, 4. https://doi.org/10.3390/nu9010004
Lee HA, Hwang HJ, Oh SY, Park EA, Cho SJ, Kim HS, Park H. Which Diet-Related Behaviors in Childhood Influence a Healthier Dietary Pattern? From the Ewha Birth and Growth Cohort. Nutrients. 2017; 9(1):4. https://doi.org/10.3390/nu9010004
Chicago/Turabian StyleLee, Hye Ah, Hyo Jeong Hwang, Se Young Oh, Eun Ae Park, Su Jin Cho, Hae Soon Kim, and Hyesook Park. 2017. "Which Diet-Related Behaviors in Childhood Influence a Healthier Dietary Pattern? From the Ewha Birth and Growth Cohort" Nutrients 9, no. 1: 4. https://doi.org/10.3390/nu9010004