Cheese Consumption and Risk of All-Cause Mortality: A Meta-Analysis of Prospective Studies

Abstract
:1. Introduction
2. Methods
2.1. Literature Search
2.2. Study Selection
2.3. Data Extraction and Quality Assessment
2.4. Statistical Analysis
3. Results
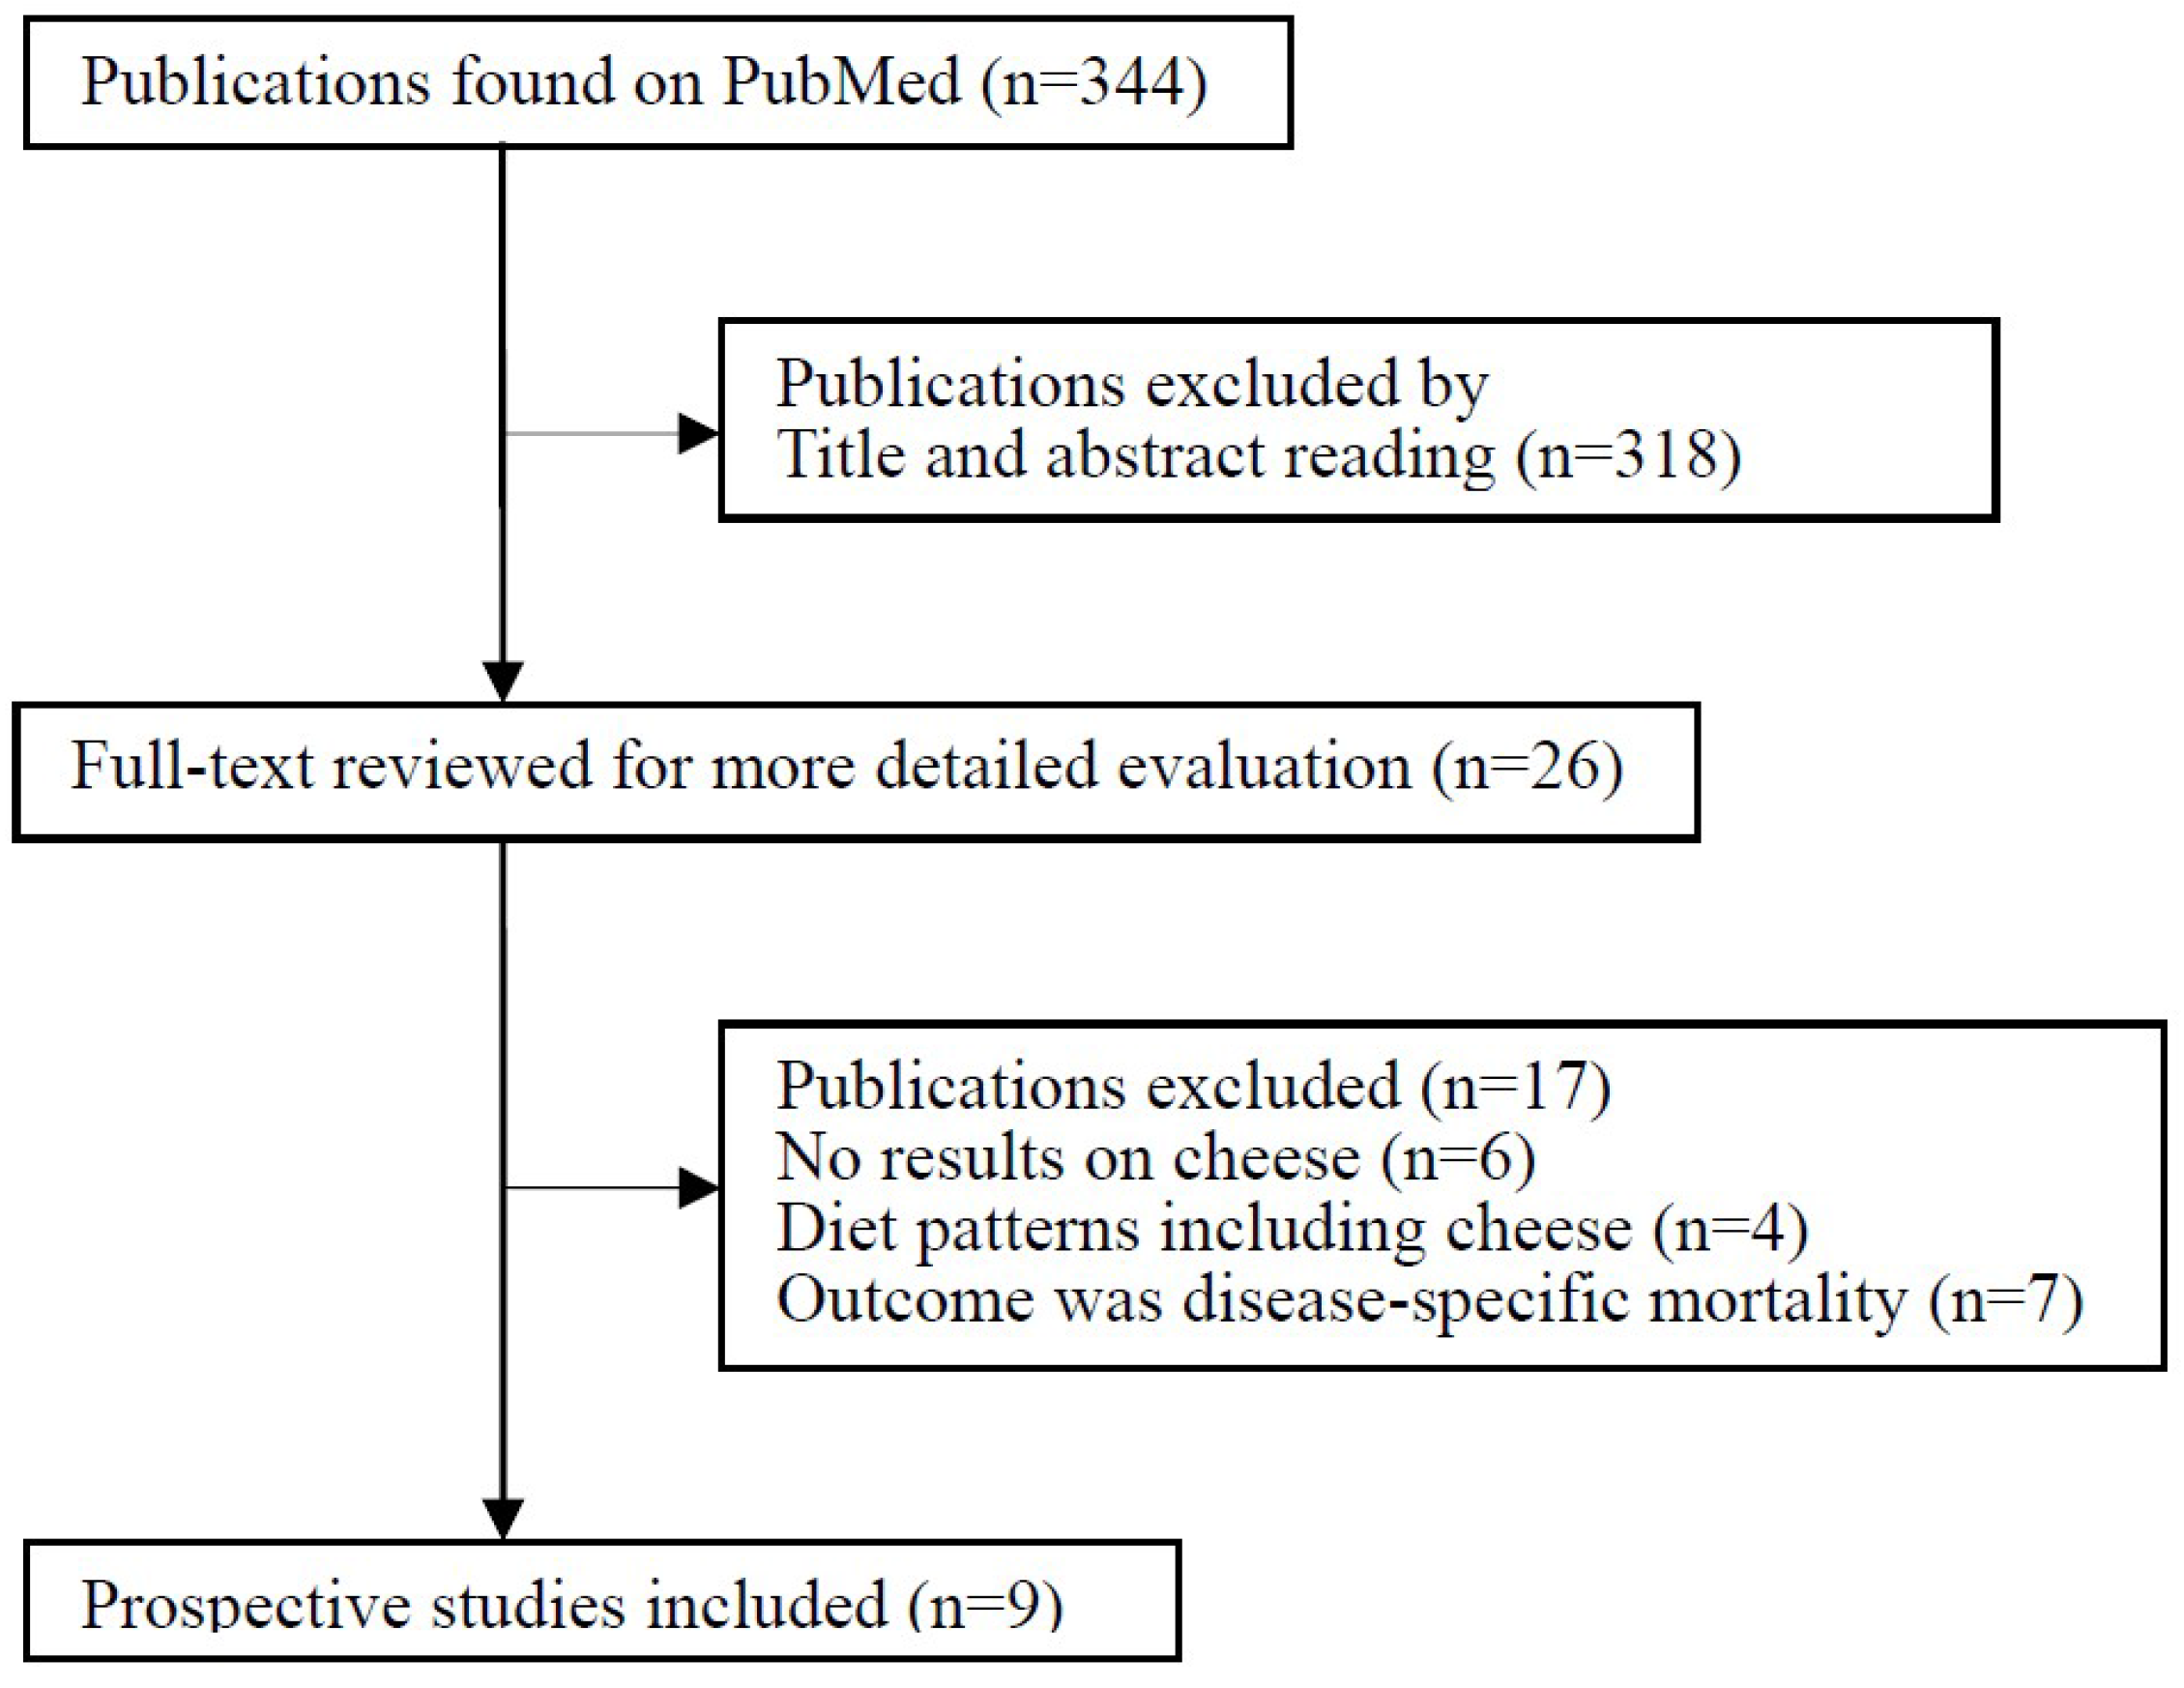
3.1. Literature Search
3.2. Study Characteristics
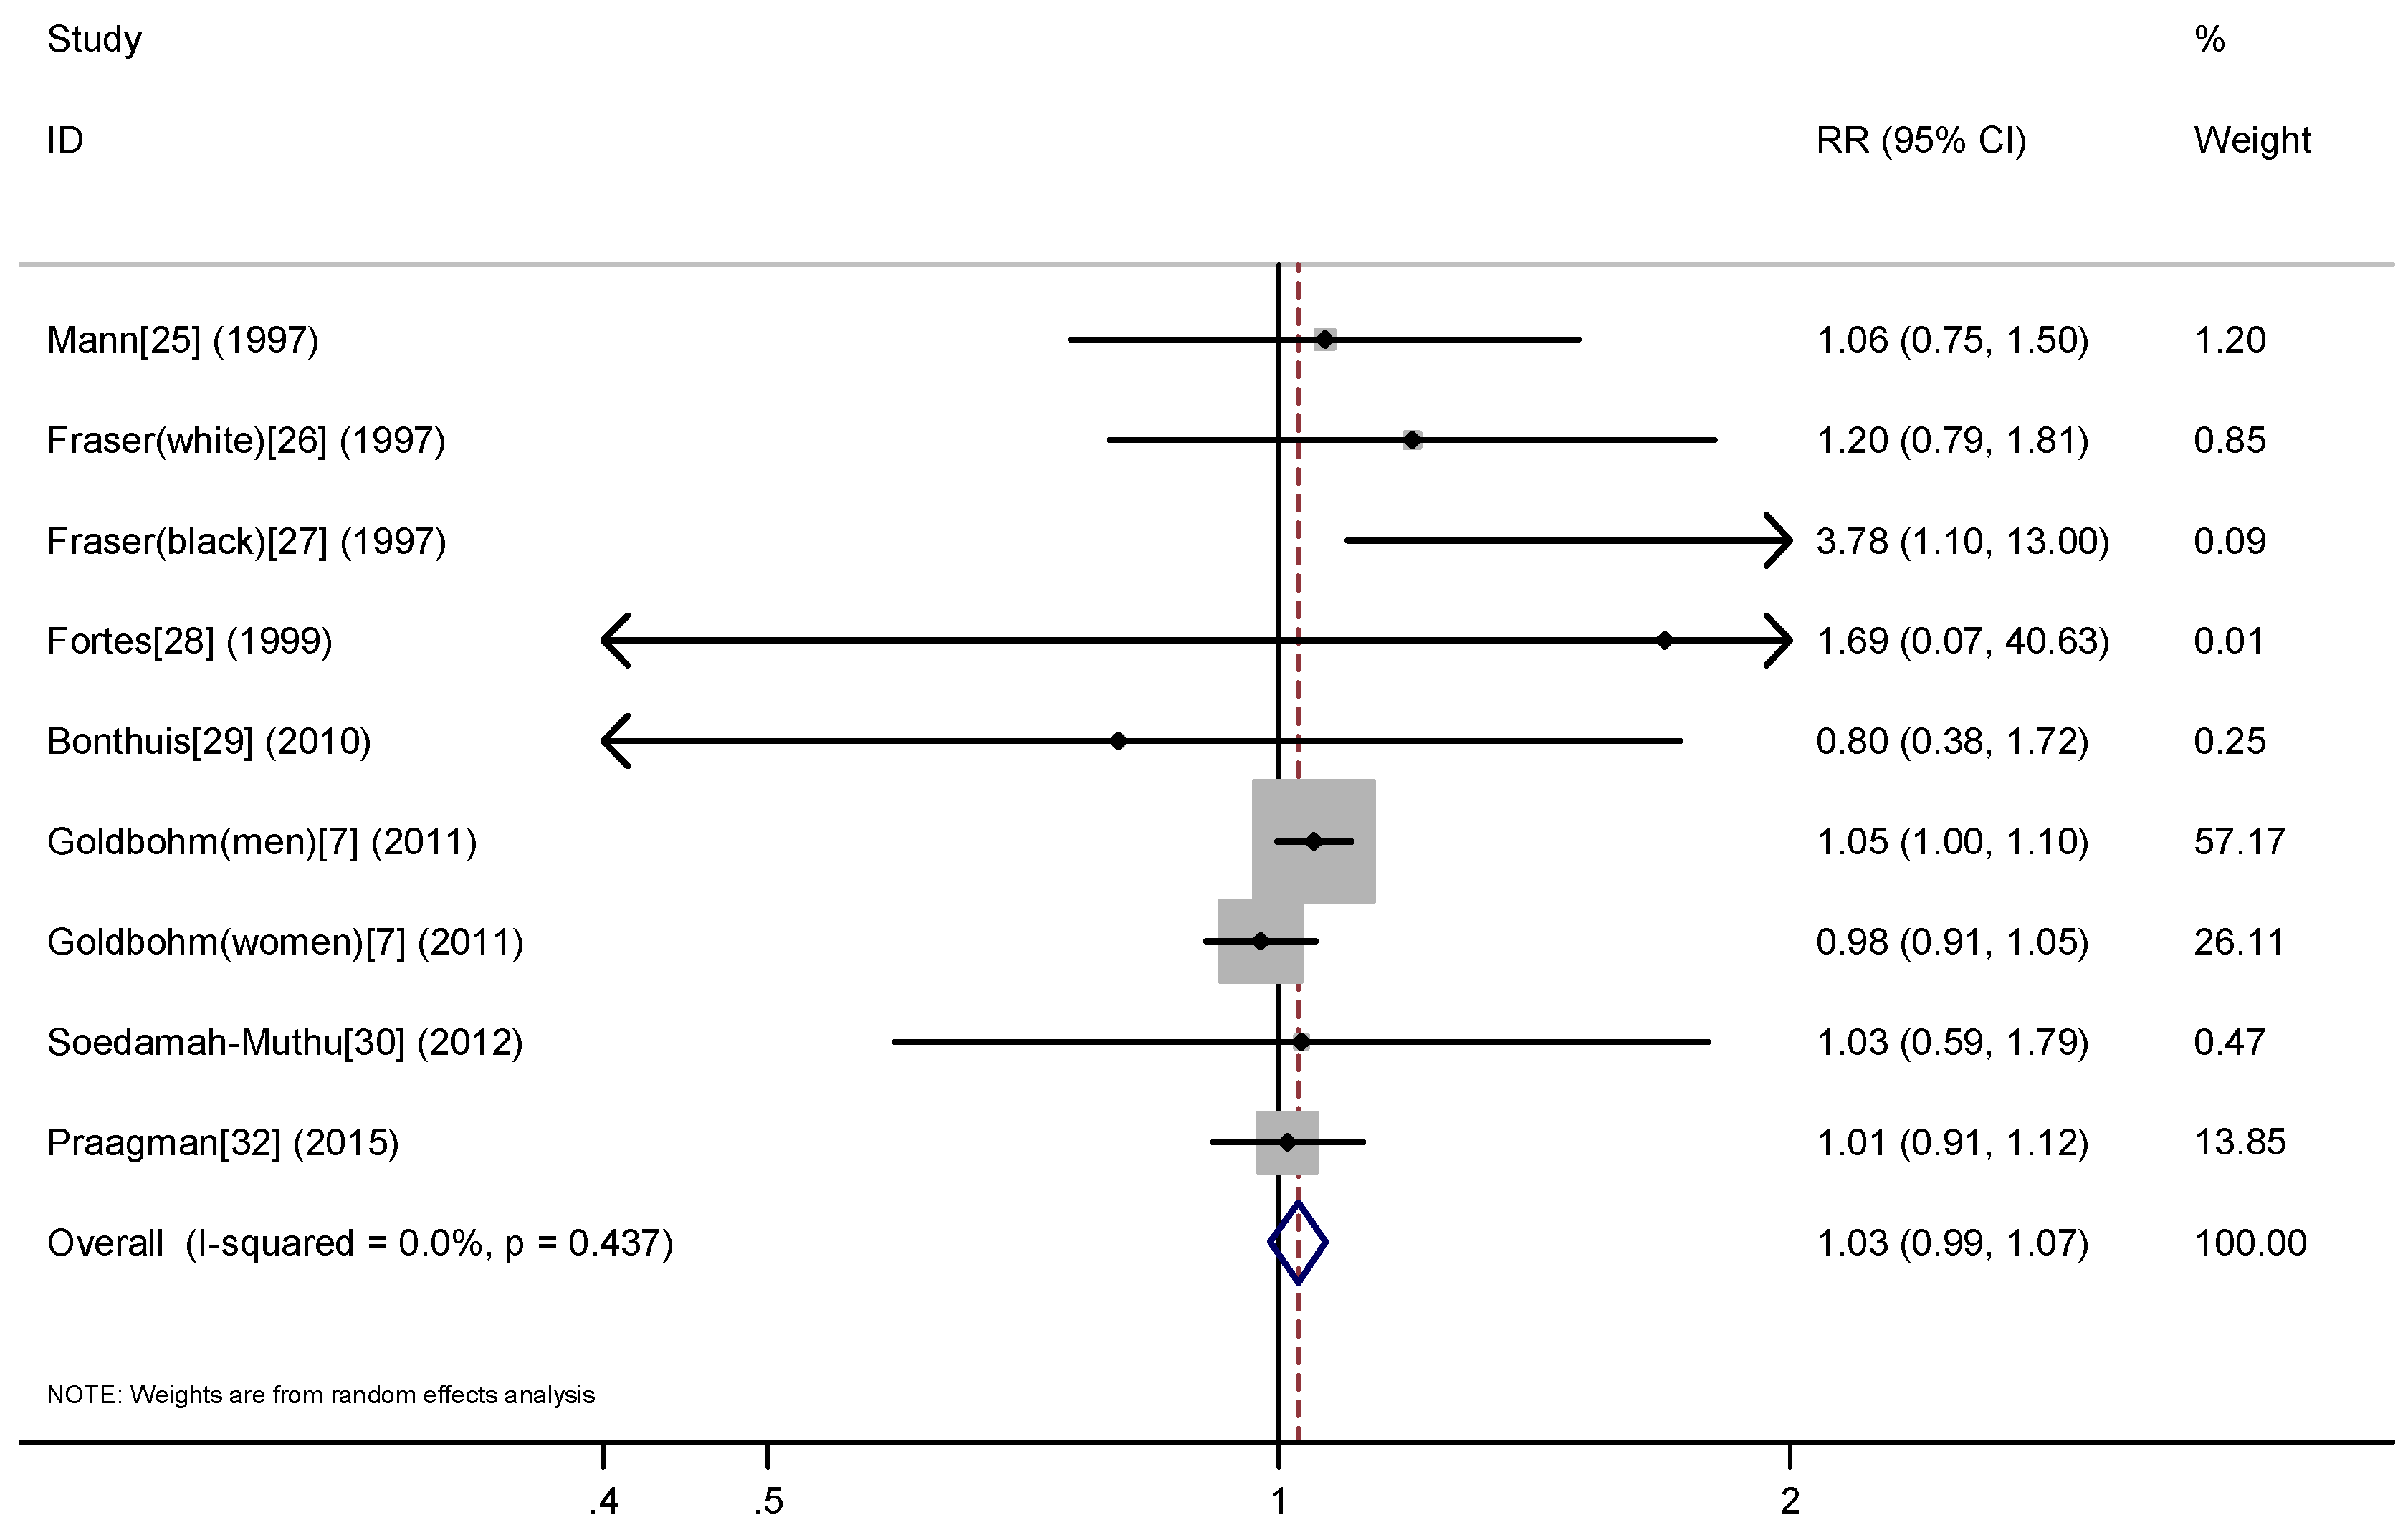
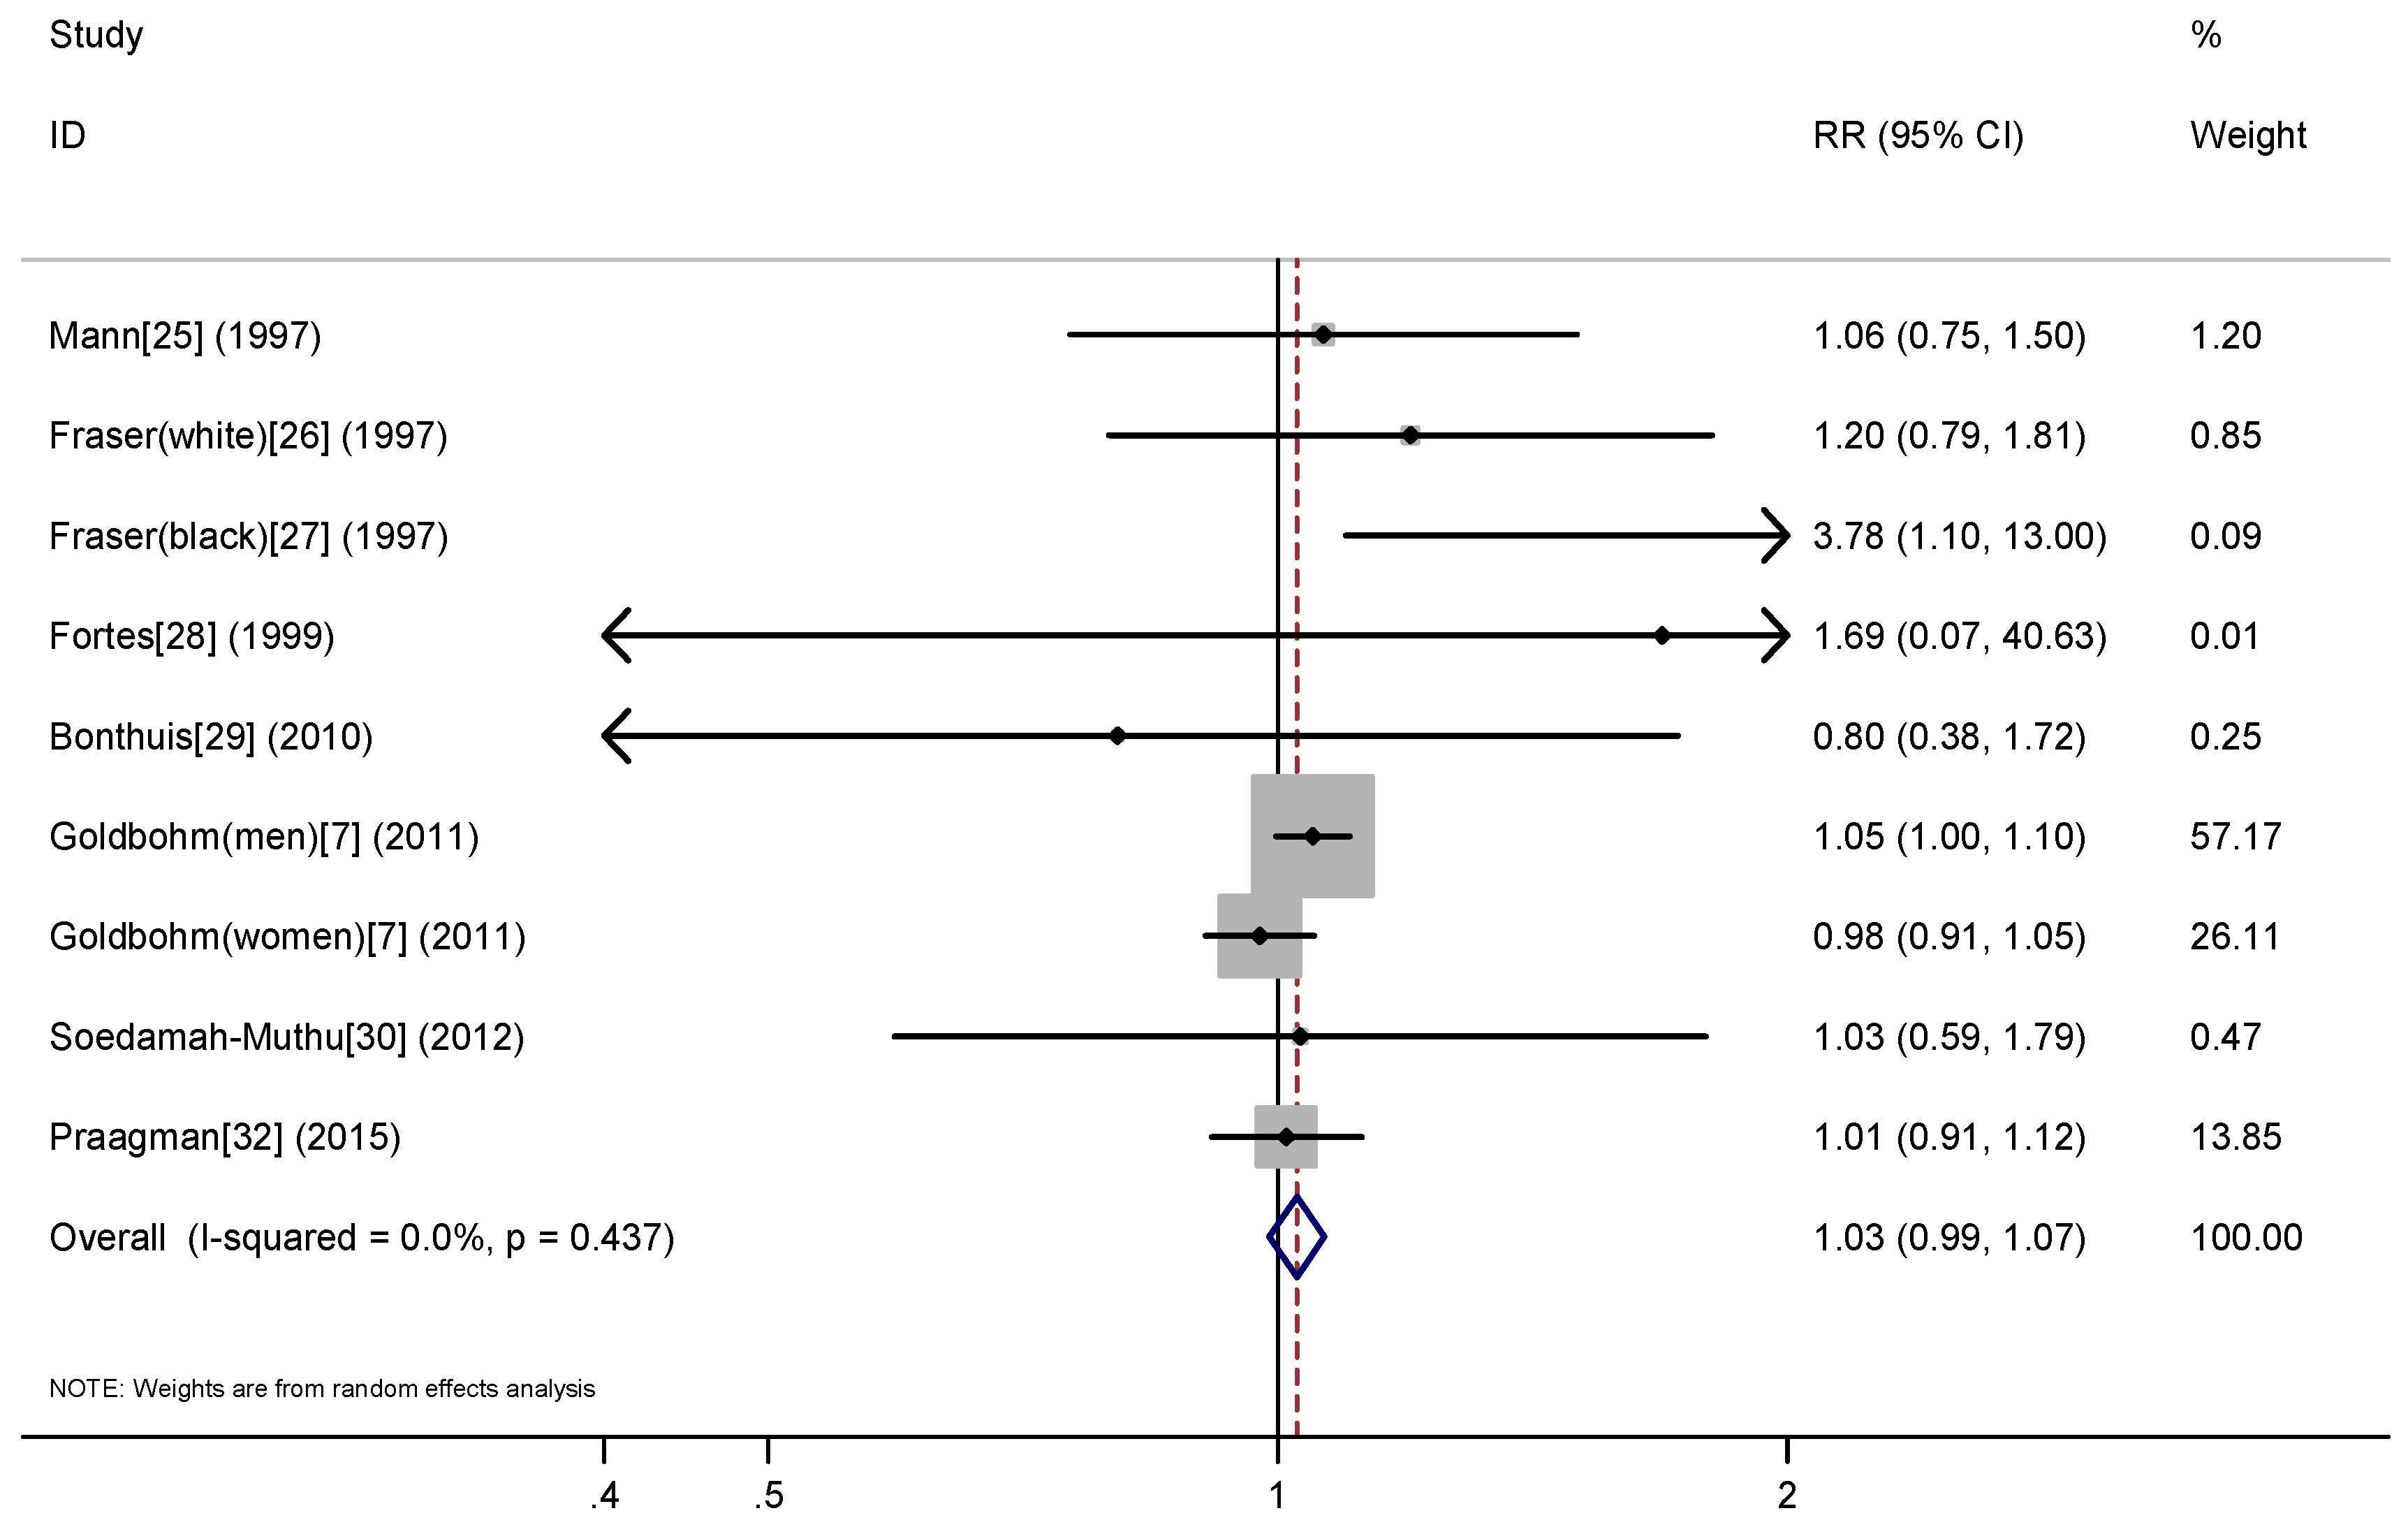
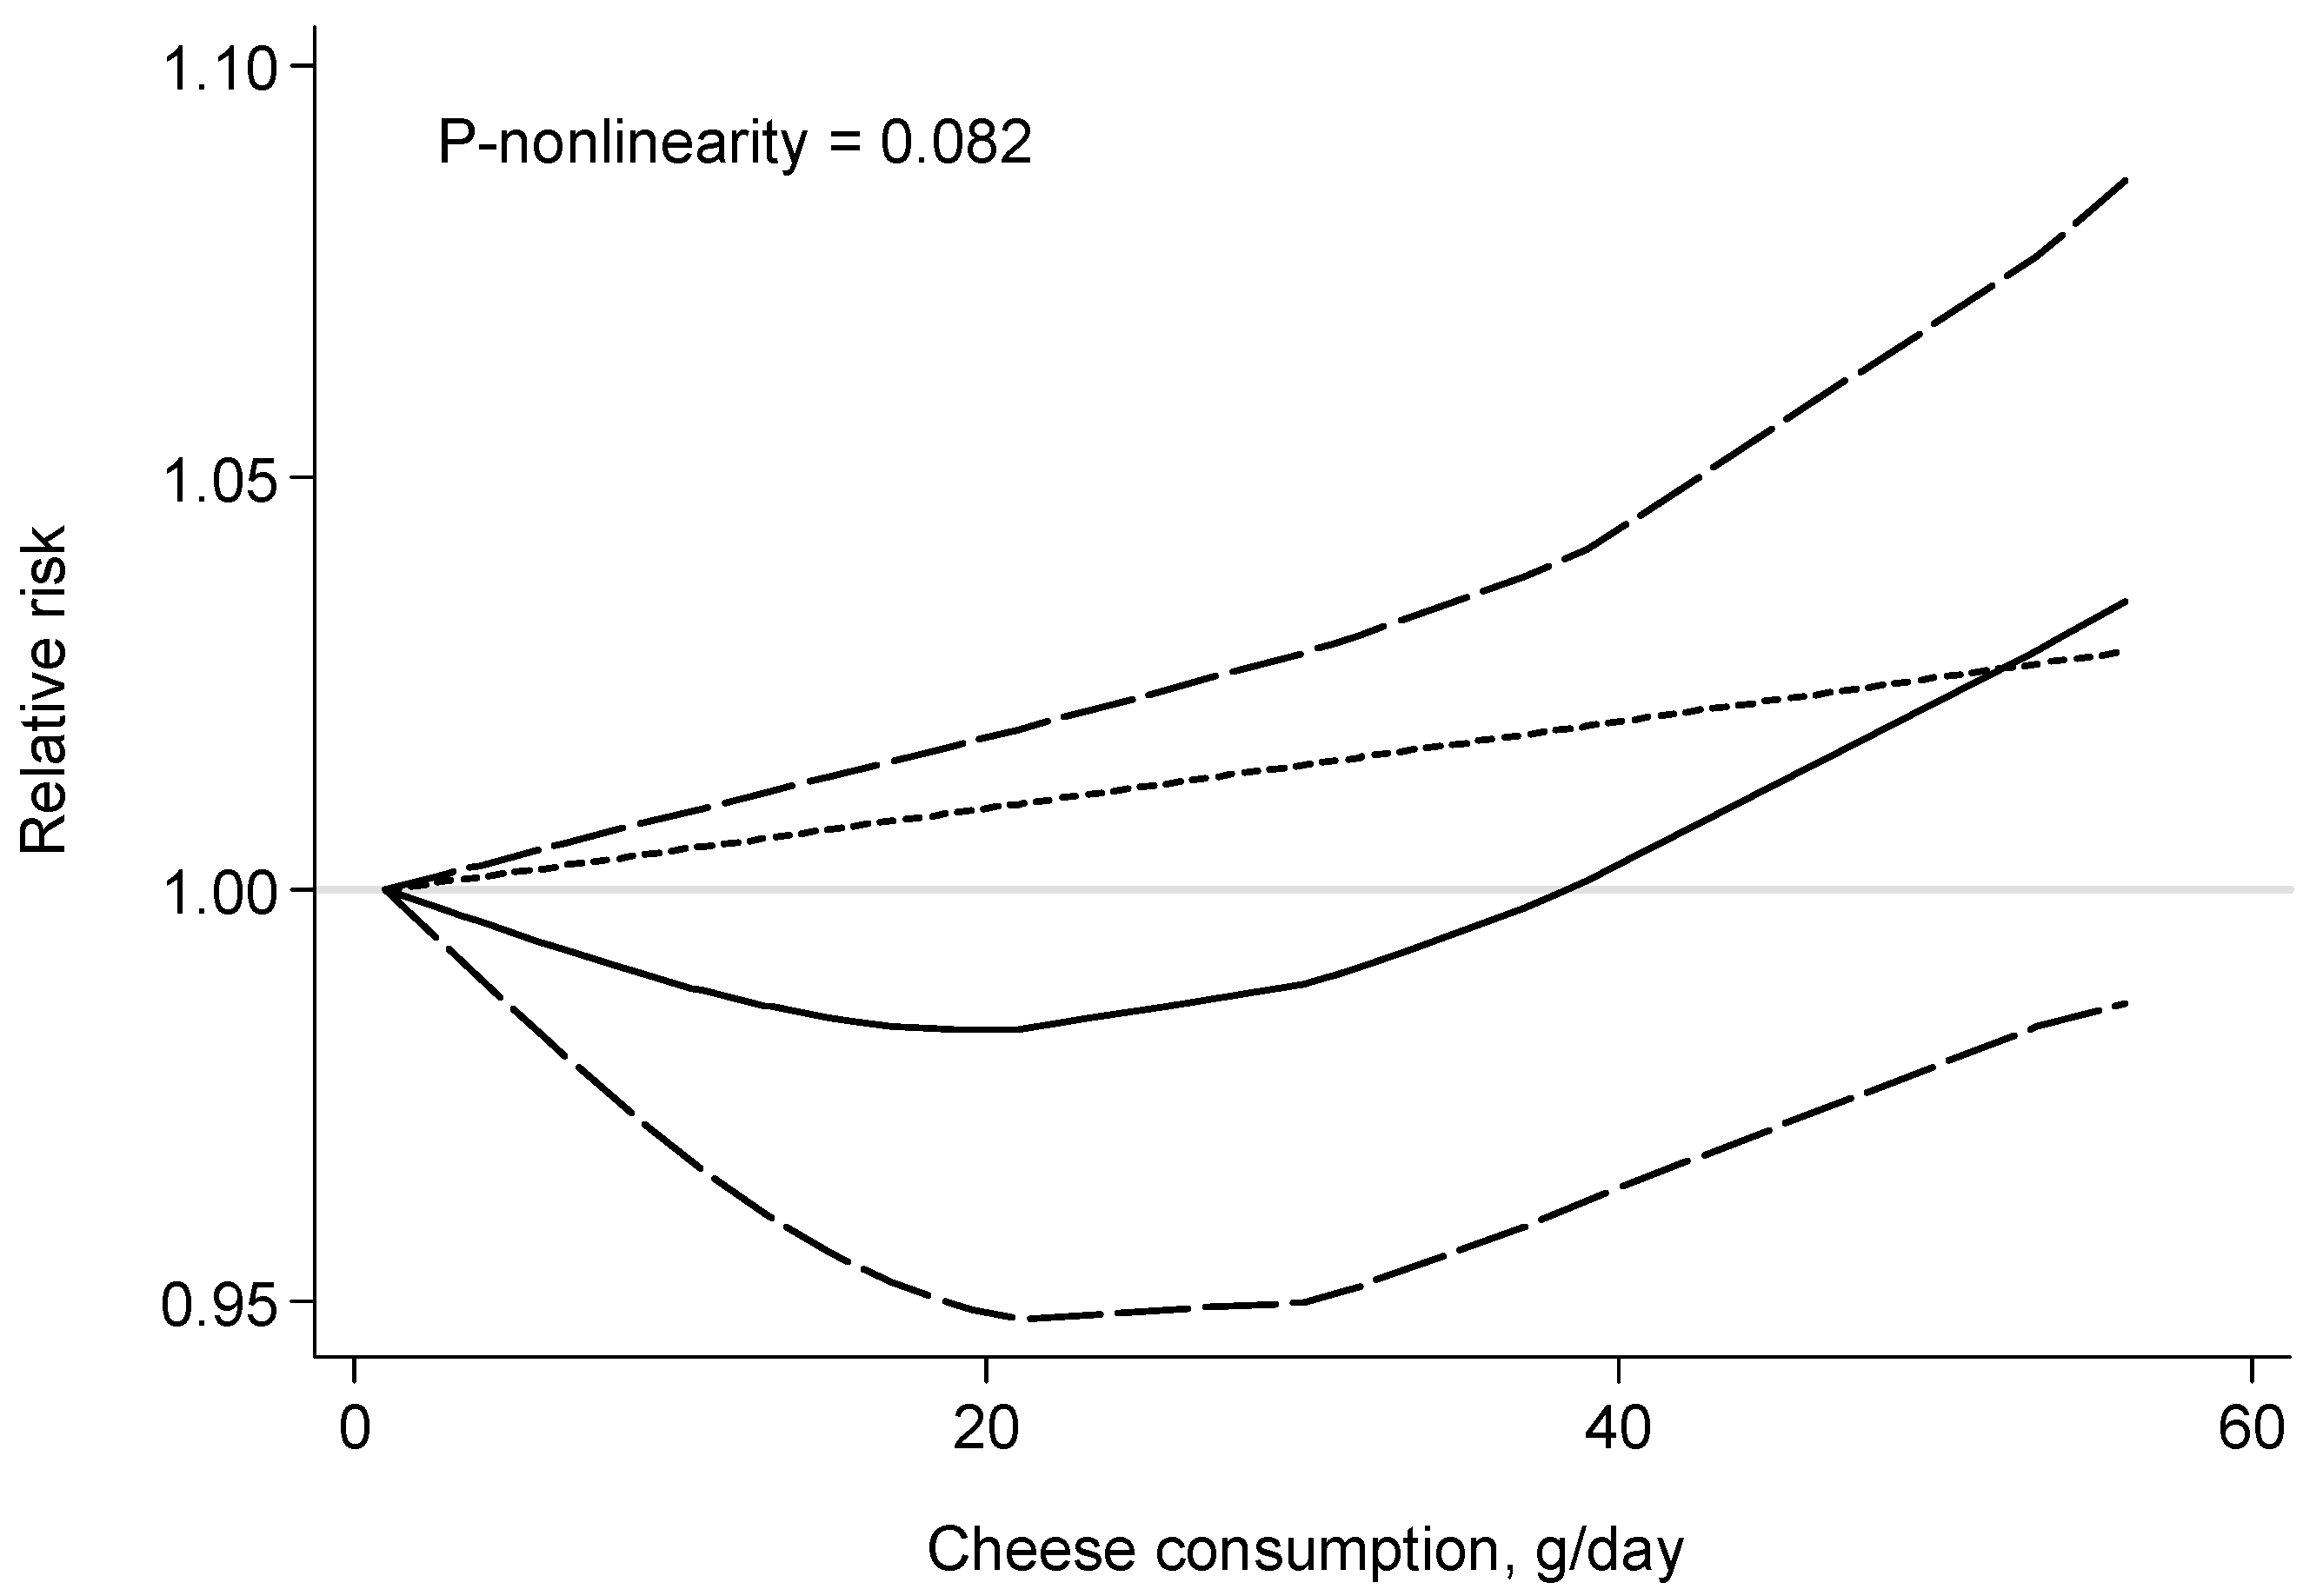
3.3. Cheese Consumption and Risk of All-Cause Mortality
4. Discussion
5. Conclusions
Acknowledgments
Author Contributions
Conflicts of Interest
References
- Hinrichs, J. Mediterranean milk and milk products. Eur. J. Nutr. 2004, 43 (Suppl. 1), i12–i17. [Google Scholar] [CrossRef] [PubMed]
- U.S. Department of Health and Human Services and U.S. Department of Agriculture. 2015–2020 Dietary Guidelines for Americans, 8th ed.December 2015. Available online: http://health.Gov/dietaryguidelines/2015/guidelines/ (accessed on 20 July 2016). [Google Scholar]
- Aune, D.; Norat, T.; Romundstad, P.; Vatten, L.J. Dairy products and the risk of type 2 diabetes: A systematic review and dose-response meta-analysis of cohort studies. Am. J. Clin. Nutr. 2013, 98, 1066–1083. [Google Scholar] [CrossRef] [PubMed]
- Chen, G.C.; Wang, Y.; Tong, X.; Szeto, I.M.; Smit, G.; Li, Z.N.; Qin, L.Q. Cheese consumption and risk of cardiovascular disease: A meta-analysis of prospective studies. Eur. J. Nutr. 2016. [Google Scholar] [CrossRef] [PubMed]
- Aune, D.; Navarro Rosenblatt, D.A.; Chan, D.S.; Vieira, A.R.; Vieira, R.; Greenwood, D.C.; Vatten, L.J.; Norat, T. Dairy products, calcium, and prostate cancer risk: A systematic review and meta-analysis of cohort studies. Am. J. Clin. Nutr. 2015, 101, 87–117. [Google Scholar] [CrossRef] [PubMed]
- Jiang, W.; Ju, C.; Jiang, H.; Zhang, D. Dairy foods intake and risk of Parkinson’s disease: A dose-response meta-analysis of prospective cohort studies. Eur. J. Epidemiol. 2014, 29, 613–619. [Google Scholar] [CrossRef] [PubMed]
- Goldbohm, R.A.; Chorus, A.M.; Galindo Garre, F.; Schouten, L.J.; van den Brandt, P.A. Dairy consumption and 10-y total and cardiovascular mortality: A prospective cohort study in The Netherlands. Am. J. Clin. Nutr. 2011, 93, 615–627. [Google Scholar] [CrossRef] [PubMed]
- Dugani, S.; Gaziano, T.A. 25 by 25: Achieving global reduction in cardiovascular mortality. Curr. Cardiol. Rep. 2016, 18, 10. [Google Scholar] [CrossRef] [PubMed]
- Stroup, D.F.; Berlin, J.A.; Morton, S.C.; Olkin, I.; Williamson, G.D.; Rennie, D.; Moher, D.; Becker, B.J.; Sipe, T.A.; Thacker, S.B. Meta-analysis of observational studies in epidemiology: A proposal for reporting. Meta-analysis of observational studies in epidemiology (moose) group. JAMA 2000, 283, 2008–2012. [Google Scholar] [CrossRef] [PubMed]
- Walter, S.D.; Cook, R.J. A comparison of several point estimators of the odds ratio in a single 2 × 2 contingency table. Biometrics 1991, 47, 795–811. [Google Scholar] [CrossRef] [PubMed]
- Higgins, J.P.; Thompson, S.G. Quantifying heterogeneity in a meta-analysis. Stat. Med. 2002, 21, 1539–1558. [Google Scholar] [CrossRef] [PubMed]
- Greenland, S.; Longnecker, M.P. Methods for trend estimation from summarized dose-response data, with applications to meta-analysis. Am. J. Epidemiol. 1992, 135, 1301–1309. [Google Scholar] [PubMed]
- Astrup, A.; Rice Bradley, B.H.; Brenna, J.T.; Delplanque, B.; Ferry, M.; Torres-Gonzalez, M. Regular-fat dairy and human health: A synopsis of symposia presented in Europe and north America (2014–2015). Nutrients 2016, 8, 463. [Google Scholar] [CrossRef] [PubMed]
- Larsson, S.C.; Orsini, N.; Wolk, A. Dietary magnesium intake and risk of stroke: A meta-analysis of prospective studies. Am. J. Clin. Nutr. 2012, 95, 362–366. [Google Scholar] [CrossRef] [PubMed]
- Orsini, N.; Li, R.; Wolk, A.; Khudyakov, P.; Spiegelman, D. Meta-analysis for linear and nonlinear dose-response relations: Examples, an evaluation of approximations, and software. Am. J. Epidemiol. 2012, 175, 66–73. [Google Scholar] [CrossRef] [PubMed]
- Egger, M.; Davey Smith, G.; Schneider, M.; Minder, C. Bias in meta-analysis detected by a simple, graphical test. BMJ 1997, 315, 629–634. [Google Scholar] [CrossRef] [PubMed]
- Begg, C.B.; Mazumdar, M. Operating characteristics of a rank correlation test for publication bias. Biometrics 1994, 50, 1088–1101. [Google Scholar] [CrossRef] [PubMed]
- De Oliveira Otto, M.C.; Mozaffarian, D.; Kromhout, D.; Bertoni, A.G.; Sibley, C.T.; Jacobs, D.R., Jr.; Nettleton, J.A. Dietary intake of saturated fat by food source and incident cardiovascular disease: The multi-ethnic study of atherosclerosis. Am. J. Clin. Nutr. 2012, 96, 397–404. [Google Scholar] [CrossRef] [PubMed]
- Von Ruesten, A.; Feller, S.; Bergmann, M.M.; Boeing, H. Diet and risk of chronic diseases: Results from the first 8 years of follow-up in the epic-potsdam study. Eur. J. Clin. Nutr. 2013, 67, 412–419. [Google Scholar] [CrossRef] [PubMed]
- Sonestedt, E.; Wirfalt, E.; Wallstrom, P.; Gullberg, B.; Orho-Melander, M.; Hedblad, B. Dairy products and its association with incidence of cardiovascular disease: The malmo diet and cancer cohort. Eur. J. Epidemiol. 2011, 26, 609–618. [Google Scholar] [CrossRef] [PubMed]
- Avalos, E.E.; Barrett-Connor, E.; Kritz-Silverstein, D.; Wingard, D.L.; Bergstrom, J.N.; Al-Delaimy, W.K. Is dairy product consumption associated with the incidence of CHD? Public Health Nutr. 2013, 16, 2055–2063. [Google Scholar] [CrossRef] [PubMed]
- Iso, H.; Stampfer, M.J.; Manson, J.E.; Rexrode, K.; Hennekens, C.H.; Colditz, G.A.; Speizer, F.E.; Willett, W.C. Prospective study of calcium, potassium, and magnesium intake and risk of stroke in women. Stroke 1999, 30, 1772–1779. [Google Scholar] [CrossRef] [PubMed]
- Larsson, S.C.; Virtamo, J.; Wolk, A. Dairy consumption and risk of stroke in Swedish women and men. Stroke 2012, 43, 1775–1780. [Google Scholar] [CrossRef] [PubMed]
- Larsson, S.C.; Mannisto, S.; Virtanen, M.J.; Kontto, J.; Albanes, D.; Virtamo, J. Dairy foods and risk of stroke. Epidemiology 2009, 20, 355–360. [Google Scholar] [CrossRef] [PubMed]
- Mann, J.I.; Appleby, P.N.; Key, T.J.; Thorogood, M. Dietary determinants of ischaemic heart disease in health conscious individuals. Heart 1997, 78, 450–455. [Google Scholar] [CrossRef] [PubMed]
- Fraser, G.E.; Shavlik, D.J. Risk factors for all-cause and coronary heart disease mortality in the oldest-old. The Adventist Health Study. Arch. Intern. Med. 1997, 157, 2249–2258. [Google Scholar] [CrossRef] [PubMed]
- Fraser, G.E.; Sumbureru, D.; Pribis, P.; Neil, R.L.; Frankson, M.A. Association among health habits, risk factors, and all-cause mortality in a black California population. Epidemiology 1997, 8, 168–174. [Google Scholar] [CrossRef] [PubMed]
- Fortes, C.; Forastiere, F.; Farchi, S.; Rapiti, E.; Pastori, G.; Perucci, C.A. Diet and overall survival in a cohort of very elderly people. Epidemiology 2000, 11, 440–445. [Google Scholar] [CrossRef] [PubMed]
- Bonthuis, M.; Hughes, M.C.; Ibiebele, T.I.; Green, A.C.; van der Pols, J.C. Dairy consumption and patterns of mortality of Australian adults. Eur. J. Clin. Nutr. 2010, 64, 569–577. [Google Scholar] [CrossRef] [PubMed]
- Soedamah-Muthu, S.S.; Masset, G.; Verberne, L.; Geleijnse, J.M.; Brunner, E.J. Consumption of dairy products and associations with incident diabetes, CHD and mortality in the Whitehall II study. Br. J. Nutr. 2013, 109, 718–726. [Google Scholar] [CrossRef] [PubMed]
- Van Aerde, M.A.; Soedamah-Muthu, S.S.; Geleijnse, J.M.; Snijder, M.B.; Nijpels, G.; Stehouwer, C.D.; Dekker, J.M. Dairy intake in relation to cardiovascular disease mortality and all-cause mortality: The Hoorn study. Eur. J. Nutr. 2013, 52, 609–616. [Google Scholar] [CrossRef] [PubMed]
- Praagman, J.; Dalmeijer, G.W.; van der Schouw, Y.T.; Soedamah-Muthu, S.S.; Monique Verschuren, W.M.; Bas Bueno-de-Mesquita, H.; Geleijnse, J.M.; Beulens, J.W. The relationship between fermented food intake and mortality risk in the European prospective investigation into cancer and nutrition-Netherlands cohort. Br. J. Nutr. 2015, 113, 498–506. [Google Scholar] [CrossRef] [PubMed]
- Larsson, S.C.; Crippa, A.; Orsini, N.; Wolk, A.; Michaelsson, K. Milk consumption and mortality from all causes, cardiovascular disease, and cancer: A systematic review and meta-analysis. Nutrients 2015, 7, 7749–7763. [Google Scholar] [CrossRef] [PubMed]
- De Goede, J.; Geleijnse, J.M.; Ding, E.L.; Soedamah-Muthu, S.S. Effect of cheese consumption on blood lipids: A systematic review and meta-analysis of randomized controlled trials. Nutr. Rev. 2015, 73, 259–275. [Google Scholar] [CrossRef] [PubMed]
- Nilsen, R.; Hostmark, A.T.; Haug, A.; Skeie, S. Effect of a high intake of cheese on cholesterol and metabolic syndrome: Results of a randomized trial. Food Nutr. Res. 2015, 59, 27651. [Google Scholar] [CrossRef] [PubMed] [Green Version]
- Huth, P.J.; Park, K.M. Influence of dairy product and milk fat consumption on cardiovascular disease risk: A review of the evidence. Adv. Nutr. 2012, 3, 266–285. [Google Scholar] [CrossRef] [PubMed]
- Christensen, R.; Lorenzen, J.K.; Svith, C.R.; Bartels, E.M.; Melanson, E.L.; Saris, W.H.; Tremblay, A.; Astrup, A. Effect of calcium from dairy and dietary supplements on faecal fat excretion: A meta-analysis of randomized controlled trials. Obes. Rev. 2009, 10, 475–486. [Google Scholar] [PubMed]
- Sousa, G.T.; Lira, F.S.; Rosa, J.C.; de Oliveira, E.P.; Oyama, L.M.; Santos, R.V.; Pimentel, G.D. Dietary whey protein lessens several risk factors for metabolic diseases: A review. Lipids Health Dis. 2012, 11, 67. [Google Scholar] [CrossRef] [PubMed]
- Gast, G.C.; de Roos, N.M.; Sluijs, I.; Bots, M.L.; Beulens, J.W.; Geleijnse, J.M.; Witteman, J.C.; Grobbee, D.E.; Peeters, P.H.; van der Schouw, Y.T. A high menaquinone intake reduces the incidence of coronary heart disease. Nutr. Metab. Cardiovasc. Dis. NMCD 2009, 19, 504–510. [Google Scholar] [CrossRef] [PubMed]
- Beulens, J.W.; van der, A.D.; Grobbee, D.E.; Sluijs, I.; Spijkerman, A.M.; van der Schouw, Y.T. Dietary phylloquinone and menaquinones intakes and risk of type 2 diabetes. Diabetes Care 2010, 33, 1699–1705. [Google Scholar] [CrossRef] [PubMed]
- Gao, D.; Ning, N.; Wang, C.; Wang, Y.; Li, Q.; Meng, Z.; Liu, Y.; Li, Q. Dairy products consumption and risk of type 2 diabetes: Systematic review and dose-response meta-analysis. PLoS ONE 2013, 8, e73965. [Google Scholar] [CrossRef] [PubMed]
- Dietary Guidelines Advisory Committee. Report of the Dietary Guidelines Advisory Committee on the Dietary Guidelines for Americans, 2010; USDA, Agricultural Research Service: Washington, DC, USA, 2011.
- Mensink, R.P.; Zock, P.L.; Kester, A.D.; Katan, M.B. Effects of dietary fatty acids and carbohydrates on the ratio of serum total to HDL cholesterol and on serum lipids and apolipoproteins: A meta-analysis of 60 controlled trials. Am. J. Clin. Nutr. 2003, 77, 1146–1155. [Google Scholar] [PubMed]
- Steinberg, D. Thematic review series: The pathogenesis of atherosclerosis. An interpretive history of the cholesterol controversy: Part II: The early evidence linking hypercholesterolemia to coronary disease in humans. J. Lipid Res. 2005, 46, 179–190. [Google Scholar] [CrossRef] [PubMed]
- Demmer, E.; van Loan, M.D.; Rivera, N.; Rogers, T.S.; Gertz, E.R.; German, J.B.; Zivkovic, A.M.; Smilowitz, J.T. Consumption of a high-fat meal containing cheese compared with a vegan alternative lowers postprandial C-reactive protein in overweight and obese individuals with metabolic abnormalities: A randomised controlled cross-over study. J. Nutr. Sci. 2016, 5, e9. [Google Scholar] [CrossRef] [PubMed]
- O’Donnell, A.M.; Spatny, K.P.; Vicini, J.L.; Bauman, D.E. Survey of the fatty acid composition of retail milk differing in label claims based on production management practices. J. Dairy Sci. 2010, 93, 1918–1925. [Google Scholar] [CrossRef] [PubMed]
- German, J.B.; Gibson, R.A.; Krauss, R.M.; Nestel, P.; Lamarche, B.; van Staveren, W.A.; Steijns, J.M.; de Groot, L.C.; Lock, A.L.; Destaillats, F. A reappraisal of the impact of dairy foods and milk fat on cardiovascular disease risk. Eur. J. Nutr. 2009, 48, 191–203. [Google Scholar] [CrossRef] [PubMed]
- Lock, A.L.; Horne, C.A.; Bauman, D.E.; Salter, A.M. Butter naturally enriched in conjugated linoleic acid and vaccenic acid alters tissue fatty acids and improves the plasma lipoprotein profile in cholesterol-fed hamsters. J. Nutr. 2005, 135, 1934–1939. [Google Scholar] [PubMed]
- Ip, C.; Scimeca, J.A.; Thompson, H.J. Conjugated linoleic acid. A powerful anticarcinogen from animal fat sources. Cancer 1994, 74, 1050–1054. [Google Scholar] [PubMed]
- Dong, J.Y.; Zhang, L.; He, K.; Qin, L.Q. Dairy consumption and risk of breast cancer: A meta-analysis of prospective cohort studies. Breast Cancer Res. Treat. 2011, 127, 23–31. [Google Scholar] [CrossRef] [PubMed]
- Kaneda, T. Iso- and anteiso-fatty acids in bacteria: Biosynthesis, function, and taxonomic significance. Microbiol. Rev. 1991, 55, 288–302. [Google Scholar] [PubMed]
- Graudal, N.; Jürgens, G.; Baslund, B.; Alderman, M.H. Compared with usual sodium intake, low- and excessive-sodium diets are associated with increased mortality: A meta-analysis. Am. J. Hypertens. 2014, 27, 1129–1137. [Google Scholar] [CrossRef] [PubMed]


| Author, Year (Country) | Study Name, Duration | Subjects | Age Range (Mean/Median), Years | No. of Deaths | Reported Results | Baseline Disease Excluded | Adjustments |
|---|---|---|---|---|---|---|---|
| Mann, 1997 [25] (UK) | Oxford Vegetarian Study, 13.3 years | 10,802 M/F | 16–79 (34.0 in M, 33.0 in F) | 383 | Cheese excluding cottage: ≥5 (T3) vs. <1 (T1) ser/week RR = 1.02 (95% CI: 0.76–1.37) | Cancer, angina, hypertension, HD, stroke, and diabetes | Age, sex, smoking, and social class. |
| Fraser (white), 1997 [26] (USA) | Adventists Health Study, 12 years | NA (11,828 person-years) | ≥85 | 1387 | Cheese: ≥3 (T3) vs. <1 (T1) ser/week RR = 1.07 (95% CI: 0.90–1.27) (M/F) RR = 1.23 (95% CI: 0.91–1.66) (M) RR = 1.01 (95% CI: 0.82–1.24) (F) | Cancer and HD | Age and sex. |
| Fraser (black), 1997 [27] (USA) | Black Adventists Health Study, 8 years | 1668 M/F | NA (52.0 in M, 53.4 in F) | 153 | Cheese: ≥3 (T3) vs. <1 (T1) ser/week RR = 1.70 (95% CI: 1.00–2.90) (M/F) RR = 1.20 (95% CI: 0.50–2.80) (M) RR = 2.20 (95% CI: 1.10–4.30) (F) | None | Age, smoking and exercise. |
| Fortes, 1999 [28] (Italy) | NA, 5 years | 162 M/F | ≥65 (80) | 53 | Cheese: ≥2 (High) vs. <1 (Low) ser/week RR = 1.30 (95% CI: 0.51–3.34) | Mental impairment and severe disability | Age, gender, number of years of education, BMI, cigarette smoking, cognitive status and presence of chronic disease. |
| Bonthuis, 2010 [29] (Australia) | NA, 14.4 years | 1529 M/F | 25–78 (49.8) | 177 | Full-fat cheese: 30 (T3) vs. 4 (T1) g/day RR = 0.91 (95% CI: 0.57–1.45) | None | Age, sex, BMI, smoking, physical activity, school leaving age, dietary supplement use, β-carotene treatment during trial, use of medications for hypertension, diabetes mellitus, cardiac disorder, use of β-adrenergic blocking agents, and intakes of energy, alcohol and calcium. |
| Goldbohm, 2011 [7] (The Netherlands) | The Netherlands Cohort Study, 10 years | 120,852 M/F | 55–69 (NA) | 10,658 in M; 5478 in F | Cheese: 56 (Q5) vs. 1 (Q1) g/day RR = 1.04 (95% CI: 0.96–1.12) (M) RR = 0.98 (95% CI: 0.88–1.77) (F) | Angina, MI, and stroke | Age, BMI, smoking, physical activity, education, multivitamin use, and intakes of energy, alcohol, energy-adjusted mono- and polyunsaturated fat, vegetable, and fruit. |
| Soedamah-Muthu, 2012 [30] (UK) | Whitehall II study, 11.7 years | 4526 M/F | NA (56) | 237 | Cheese: 31 (T3) vs. 6 (T1) g/day RR = 1.00 (95% CI: 0.72–1.37) | CHD | Age, sex, BMI, smoking, physical activity, ethnicity, employment grade, family history of CHD/hypertension, and intakes of energy, alcohol, fruit and vegetables, bread, meat, fish, coffee, and tea. |
| van Aerde, 2012 [31] (The Netherlands) | Hoorn Study, 12.4 years | 1956 M/F | 50–75 (61.6) | 403 | Cheese: per 24 g/day RR = 0.96 (95% CI: 0.84–1.09) | CVD | Age, sex, physical activity, and intakes of meat, fish, bread, vegetables, fruit, coffee, and tea. |
| Praagman, 2015 [32] (The Netherlands) | EPIC-Netherlands, 15 years | 34,409 M/F | 20–70 (43.0 in M, 51.0 in F) | 2436 | Cheese: 53.2 (Q4) vs. 6.6 (Q1) g/day RR = 1.00 (95% CI: 0.89–1.12) | Cancer and CVD | Age, sex, smoking, BMI, physical activity, education, hypertension at baseline, and intakes of total energy, alcohol and energy-adjusted fruit and vegetables. |
| Selection | Comparability | Outcome | Total Stars | ||||||
|---|---|---|---|---|---|---|---|---|---|
| Study | Representativeness of Exposed Cohort | Selection of the Non-Exposed Cohort | Ascertainment of Exposure | Demonstration That Outcome of Interest Was Not Present at Start of Study | Comparability of Cohorts on the Basis of the Design or Analysis | Assessment of Outcome | Was Follow-Up Long Enough for Outcomes to Occur | Adequacy of Follow-Up of Cohorts | |
| Mann, 1997 [25] | 0 | 1 | 0 | 1 | 2 | 1 | 1 | 0 | 6 |
| Fraser (white), 1997 [26] | 0 | 1 | 0 | 1 | 0 | 1 | 1 | 1 | 5 |
| Fraser (black), 1997 [27] | 0 | 1 | 0 | 1 | 0 | 1 | 1 | 1 | 5 |
| Fortes, 1999 [28] | 0 | 1 | 1 | 0 | 2 | 1 | 1 | 0 | 6 |
| Bonthuis, 2010 [29] | 0 | 1 | 1 | 0 | 2 | 1 | 1 | 1 | 7 |
| Goldbohm, 2011 [7] | 1 | 1 | 1 | 1 | 2 | 1 | 1 | 1 | 9 |
| Soedamah-Muthu, 2012 [30] | 0 | 1 | 1 | 1 | 2 | 1 | 1 | 1 | 8 |
| van Aerde, 2012 [31] | 1 | 1 | 1 | 1 | 1 | 1 | 1 | 0 | 7 |
| Praagman, 2015 [32] | 1 | 1 | 1 | 1 | 2 | 1 | 1 | 1 | 9 |
| Pre-Defined Factors | Subgroups | Number of Studies | RR (95% CI) | Pheterogeneity | I2 (%) | Pinteraction |
|---|---|---|---|---|---|---|
| Study location | Europe | 7 | 1.01 (0.96–1.06) | 0.94 | 0 | 0.27 |
| USA | 2 | 1.26 (0.82–1.93) | 0.11 | 0.62 | ||
| Sex | Men | 3 | 1.05 (0.98–1.13) | 0.55 | 0 | 0.581 |
| Women | 3 | 1.07 (0.85–1.33) | 0.07 | 0.62 | ||
| Mean/median baseline age | ≥60 years | 5 | 1.02 (0.92–1.12) | 0.42 | 0 | 0.989 |
| <60 years | 5 | 1.02 (0.96–1.07) | 0.72 | 0 | ||
| Duration of follow-up | ≥10 years | 8 | 1.01 (0.96–1.06) | 0.96 | 0 | 0.09 |
| <10 years | 2 | 1.59 (1.00–2.53) | 0.63 | 0 | ||
| Number of events | ≥500 | 4 | 1.00 (0.90–1.11) | 0.46 | 0 | 0.69 |
| <500 | 6 | 1.02 (0.97–1.08) | 0.77 | 0 | ||
| Quality score | ≥8 | 4 | 1.02 (0.96–1.07) | 0.84 | 0 | 0.98 |
| <8 | 6 | 1.02 (0.92–1.12) | 0.40 | 0.03 | ||
| Baseline diseases excluded: CVD | Yes | 7 | 1.01 (0.96–1.06) | 0.93 | 80 | 0.33 |
| No | 3 | 1.23 (0.80–1.88) | 0.22 | 0.34 | ||
| Cancer | Yes | 3 | 1.02 (0.93–1.12) | 0.82 | 0 | 0.89 |
| No | 7 | 1.01 (0.96–1.07) | 0.48 | 0 |
© 2017 by the authors; licensee MDPI, Basel, Switzerland. This article is an open access article distributed under the terms and conditions of the Creative Commons Attribution (CC-BY) license (http://creativecommons.org/licenses/by/4.0/).
Share and Cite
Tong, X.; Chen, G.-C.; Zhang, Z.; Wei, Y.-L.; Xu, J.-Y.; Qin, L.-Q. Cheese Consumption and Risk of All-Cause Mortality: A Meta-Analysis of Prospective Studies. Nutrients 2017, 9, 63. https://doi.org/10.3390/nu9010063
Tong X, Chen G-C, Zhang Z, Wei Y-L, Xu J-Y, Qin L-Q. Cheese Consumption and Risk of All-Cause Mortality: A Meta-Analysis of Prospective Studies. Nutrients. 2017; 9(1):63. https://doi.org/10.3390/nu9010063
Chicago/Turabian StyleTong, Xing, Guo-Chong Chen, Zheng Zhang, Yu-Lu Wei, Jia-Ying Xu, and Li-Qiang Qin. 2017. "Cheese Consumption and Risk of All-Cause Mortality: A Meta-Analysis of Prospective Studies" Nutrients 9, no. 1: 63. https://doi.org/10.3390/nu9010063