Validity of Nutrient Intakes Derived from an Internet Website Dish-Based Dietary Record for Self-Management of Weight among Japanese Women

1
Faculty of Nutrition, Kagawa Nutrition University, 3-9-21 Chiyoda, Sakado, Saitama 350-0288, Japan
2
Asken division, Green House Co., Ltd., 3-20-2 Nishishinjyuku, Shinjyuku-ku, Tokyo 163-1477, Japan
*
Author to whom correspondence should be addressed.
Nutrients 2017, 9(10), 1058; https://doi.org/10.3390/nu9101058
Submission received: 7 August 2017
/
Revised: 15 September 2017
/
Accepted: 20 September 2017
/
Published: 24 September 2017
Abstract
:We compared the relative validity of nutrient intakes derived from Internet website dish-based dietary records (WDDRs) and weighed dietary records (DRs). The study participants were 218 registered users of a dietary management website. After excluding 55 participants, a total of 163 participants were included in the final analyses. The participants were Japanese women, and their mean age and mean body mass index (BMI) were 39.3 (±10.3) years and 22.3 (±3.7) years, respectively. We compared differences in the DR and WDDR with respect to intakes of energy and 13 nutrients. The median values for the intake of protein and seven nutrients showed no significant difference between the DR and WDDR, and the estimated values were generally similar. The interquartile range of nutrients with a significant difference did not show a large deviation, with the exception of vitamin A. Correlation coefficients showed a strong correlation of 0.7, with the exception of sodium and vitamin E. The kappa coefficients for energy and for some nutrients were good to fair. Using Bland–Altman plots, we found proportional errors in the intake values for vitamins and minerals. We could not confirm obvious systematic errors for energy, protein, fat, or carbohydrate intake. WDDR use is considered to be a valid method for estimating energy and nutrient intakes among Japanese women.
1. Introduction
In recent years, about 60% of deaths in Japan are due to cancer, heart disease, and stroke [1], which are caused by obesity, hypertension, dyslipidemia, and hyperglycemia [2]. Visceral fat-type obesity is one of the factors of lifestyle-related diseases that should be improved first, because it is the basis of metabolic syndrome [3]. The proportion of obesity in the Japanese population over the past 10 years has been around 30% for men and more than 20% for middle-aged and older women, although a downward trend has been seen in women [4]. In addition, the proportion of people over 40 years of age who are suspected of having metabolic syndrome is 48.3% for men and 20.6% for women [4]. In order to prevent the onset of lifestyle-related disease conditions, it is important to self-manage diet and exercise daily. However, it is difficult to fully understand how to maintain a balanced diet and to practice moderate exercise in daily life; moreover, it is hard to remain motivated to continue these habits over the long term.
To solve this problem, various programs that help the general public to continuously practice proper eating and exercise habits have been developed [5]. In particular, the number of weight-loss and lifestyle-improvement methods using the Internet has been rapidly increasing in recent years [6,7,8,9]. This study examined users of Asken, an Internet website that generates and records dish-based dietary records [10] and that is intended for Japanese users. However, an application of the same tool is available in English in Canada [11], with dishes that are commonly eaten in Canada and the United States. There are plans underway to release the application in the United States in the future.
In Japan, Asken is used not only by experts, but also by the general public for the main purpose of self-management of weight. As of March 2015, this website had more than 400,000 registered users, making it one of the largest websites for dietary management in Japan [10]. The website instantly estimates the daily energy and nutrient intakes of website users on the basis of the Dietary Reference Intakes for Japanese 2015 [12]. The range of the recommended intake is visualized with a graph, and individualized dietary advice is provided. The 663 users who continuously used this website for 3 months showed dietary improvement and an average weight reduction of 3.5 kg [13].
Methods for accurately evaluating energy and nutrient intakes include dietary record (DR) methods (e.g., weighed record method, estimated record method) and dietary recall methods. Recording all food items and their weight is time-consuming and a great deal of work, and the calculation and assessment of nutrient intakes requires the support of experts such as dietitians. To overcome these challenges, Asken uses an input method based on the dish consumed. The user logs into the site, selects their meal from an online database containing approximately 100,000 dishes, and inputs the serving size they consumed (Figure 1 and Figure 2). Following this, the user can check graphs of energy and nutrient intakes that are generated on the basis of the data they entered (Figure 3). Although this method is simple, the ingredients and weight of each registered dish on the website are fixed. Even when users cook their own meals, they cannot make adjustments to the dishes registered in Asken to exactly match what they prepared. Therefore, even if the names of the dishes match, there is a possibility that the food items consumed do not match the contents of the dish selected from the database exactly.
Although previous studies have investigated the validity of dietary survey methods, there are few studies on the validity of dish-based dietary survey methods. Furthermore, the authors found no study on the validity of DR tools that are comparable to the Asken website in terms of the number of dishes in the database. Therefore, in this study, we performed an objective evaluation of the validity of an Internet website dish-based DR (WDDR) tool. The objectives of this study were to separately examine the ability of the WDDR to estimate representative nutrient intake values at the population level, that is, for all the participants of this study (intake estimating ability), to rank the intake of individuals within the population (ranking ability), and to estimate intake at the individual level.
2. Materials and Methods
2.1. Participants and Investigation Period
Study participants were recruited from among registered users of the Japanese version of Asken using Internet mail (email magazines). The first survey was carried out from July to August 2013 and the second was carried out in May 2014.
Email magazines are sent periodically to registered users of Asken to provide them with health and diet information. Healthy persons over 20 years of age were eligible to participate in the study, regardless of gender. However, only women were recruited in 2014, because there were few responses from men in 2013. After the recruitment email was sent, we set an “application period” of 7 days, followed by a “preparation period” of 7 days, and a “study period” of 7 days. During the application period, we obtained responses from 100 participants (14 men and 86 women; average age of 42.6 years) in 2013 and 118 participants (all women; average age of 37.4 years) in 2014. A total of 218 participants (14 men and 204 women; average age of 39.9 years) completed the surveys conducted in 2013 and 2014, and 55 participants were excluded from this study. The reasons for exclusion were gender (male participants: n = 14) and insufficient DRs, such as those missing photographs or other information (n = 41). As a result, data for a total of 163 participants were analyzed in this study. The participants recorded all food items on the DR and the WDDR, and we compared the energy and nutrient intakes obtained by the DR with those obtained by the WDDR.
Prior to beginning the study, the participants provided consent to participate by clicking the “agree” button displayed on their screen at the time of registration after accepting the terms of use and confirming that they understood the explanations for the handling of personal information. This study was conducted in accordance with the Declaration of Helsinki, and the protocol was approved by the Kagawa Nutrition University ethics review committee (No. 223/2013).
2.2. DR
An explanation of the study purpose, study methods, and an example of a completed DR form were attached to an email and sent to all the study participants. The date of the dietary survey was set to one weekday during the study period. All foods consumed between getting up in the morning and going to bed at night, including breakfast, lunch, dinner, and snacks, were recorded on the specified DR form. In addition, the participants were required to take a photograph of their meal before eating and to store the digital images separately from the DR. The DR form was sent by email attachment or postal mail, and the digital images of the dishes were returned by uploading the files on a special screen. We used the digital images to confirm the contents of each meal by comparing the photograph of each dish with the DR completed by the participant. When there were discrepancies, the contents of the DR were modified to more closely match the digital image.
The methods for completing the DR were as follows. When weighing the food items at home, in principle, all ingredients and seasonings were weighed in their raw state before cooking. In cases when a food could not be weighed in its raw state, it was weighed by separating each food ingredient after cooking, and the weight of each was recorded along with a statement of “cooked” on the DR form. For processed foods, a product name, a company name, and the amount of intake (such as half of one box or one package) were recorded. The participants used their own scale for measuring, and weights were recorded in grams. In the case of eating out, the ingredients and the estimated serving (such as one large bowl or one small plate) of the dish along with the name of the restaurant and the dish were recorded. When the full dish was not eaten, the estimated leftover portion was subtracted from the total serving and the modification was made on the DR form. The participants took the photographs with their own digital camera or cell-phone camera. After we received the DR, we confirmed the food names and weights recorded on the DR form by comparing them with the participants’ photographs, as described above. For cooked foods, we calculated nutrients on the basis of the weight of the food in its raw state. For processed foods, we analyzed the ingredients in accordance with the nutrition facts indicated by the manufacturer. Lastly, nutrient values of dietary supplements were not included in the nutrient intakes for this study. Nutrient intakes were calculated using the Standard Tables of Food Composition in Japan 2010 [14].
2.3. WDDR
The WDDR was completed on the same day as the DR. The participants were asked to enter the data on the website in the same way as they usually did. When recording food intakes on the website, users choose their portion size from one of the seven options: 1/4 of the serving, 1/2 of the serving, 3/4 of the serving, 1 serving, 1.5 servings, 2 servings, or 3 servings. The nutrient intake recorded on the WDDR was automatically calculated by the website system on the basis of the data provided by the participant. The system calculated the nutrient intake on the basis of the weight before cooking using the Standard Tables of Food Composition in Japan 2010 [15]. For processed foods, the nutrient content data provided by the manufacturer were used.
2.4. Nutrient Intake Analysis
The nutrients analyzed and evaluated in this study were the 13 nutrients listed on Asken (protein, fat, carbohydrates, calcium, iron, vitamin A, vitamin B1, vitamin B2, vitamin C, vitamin E, dietary fiber, cholesterol, and sodium) and energy.
2.5. Statistical Analysis
Statistical analysis was performed using JMP version 10 (SAS Institute Inc., Cary, NC, USA). JMP can calculate kappa coefficients but does not calculate weighted kappa coefficients; therefore, we used Excel Statistics, 2012 edition (Social Survey Research Information Co., Ltd., Tokyo, Japan) for the weighted kappa coefficients. The energy and nutrient intakes for the DR and the WDDR are presented as medians and quartile ranges. Comparisons between the DR and WDDR were conducted using the Wilcoxon signed-rank test. The relationship between the DR and WDDR was examined by Spearman’s rank correlation, and p-values less than 0.05 were considered statistically significant. The degree of agreement between individual nutrient intakes was tested using weighted kappa coefficients [16] and Bland–Altman plots [15]. For the weighted kappa coefficients, linear weights were calculated, following previous studies [17,18]. The limit of agreement, which indicates the limit of significant difference in the Bland–Altman plot, was set to 1.96 times the standard deviation of the difference between the DR and WDDR [19]. The evaluation criteria for the correlation coefficients were as follows: 0–0.19: almost no correlation; 0.20–0.39: weak correlation; 0.40–0.69: moderate correlation; and 0.70–1.00: strong correlation [20]. The evaluation criteria for weighted kappa coefficients were as follows: 0–0.40: poor agreement; 0.41–0.60: moderate agreement; 0.61–0.80: good agreement; and 0.81–1.00: very good agreement [21]. The Wilcoxon signed-rank test used both unadjusted values and adjusted values of the density method. Spearman’s rank correlation, the weighted kappa coefficients and Bland–Altman plots used only adjusted values of the density method. For the density method, the amount of nutrient intake was converted into intake (mg or μg) per 1000 kcal.
3. Results
3.1. Participant Attributes
The characteristics of the participants are shown in Table 1. The average age of the participants was 39.3 years, and the average body mass index was 22.3. Of the 163 participants, 10 completed the survey for 2 days and 2 completed the survey for 3 days. Because these data were registered in a different time period, each entry was included in the analysis as a record for one survey.
3.2. Comparison and Correlation of the DR and WDDR
The comparisons and correlations between the DR and WDDR for energy and nutrient intakes are shown in Table 2. The median energy intake was significantly higher in the WDDR (1554 kcal/day) compared to the DR (1472 kcal/day). Similarly, carbohydrates, vitamin A, and sodium were significantly higher in the WDDR compared to the DR, while fat, vitamin C, and cholesterol were significantly lower. No significant difference was seen between the WDDR and DR for protein, calcium, iron, vitamin B1, vitamin B2, vitamin E, or dietary fiber. Spearman’s correlation coefficient after the energy adjustment showed a moderate association between the intakes of vitamin E, at 0.62, and sodium, at 0.49; the intakes of all other nutrients showed a strong association between the DR and WDDR.
3.3. Agreement between the DR and the WDDR
Table 3 shows the agreement between the DR and the WDDR on the basis of the quantile and weighted kappa coefficients by the energy and nutrient intake. For the energy intake, 66.3% were divided into the same quantile, showing good agreement between the DR and the WDDR, with a weighted kappa coefficient of 0.70. Nutrients that showed good agreement between the DR and the WDDR were calcium, iron, vitamin C, and dietary fiber. Sodium intake showed poor agreement between the DR and the WDDR, with a weighted kappa coefficient of 0.34. Other nutrients showed moderate agreement. Except for vitamin B1 (49.1%) and sodium (41.1%), agreement was observed for over 50% of the participants for all the other nutrients, and all were divided into the same quantile. More than 81% of all the nutrients surveyed were divided into the adjacent quantile. The proportion of the most distant quantile was 0% for energy, protein, carbohydrates, iron, vitamin B1, and vitamin B2. Vitamin E, with a proportion of 2.5%, and sodium, with a proportion of 4.3%, were in the most distant quantile.
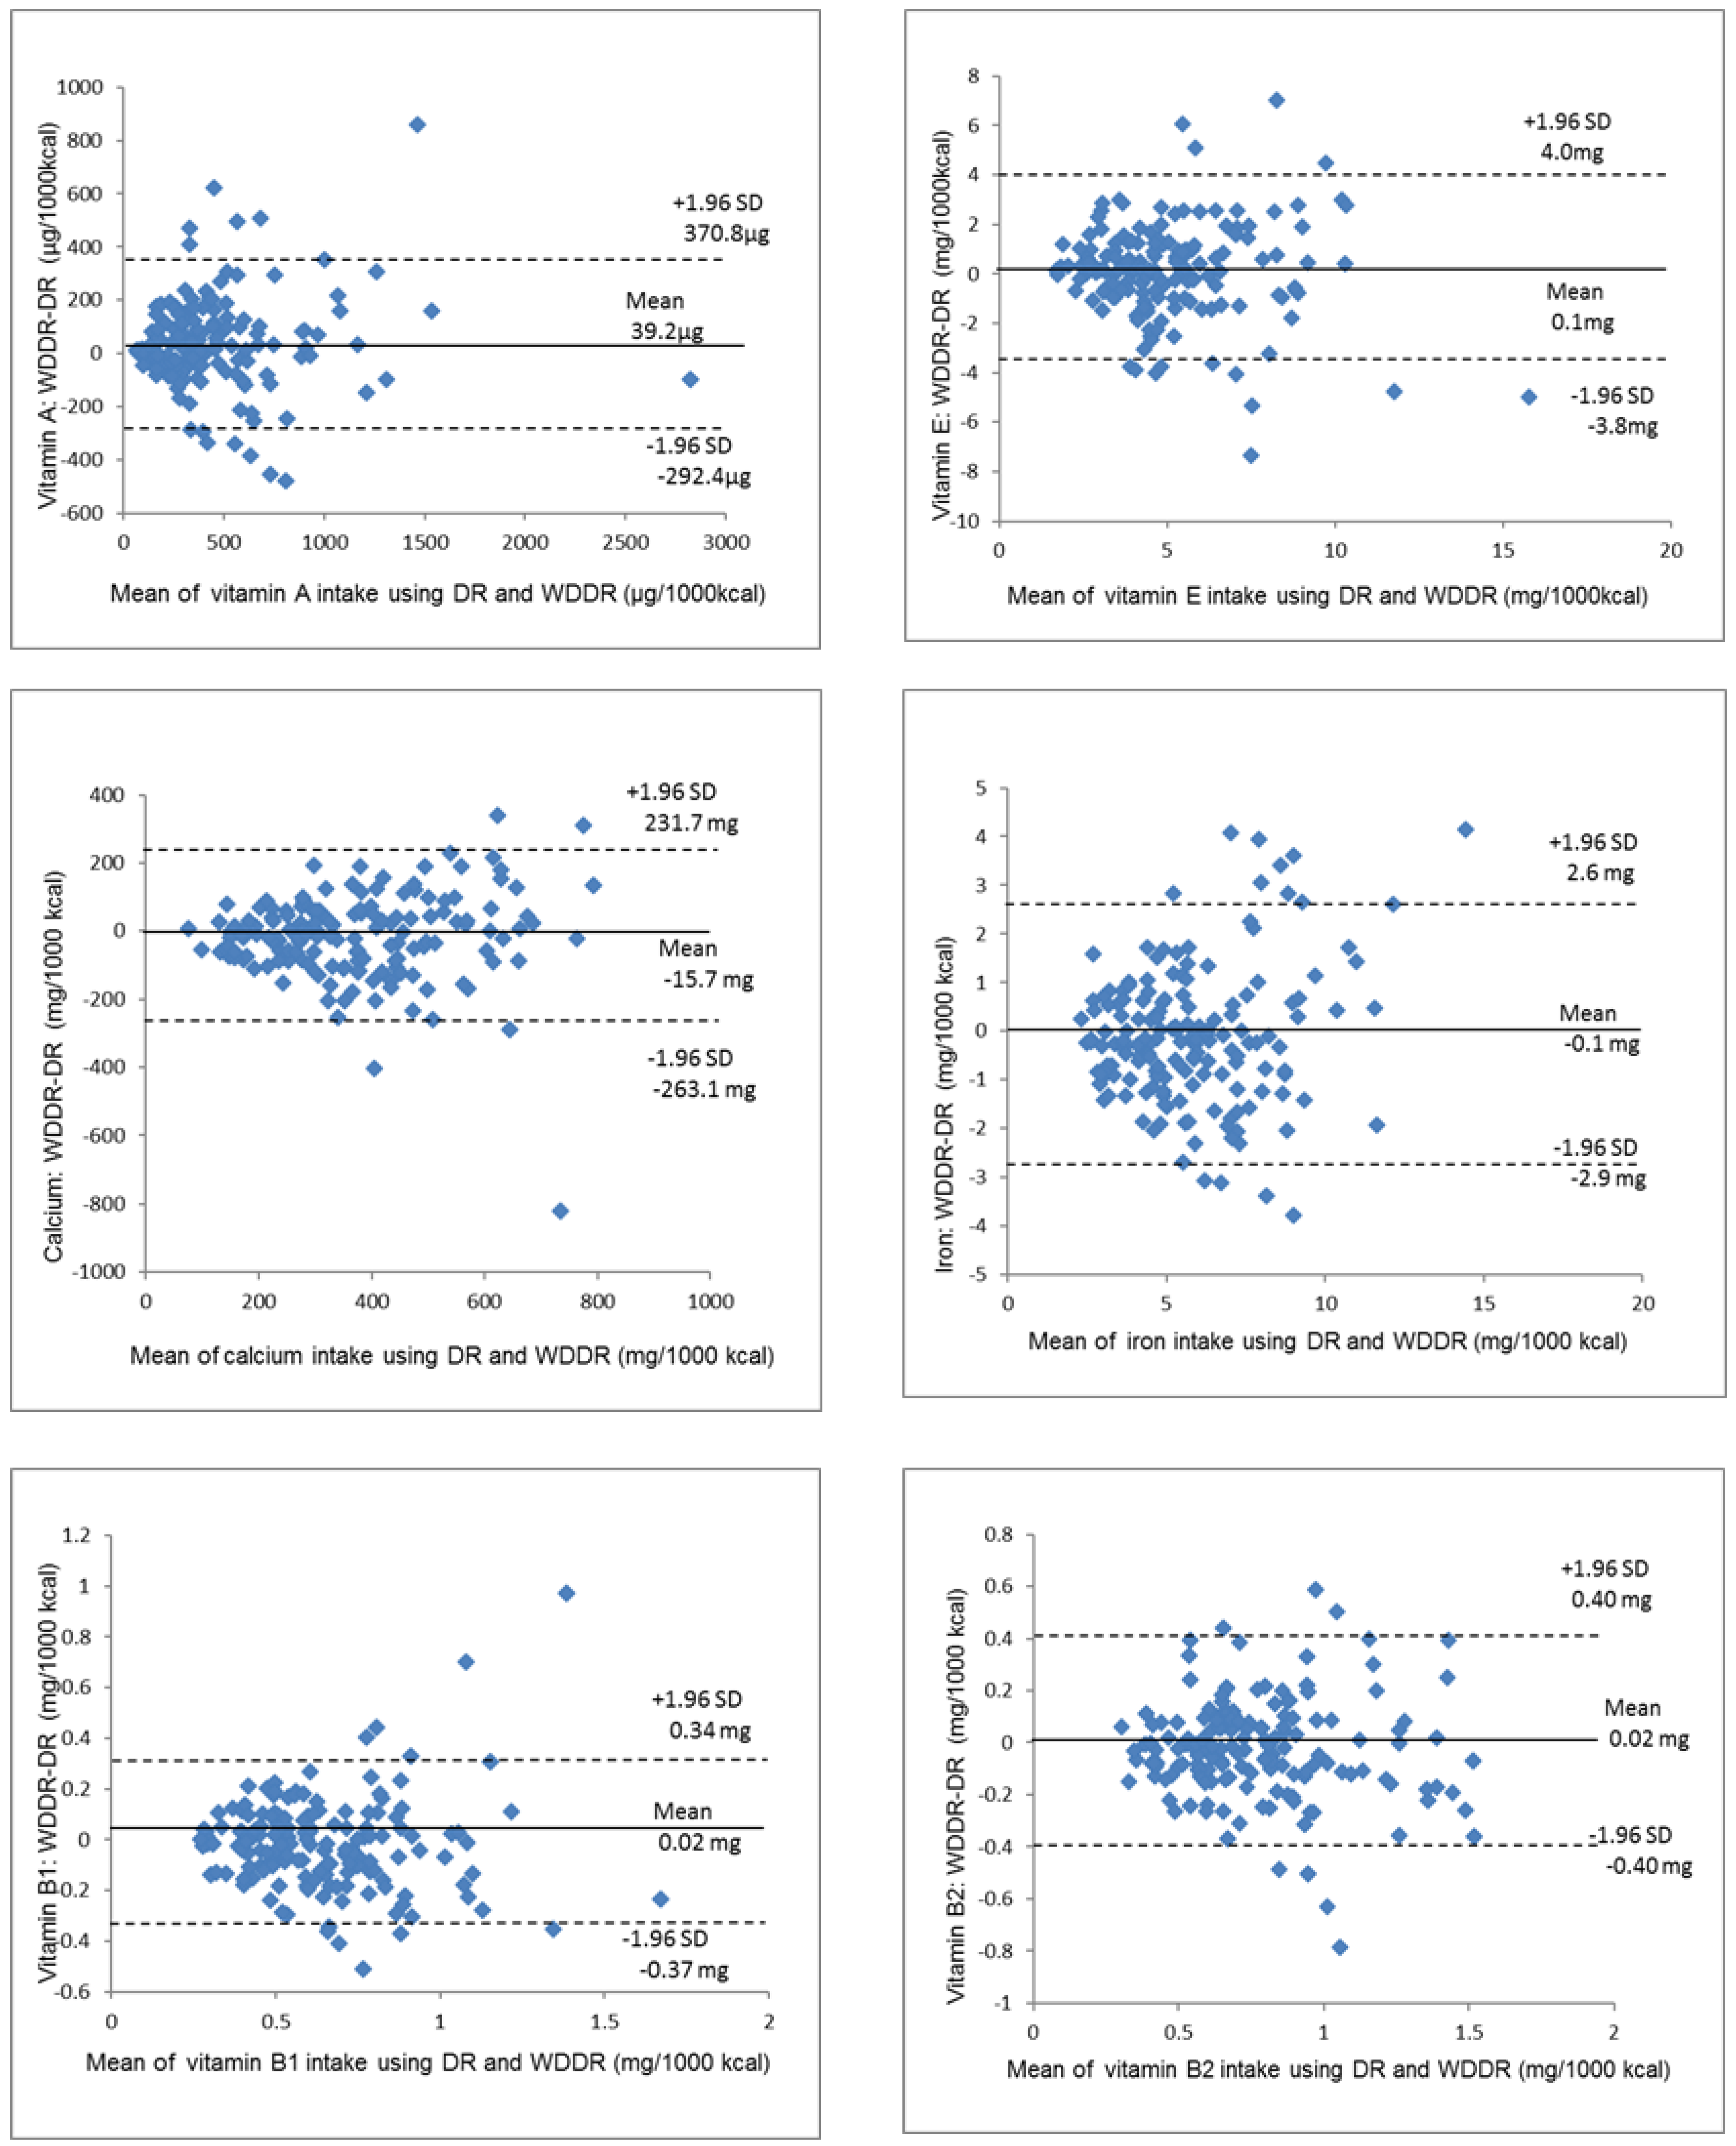
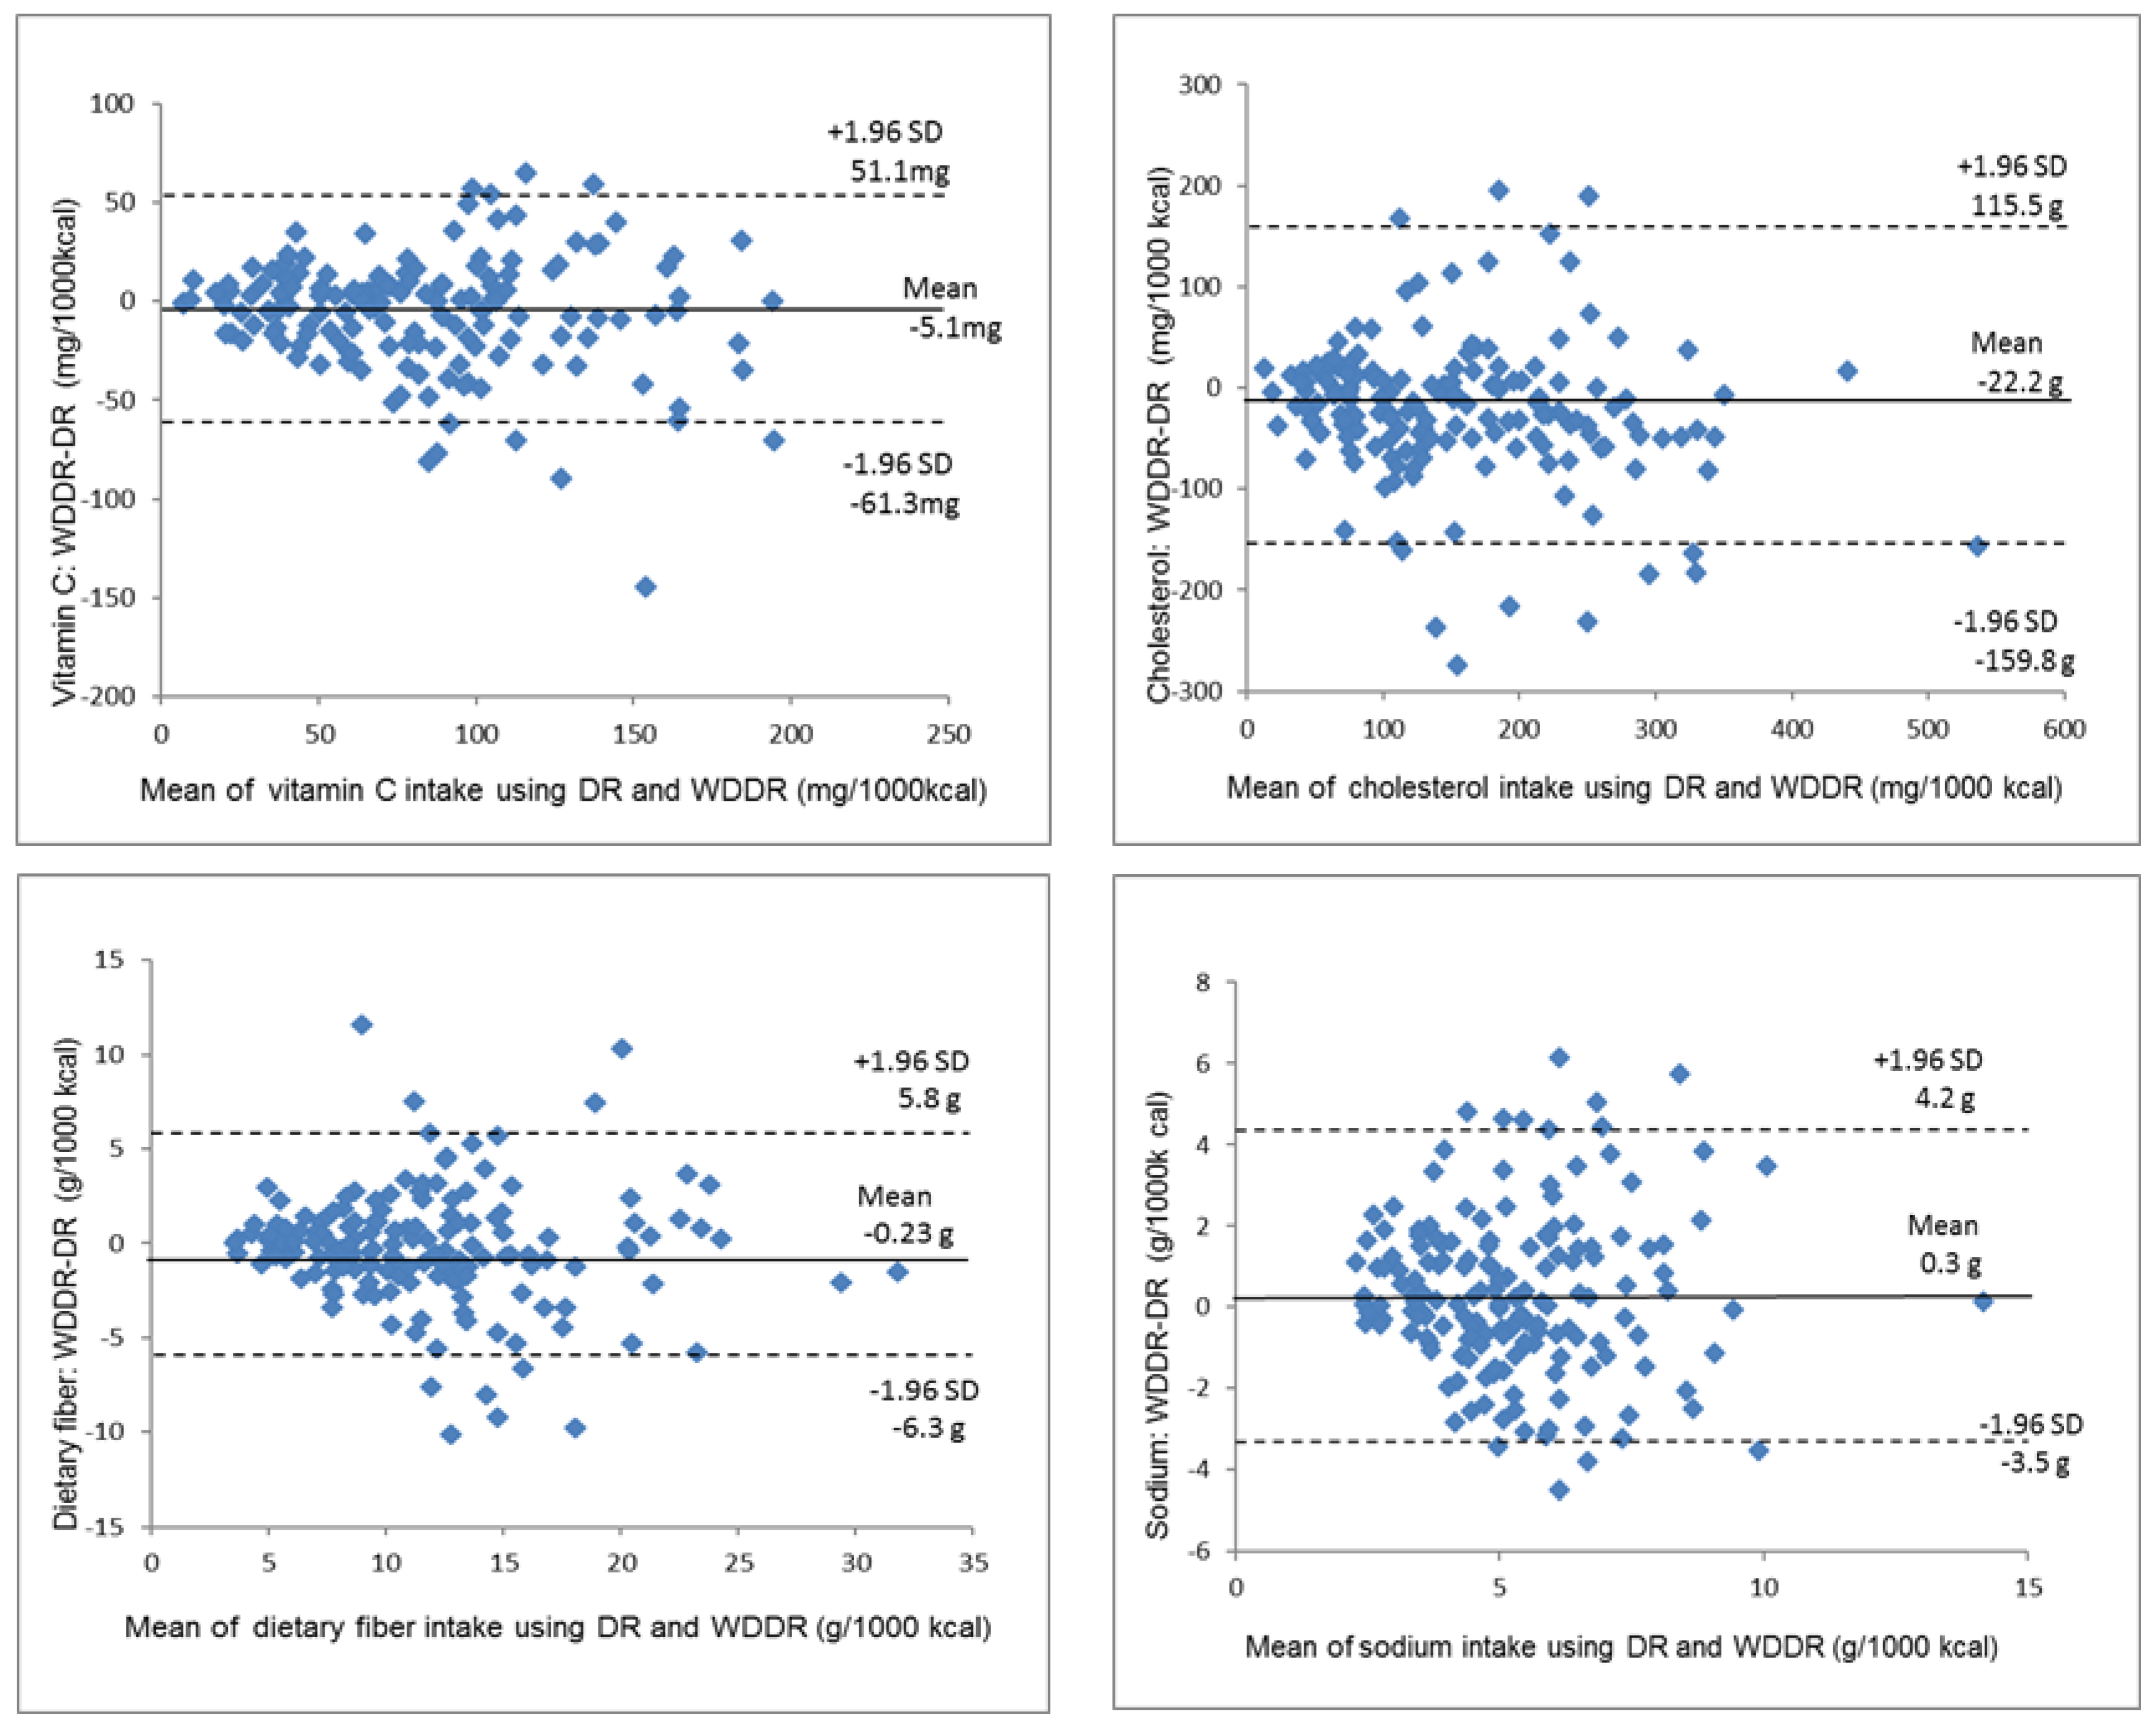
3.4. Agreement between the DR and the WDDR by Bland–Altman Plot
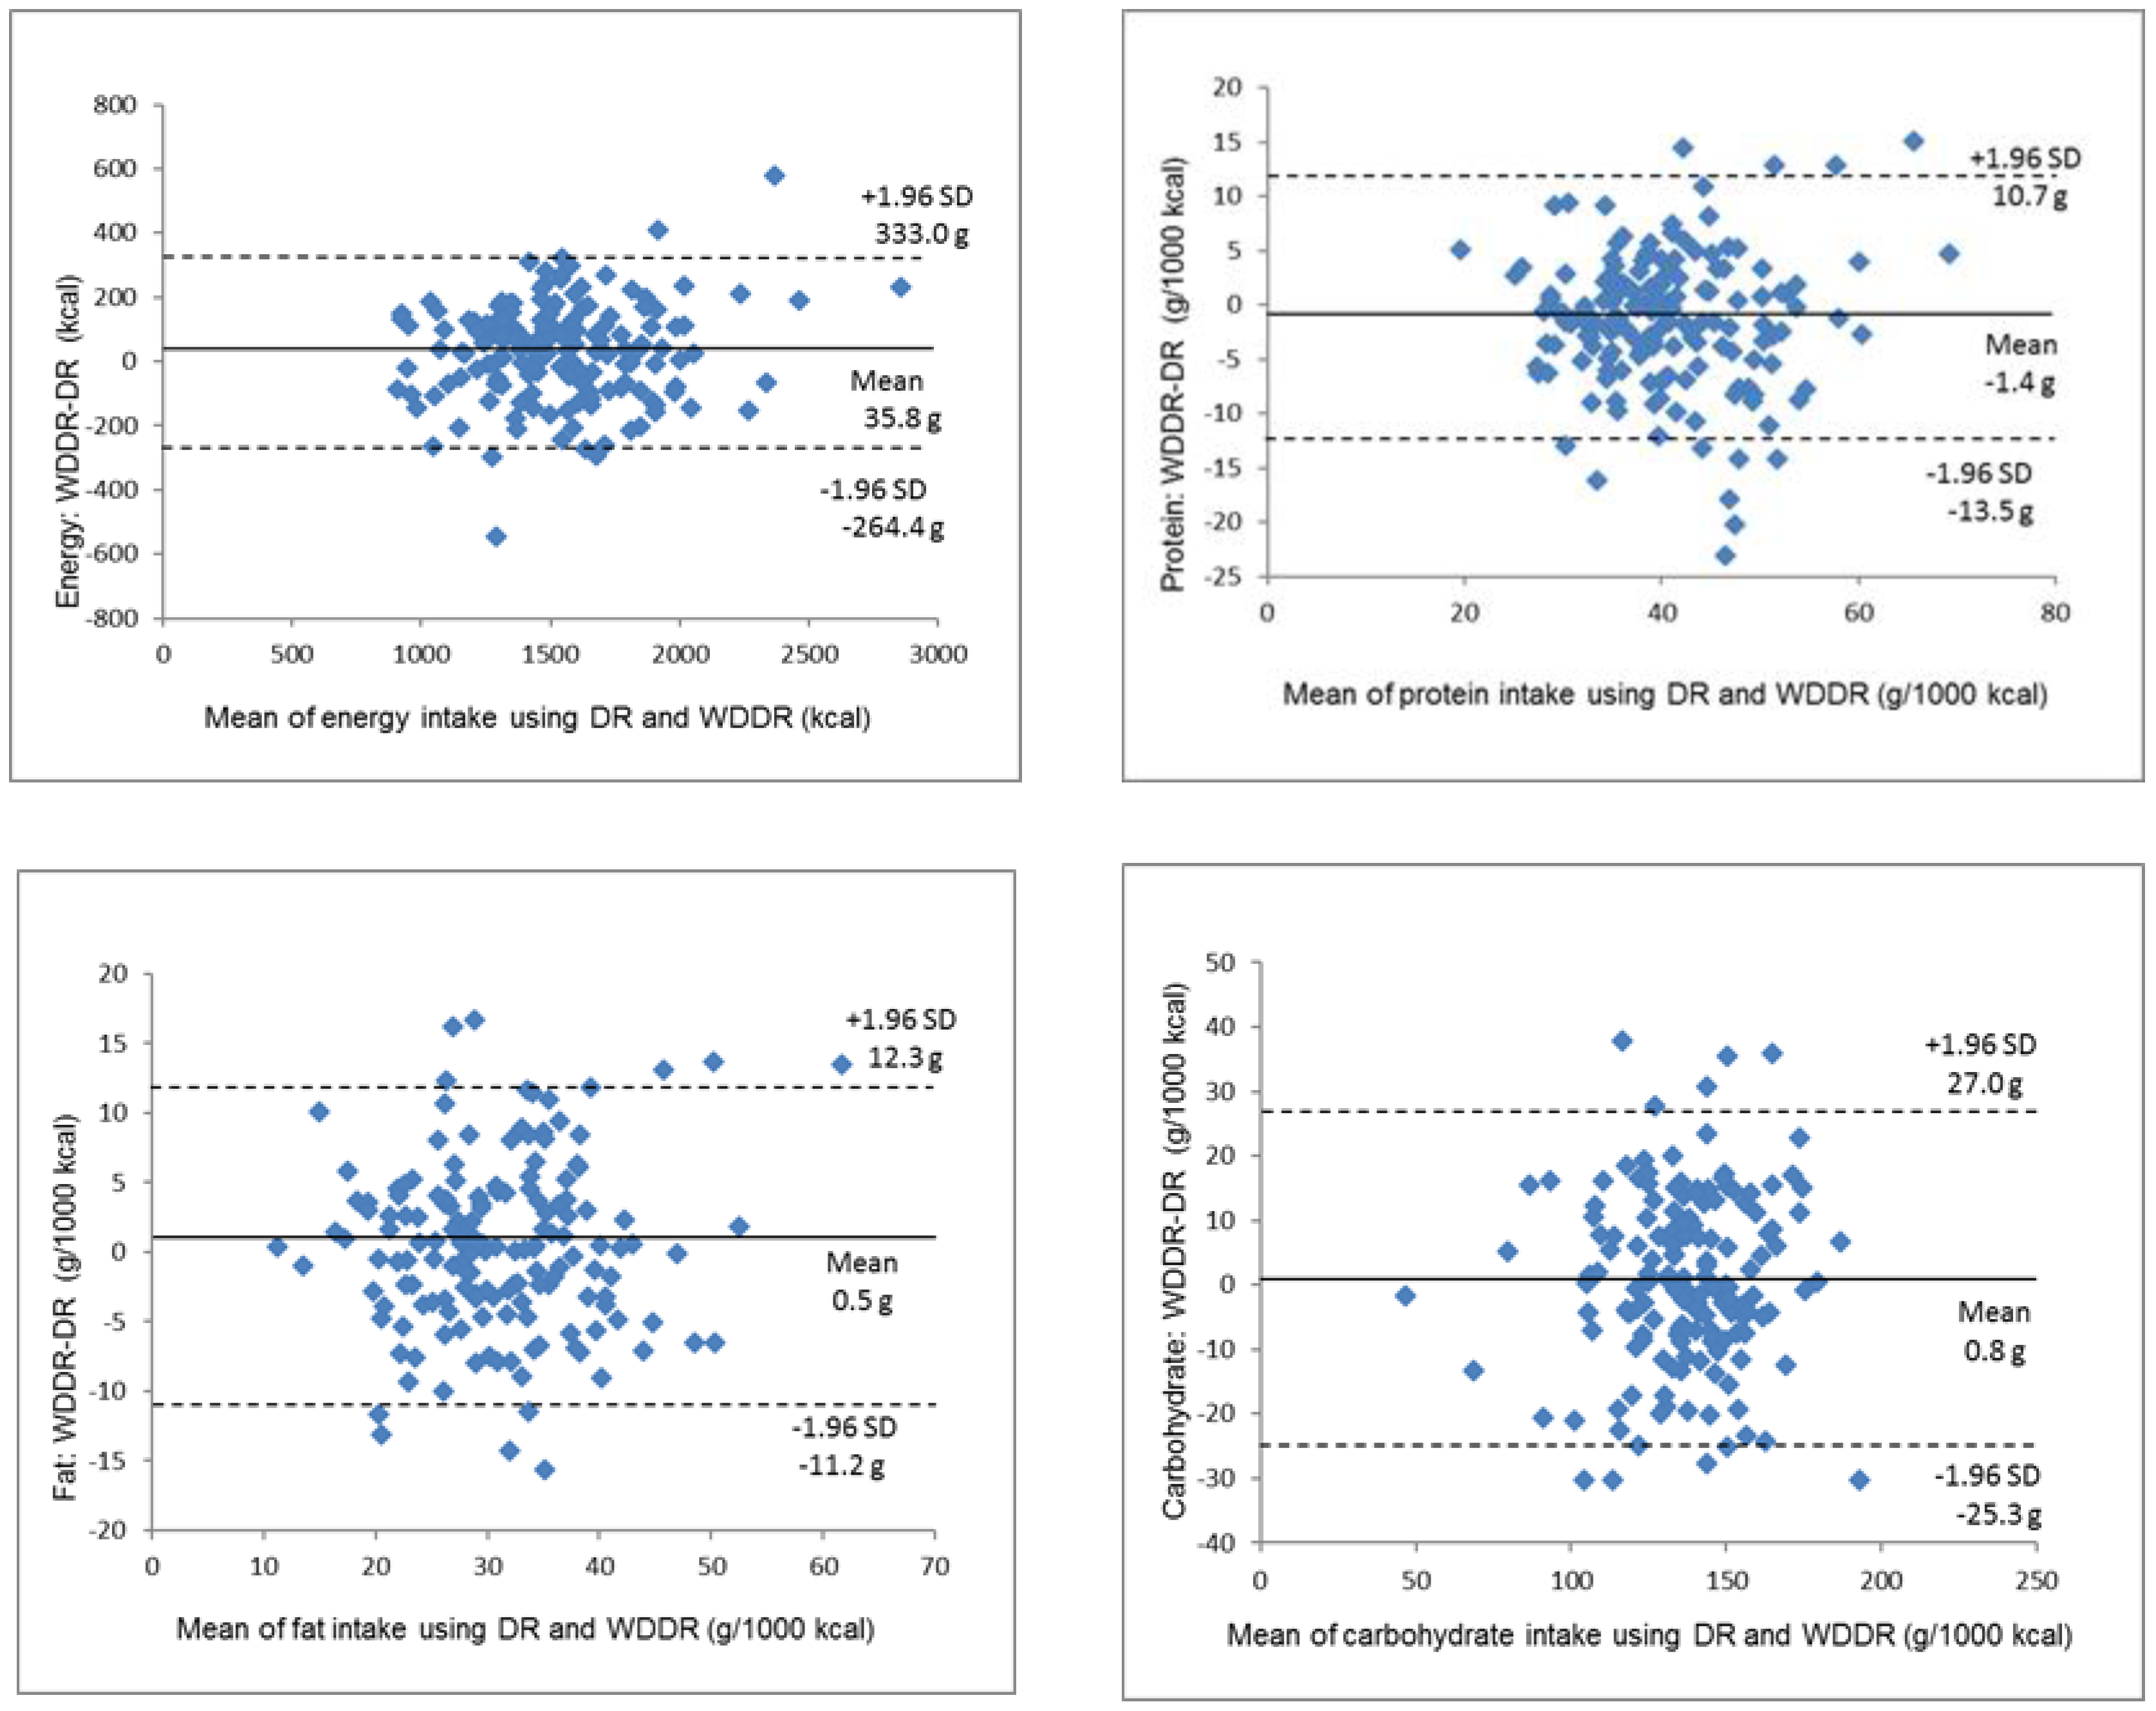
Figure 4, Figure 5 and Figure 6 show the Bland–Altman plots of the energy and nutrient intake. For the energy, protein, fat, and carbohydrate intake, obvious systematic errors could not be confirmed. The range of significant differences for energy, protein and carbohydrates were between −261.4 and 333.0 kcal, −13.5 and 10.7 g, and −25.3 and 27.0 g, respectively. These values from the WDDR were one-third to around one-half of the mean DR values, and the average energy intake on the WDDR was 35.8 kcal higher than that of the DR. Differences in the vitamin and mineral (vitamin A, vitamin B1, vitamin B2, vitamin C, vitamin E, calcium, iron and sodium) intake and dietary fiber increased as the average value increased, showing a tendency for proportional bias.
4. Discussion
In this study, we examined the validity of the WDDR method, which is easy for the general public to use, compared to the weighed DR method. We also examined representative nutrient intake values at the population level, the intake ranking ability of individuals within the population, and the intake estimating ability at the individual level among Japanese women. In comparing the representative nutrient intake values of 13 nutrients and energy, we did not observe significant differences in the values of 7 nutrients or energy. In addition, the median representative nutrient intake values were approximately the same for the DR and WDDR. Therefore, the WDDR was considered useful for estimating nutrient intakes at the population level among Japanese women.
When evaluating the validity of nutrient intakes, a good correlation coefficient between the DR and the food frequency questionnaire (FFQ) is generally in the range of 0.5–0.7 [22]. A study using the FFQ conducted in the United Kingdom [23] found correlation coefficients of 0.23–0.65, which were approximately equal to those found in other studies [24,25]. The validity of dietary surveys in the Japanese population is generally lower than that in Western populations, because many Japanese dishes are a combination of various food items, such as boiled and marinated dishes containing multiple ingredients [26]. A previous study in Japan reported that a correlation coefficient of 0.4 or higher has a reasonable ranking ability [19]. The correlation coefficient in this study was 0.49–0.84; therefore, the WDDR is considered to be a useful method for ranking the nutrient intake of individuals within the Japanese population.
This study investigated the agreement of nutrient intakes between two survey methods using the weighted kappa coefficient. In a previous study comparing 24 h dietary recalls and the FFQ in Chile [18], the kappa coefficients of all nutrient intakes, including energy, were less than 0.47. Compared to the kappa coefficients in studies on the validity of the FFQ, the degree of agreement between the WDDR and the DR for nutrient intakes in this study was relatively high, with the exception of sodium. However, because the degree of agreement for the sodium intake between the WDDR and the DR was low in this study, it is considered difficult to estimate sodium intake by evaluation at the individual level.
In Bland–Altman plots, a greater range of significant difference means a larger error, but the allowable range of significant difference depends on the study [27,28]. Another study comparing the FFQ and the DR in Mexico [29] found that the average energy intake according to the DR was 2041 kcal, and the range of significant difference was between −1070 and 2190 kcal, which was larger than for our study. Furthermore, another study evaluating individual nutrient intakes in the Japanese population using a Bland–Altman plot examined the estimation accuracy of the energy intake according to the weighed DR using the double-labeled water method [30] and found that the range of significant difference for energy intake in women was between −1396 and 952 kcal/day, which was greater than for our study. Our study cannot be simply compared with most previous studies on the validity of the FFQ, but the energy intake errors for individuals using the WDDR in this study were relatively small. Additionally, regarding the protein, fat, and carbohydrate intakes, statistical errors were small compared to other studies using the Bland–Altman plot [23,31]. This suggests that website users can effectively use the WDDR to estimate their energy, protein, fat and carbohydrate intake.
On the other hand, in terms of micronutrients, systematic errors, whose difference becomes larger as the intake increases, were observed for many of the nutrients in the Bland–Altman plot. As a result, the degree of agreement in the intake estimation at the individual level may have varied depending on the amount of intake. In addition, both the correlation coefficient and the kappa coefficient of sodium were lower than those of the other nutrients evaluated. Although the website includes the standard amount of seasoning for each dish registered in the database, the actual amount of seasoning in the dish varies depending on individual preferences. Thus, inconsistencies between what is considered a single serving by users and the predetermined serving size on the website could be the main reason for the low agreement between the DR and the WDDR for sodium.
The WDDR aims to more accurately estimate the amount of nutrient intake per day on the basis of dish-based records. Continuing this for some number of days is considered to lead to a more accurate estimation of habitual nutrient intake.
5. Limitations
The objective of this study was to examine the validity of nutrient intakes as estimated by an Internet WDDR tool. The WDDR was completed on the same day as the DR in this study. Because of the educative effects, it is possible that the participants entered more accurate information about the meals they consumed on the website. Additionally, women tend to cook meals more often than men, and this may have influenced the accuracy of the records [32]. The participants of this study were relatively young women with an average age of 39.3 years, and they may have been accustomed to using websites. This may have contributed to the favorable results. Although we initially recruited both men and women for the survey, only women were included in the analysis because of a shortage of male participants. Cases of gender differences between men and women have been noted in some dietary studies [22,33]. For this reason, in order to confirm the validity of the WDDR, a similar study that includes men should be conducted in the future.
We compared the WDDR with the DR and considered its relative validity. To the best of our knowledge, no research on the validity of dish-based DRs is available; therefore, we compared the results of the WDDR with the results of other methods. We often examine the validity of other methods by comparing them with the DR. For this reason, it was considered possible to compare the results of the WDDR with those of other methods.
6. Conclusions
On the basis of the results of the present study, the WDDR is a useful method for estimating energy and nutrient intakes at the population level (i.e., for all the participants in the present study) and can rank the intake of individuals within the population with a good degree of accuracy for Japanese women. The WDDR showed a relatively high estimating accuracy for the energy intake among individuals. In particular, it showed a relatively high estimating accuracy for the fat, protein and carbohydrate intakes among individuals. However, proportional error should be considered when evaluating the intakes of vitamins and minerals. In addition, it was difficult to accurately estimate the sodium intake with the WDDR. However, on the basis of our results, the WDDR is considered to be a valid method for estimating the energy and nutrient intake among Japanese women.
Acknowledgments
We would like to thank all those involved with this study, especially the participants. No funding was received for this research.
Author Contributions
All authors contributed to the preparation of the paper. E.M. was the primary investigator of this study and conceived the study idea; designed the study; participated in the collection of data, the data analysis, and the study implementation; and wrote the manuscript. M.M. recruited participants, collected data, and supported the participants. T.K. contributed to designing and implementing the study, and critically reviewed the manuscript. All authors agreed on the final version of the submitted paper.
Conflicts of Interest
The authors declare no conflict of interest.
References
- Ministry of Health, Labour and Welfare of Japan. Vital Statistics in Japan Trends up to 2012. Available online: http://www.mhlw.go.jp/seisakunitsuite/bunya/kenkou_iryou/kenkou/kenkounippon21/en/eiyouchousa/ (accessed on 30 June 2017).
- Sakurai, T. Metabolic syndrome and impaired daily life function in the elderly. Jpn. J. Geriatr. 2013, 50, 182–186. [Google Scholar] [CrossRef]
- Carr, D.B.; Utzschneider, K.M.; Hull, R.L.; Kodama, K.; Retzlaff, B.M.; Brunzell, J.D.; Shofer, J.B.; Fish, B.E.; Knopp, R.H.; Kahn, S.E. Intra-abdominal fat is a major determinant of the National Cholesterol Education Program Adult Treatment Panel III criteria for the metabolic syndrome. Diabetes 2004, 53, 2087–2094. [Google Scholar] [CrossRef] [PubMed]
- Ministry of Health, Labour and Welfare of Japan. National Health and Nutrition Survey 2015. Available online: http://www.mhlw.go.jp/bunya/kenkou/kenkou_eiyou_chousa.html (accessed on 30 June 2017).
- Hartmann-Boyce, J.; Johns, D.J.; Jebb, S.A.; Summerbell, C.; Aveyard, P. Behavioural weight management programmes for adults assessed by trials conducted in everyday contexts: Systematic review and meta-analysis. Obes. Rev. 2014, 15, 920–932. [Google Scholar] [CrossRef] [PubMed] [Green Version]
- Neve, M.; Morgan, P.J.; Jones, P.R.; Collins, C.E. Effectiveness of web-based interventions in achieving weight loss and weight loss maintenance in overweight and obese adults: A systematic review with meta-analysis. Obes. Rev. 2010, 11, 306–321. [Google Scholar] [CrossRef] [PubMed]
- Arem, H.; Irwin, M. A review of web-based weight loss interventions in adults. Obes. Rev. 2011, 12, e236–e243. [Google Scholar] [CrossRef] [PubMed]
- Kibushi, M.; Takimoto, M.; Okoshi, Y.; Nakagawa, T.; Irokawa, M.; Yakura, N.; Tanaka, M.; Matsuda, S. Body weight reduction program for metabolic syndrome—Introduction of Internet-based HALSMA Diet Program. Asian Pac. J. Dis. Manag. 2008, 2, 119–122. [Google Scholar]
- Kastura, Y.; Ootsuki, S.; Nakada, H.; Doi, T.; Sakamoto, H.; Habuki, K.; Fujimoto, S. Efficacy of a hybrid health improvement program on the web for male workers with metabolic syndrome. Jpn. J. Clin. Sports Med. 2009, 17, 273–281. [Google Scholar]
- Asken. Available online: http://www.asken.jp/ (accessed on 30 June 2017).
- Asken diet. Available online: https://www.askendiet.com/ (accessed on 26 August 2017).
- Ministry of Health, Labour and Welfare of Japan. Dietary Reference Intakes for Japanese 2015; Daiichi Shuppan: Tokyo, Japan, 2015.
- Michie, M.; Kawabata, T. Changes in Dietary Habits in Obese Men and Women Continuously Using a Web-based Weight Loss Program. J. Jpn. Soc. Stud. Obes. 2013, 19, 118–124. [Google Scholar]
- Ministry of Education, Culture, Sports, Science and Technology of Japan. Standard Tables of Food Composition in Japan 2010. Available online: https://fooddb.mext.go.jp/ (accessed on 30 June 2017).
- Bland, J.M.; Altman, D.G. Statistical methods for assessing agreement between two methods of clinical measurement. Lancet 1986, 1, 307–310. [Google Scholar] [CrossRef]
- Viera, A.J.; Garrett, J.M. Understanding interobserver agreement: The kappa statistic. Fam. Med. 2005, 37, 360–363. [Google Scholar] [PubMed]
- Marshall, S.; Watson, J.; Burrows, T.; Guest, M.; Collins, C.E. The development and evaluation of the Australian child and adolescent recommended food score: A cross-sectional study. Nutr. J. 2012, 11, 96. [Google Scholar] [CrossRef] [PubMed]
- Dehghan, M.; Martinez, S.; Zhang, X.; Seron, P.; Lanas, F.; Islam, S.; Merchant, A.T. Relative validity of an FFQ to estimate daily food and nutrient intakes for Chilean adults. Public Health Nutr. 2013, 16, 1782–1788. [Google Scholar] [CrossRef] [PubMed]
- Kobayashi, S.; Murakami, K.; Sasaki, S.; Okubo, H.; Hirota, N.; Notsu, A.; Fukui, M.; Date, C. Comparison of relative validity of food group intakes estimated by comprehensive and brief-type self-administered diet history questionnaires against 16 d dietary records in Japanese adults. Public Health Nutr. 2011, 14, 1200–1211. [Google Scholar] [CrossRef] [PubMed]
- Keio SFC Data Analysis Education Group. An Introduction to Data Analysis, 7th ed.; Keio University Publishing Association: Tokyo, Japan, 2008. [Google Scholar]
- Kundel, H.L.; Polansky, M. Measurement of observer agreement. Radiology 2003, 228, 303–308. [Google Scholar] [CrossRef] [PubMed]
- Willett, W. Nutritional Epidemiology, 2nd ed.; Daiichi Shuppan: Osaka, Japan, 1996; pp. 46–146. [Google Scholar]
- Fallaize, R.; Forster, H.; Macready, A.L.; Walsh, M.C.; Mathers, J.C.; Brennan, L.; Gibney, E.R.; Gibney, M.J.; Lovegrove, J.A. Online dietary intake estimation: Reproducibility and validity of the Food4Me food frequency questionnaire against a 4-day weighed food record. J. Med. Internet Res. 2014, 16, e190. [Google Scholar] [CrossRef] [PubMed]
- Zhuang, M.; Yuan, Z.; Lin, L.; Hu, B.; Wang, X.; Yang, Y.; Chen, X.; Jin, L.; Lu, M.; Ye, W. Reproducibility and relative validity of a food frequency questionnaire developed for adults in Taizhou, China. PLoS ONE 2012, 7, e48341. [Google Scholar] [CrossRef] [PubMed]
- Hong, T.K.; Dibley, M.J.; Sibbritt, D. Validity and reliability of an FFQ for use with adolescents in Ho Chi Minh City, Vietnam. Public Health Nutr. 2010, 13, 368–375. [Google Scholar] [CrossRef] [PubMed]
- Kitou, K.; Ishihara, J.; Kimira, M.; Takachi, R.; Hosoi, S.; Ishii, Y.; Iwasaki, M. Applicability of the dietary record by cooked dishes method for estimating dietary intake of populations in the areas other than where the database was developed. Nihon Koshu Eisei Zasshi 2012, 59, 700–711. [Google Scholar]
- Preiss, D.; Fisher, J. A measure of confidence in Bland-Altman analysis for the interchangeability of two methods of measurement. J. Clin. Monit. Comput. 2008, 22, 257–259. [Google Scholar] [CrossRef] [PubMed]
- Kotake, Y.; Sato, N. Bland-Altman analysis for the accuracy evaluation of the cardiac output monitor. J. Jpn. Soc. Intensive Care Med. 2009, 16, 263–272. [Google Scholar] [CrossRef]
- Macedo-Ojeda, G.; Vizmanos-Lamotte, B.; Marquez-Sandoval, Y.F.; Rodriguez-Rocha, N.P.; Lopez-Uriarte, P.J.; Fernandez-Ballart, J.D. Validation of a semi-quantitative food frequency questionnaire to assess food groups and nutrient intake. Nutr. Hosp. 2013, 28, 2212–2220. [Google Scholar] [PubMed]
- Ishikawa-Takata, K.; Bessyo, K.; Tanaka, S.; Tabata, I. Accuracy of energy intake estimation by weighed dietary record among Japanese adults. Jpn. J. Nutr. Diet. 2011, 69, 57–66. [Google Scholar] [CrossRef]
- Silva-Jaramillo, K.M.; Neutzling, M.B.; Drehmer, M. FFQ for the adult population of the capital of Ecuador (FFQ-Quito): Development, reliability and validity. Public Health Nutr. 2015, 18, 2540–2549. [Google Scholar] [CrossRef] [PubMed]
- Adams, J.; Goffe, L.; Adamson, A.J.; Halligan, J.; O’Brien, N.; Purves, R.; White, M. Prevalence and socio-demographic correlates of cooking skills in UK adults: Cross-sectional analysis of data from the UK National Diet and Nutrition Survey. Int. J. Behav. Nutr. Phys. Act. 2015, 12, 99. [Google Scholar] [CrossRef] [PubMed]
- Takachi, R.; Kudo, Y.; Watanabe, S.; Kimira, M. Validity of smaller sample sizes for the dish-based component table to use with the self-reported “Dietary Record by Cooked Dishes”. Jpn. J. Nutr. Diet. 2006, 64, 97–105. [Google Scholar] [CrossRef]
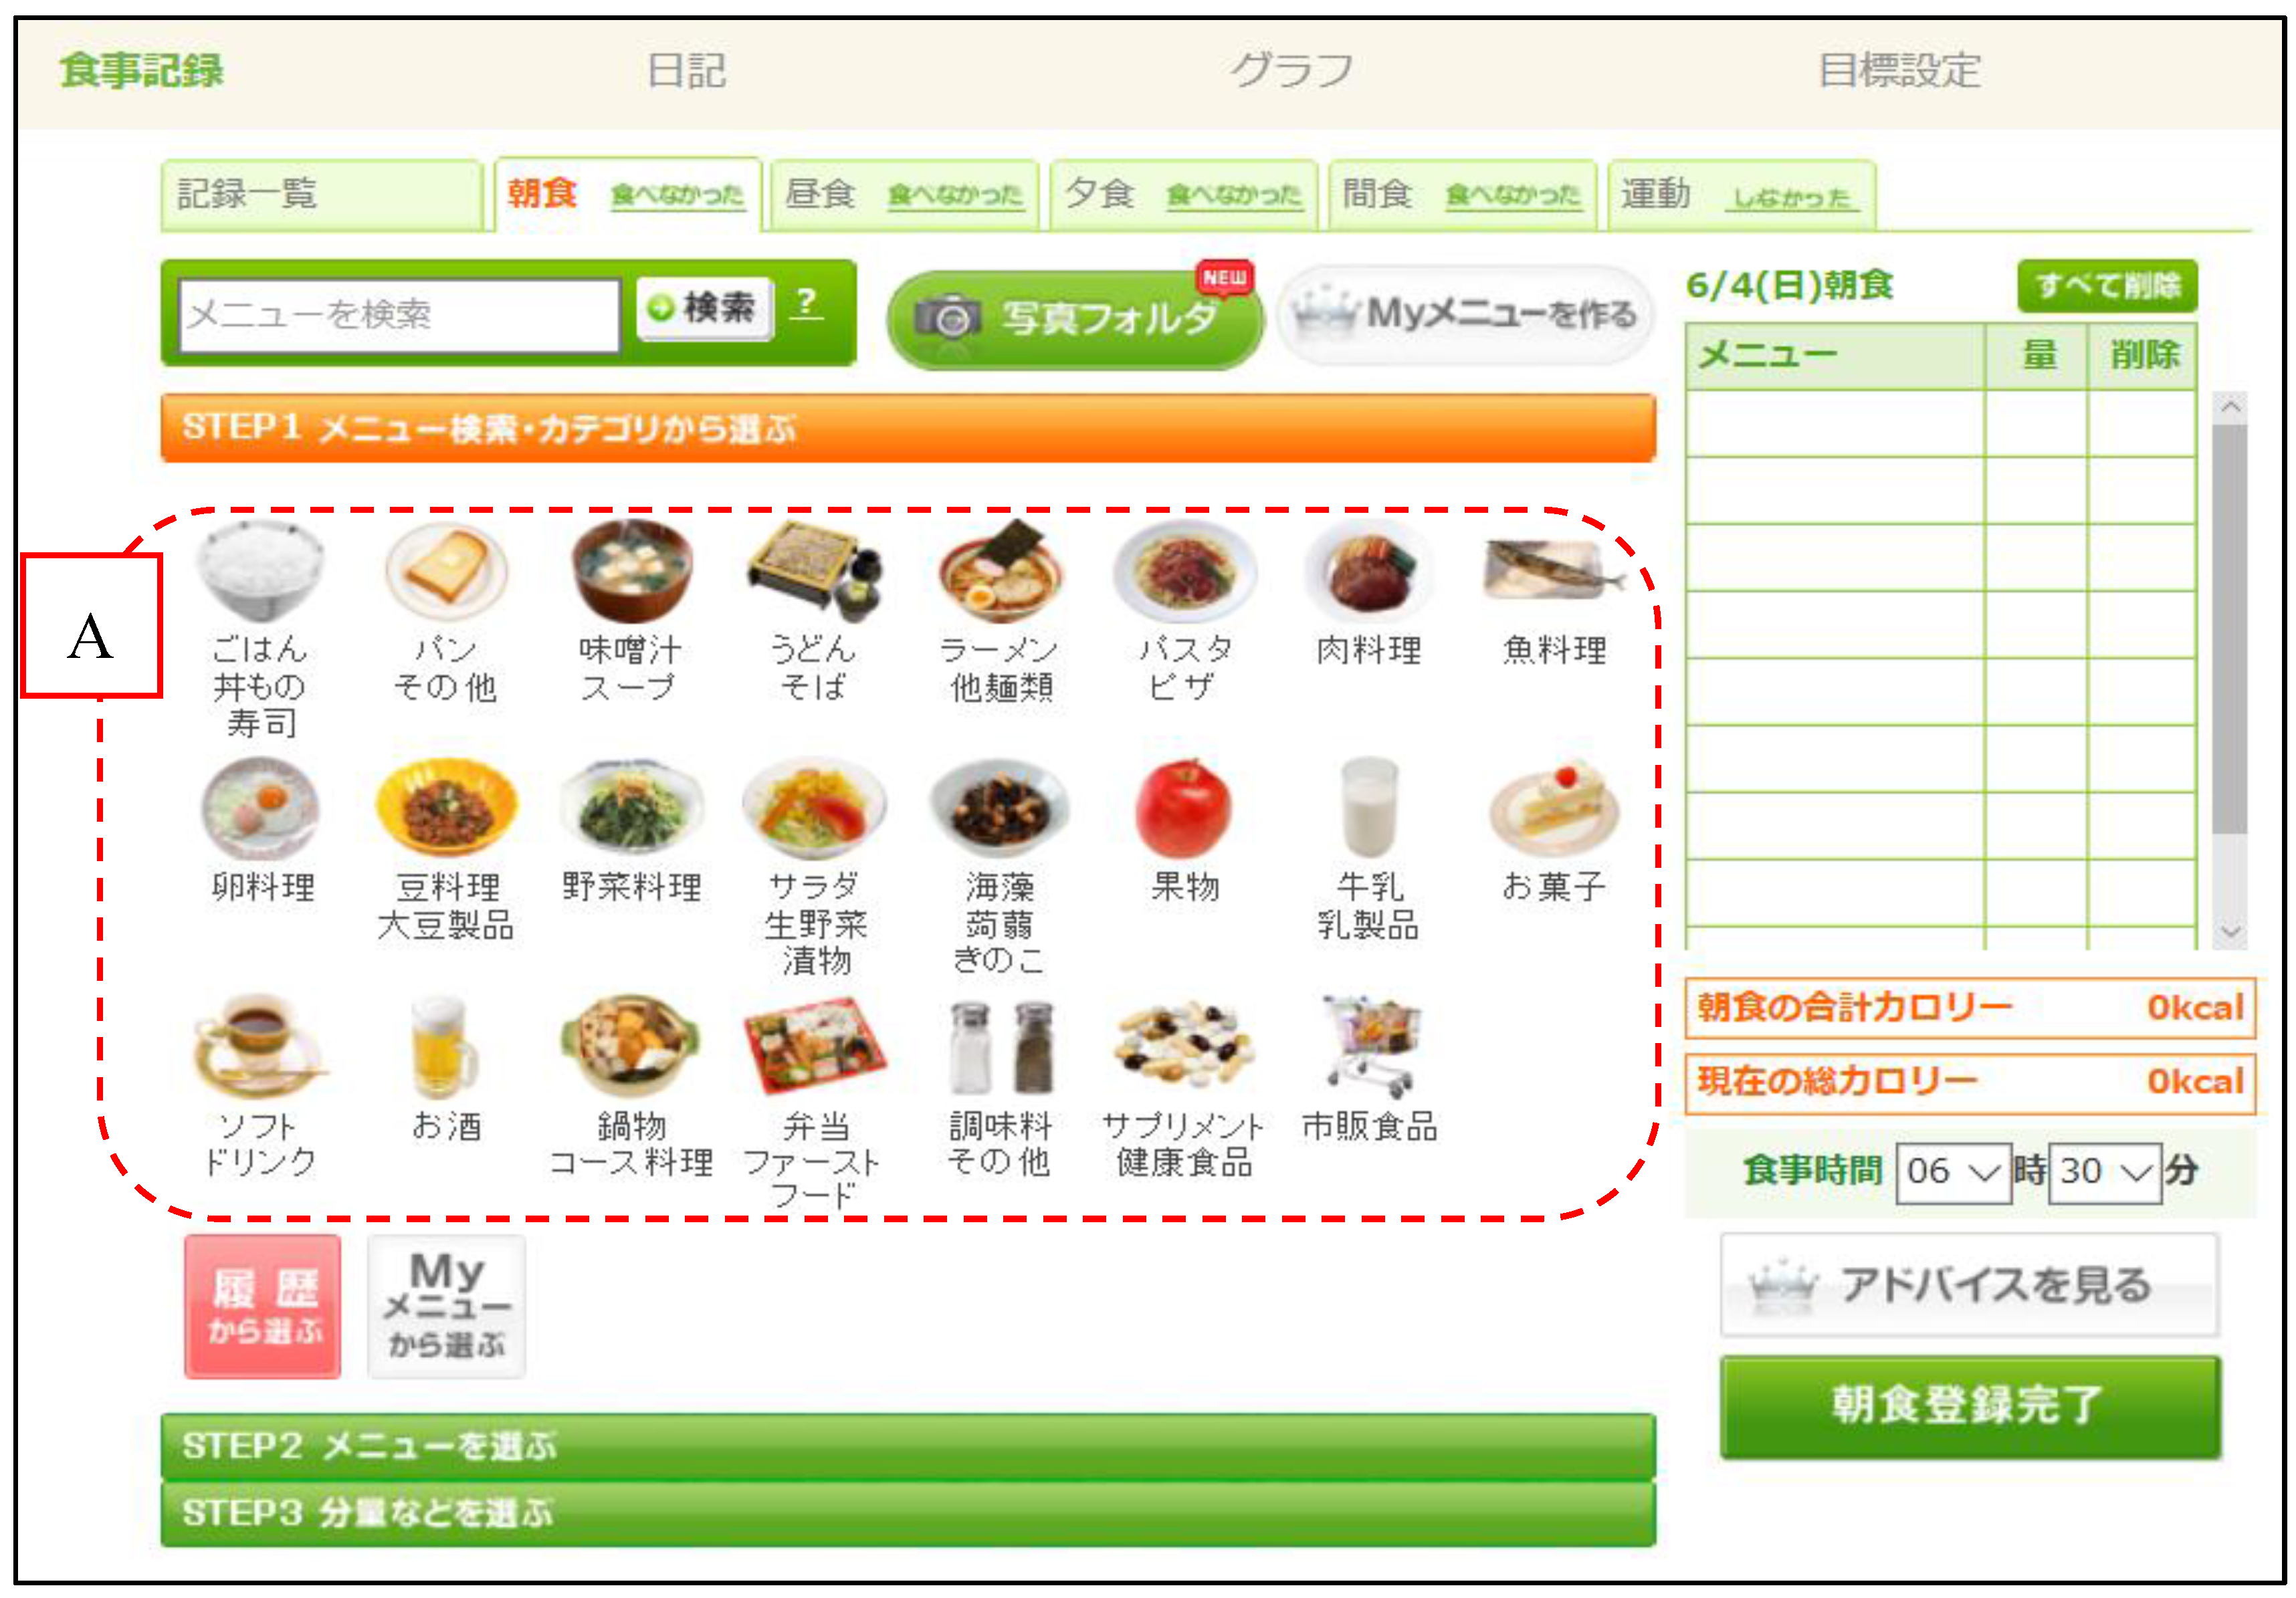
Figure 1.
Creating a dish record using the Japanese version of Asken. Users select the category of their dish and then choose the specific dish. Translation of dish names in area A (left to right): Top row: rice, bread, miso soup, soba, ramen, pasta, meat dishes, and fish dishes. Middle row: egg dishes, bean dishes, vegetable dishes, salads, seaweed and mushrooms, fruits, milk, and confectioneries. Bottom row: beverages, alcoholic beverages, three-course meals, boxed lunches and fast food, seasoning, supplements, and ready-made food.

Figure 2.
Choosing the serving size for a dish using the Japanese version of Asken. After selecting the specific dish, users select the appropriate serving size for the dish they consumed. Translation of serving sizes in area B (left to right): 1/4 of the serving, 1/2 of the serving, 3/4 of the serving, 1 serving, 1.5 servings, 2 servings, and 3 servings.
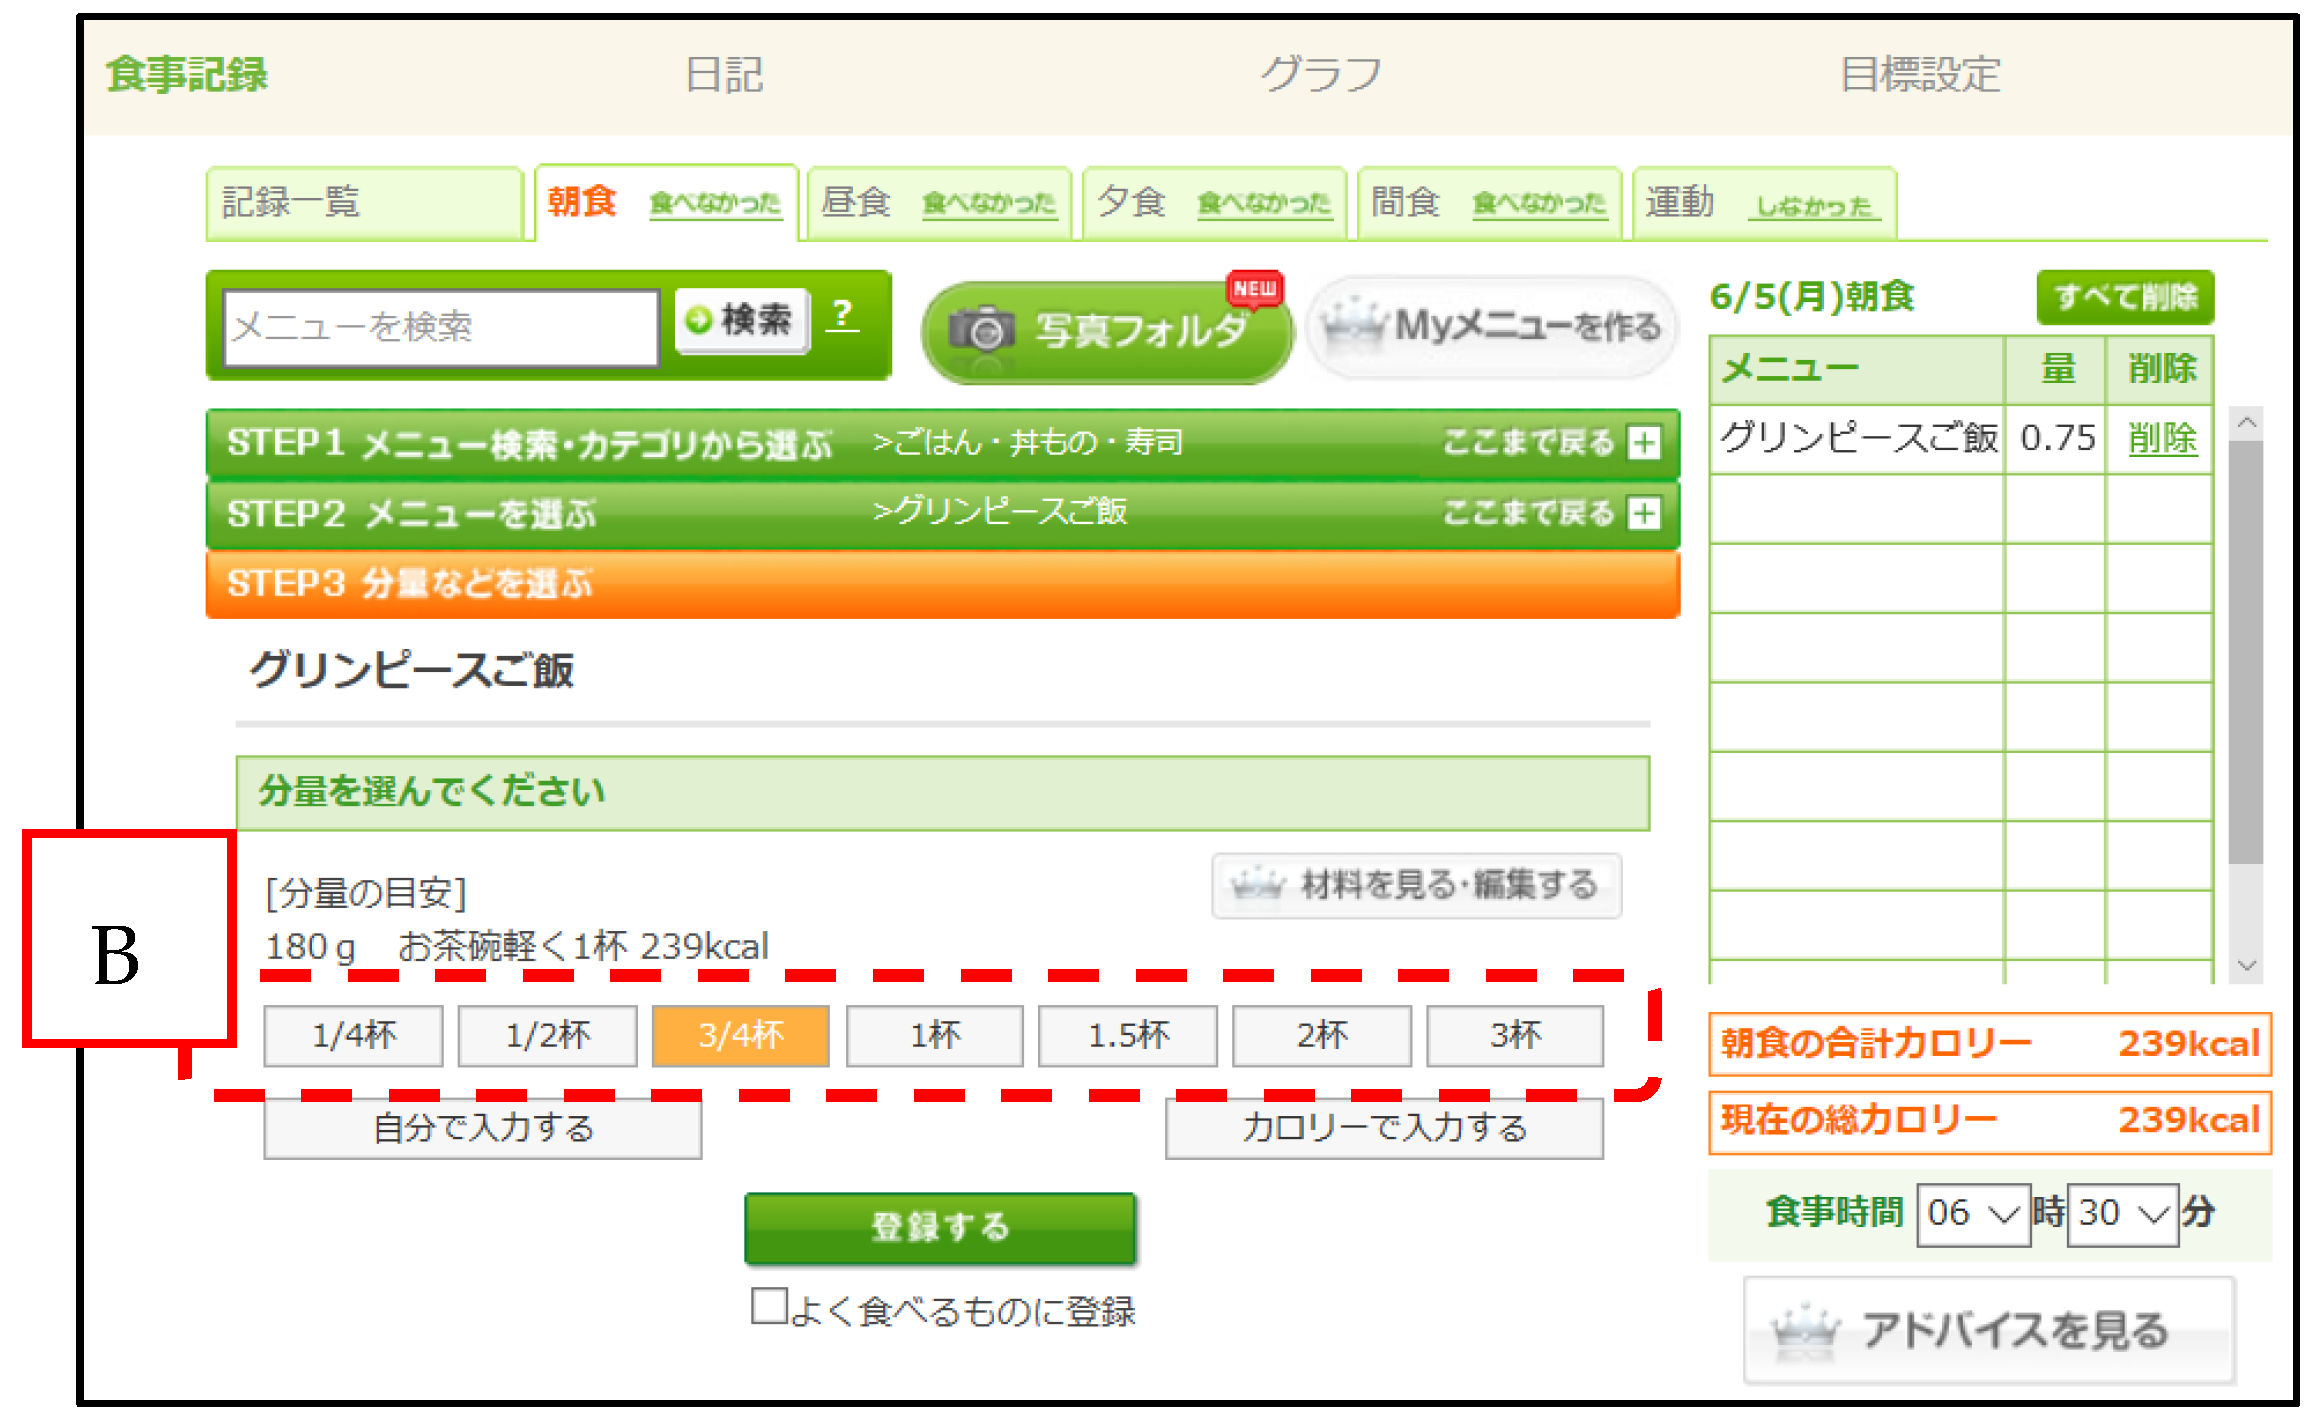
Figure 3.
Graph of energy and nutrient intakes generated by Asken on the basis of data input by the user. Translation of text in area C (top to bottom): energy, protein, lipids, carbohydrates, calcium, iron, vitamin A, vitamin E, vitamin B1, vitamin B2, vitamin C, dietary fiber, saturated fatty acids (not included in the present study), and salt. In area D, red boxes indicate excessive intakes, green boxes indicate appropriate intakes, and blue boxes indicate deficiencies. The vertical line shows the recommended intake.
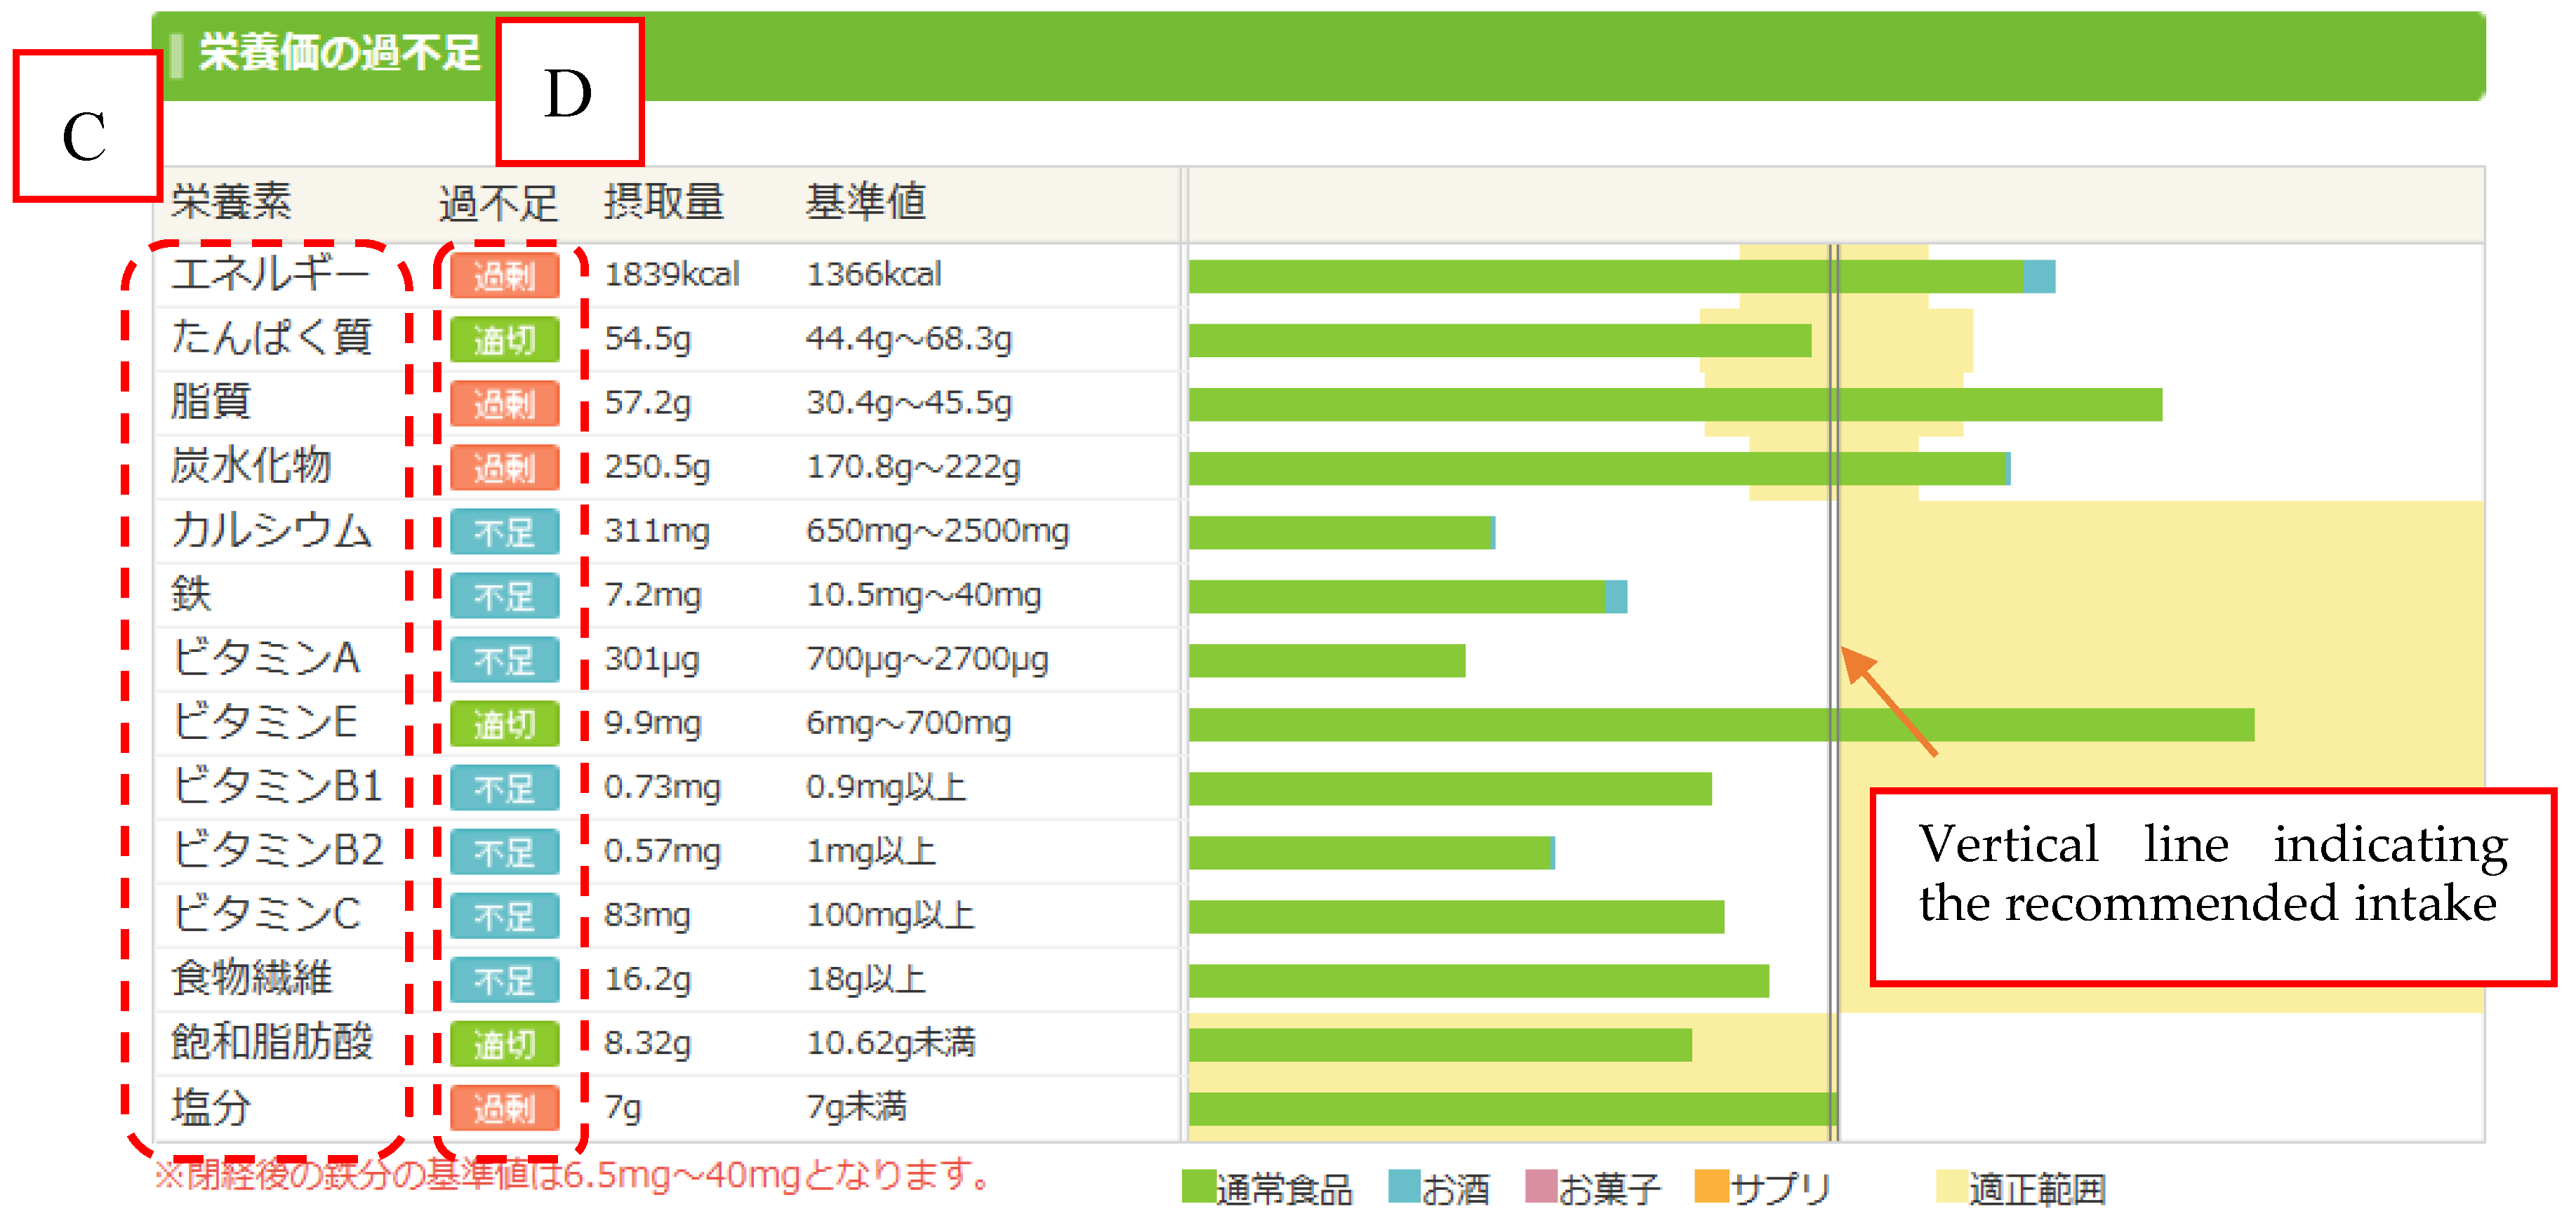
Figure 4.
Bland–Altman plots for agreement between energy and energy-adjusted intakes of nutrients (protein, fat and carbohydrates) using the DR and WDDR for 163 women for 1 day. DR: dietary record; WDDR: website dish-based dietary record; SD: standard deviation.
Figure 4.
Bland–Altman plots for agreement between energy and energy-adjusted intakes of nutrients (protein, fat and carbohydrates) using the DR and WDDR for 163 women for 1 day. DR: dietary record; WDDR: website dish-based dietary record; SD: standard deviation.

Figure 5.
Bland–Altman plots for agreement between energy-adjusted intakes of nutrients (calcium, iron, vitamin A, vitamin E, vitamin B1 and vitamin B2) using the DR and WDDR for 163 women for 1 day. DR: dietary record; WDDR: website dish-based dietary record; SD: standard deviation.
Figure 5.
Bland–Altman plots for agreement between energy-adjusted intakes of nutrients (calcium, iron, vitamin A, vitamin E, vitamin B1 and vitamin B2) using the DR and WDDR for 163 women for 1 day. DR: dietary record; WDDR: website dish-based dietary record; SD: standard deviation.

Figure 6.
Bland–Altman plots for agreement between energy-adjusted intakes of nutrients (vitamin C, cholesterol, dietary fiber and sodium) using the DR and WDDR for 163 women for 1 day. DR: dietary record; WDDR: website dish-based dietary record; SD: standard deviation.
Figure 6.
Bland–Altman plots for agreement between energy-adjusted intakes of nutrients (vitamin C, cholesterol, dietary fiber and sodium) using the DR and WDDR for 163 women for 1 day. DR: dietary record; WDDR: website dish-based dietary record; SD: standard deviation.


Table 1.
Participant characteristics 1.
| Women (n = 163) | |||
|---|---|---|---|
| n (%) | Mean | SD 2 | |
| Age (years) | - | 39.3 | ±10.3 |
| Height (cm) | - | 158.4 | ±5.6 |
| Body mass index (kg/m2) | - | 22.3 | ±3.7 |
| Accustomed to using Asken | - | - | - |
| Yes | 94 (57.7) | - | - |
| No | 69 (42.3) | - | - |
| Physical activity | - | - | - |
| Inactive | 94 (57.7) | - | - |
| Moderate | 64 (39.3) | - | - |
| Active | 7 (4.3) | - | - |
| Employment status | - | - | - |
| Manager | 2 (1.2) | - | - |
| Employee | 40 (13.5) | - | - |
| Freelancer | 22 (18.4) | - | - |
| Part-timer | 30 (30.1) | - | - |
| Housewife | 49 (4.9) | - | - |
| Student | 8 (4.9) | - | - |
| Other | 12 (7.4) | - | - |
1 Based on self-reported characteristics. 2 SD: standard deviation.
Table 2.
Comparison and correlation of the DR and WDDR by energy and nutrient intake (n = 163).
| DR | WDDR | Spearman’s Correlation Coefficient | ||||||
|---|---|---|---|---|---|---|---|---|
| Median 1 | Inter-Quartile Range | Median 1 | Inter-Quartile Range | Test 2 | r | r (Energy-Adjusted) | Evaluation | |
| Energy (kcal/day) | 1472 | 1307–1716 | 1554 | 1359–1732 | ** | 0.87 | — | Strong |
| Protein (g/day) | 61.6 | 50.0–72.0 | 61.3 | 49.9–69.2 | 0.78 | 0.75 | Strong | |
| Fat (g/day) | 45.9 | 34.8–55.5 | 45.7 | 36.6–60.1 | ** | 0.75 | 0.72 | Strong |
| Carbohydrates (g/day) | 208.1 | 173.4–236.3 | 215.6 | 187.6–245.2 | * | 0.82 | 0.79 | Strong |
| Calcium (mg/day) | 529 | 394–728 | 533 | 392–666 | 0.77 | 0.79 | Strong | |
| Iron (mg/day) | 8.2 | 6.4–10.7 | 8.2 | 6.3–10.3 | 0.81 | 0.84 | Strong | |
| Vitamin A (μg/day) | 498 | 305–797 | 571 | 349–917 | *** | 0.78 | 0.78 | Strong |
| Vitamin B1 (mg/day) | 0.92 | 0.67–1.22 | 0.92 | 0.68–1.15 | 0.76 | 0.77 | Strong | |
| Vitamin B2 (mg/day) | 1.13 | 0.92–1.41 | 1.17 | 0.91–1.36 | 0.71 | 0.75 | Strong | |
| Vitamin C (mg/day) | 124 | 85–163 | 117 | 77–155 | * | 0.81 | 0.82 | Strong |
| Vitamin E (mg/day) | 6.9 | 5.0–9.6 | 7.2 | 5.0–10.0 | 0.66 | 0.62 | Moderate | |
| Cholesterol (mg/day) | 222 | 123–351 | 193 | 111–310 | *** | 0.73 | 0.71 | Strong |
| Dietary fiber (g/day) | 16.6 | 12.0–21.7 | 16.4 | 12.0–21.5 | 0.79 | 0.81 | Strong | |
| Sodium (g/day) | 7.3 | 5.1–10.0 | 7.7 | 6.0–10.0 | * | 0.59 | 0.49 | Moderate |
DR: dietary record; WDDR: website dish-based dietary record. 1 Unadjusted value; 2 Wilcoxon signed-rank test. * p < 0.05; ** p < 0.01; *** p < 0.001.
Table 3.
Agreement between the DR and WDDR by energy and nutrient intake 1.
| Quantile | Weighted Kappa Coefficient | |||||||
|---|---|---|---|---|---|---|---|---|
| Same Quantile (%) 1 | Adjacent Quantile (%) 1 | ±2 (%) | ±3 (%) | a + b (%) | Kw | LOA | Evaluation | |
| Energy | 66.3 | 30.7 | 3.1 | 0.0 | 96.9 | 0.70 | 0.63–0.78 | Good |
| Protein | 51.5 | 38.0 | 10.4 | 0.0 | 89.6 | 0.53 | 0.44–0.62 | Moderate |
| Fat | 51.5 | 38.0 | 9.2 | 1.2 | 89.6 | 0.52 | 0.43–0.61 | Moderate |
| Carbohydrates | 50.9 | 41.7 | 7.4 | 0.0 | 92.6 | 0.55 | 0.46–0.63 | Moderate |
| Calcium | 57.1 | 37.4 | 4.9 | 0.6 | 94.5 | 0.61 | 0.52–0.69 | Good |
| Iron | 58.9 | 36.8 | 4.3 | 0.0 | 95.7 | 0.64 | 0.56–0.72 | Good |
| Vitamin A | 54.6 | 39.3 | 4.9 | 1.2 | 93.9 | 0.58 | 0.49–0.66 | Moderate |
| Vitamin B1 | 49.1 | 42.9 | 8.0 | 0.0 | 92.0 | 0.53 | 0.44–0.61 | Moderate |
| Vitamin B2 | 55.2 | 34.4 | 10.4 | 0.0 | 89.6 | 0.56 | 0.47–0.65 | Moderate |
| Vitamin C | 58.3 | 36.2 | 4.9 | 0.6 | 94.5 | 0.62 | 0.53–0.7 | Good |
| Vitamin E | 54.6 | 31.9 | 11.0 | 2.5 | 86.5 | 0.51 | 0.41–0.61 | Moderate |
| Cholesterol | 54.6 | 36.8 | 7.4 | 1.2 | 91.4 | 0.56 | 0.47–0.65 | Moderate |
| Dietary fiber | 62.6 | 31.3 | 4.3 | 1.8 | 93.9 | 0.64 | 0.55–0.72 | Good |
| Sodium | 41.1 | 39.9 | 14.7 | 4.3 | 81.0 | 0.34 | 0.23–0.45 | Poor |
DR: dietary record; WDDR: website dish-based dietary record; Kw: Linear weighted kappa coefficient; LOA: limit of agreement. 1 Energy-adjusted.
© 2017 by the authors. Licensee MDPI, Basel, Switzerland. This article is an open access article distributed under the terms and conditions of the Creative Commons Attribution (CC BY) license (http://creativecommons.org/licenses/by/4.0/).
Share and Cite
MDPI and ACS Style
Matsuzaki, E.; Michie, M.; Kawabata, T. Validity of Nutrient Intakes Derived from an Internet Website Dish-Based Dietary Record for Self-Management of Weight among Japanese Women. Nutrients 2017, 9, 1058. https://doi.org/10.3390/nu9101058
AMA Style
Matsuzaki E, Michie M, Kawabata T. Validity of Nutrient Intakes Derived from an Internet Website Dish-Based Dietary Record for Self-Management of Weight among Japanese Women. Nutrients. 2017; 9(10):1058. https://doi.org/10.3390/nu9101058
Chicago/Turabian StyleMatsuzaki, Eri, Mikiko Michie, and Terue Kawabata. 2017. "Validity of Nutrient Intakes Derived from an Internet Website Dish-Based Dietary Record for Self-Management of Weight among Japanese Women" Nutrients 9, no. 10: 1058. https://doi.org/10.3390/nu9101058
Note that from the first issue of 2016, this journal uses article numbers instead of page numbers. See further details here.