Efficacy of a Fatty Acids Dietary Supplement in a Polyethylene Glycol-Induced Mouse Model of Retinal Degeneration

 , ,
, ,  and
and 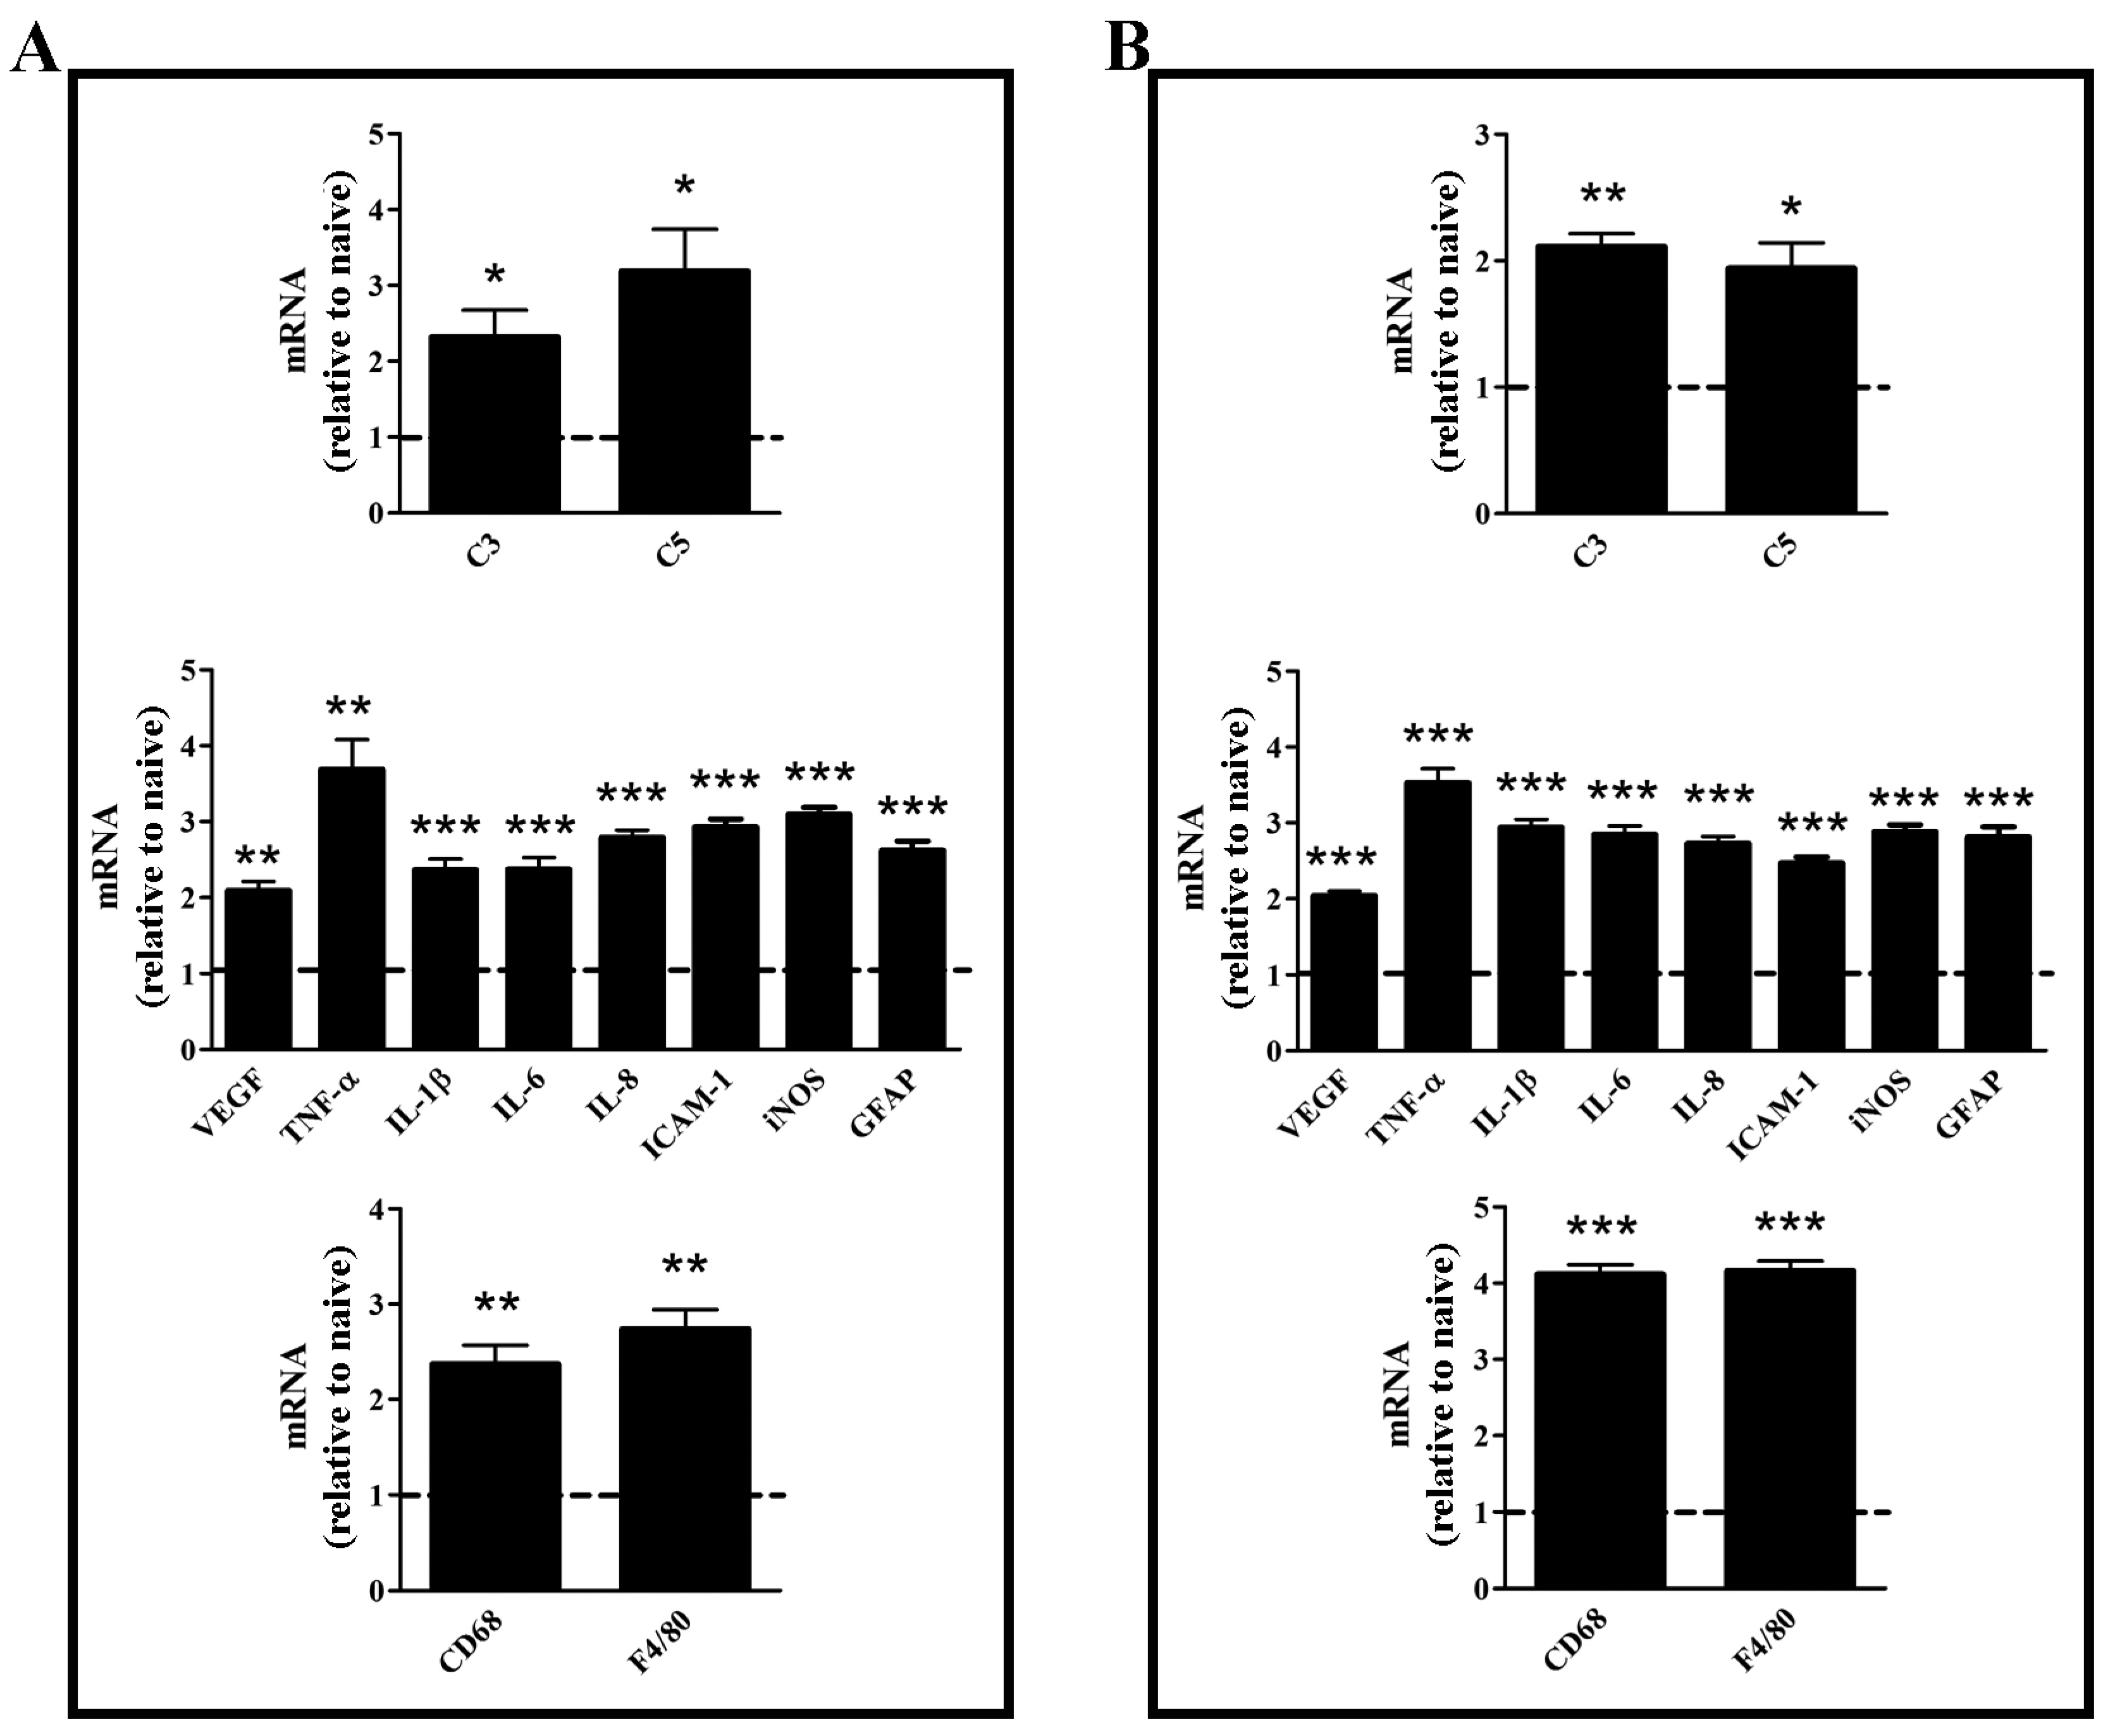
Abstract
:1. Introduction
2. Materials and Methods
2.1. Animals
2.2. Subretinal Injection of PEG
2.3. Dietary Supplementation
2.4. Quantitative Real Time PCR
2.5. Enzyme-Linked Immunosorbent Assays
2.6. Western Blot
2.7. Tissue Processing for Histology
2.8. Statistical Analysis
3. Results
3.1. Characterization of the Experimental Model
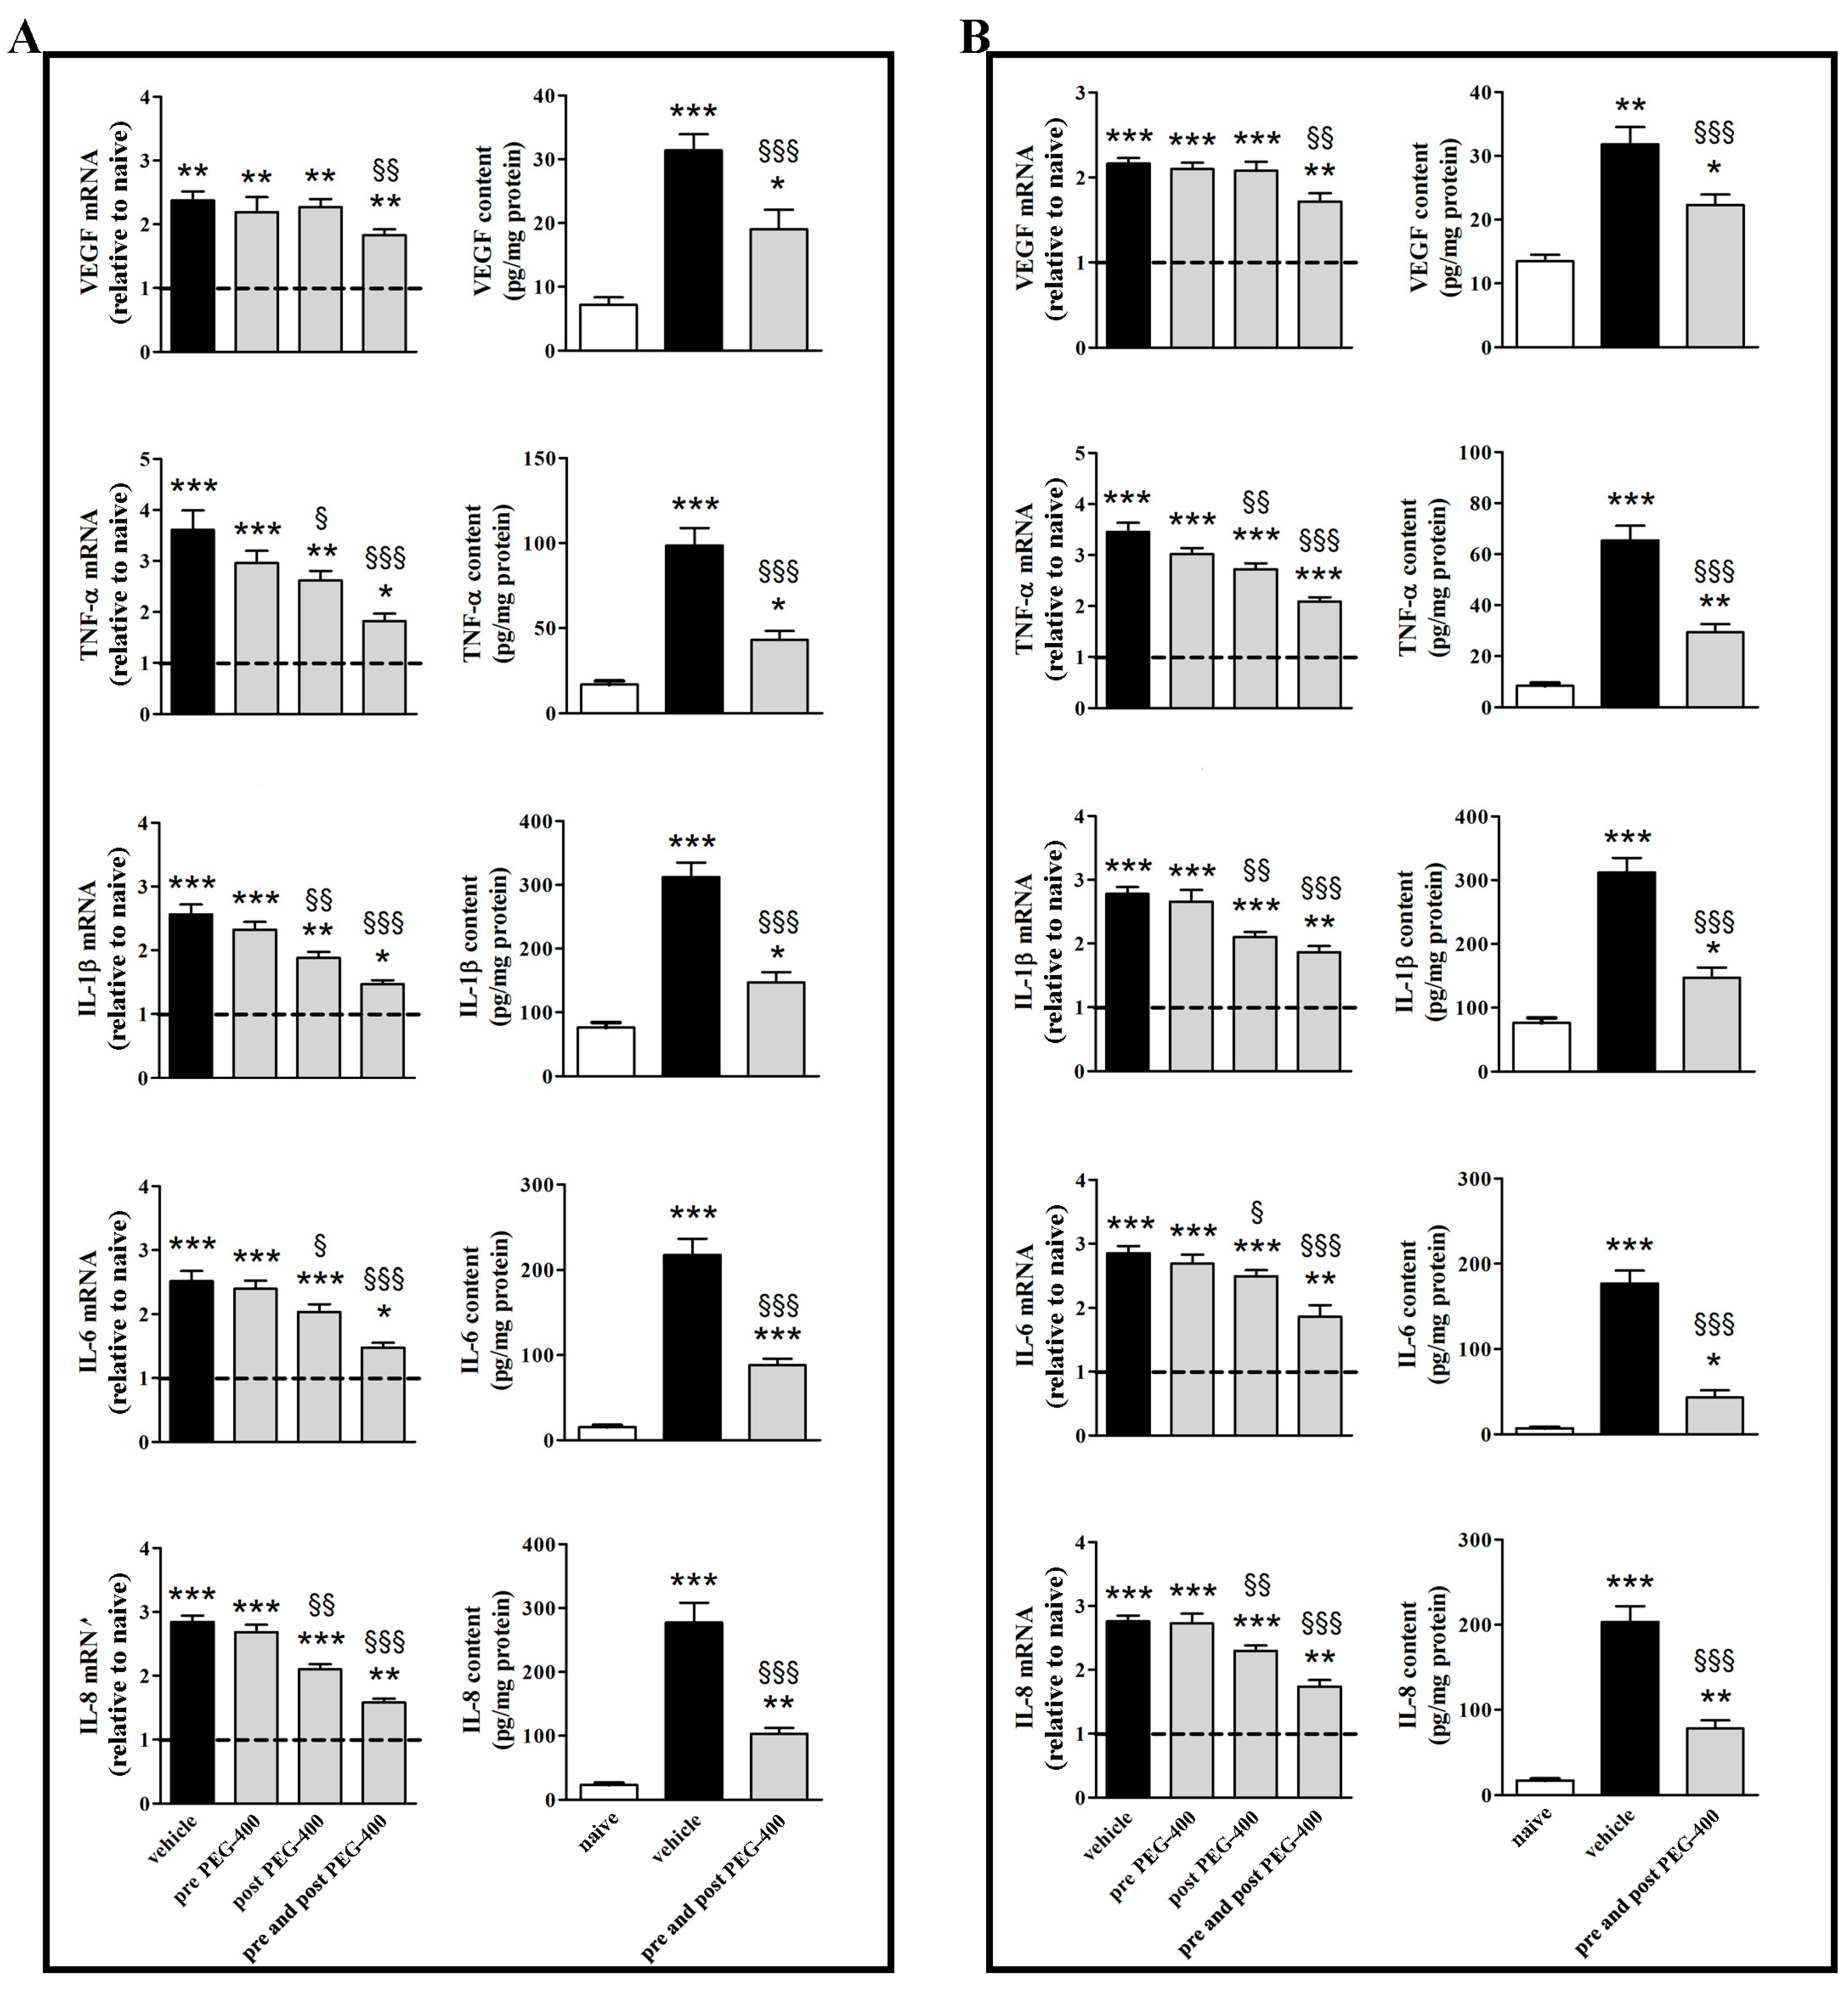
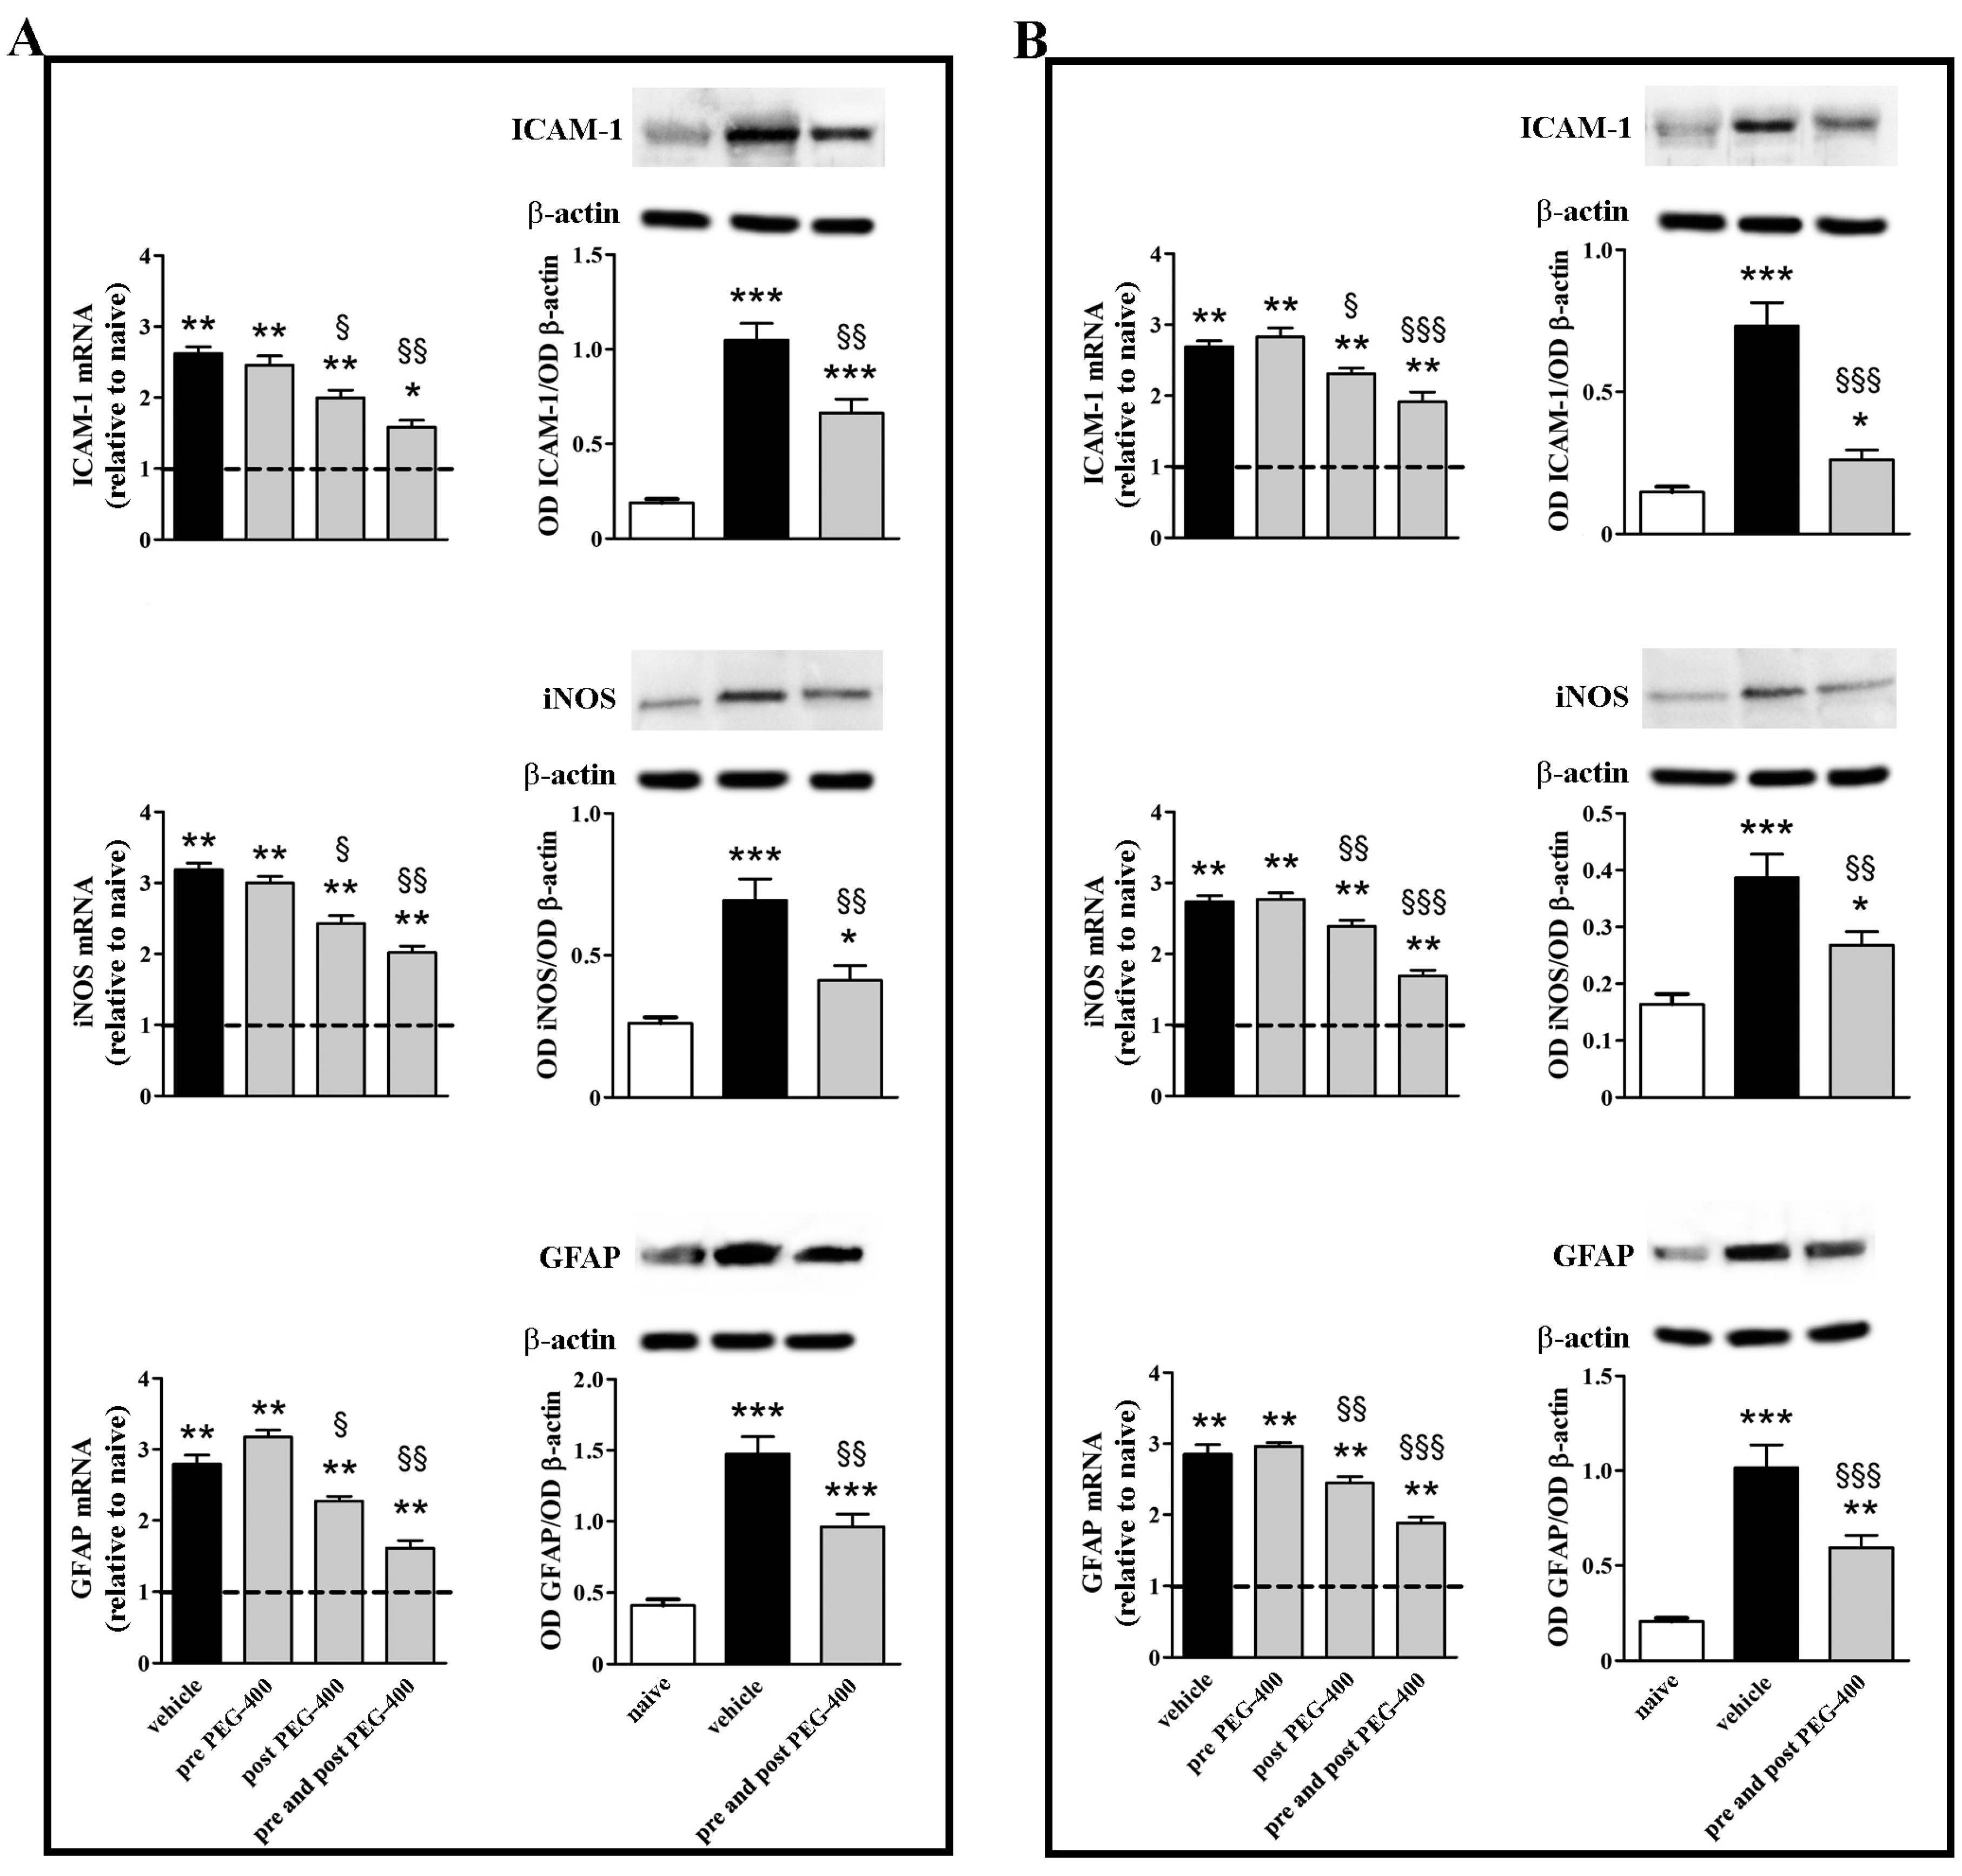
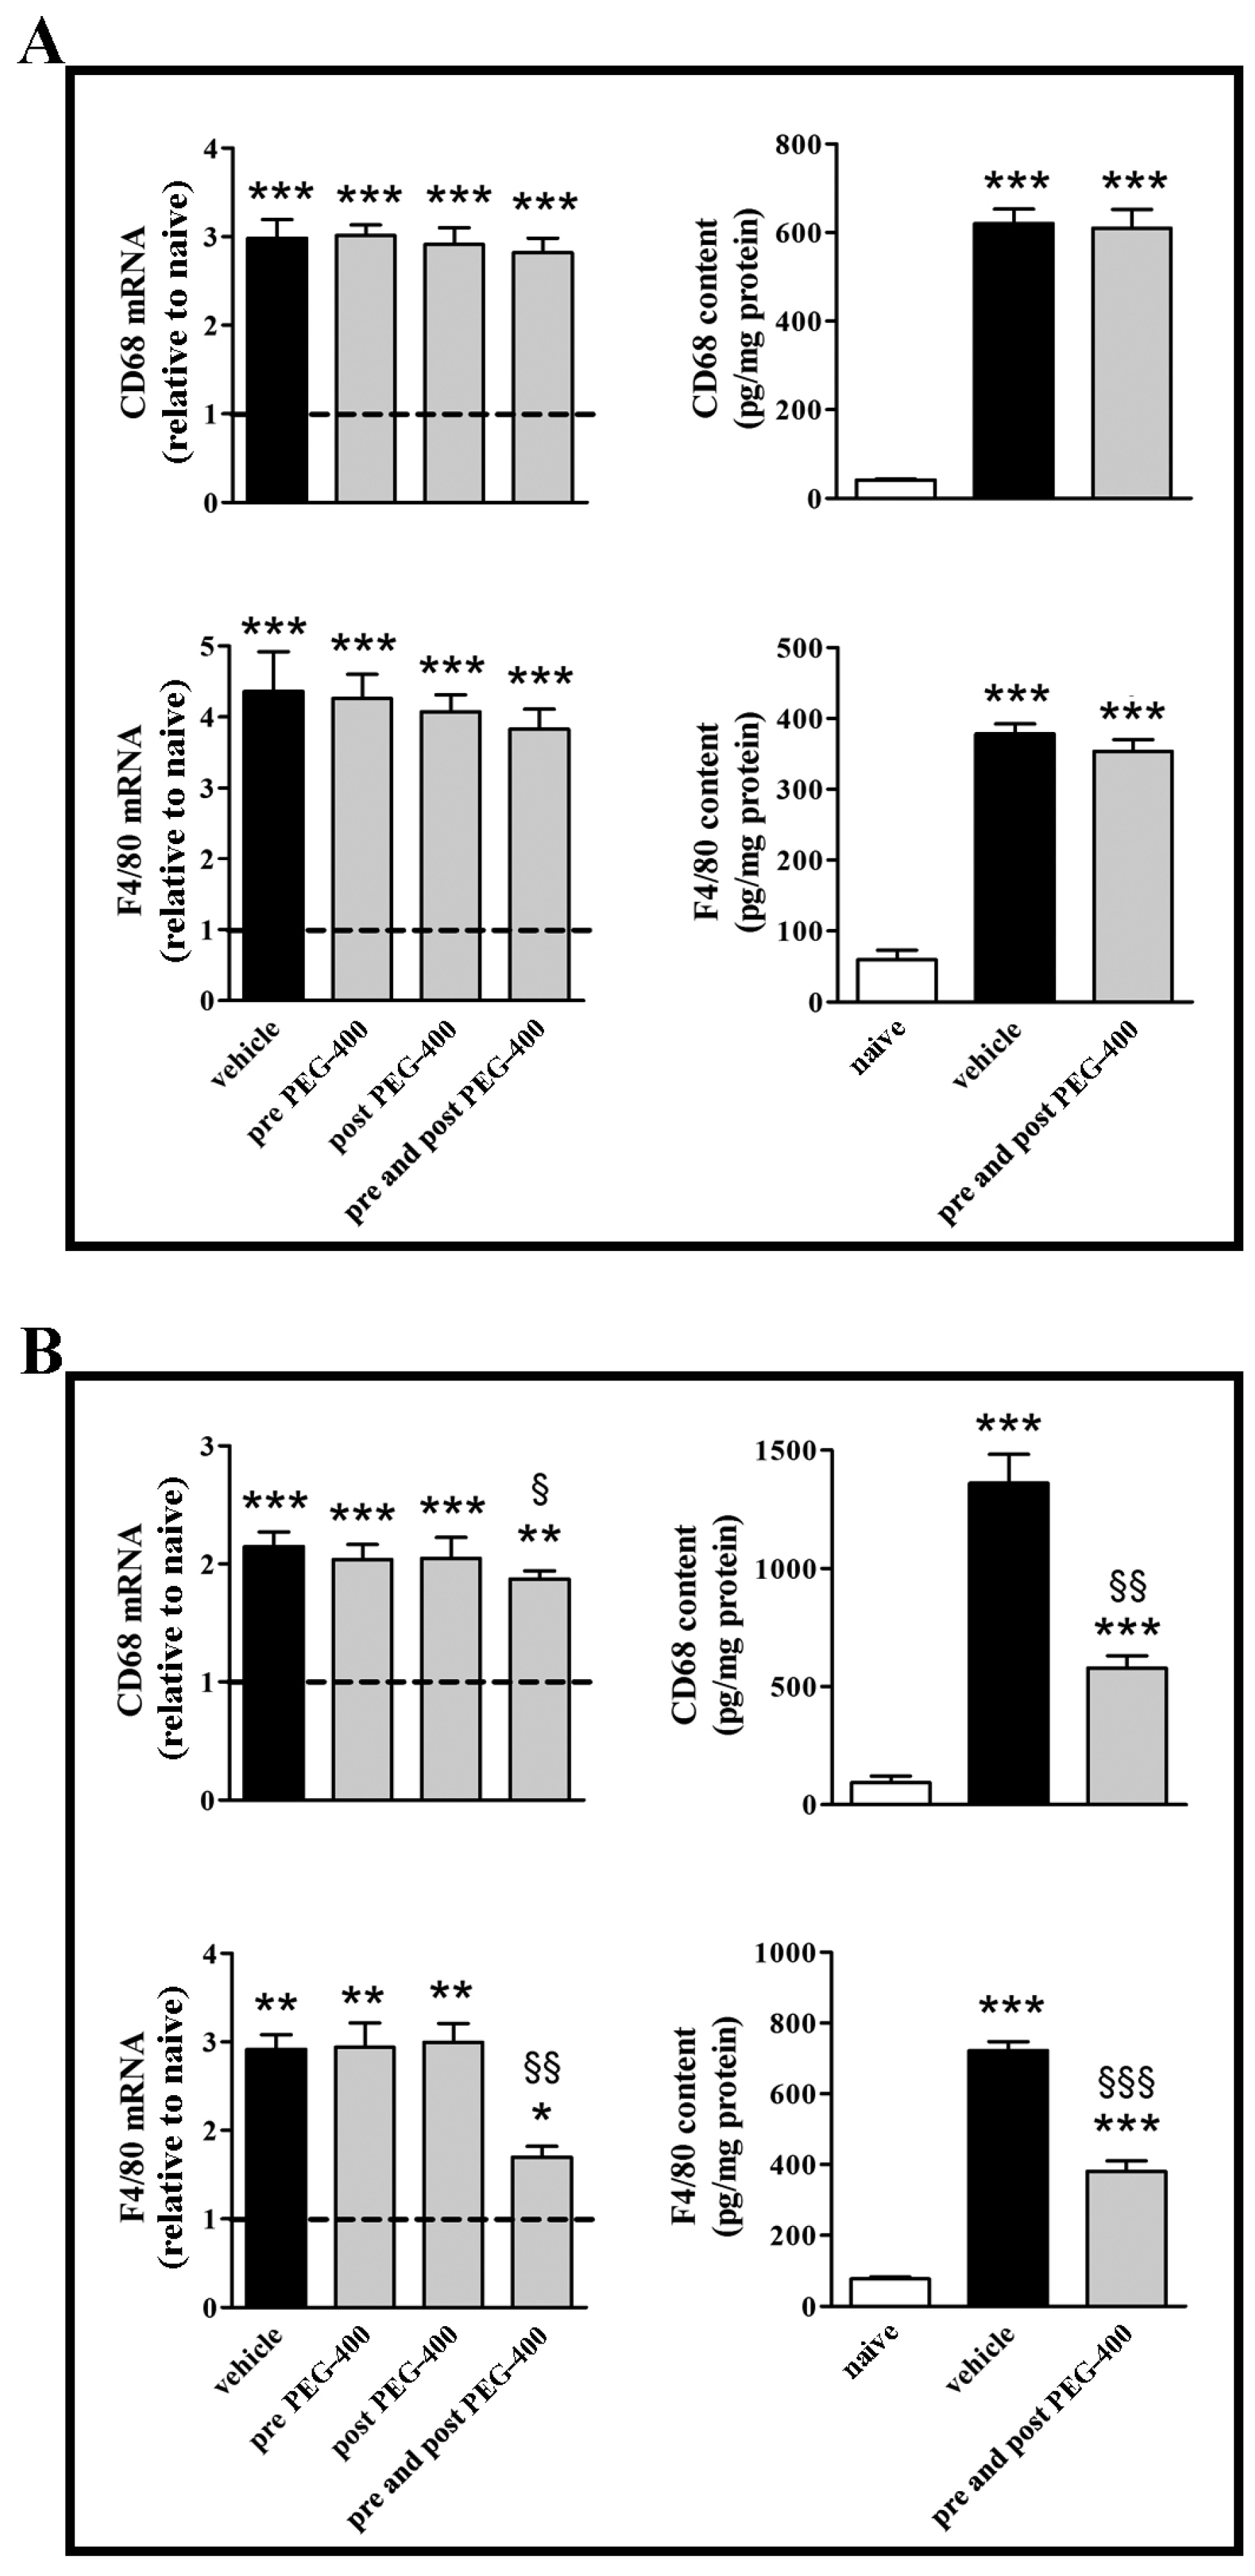
3.2. Effects of Dietary Supplementation with mFAG: Molecular and Biochemical Analysis
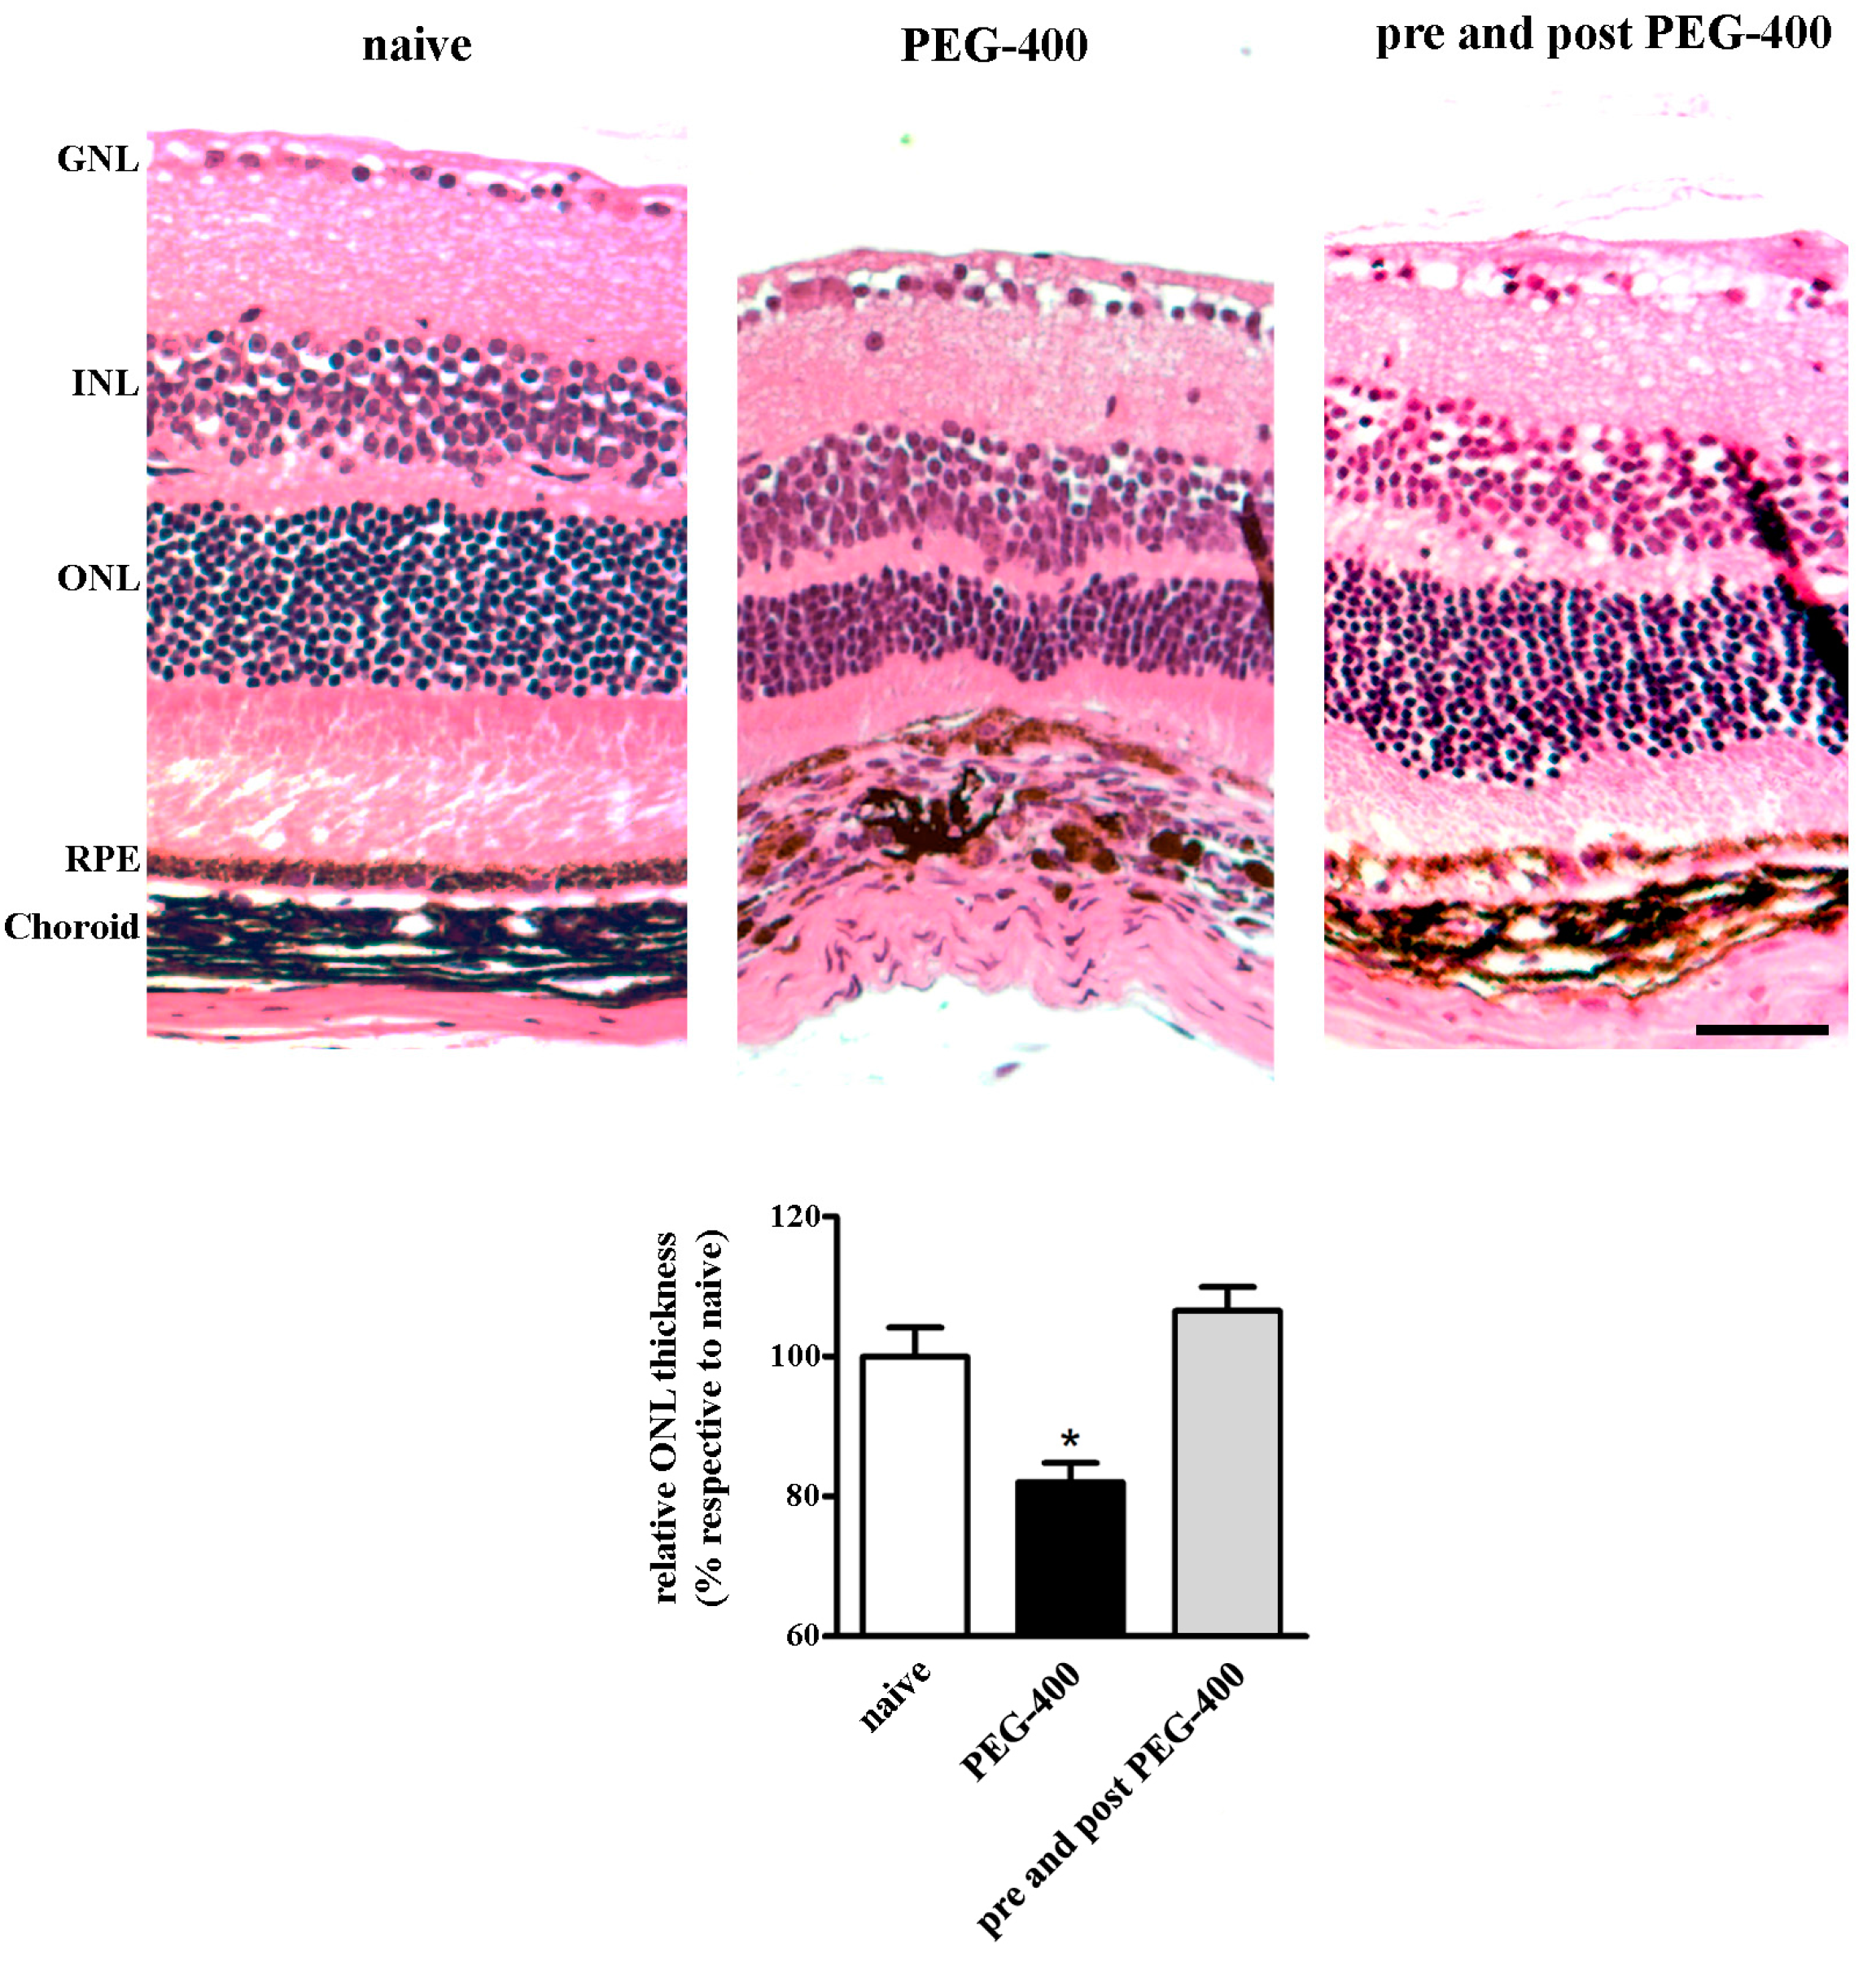
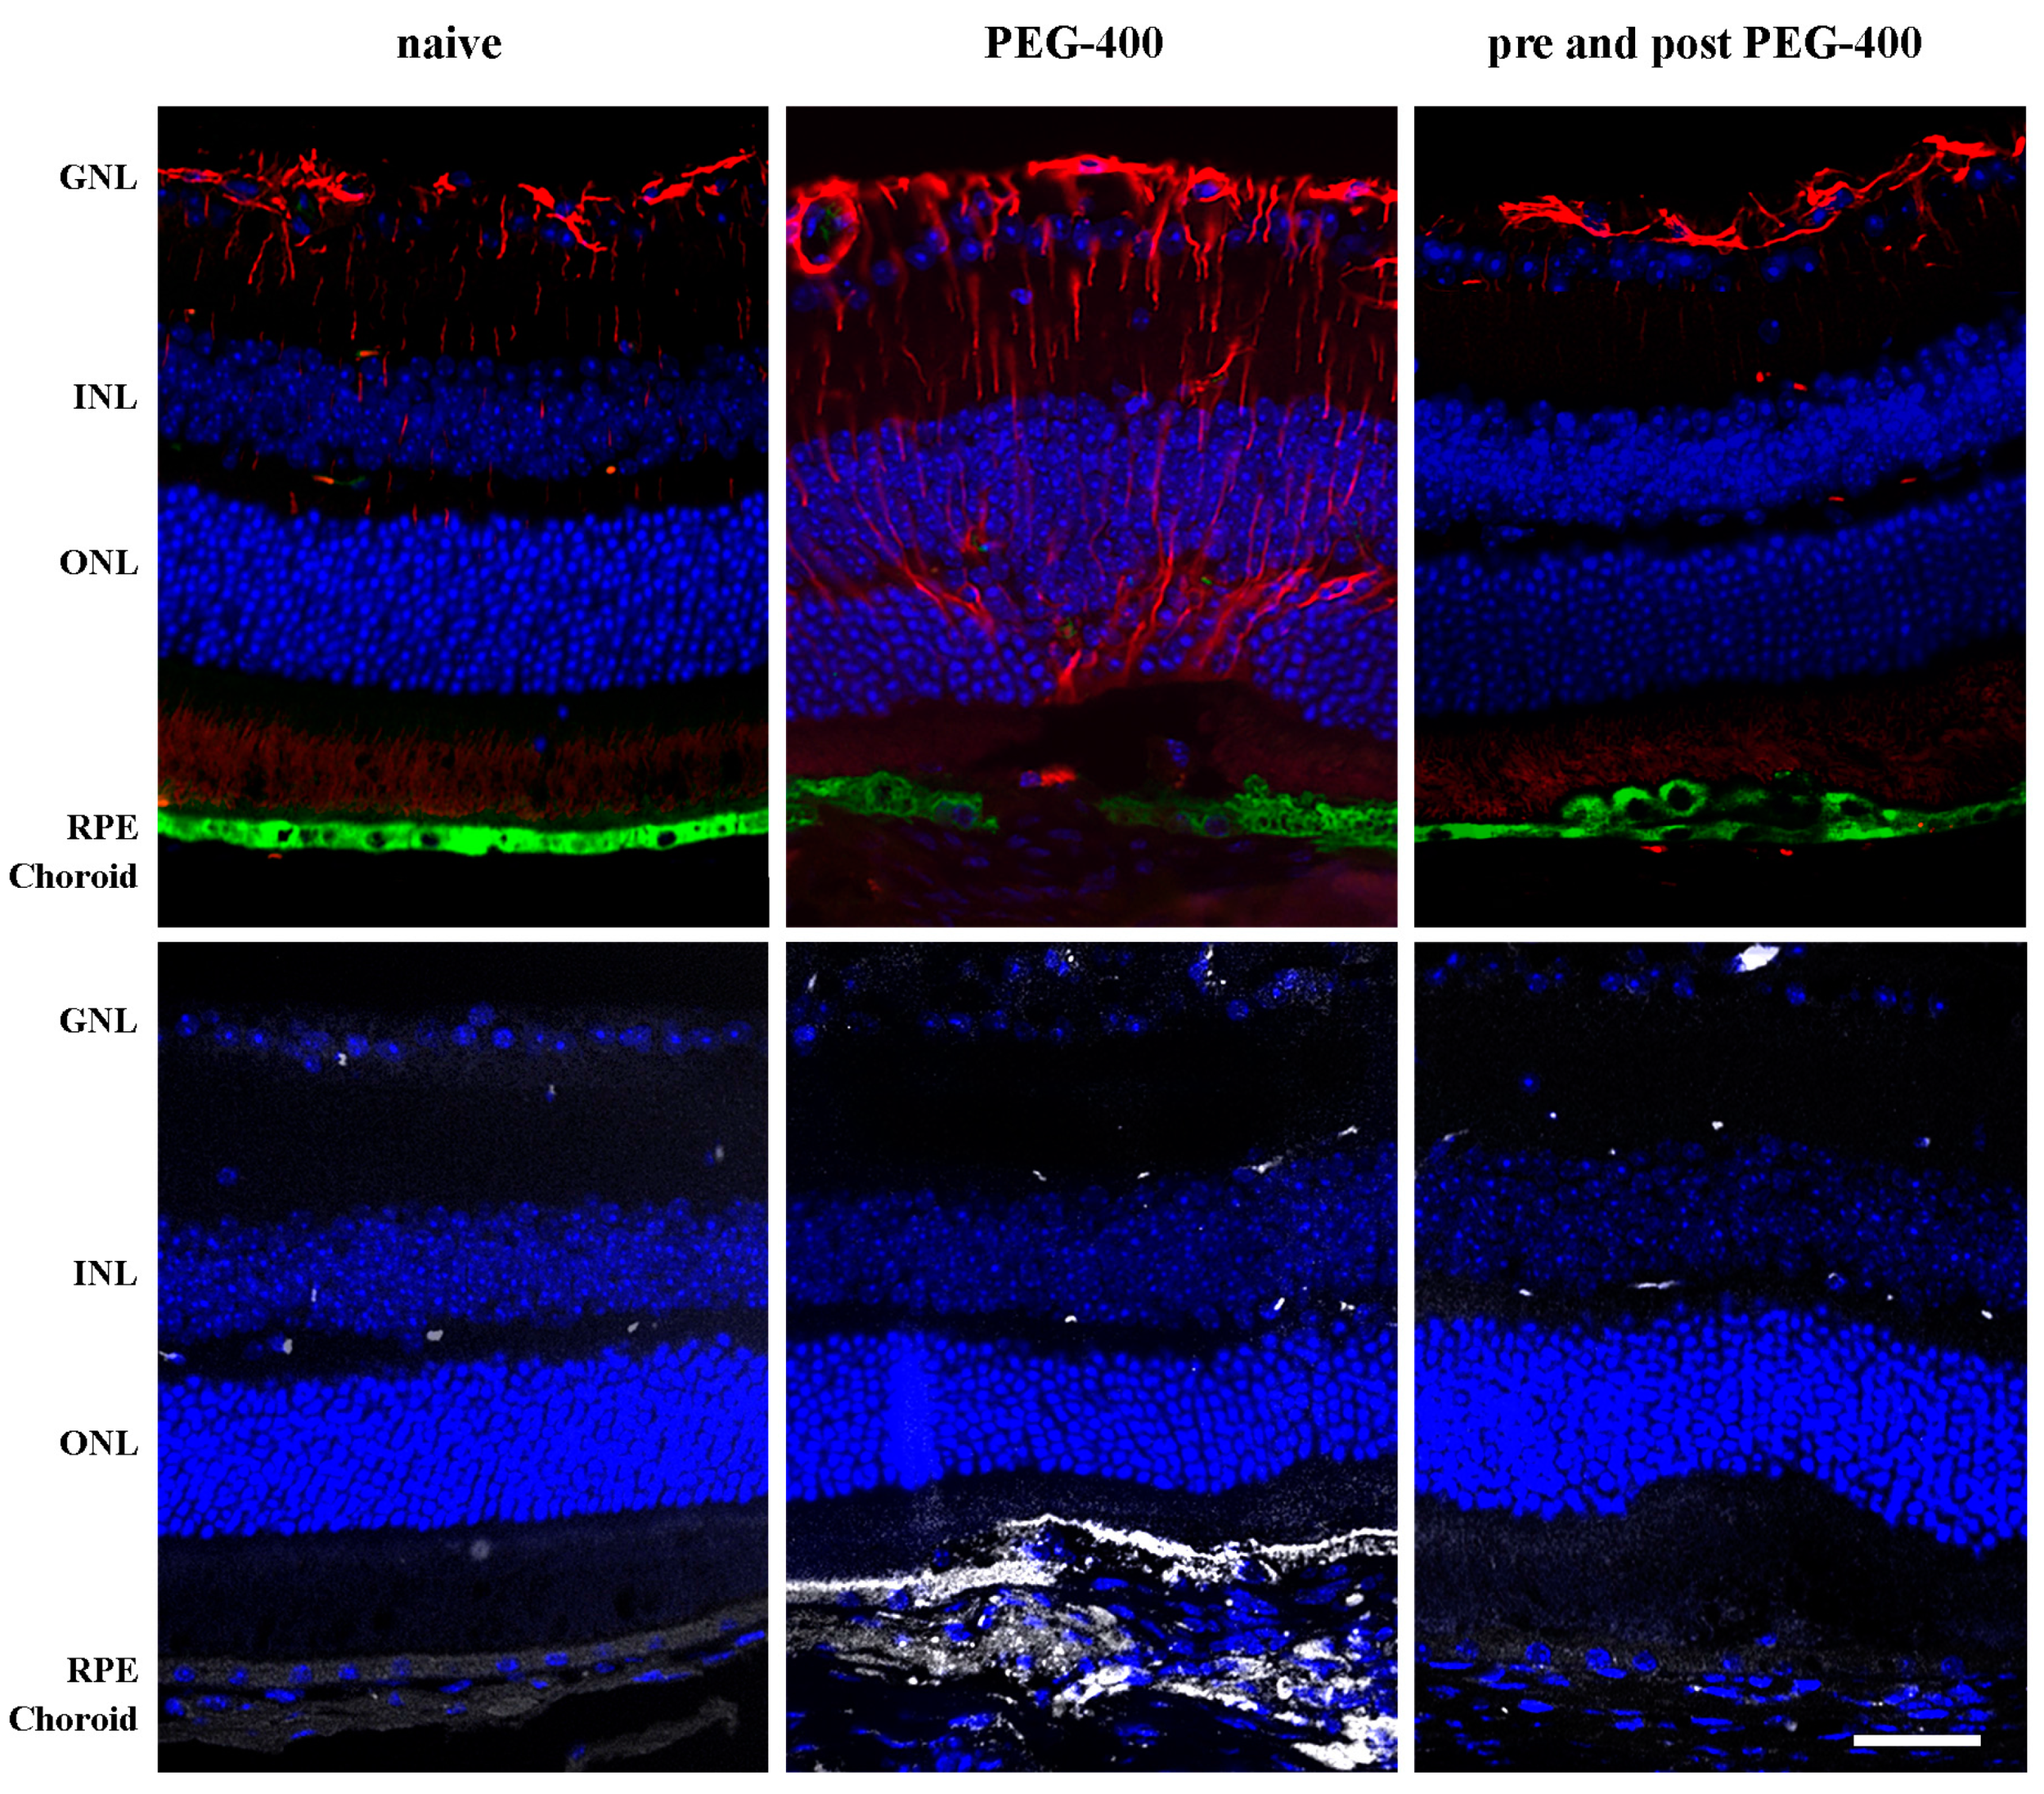
3.3. Effects of Dietary Supplementation with mFAG: Structural and Immunohistochemical Analysis
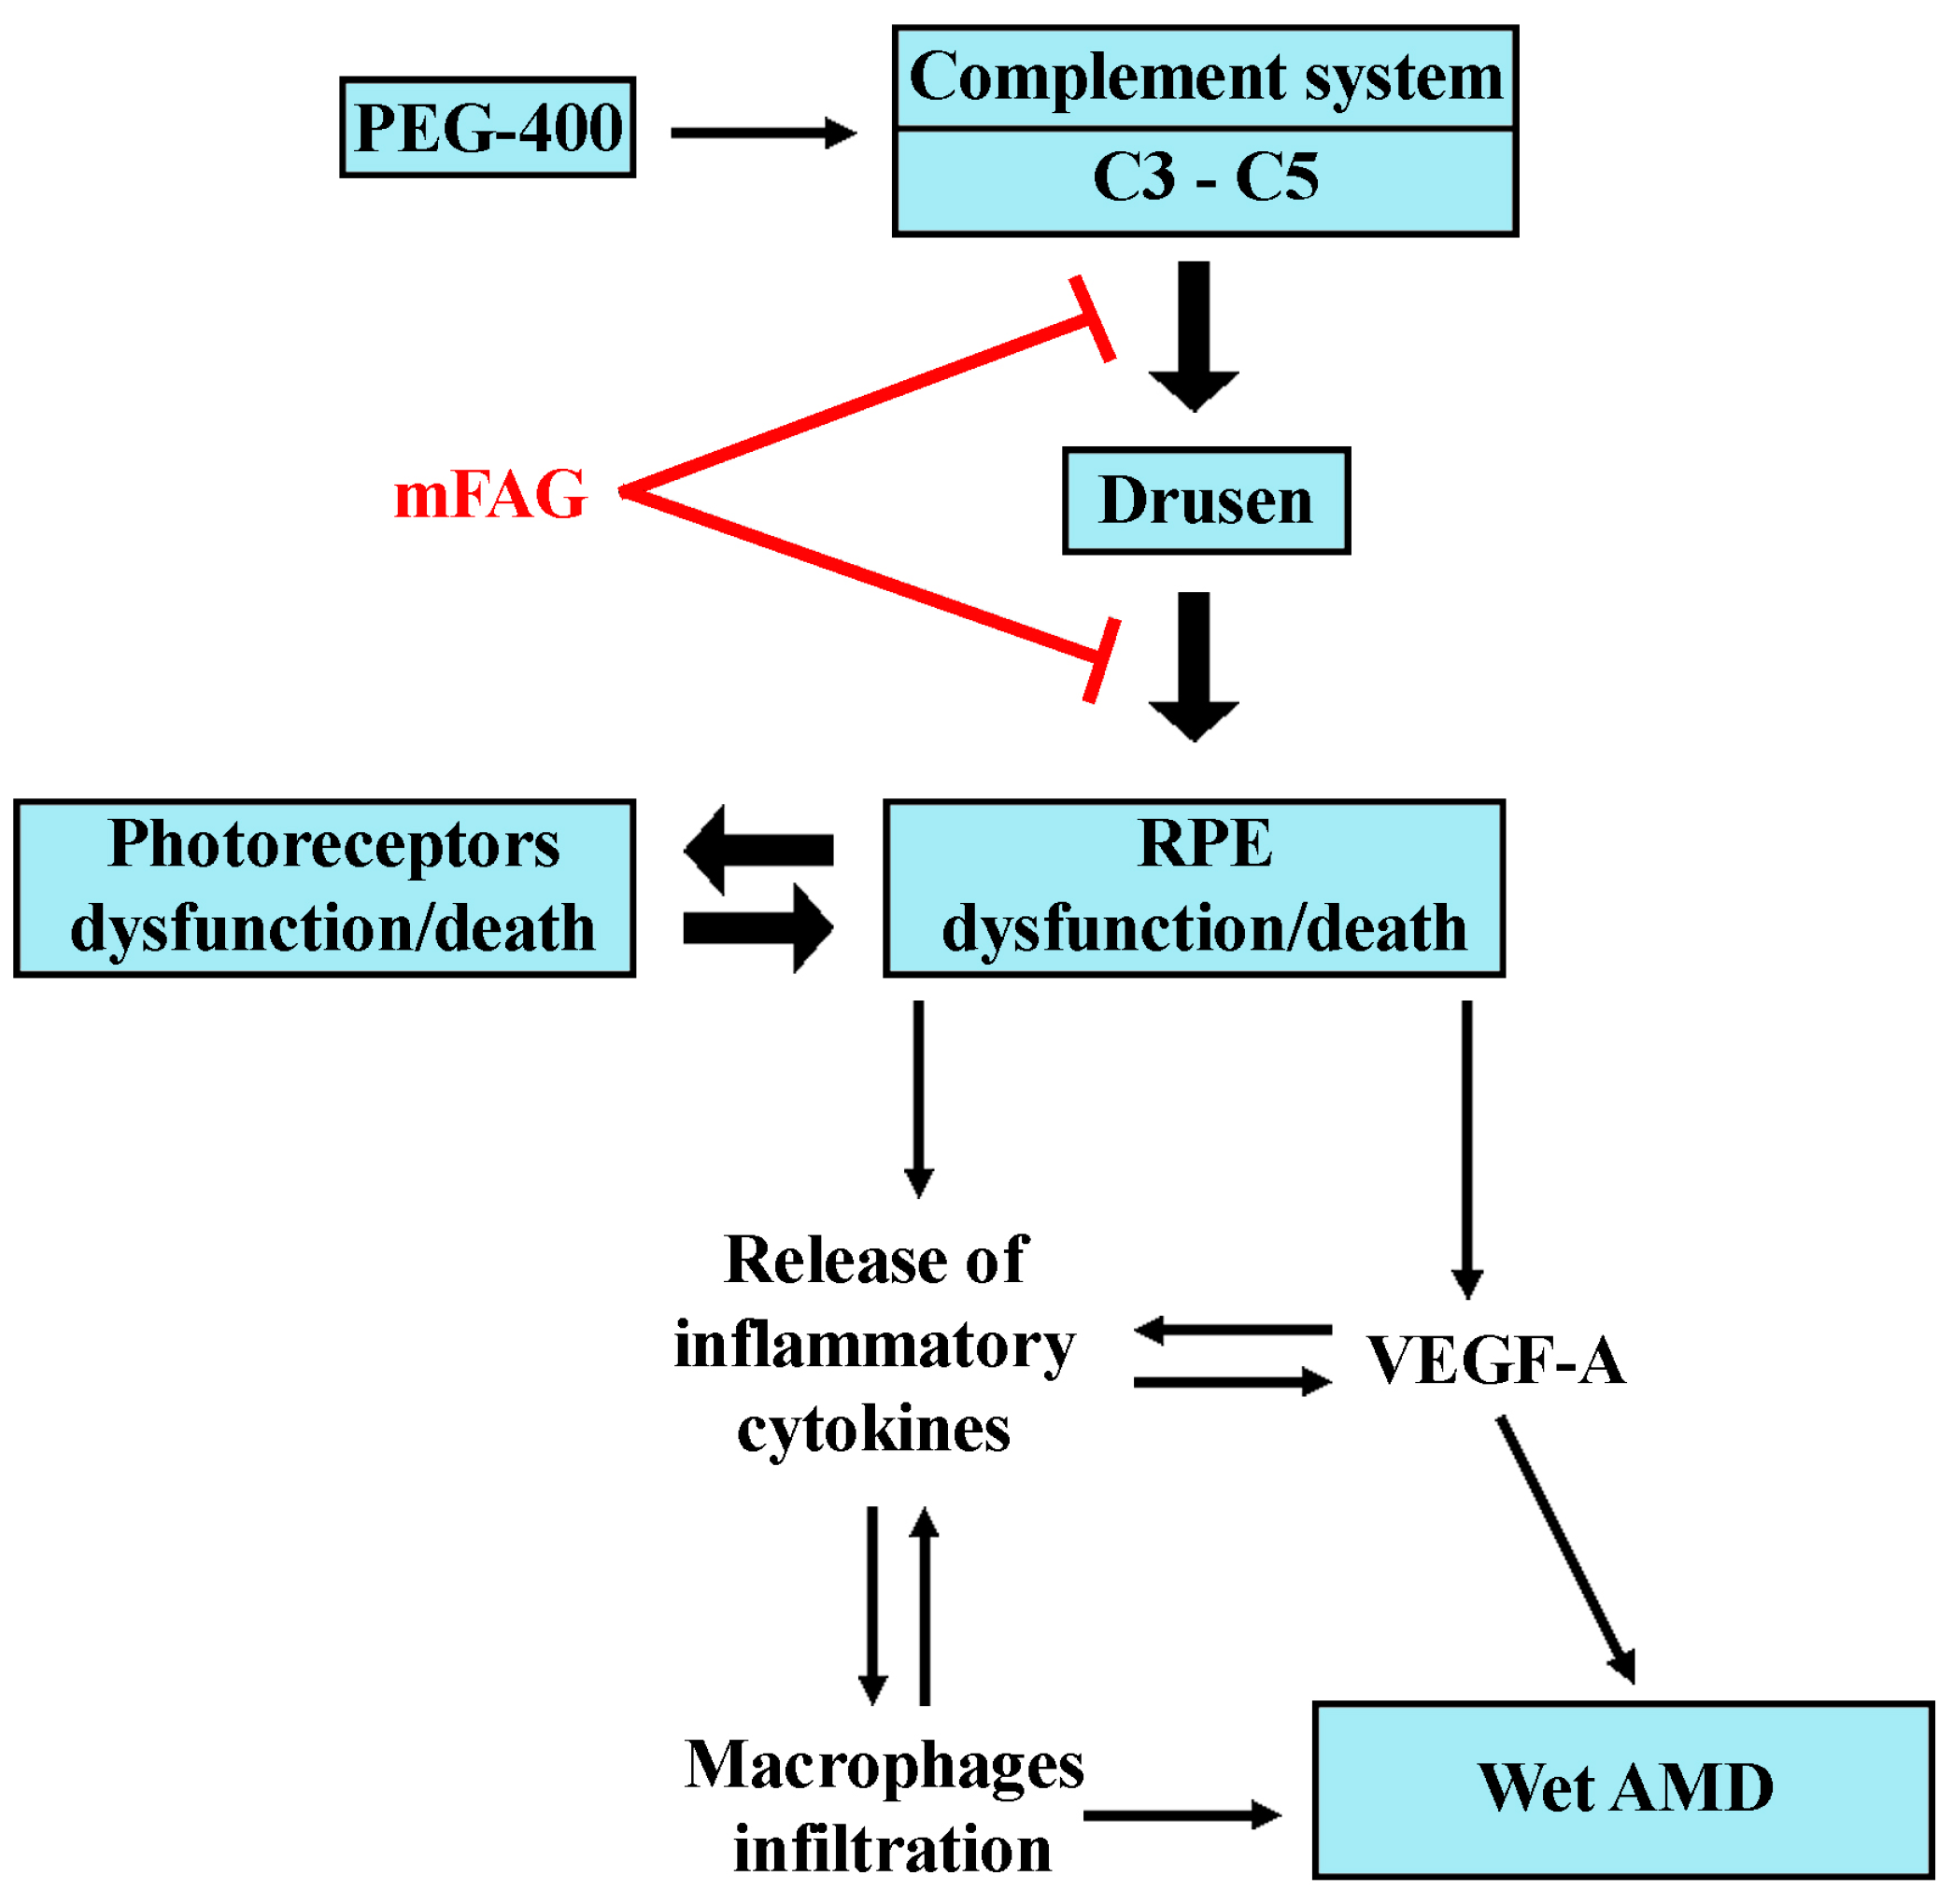
4. Discussion
5. Conclusions
Supplementary Materials
Acknowledgments
Author Contributions
Conflicts of Interest
References
- Wong, W.L.; Su, X.; Li, X.; Cheung, C.M.; Klein, R.; Cheng, C.Y.; Wong, T.Y. Global prevalence of age-related macular degeneration and disease burden projection for 2020 and 2040: A systematic review and meta-analysis. Lancet Glob. Health 2014, 2, e106–e116. [Google Scholar] [CrossRef]
- Hanus, J.; Zhao, F.; Wang, S. Current therapeutic developments in atrophic age-related macular degeneration. Br. J. Ophthalmol. 2016, 100, 122–127. [Google Scholar] [CrossRef] [PubMed]
- Ambati, J.; Fowler, B.J. Mechanisms of age-related macular degeneration. Neuron 2012, 75, 26–39. [Google Scholar] [CrossRef] [PubMed]
- Ding, X.; Patel, M.; Chan, C.C. Molecular pathology of age-related macular degeneration. Prog. Retin. Eye Res. 2009, 28, 1–18. [Google Scholar] [CrossRef] [PubMed]
- Holz, F.G.; Pauleikhoff, D.; Klein, R.; Bird, A.C. Pathogenesis of lesions in late age-related macular disease. Am. J. Ophthalmol. 2004, 137, 504–510. [Google Scholar] [CrossRef] [PubMed]
- Campochiaro, P.A. Molecular pathogenesis of retinal and choroidal vascular diseases. Prog. Retin. Eye Res. 2015, 49, 67–81. [Google Scholar] [CrossRef] [PubMed]
- Bandello, F.; Sacconi, R.; Querques, L.; Corbelli, E.; Cicinelli, M.V.; Querques, G. Recent advances in the management of dry age-related macular degeneration: A review. F1000Research 2017, 6, 245. [Google Scholar] [CrossRef] [PubMed]
- Age-Related Eye Disease Study 2 Research Group; Bonds, D.E.; Harringfton, M.; Worral, B.B.; Bertoni, A.G.; Eaton, C.B.; Hsia, J.; Robinson, J.; Clemons, T.E.; Fine, L.J.; et al. Lutein + zeaxanthin and omega-3 fatty acids for age-related macular degeneration: The Age-Related Eye Disease Study 2 (AREDS2) randomized clinical trial. JAMA Intern. Med. 2013, 309, 2005–2015. [Google Scholar] [CrossRef]
- Pinazo-Durán, M.D.; Gómez-Ulla, F.; Arias, L.; Araiz, J.; Casaroli-Marano, R.; Gallego-Pinazo, R.; García-Medina, J.J.; López-Gálvez, M.I.; Manzanas, L.; Salas, A.; et al. Do nutritional supplements have a role in age macular degeneration prevention? J. Ophthalmol. 2014, 2014, 901686. [Google Scholar] [CrossRef] [PubMed]
- Chong, E.W.; Kreis, A.J.; Wong, T.Y.; Simpson, J.A.; Guymer, R.H. Dietary omega-3 fatty acid and fish intake in the primary prevention of age-related macular degeneration: A systematic review and meta-analysis. Arch. Ophthalmol. 2008, 126, 826–833. [Google Scholar] [CrossRef] [PubMed]
- Souied, E.H.; Aslam, T.; Garcia-Layana, A.; Holz, F.G.; Leys, A.; Silva, R.; Delcourt, C. Omega-3 fatty acids and age-related macular degeneration. Ophthalmic Res. 2015, 55, 62–89. [Google Scholar] [CrossRef] [PubMed]
- Lyzogubov, V.V.; Tytarenko, R.G.; Liu, J.; Bora, N.S.; Bora, P.S. Polyethylene glycol (PEG)-induced mouse model of choroidal neovascularization. J. Biol. Chem. 2011, 286, 16229–16237. [Google Scholar] [CrossRef] [PubMed]
- Lyzogubov, V.V.; Bora, N.S.; Tytarenko, R.G.; Bora, P.S. Polyethylene glycol induced mouse model of retinal degeneration. Exp. Eye Res. 2014, 127, 143–152. [Google Scholar] [CrossRef] [PubMed]
- Van Lookeren Campagne, M.; Strauss, E.C.; Yaspan, B.L. Age-related macular degeneration: Complement in action. Immunobiology 2016, 221, 733–739. [Google Scholar] [CrossRef] [PubMed]
- Bohlson, S.S.; O’Conner, S.D.; Hulsebus, H.J.; Ho, M.M.; Fraser, D.A. Complement, c1q, and c1q-related molecules regulate macrophage polarization. Front. Immunol. 2014, 5, 402. [Google Scholar] [CrossRef] [PubMed]
- Behl, T.; Kotwani, A. Omega-3 fatty acids in prevention of diabetic retinopathy. J. Pharm. Pharmacol. 2017, 69, 946–954. [Google Scholar] [CrossRef] [PubMed]
- Yigit, F.; Gurel-Gurevin, E.; Isbilen-Basok, B.; Esener, O.B.; Bilal, T.; Keser, O.; Altiner, A.; Yilmazer, N.; Ikitimur-Armutak, E.I. Protective effect of Spirulina platensis against cell damage and apoptosis in hepatic tissue caused by high fat diet. Biotech. Histochem. 2016, 91, 182–194. [Google Scholar] [CrossRef] [PubMed]
- Heber, D.; Lu, Q.Y. Overview of mechanisms of action of lycopene. Exp. Biol. Med. (Maywood) 2002, 227, 920–923. [Google Scholar] [CrossRef] [PubMed]
- D’Abrosca, F.; Facchini, D. Effectiveness test: Anti-inflammatory action of the F.A.G. (Fatty Acid Groups). J. Res. Ther. 2016, 1, 3–8. [Google Scholar]
- Reagan-Shaw, S.; Nihal, M.; Ahmad, N. Dose translation from animal to human studies revisited. FASEB J. 2008, 22, 659–661. [Google Scholar] [CrossRef] [PubMed]
- Gordon, S.; Hamann, J.; Lin, H.H.; Stacey, M. F4/80 and the related adhesion-GPCRs. Eur. J. Immunol. 2011, 41, 2472–2476. [Google Scholar] [CrossRef] [PubMed]
- Lawrenson, J.G.; Grzybowski, A. Controversies in the use of nutritional supplements in ophthalmology. Curr. Pharm. Des. 2015, 21, 4667–4672. [Google Scholar] [CrossRef] [PubMed]
- Fang, I.M.; Yang, C.H.; Yang, C.M.; Chen, M.S. Comparative effects of fatty acids on proinflammatory gene cyclooxygenase 2 and inducible nitric oxide synthase expression in retinal pigment epithelial cells. Mol. Nutr. Food Res. 2009, 53, 739–750. [Google Scholar] [CrossRef] [PubMed]
- Seddon, J.M.; Cote, J.; Rosner, B. Progression of age-related macular degeneration: Association with dietary fat, transunsaturated fat, nuts, and fish intake. Arch. Ophthalmol. 2003, 121, 1728–1737. [Google Scholar] [CrossRef] [PubMed]
- Seddon, J.M.; George, S.; Rosner, B. Cigarette smoking, fish consumption, omega-3 fatty acid intake, and associations with age-related macular degeneration: The US twin study of age-related macular degeneration. Arch. Ophthalmol. 2006, 124, 995–1001. [Google Scholar] [CrossRef] [PubMed]
- Simopoulos, A.P. The importance of the ratio of omega-6/omega-3 essential fatty acids. Biomed. Pharmacother. 2002, 56, 365–379. [Google Scholar] [CrossRef]
- Yang, P.M.; Wu, Z.Z.; Zhang, Y.Q.; Wung, B.S. Lycopene inhibits ICAM-1 expression and NF-κB activation by Nrf2-regulated cell redox state in human retinal pigment epithelial cells. Life Sci. 2016, 155, 94–101. [Google Scholar] [CrossRef] [PubMed]
- Jia, Y.P.; Sun, L.; Yu, H.S.; Liang, L.P.; Li, W.; Ding, H.; Song, X.B.; Zhang, L.J. The pharmacological effects of Lutein and Zeaxanthin on visual disorders and cognition diseases. Molecules 2017, 22, 610. [Google Scholar] [CrossRef] [PubMed]
- Anderson, D.H.; Radeke, M.J.; Gallo, N.B.; Chapin, E.A.; Johnson, P.T.; Curletti, C.R.; Hancox, L.S.; Hu, J.; Ebright, J.N.; Malek, G.; et al. The pivotal role of the complement system in aging and age-related macular degeneration: Hypothesis re-visited. Prog. Retin. Eye Res. 2010, 29, 95–112. [Google Scholar] [CrossRef] [PubMed]
- Sim, R.B.; Tsiftsoglou, S.A. Proteases of the complement system. Biochem. Soc. Trans. 2004, 32, 21–27. [Google Scholar] [CrossRef] [PubMed]
- Kijlstra, A.; Berendschot, T.T. Age-related macular degeneration: A complementopathy? Ophthalmic Res. 2015, 54, 64–73. [Google Scholar] [CrossRef] [PubMed]
- Hollyfield, J.G.; Perez, V.L.; Salomon, R.G. A hapten generated from an oxidation fragment of docosahexaenoic acid is sufficient to initiate age-related macular degeneration. Mol. Neurobiol. 2010, 41, 290–298. [Google Scholar] [CrossRef] [PubMed]
- Yamamoto, H.; Fara, A.F.; Dasgupta, P.; Kemper, C. CD46: The ‘multitasker’ of complement proteins. Int. J. Biochem. Cell. Biol. 2013, 45, 2808–2820. [Google Scholar] [CrossRef] [PubMed]
- Lyzogubov, V.V.; Bora, P.S.; Wu, X.; Horn, L.E.; de Roque, R.; Rudolf, X.V.; Atkinson, J.P.; Bora, N.S. The complement regulatory protein CD46 deficient mouse spontaneously develops dry-type age-related macular degeneration-like phenotype. Am. J. Pathol. 2016, 186, 2088–2104. [Google Scholar] [CrossRef] [PubMed]
- Tonari, M.; Kurimoto, T.; Horie, T.; Sugiyama, T.; Ikeda, T.; Oku, H. Blocking endothelin-B receptors rescues retinal ganglion cells from optic nerve injury through suppression of neuroinflammation. Investig. Ophthalmol. Vis. Sci. 2012, 53, 3490–3500. [Google Scholar] [CrossRef] [PubMed]
- Yoshikawa, N.; Noda, K.; Ozawa, Y.; Tsubota, K.; Mashima, Y.; Ishida, S. Blockade of vascular adhesion protein-1 attenuates choroidal neovascularization. Mol. Vis. 2012, 18, 593–600. [Google Scholar] [PubMed]
- Kunchithapautham, K.; Rohrer, B. Sublytic membrane-attack-complex (MAC) activation alters regulated rather than constitutive vascular endothelial growth factor (VEGF) secretion in retinal pigment epithelium monolayers. J. Biol. Chem. 2011, 286, 23717–23724. [Google Scholar] [CrossRef] [PubMed]
- Sorrentino, F.S.; Allkabes, M.; Salsini, G.; Bonifazzi, C.; Perri, P. The importance of glial cells in the homeostasis of the retinal microenvironment and their pivotal role in the course of diabetic retinopathy. Life Sci. 2016, 162, 54–59. [Google Scholar] [CrossRef] [PubMed]
- Al-Gayyar, M.M.; Elsherbiny, N.M. Contribution of TNF-α to the development of retinal neurodegenerative disorders. Eur. Cytokine Netw. 2013, 24, 27–36. [Google Scholar] [CrossRef] [PubMed]
- Nelson, C.M.; Ackerman, K.M.; O’Hayer, P.; Bailey, T.J.; Gorsuch, R.A.; Hyde, D.R. Tumor necrosis factor-alpha is produced by dying retinal neurons and is required for Muller glia proliferation during zebrafish retinal regeneration. J. Neurosci. 2013, 33, 6524–6539. [Google Scholar] [CrossRef] [PubMed]
- Gao, X.; Li, Y.; Wang, H.; Li, C.; Ding, J. Inhibition of HIF-1α decreases expression of pro-inflammatory IL-6 and TNF-α in diabetic retinopathy. Acta Ophthalmol. 2016. [Google Scholar] [CrossRef] [PubMed]
- Kern, T.S. Contributions of inflammatory processes to the development of the early stages of diabetic retinopathy. Exp. Diabetes Res. 2007, 2007, 95103. [Google Scholar] [CrossRef] [PubMed]
- Powers, M.R.; Davies, M.H.; Eubanks, J.P. Increased expression of chemokine KC, an interleukin-8 homologue, in a model of oxygen-induced retinopathy. Curr. Eye Res. 2005, 30, 299–307. [Google Scholar] [CrossRef] [PubMed]
- Yoshida, S.; Yoshida, A.; Ishibashi, T. Induction of IL-8, MCP-1, and bFGF by TNF-alpha in retinal glial cells: Implications for retinal neovascularization during post-ischemic inflammation. Graefes Arch. Clin. Exp. Ophthalmol. 2004, 242, 409–413. [Google Scholar] [CrossRef] [PubMed]
- Leal, E.C.; Manivannan, A.; Hosoya, K.; Terasaki, T.; Cunha-Vaz, J.; Ambrósio, A.F.; Forrester, J.V. Inducible nitric oxide synthase isoform is a key mediator of leukostasis and blood-retinal barrier breakdown in diabetic retinopathy. Investig. Ophthalmol. Vis. Sci. 2007, 48, 5257–5265. [Google Scholar] [CrossRef] [PubMed]
- Ricklin, D.; Lambris, J.D. Complement-targeted therapeutics. Nat. Biotechnol. 2007, 25, 1265–1275. [Google Scholar] [CrossRef] [PubMed]
- Cao, X.; Shen, D.; Patel, M.M.; Tuo, J.; Johnson, T.M.; Olsen, T.W.; Chan, C.C. Macrophage polarization in the maculae of age-related macular degeneration: A pilot study. Pathol. Int. 2011, 61, 528–535. [Google Scholar] [CrossRef] [PubMed]
- Whitmore, S.S.; Sohn, E.H.; Chirco, K.R.; Drack, A.V.; Stone, E.M.; Tucker, B.A.; Mullins, R.F. Complement activation and choriocapillaris loss in early AMD: Implications for pathophysiology and therapy. Prog. Retin. Eye Res. 2015, 45, 1–29. [Google Scholar] [CrossRef] [PubMed]
- Bora, P.S.; Sohn, J.H.; Cruz, J.M.; Jha, P.; Nishihori, H.; Wang, Y.; Kaliappan, S.; Kaplan, H.J.; Bora, N.S. Role of complement and complement membrane attack complex in laser-induced choroidal neovascularization. J. Immunol. 2005, 174, 491–497. [Google Scholar] [CrossRef] [PubMed]
- Das, U.N. Diabetic macular edema, retinopathy and age-related macular degeneration as inflammatory conditions. Arch. Med. Sci. 2016, 12, 1142–1157. [Google Scholar] [CrossRef] [PubMed]
- Fu, Z.; Lofqvist, C.A.; Shao, Z.; Sun, Y.; Joyal, J.S.; Hurst, C.G.; Cui, R.Z.; Evans, L.P.; Tian, K.; SanGiovanni, J.P.; et al. Dietary ω-3 polyunsaturated fatty acids decrease retinal neovascularization by adipose-endoplasmic reticulum stress reduction to increase adiponectin. Am. J. Clin. Nutr. 2015, 101, 879–888. [Google Scholar] [CrossRef] [PubMed]
- Wu, A.; Ying, Z.; Gomez-Pinilla, F. Dietary omega-3 fatty acids normalize BDNF levels, reduce oxidative damage, and counteract learning disability after traumatic brain injury in rats. J. Neurotrauma 2004, 21, 1457–1467. [Google Scholar] [CrossRef] [PubMed]
- Apte, R.S. Targeting tissue lipids in age-related macular degeneration. EBioMedicine 2016, 5, 26–27. [Google Scholar] [CrossRef] [PubMed]
- Maguire, M.G.; Ying, G.S.; McCannel, C.A.; Liu, C.; Dai, Y. Complications of Age-related Macular Degeneration Prevention Trial (CAPT) Research Group. Statin use and the incidence of advanced age-related macular degeneration in the complications of age-related macular degeneration prevention trial. Ophthalmology 2009, 116, 2381–2385. [Google Scholar] [CrossRef] [PubMed]
- Cousins, S.W.; Espinosa-Heidmann, D.G.; Alexandridou, A.; Sall, J.; Dubovy, S.; Csaky, K. The role of aging, high fat diet and blue light exposure in an experimental mouse model for basal laminar deposit formation. Exp. Eye Res. 2002, 75, 543–553. [Google Scholar] [CrossRef] [PubMed]
- Dithmar, S.; Sharara, N.A.; Curcio, C.A.; Le, N.A.; Zhang, Y.; Brown, S.; Grossniklaus, H.E. Murine high-fat diet and laser photochemical model of basal deposits in Bruch membrane. Arch. Ophthalmol. 2001, 119, 1643–1649. [Google Scholar] [CrossRef] [PubMed]


© 2017 by the authors. Licensee MDPI, Basel, Switzerland. This article is an open access article distributed under the terms and conditions of the Creative Commons Attribution (CC BY) license (http://creativecommons.org/licenses/by/4.0/).
Share and Cite
Cammalleri, M.; Dal Monte, M.; Locri, F.; Lardner, E.; Kvanta, A.; Rusciano, D.; André, H.; Bagnoli, P. Efficacy of a Fatty Acids Dietary Supplement in a Polyethylene Glycol-Induced Mouse Model of Retinal Degeneration. Nutrients 2017, 9, 1079. https://doi.org/10.3390/nu9101079
Cammalleri M, Dal Monte M, Locri F, Lardner E, Kvanta A, Rusciano D, André H, Bagnoli P. Efficacy of a Fatty Acids Dietary Supplement in a Polyethylene Glycol-Induced Mouse Model of Retinal Degeneration. Nutrients. 2017; 9(10):1079. https://doi.org/10.3390/nu9101079
Chicago/Turabian StyleCammalleri, Maurizio, Massimo Dal Monte, Filippo Locri, Emma Lardner, Anders Kvanta, Dario Rusciano, Helder André, and Paola Bagnoli. 2017. "Efficacy of a Fatty Acids Dietary Supplement in a Polyethylene Glycol-Induced Mouse Model of Retinal Degeneration" Nutrients 9, no. 10: 1079. https://doi.org/10.3390/nu9101079