Socioeconomic Inequities in Diet Quality and Nutrient Intakes among Australian Adults: Findings from a Nationally Representative Cross-Sectional Study

 , , ,
, , ,
Abstract
:1. Introduction
2. Materials and Methods
2.1. Study Design and Participants
2.2. Area-Level Disadvantage
2.3. Education Level
2.4. Household Income
2.5. Dietary Intake
2.6. Dietary Guideline Index
2.7. Covariates
2.8. Statistical Analyses
3. Results
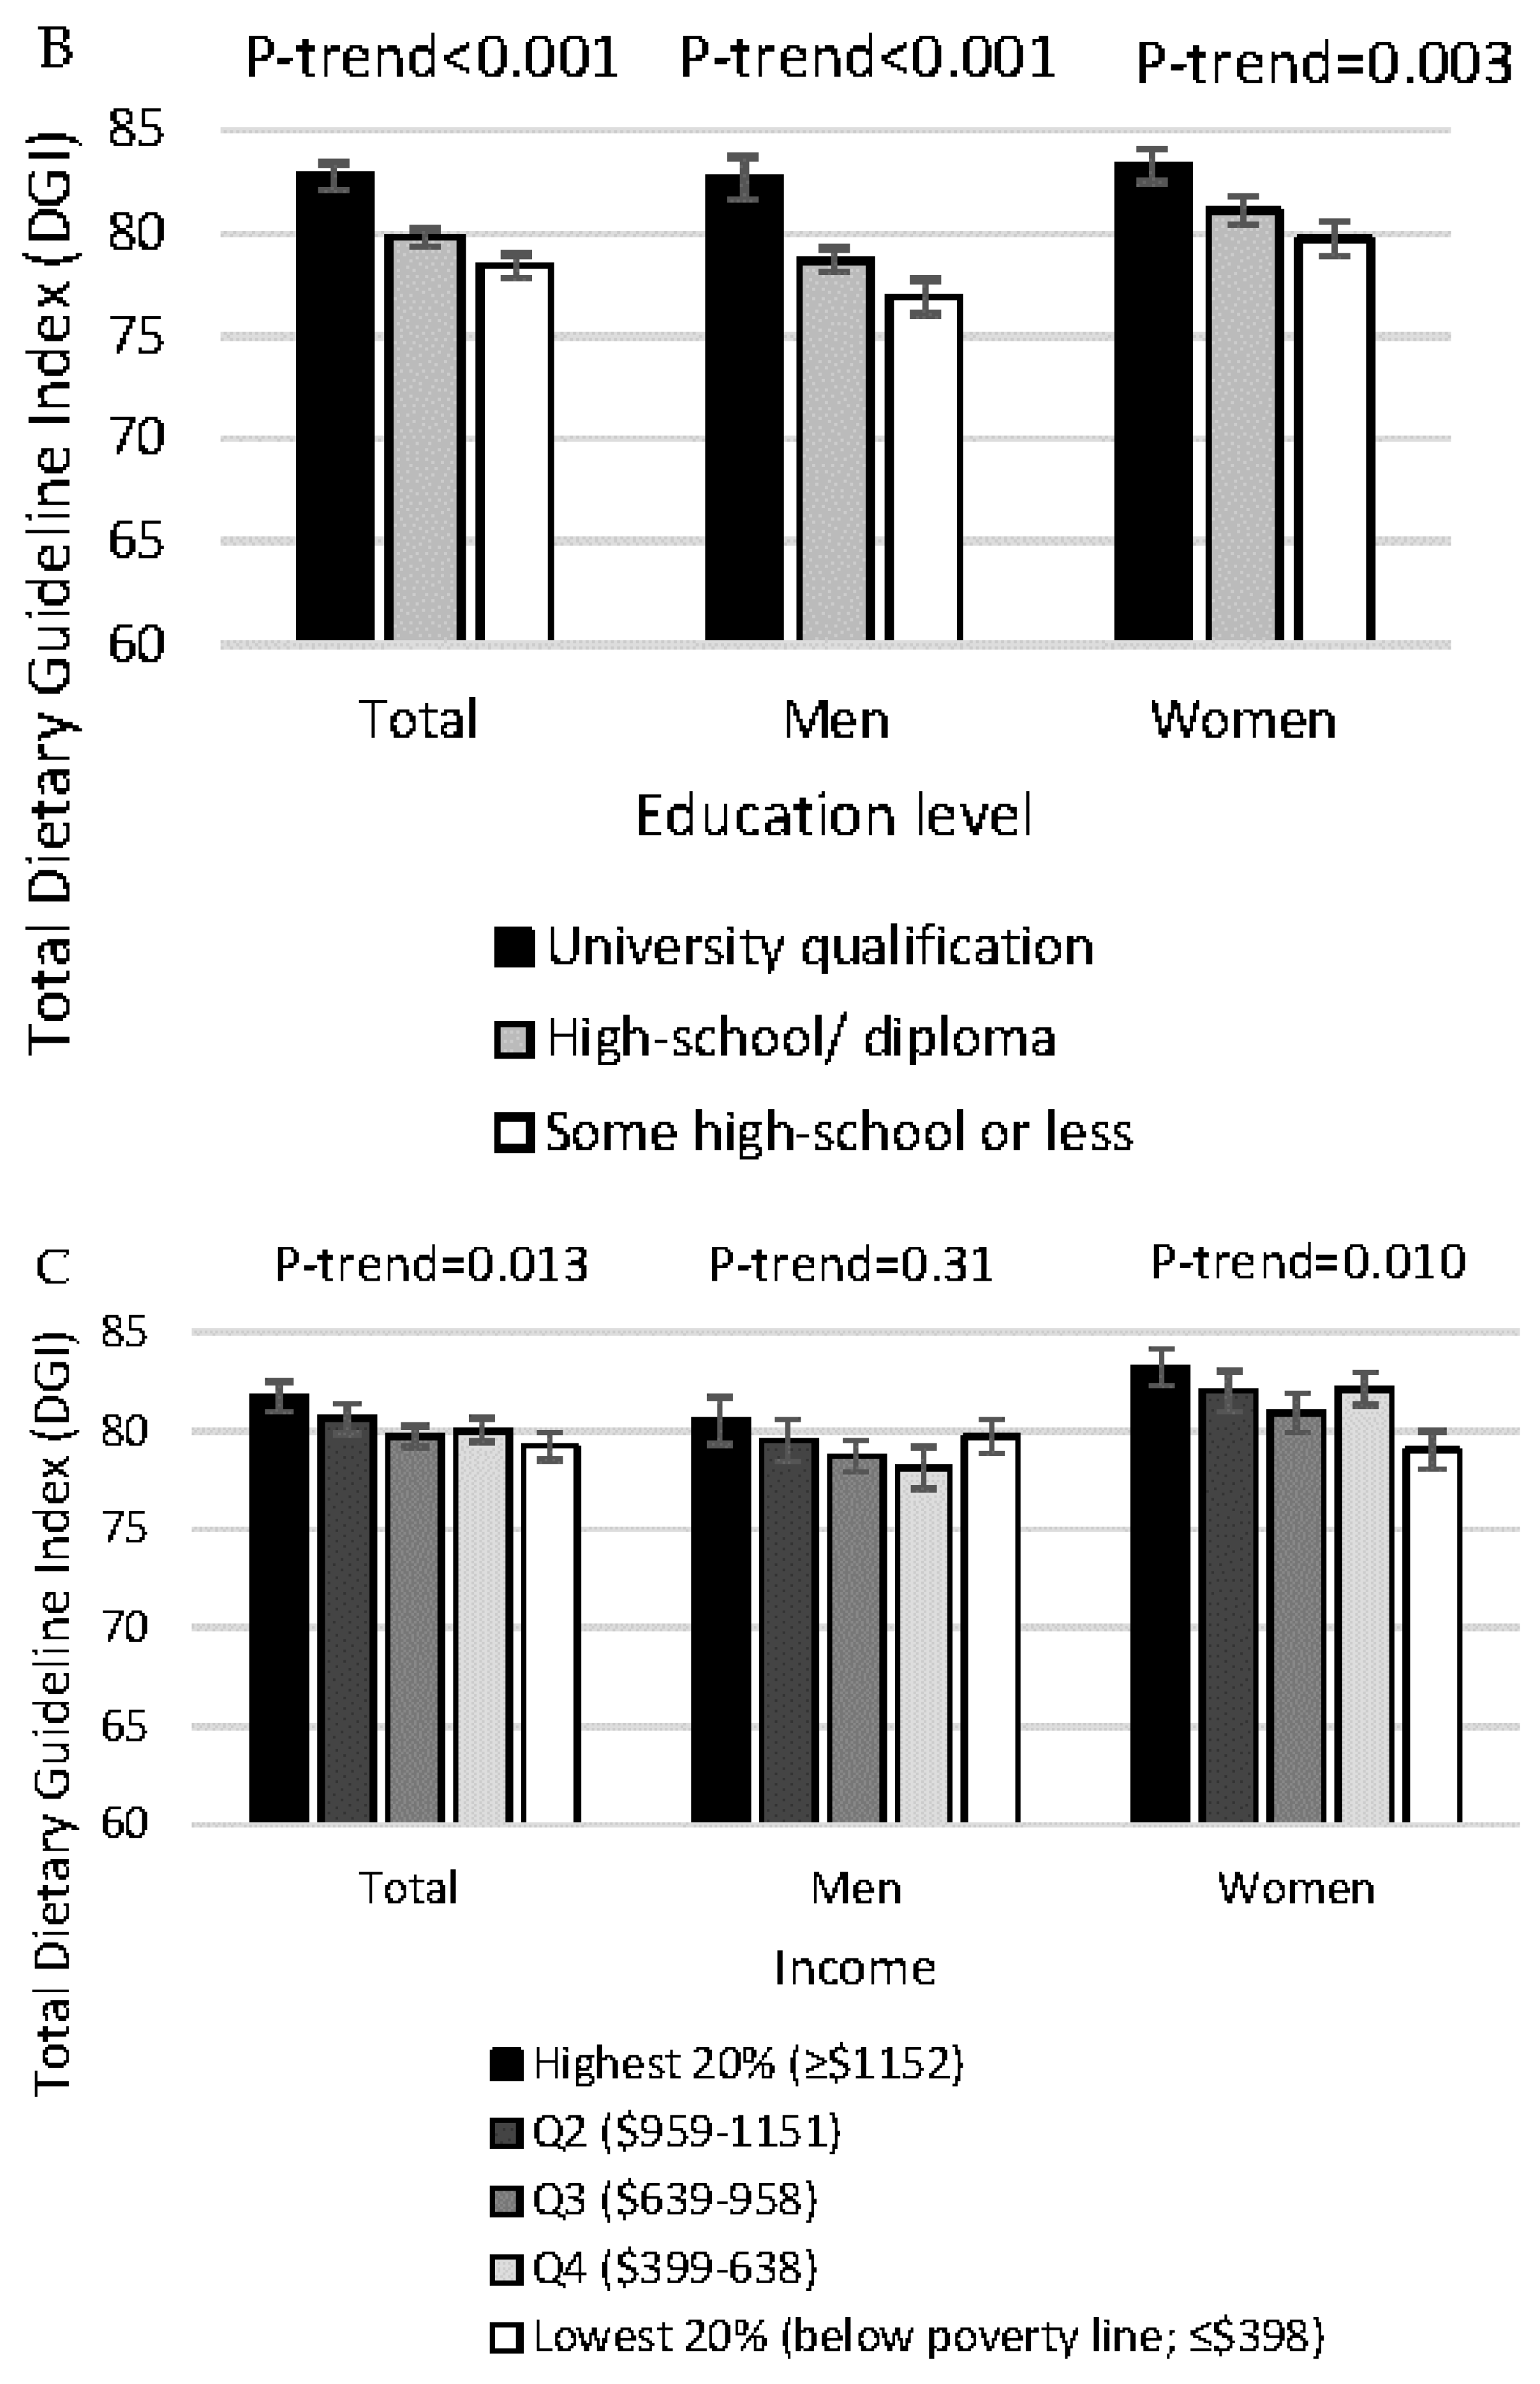
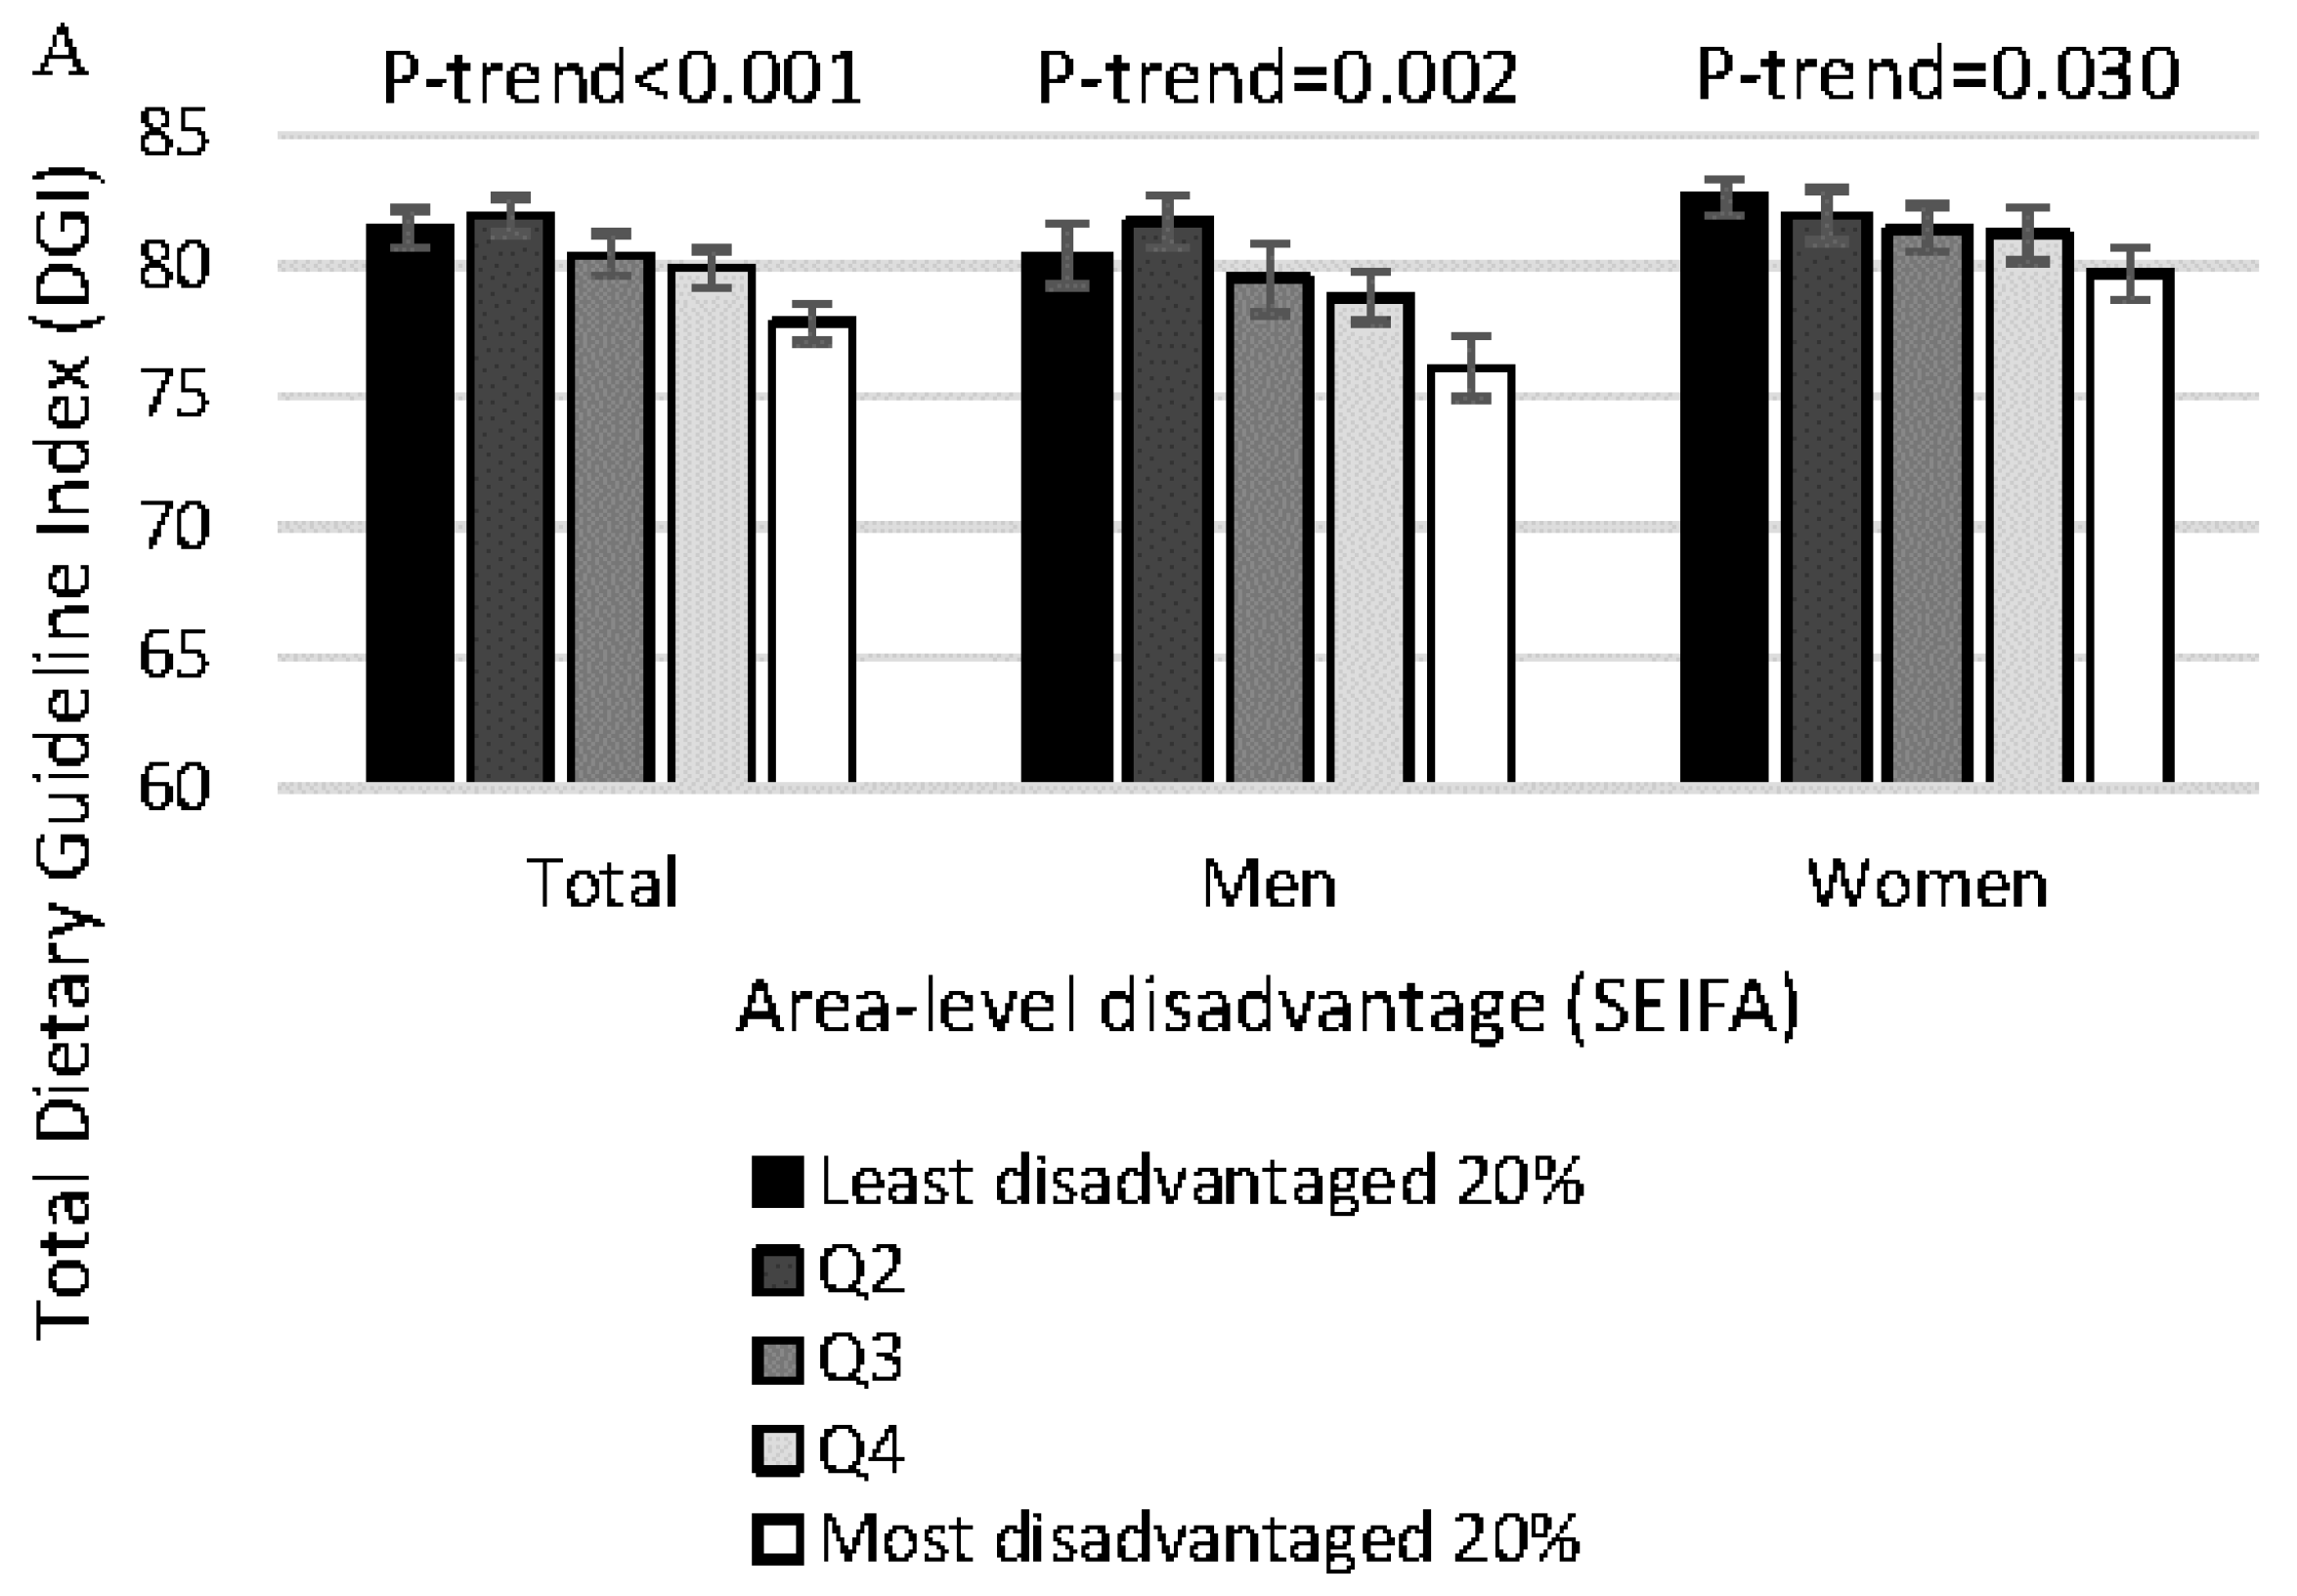
3.1. Diet Quality and DGI Component Scores by Socioeconomic Position
3.2. Total Energy and Nutrient Intakes by Socioeconomic Position
3.3. Stratified Analyses by Sex
3.4. Sensitivity Analyses
4. Discussion
5. Conclusions
Supplementary Materials
Acknowledgments
Author Contributions
Conflicts of Interest
References
- Ramsay, S.E.; Morris, R.W.; Whincup, P.H.; Papacosta, A.O.; Lennon, L.T.; Wannamethee, S.G. Time trends in socioeconomic inequalities in cancer mortality: Results from a 35 year prospective study in British men. BMC Cancer 2014, 14, 474. [Google Scholar] [CrossRef] [PubMed]
- World Health Organization. Diet, Nutrition and the Prevention of Chronic Diseases; Technical Report Series No. 916; WHO: Geneva, Switzerland, 2003; Available online: http://www.who.int/dietphysicalactivity/publications/trs916/en/ (accessed on 6 June 2017).
- Rehm, C.D.; Peñalvo, J.L.; Afshin, A.; Mozaffarian, D. Dietary intake among us adults, 1999–2012. JAMA 2016, 315, 2542–2553. [Google Scholar] [CrossRef] [PubMed]
- Drewnowski, A.; Specter, S. Poverty and obesity: The role of energy density and energy costs. Am. J. Clin. Nutr. 2004, 79, 6–16. [Google Scholar] [PubMed]
- Giskes, K.; Avendaňo, M.; Brug, J.; Kunst, A.E. A systematic review of studies on socioeconomic inequalities in dietary intakes associated with weight gain and overweight/obesity conducted among European adults. Obes. Rev. 2010, 11, 413–429. [Google Scholar] [CrossRef] [PubMed]
- Tapsell, L.C.; Neale, E.P.; Satija, A.; Hu, F.B. Foods, Nutrients, and Dietary Patterns: Interconnections and Implications for Dietary Guidelines. Adv. Nutr. Int. Rev. J. 2016, 7, 445–454. [Google Scholar] [CrossRef] [PubMed]
- Stringhini, S.; Sabia, S.; Shipley, M.; Brunner, E.; Nabi, H.; Kivimaki, M.; Singh-Manoux, A. Association of socioeconomic position with health behaviors and mortality. JAMA 2010, 303, 1159–1166. [Google Scholar] [CrossRef] [PubMed]
- Conklin, A.I.; Forouhi, N.G.; Surtees, P.; Wareham, N.J.; Monsivais, P. Gender and the double burden of economic and social disadvantages on healthy eating: Cross-sectional study of older adults in the EPIC-Norfolk cohort. BMC Public Health 2015, 15, 692. [Google Scholar] [CrossRef] [PubMed]
- James, W.P.; Nelson, M.; Ralph, A.; Leather, S. Socioeconomic determinants of health. The contribution of nutrition to inequalities in health. BMJ Br. Med. J. 1997, 314, 1545–1549. [Google Scholar] [CrossRef]
- Giskes, K.; Turrell, G.; Patterson, C.; Newman, B. Socioeconomic differences among Australian adults in consumption of fruit and vegetables and intakes of vitamins, A.; C and folate. J. Hum. Nutr. Diet. 2002, 15, 375–385. [Google Scholar] [CrossRef] [PubMed] [Green Version]
- Roos, G.; Johansson, L.; Kasmel, A.; Klumbiené, J.; Prättälä, R. Disparities in vegetable and fruit consumption: European cases from the north to the south. Public Health Nutr. 2001, 4, 35–43. [Google Scholar] [CrossRef] [PubMed]
- Backholer, K.; Spencer, E.; Gearon, E.; Magliano, D.J.; McNaughton, S.A.; Shaw, J.E.; Peeters, A. The association between socio-economic position and diet quality in Australian adults. Public Health Nutr. 2016, 19, 477–485. [Google Scholar] [CrossRef] [PubMed]
- Ball, K.; Crawford, D. Socioeconomic status and weight change in adults: A review. Soc. Sci. Med. 2005, 60, 1987–2010. [Google Scholar] [CrossRef] [PubMed]
- Australian Bureau of Statistics. Australian Health Survey: Users’ Guide 2011-13 Catalogue No. 4363.0.55.001. 2015. Available online: http://www.abs.gov.au/ausstats/[email protected]/Lookup/4363.0.55.001Chapter1002011-13 (accessed on 20 May 2017).
- De Vos, K.; Zaidi, M.A. Equivalence scale sensitivity of poverty statistics for the member states of the european community. Rev. Income Wealth 1997, 43, 319–333. [Google Scholar] [CrossRef]
- Bliss, R. Researchers produce innovation in dietary recall. Agric. Res. 2004, 52, 10–12. [Google Scholar]
- Livingstone, K.M.; McNaughton, S.A. Diet quality is associated with obesity and hypertension in Australian adults: A cross sectional study. BMC Public Health 2016, 16, 1037. [Google Scholar] [CrossRef] [PubMed]
- Food Standards Australia New Zealand. AUSNUT 2011-13: Australian Food, Supplement and Nutrient Database Canberra: Commonwealth of Australia. 2015. Available online: http://www.foodstandards.gov.au/science/monitoringnutrients/ausnut/Pages/about.aspx (accessed on 3 February 2017).
- National Health and Medical Research Council. Eat for Health: Australian Dietary Guidelines; National Health and Medical Research Council: Canberra, Australia, 2013.
- National Health and Medical Research Council. Educator Guide: Australian Dietary Guidelines; National Health and Medical Research Council: Canberra, Australia, 2013.
- Waijers, P.M.C.M.; Feskens, E.J.M.; Ocké, M.C. A critical review of predefined diet quality scores. Br. J. Nutr. 2007, 97, 219–231. [Google Scholar] [CrossRef] [PubMed]
- Wirfält, E.; Drake, I.; Wallström, P. What do review papers conclude about food and dietary patterns? Food Nutr. Res. 2013, 57, 20523. [Google Scholar] [CrossRef] [PubMed]
- Huang, T.; Roberts, S.; Howarth, N.; McCrory, M. Effect of screening out implausible energy intake reports on relationships between diet and BMI. Obes. Res. 2005, 13, 1205–1217. [Google Scholar] [CrossRef] [PubMed]
- Institute of Medicine. Dietary Reference Intakes for Energy, Carbohydrates, Fiber, Fat, Fatty Acids, Cholesterol, Protein and Amino Acids; The National Academies Press: Washington, DC, USA, 2002. [Google Scholar]
- Rothman, K.J. No Adjustments Are Needed for Multiple Comparisons. Epidemiology 1990, 1, 43–46. [Google Scholar] [CrossRef] [PubMed]
- Ball, K.; Lamb, K.E.; Costa, C.; Cutumisu, N.; Ellaway, A.; Kamphuis, C.B.M.; Mentz, G.; Pearce, J.; Santana, P.; Santos, R.; et al. Neighbourhood socioeconomic disadvantage and fruit and vegetable consumption: A seven countries comparison. Int. J. Behav. Nutr. Phys. Act. 2015, 12, 68. [Google Scholar] [CrossRef] [PubMed]
- McNaughton, S.A.; Ball, K.; Crawford, D.; Mishra, G.D. An Index of Diet and Eating Patterns Is a Valid Measure of Diet Quality in an Australian Population. J. Nutr. 2008, 138, 86–93. [Google Scholar] [PubMed]
- Fagerli, R.A.; Wandel, M. Gender differences in opinions and practices with regard to a “healthy diet”. Appetite 1999, 32, 171–190. [Google Scholar] [CrossRef] [PubMed]
- Mather, T.; Banks, E.; Joshy, G.; Bauman, A.; Phongsavan, P.; Korda, R.J. Variation in health inequalities according to measures of socioeconomic status and age. Aust. N. Z. J. Public Health 2014, 38, 436–440. [Google Scholar] [CrossRef] [PubMed]
- Friel, S.; Kelleher, C.C.; Nolan, G.; Harrington, J. Social diversity of Irish adults nutritional intake. Eur. J. Clin. Nutr. 2003, 57, 865–875. [Google Scholar] [CrossRef] [PubMed]
- Darmon, N.; Drewnowski, A. Contribution of food prices and diet cost to socioeconomic disparities in diet quality and health: A systematic review and analysis. Nutr. Rev. 2015, 73, 643–660. [Google Scholar] [CrossRef] [PubMed]
- Schoeller, D.A. Limitations in the assessment of dietary energy intake by self-report. Metabolism 1995, 44, 18–22. [Google Scholar] [CrossRef]
- Darmon, N.; Drewnowski, A. Does social class predict diet quality? Am. J. Clin. Nutr. 2008, 87, 1107–1117. [Google Scholar] [PubMed]
- Si Hassen, W.; Castetbon, K.; Cardon, P.; Enaux, C.; Nicolaou, M.; Lien, N.; Terragni, L.; Holdsworth, M.; Stronks, K.; Hercberg, S.; et al. Socioeconomic Indicators Are Independently Associated with Nutrient Intake in French Adults: A DEDIPAC Study. Nutrients 2016, 8, 158. [Google Scholar] [CrossRef] [PubMed]
- Mercado, C.I.; Cogswell, M.E.; Valderrama, A.L.; Wang, C.-Y.; Loria, C.M.; Moshfegh, A.J.; Rhodes, D.G.; Carriquiry, A.L. Difference between 24-h diet recall and urine excretion for assessing population sodium and potassium intake in adults aged 18–39 y. Am. J. Clin. Nutr. 2015, 101, 376–386. [Google Scholar] [CrossRef] [PubMed]
- Micha, R.; Wallace, S.K.; Mozaffarian, D. Red and Processed Meat Consumption and Risk of Incident Coronary Heart Disease, Stroke, and Diabetes Mellitus. A Systematic Review and Meta-Analysis. Circulation 2010, 121, 2271–2283. [Google Scholar] [CrossRef] [PubMed]
- McGill, R.; Anwar, E.; Orton, L.; Bromley, H.; Lloyd-Williams, F.; O’Flaherty, M.; Taylor-Robinson, D.; Guzman-Castillo, M.; Gillespie, D.; Moreira, P.; et al. Are interventions to promote healthy eating equally effective for all? Systematic review of socioeconomic inequalities in impact. BMC Public Health 2015, 15, 457. [Google Scholar]


| DGI sub-components | Sample | Area-Level Disadvantage | |||||
|---|---|---|---|---|---|---|---|
| Least Disadvantaged 20% 1 | Q2 | Q3 | Q4 | Most Disadvantaged 20% | p-Trend 2 | ||
| 1. Food variety | Overall | 3.68 (0.08) | 3.62 (0.07) | 3.46 (0.07) | 3.41 (0.07) | 3.18 (0.07) | <0.001 |
| Men | 3.47 (0.14) | 3.53 (0.10) | 3.39 (0.10) | 3.24 (0.12) | 3.01 (0.12) | 0.007 | |
| Women | 3.91 (0.09) | 3.71 (0.11) | 3.55 (0.10) | 3.60 (0.09) | 3.37 (0.08) | <0.001 | |
| 2. Vegetables | Overall | 4.88 (0.13) | 4.79 (0.12) | 4.93 (0.15) | 4.85 (0.14) | 4.77 (0.15) | 0.70 |
| Men | 4.61 (0.18) | 4.52 (0.16) | 4.69 (0.26) | 4.66 (0.17) | 4.89 (0.20) | 0.27 | |
| Women | 5.16 (0.19) | 5.14 (0.20) | 5.17 (0.20) | 5.11 (0.21) | 4.67 (0.21) | 0.14 | |
| 3. Fruit | Overall | 5.49 (0.20) | 6.05 (0.15) | 5.62 (0.21) | 5.65 (0.18) | 5.18 (0.18) | 0.18 |
| Men | 5.37 (0.27) | 5.94 (0.21) | 5.45 (0.31) | 5.64 (0.26) | 4.92 (0.33) | 0.29 | |
| Women | 5.63 (0.22) | 6.18 (0.24) | 5.84 (0.25) | 5.62 (0.20) | 5.46 (0.21) | 0.30 | |
| 4. Cereal (total) | Overall | 5.37 (0.15) | 5.67 (0.13) | 5.20 (0.16) | 5.47 (0.12) | 5.11 (0.12) | 0.14 |
| Men | 5.54 (0.19) | 5.87 (0.16) | 5.44 (0.21) | 5.49 (0.19) | 4.85 (0.19) | 0.012 | |
| Women | 5.17 (0.19) | 5.43 (0.20) | 4.92 (0.21) | 5.41 (0.16) | 5.40 (0.20) | 0.41 | |
| 4a. Serves per day | Overall | 2.87 (0.06) | 2.88 (0.06) | 2.91 (0.05) | 2.99 (0.07) | 3.08 (0.08) | 0.022 |
| Men | 3.24 (0.90) | 3.13 (0.07) | 3.10 (0.8) | 3.12 (0.10) | 3.11 (0.09) | 0.37 | |
| Women | 2.47 (0.07) | 2.58 (0.08) | 2.71 (0.09) | 2.82 (0.09) | 3.04 (0.12) | <0.001 | |
| 4b. Mostly wholegrain | Overall | 2.35 (0.14) | 2.60 (0.10) | 2.12 (0.13) | 2.31 (0.11) | 1.93 (0.10) | 0.010 |
| Men | 1.23 (0.17) | 2.59 (0.14) | 2.22 (0.18) | 2.19 (0.17) | 1.67 (0.17) | 0.013 | |
| Women | 1.48 (0.18) | 2.62 (0.18) | 2.00 (0.20) | 2.42 (0.14) | 2.25 (0.16) | 0.27 | |
| 5. Meat and alternatives (total) | Overall | 8.23 (0.10) | 8.09 (0.11) | 7.89 (0.11) | 7.81 (0.09) | 7.66 (0.13) | 0.001 |
| Men | 8.32 (0.12) | 8.04 (0.17) | 7.79 (0.17) | 7.78 (0.16) | 7.73 (0.20) | 0.010 | |
| Women | 8.13 (0.14) | 8.16 (0.14) | 7.99 (0.14) | 7.84 (0.11) | 7.61 (0.25) | 0.042 | |
| 5a. Serves per day3 | Overall | 3.47 (0.07) | 3.37 (0.08) | 3.23 (0.08) | 3.18 (0.07) | 3.11 (0.07) | 0.001 |
| Men | 3.59 (0.09) | 3.40 (0.12) | 3.22 (0.13) | 3.20 (0.12) | 3.15 (0.14) | 0.004 | |
| Women | 3.34 (0.10) | 3.34 (0.11) | 3.23 (0.09) | 3.15 (0.08) | 3.06 (0.13) | 0.042 | |
| 5b. Mostly lean3 | Overall | 4.76 (0.04) | 4.72 (0.05) | 4.66 (0.05) | 4.64 (0.04) | 4.56 (0.07) | 0.015 |
| Men | 4.73 (0.05) | 4.63 (0.07) | 4.57 (0.07) | 4.58 (0.07) | 4.58 (0.09) | 0.13 | |
| Women | 4.80 (0.06) | 4.82 (0.04) | 4.75 (0.07) | 4.69 (0.05) | 4.55 (0.14) | 0.09 | |
| 6. Total dairy and alternatives | Overall | 5.27 (0.16) | 5.20 (0.14) | 4.90 (0.16) | 4.70 (0.16) | 4.53 (0.15) | <0.001 |
| Men | 5.65 (0.22) | 5.88 (0.20) | 5.36 (0.21) | 5.05 (0.26) | 4.84 (0.25) | 0.002 | |
| Women | 4.84 (0.20) | 4.41 (0.17) | 4.38 (0.22) | 4.28 (0.17) | 4.16 (0.18) | 0.010 | |
| 7. Fluid intake (total) | Overall | 8.45 (0.09) | 8.62 (0.10) | 8.44 (0.11) | 8.49 (0.08) | 8.18 (0.12) | 0.06 |
| Men | 8.04 (0.14) | 8.47 (0.12) | 8.04 (0.21) | 8.17 (0.12) | 7.95 (0.15) | 0.38 | |
| Women | 8.93 (0.08) | 8.77 (0.11) | 8.90 (0.10) | 8.83 (0.11) | 8.45 (0.16) | 0.034 | |
| 7a. Serves per day | Overall | 3.96 (0.06) | 4.07 (0.07) | 3.90 (0.08) | 3.87 (0.06) | 3.73 (0.08) | 0.012 |
| Men | 3.66 (0.10) | 3.95 (0.09) | 3.62 (0.13) | 3.58 (0.09) | 3.51 (0.11) | 0.07 | |
| Women | 4.30 (0.06) | 4.18 (0.07) | 4.24 (0.08) | 4.19 (0.08) | 4.00 (0.10) | 0.030 | |
| 7b. Mostly water | Overall | 4.50 (0.05) | 4.56 (0.05) | 4.53 (0.06) | 4.62 (0.04) | 4.45 (0.07) | 0.93 |
| Men | 4.38 (0.07) | 4.52 (0.06) | 4.42 (0.11) | 4.58 (0.06) | 4.45 (0.10) | 0.40 | |
| Women | 4.62 (0.05) | 4.59 (0.06) | 4.66 (0.05) | 4.65 (0.06) | 4.45 (0.09) | 0.21 | |
| 8. Limit discretionary foods | Overall | 2.38 (0.21) | 2.93 (0.23) | 2.76 (0.21) | 2.72 (0.20) | 2.64 (0.23) | 0.59 |
| Men | 2.16 (0.29) | 2.61 (0.20) | 2.38 (0.31) | 2.40 (0.27) | 2.13 (0.32) | 0.86 | |
| Women | 2.66 (0.27) | 3.25 (0.29) | 3.24 (0.31) | 3.07 (0.29) | 3.20 (0.32) | 0.29 | |
| 9. Limit saturated fat (total) | Overall | 8.63 (0.11) | 8.58 (0.10) | 8.81 (0.10) | 8.70 (0.10) | 8.72 (0.12) | 0.43 |
| Men | 8.38 (0.19) | 8.56 (0.14) | 8.76 (0.15) | 8.54 (0.13) | 8.76 (0.14) | 0.18 | |
| Women | 8.88 (0.10) | 8.57 (0.17) | 8.86 (0.14) | 8.91 (0.15) | 8.68 (0.18) | 0.84 | |
| 9a. Mostly trimmed meat | Overall | 4.04 (0.07) | 4.00 (0.07) | 4.13 (0.07) | 4.09 (0.07) | 4.17 (0.08) | 0.13 |
| Men | 3.96 (0.12) | 3.98 (0.11) | 4.06 (0.11) | 3.87 (0.09) | 4.13 (0.11) | 0.52 | |
| Women | 4.14 (0.08) | 4.00 (0.13) | 4.21 (0.09) | 4.35 (0.09) | 4.21 (0.09) | 0.09 | |
| 9b. Mostly low-fat milk | Overall | 4.60 (0.06) | 4.59 (0.06) | 4.66 (0.06) | 4.55 (0.07) | 4.55 (0.08) | 0.54 |
| Men | 4.42 (0.10) | 4.58 (0.09) | 4.69 (0.08) | 4.55 (0.09) | 4.59 (0.10) | 0.32 | |
| Women | 4.78 (0.06) | 4.59 (0.07) | 4.63 (0.10) | 4.57 (0.09) | 4.49 (0.12) | 0.06 | |
| 10. Moderate unsaturated-fat | Overall | 8.36 (0.13) | 7.84 (0.23) | 8.33 (0.18) | 8.45 (0.18) | 8.49 (0.20) | 0.17 |
| Men | 9.07 (0.15) | 8.56 (0.23) | 9.04 (0.18) | 9.00 (0.16) | 8.88 (0.29) | 0.99 | |
| Women | 7.59 (0.23) | 6.97 (0.37) | 7.58 (0.34) | 7.79 (0.34) | 8.02 (0.31) | 0.09 | |
| 11. Limit added salt (total) | Overall | 6.17 (0.16) | 6.18 (0.15) | 5.90 (0.14) | 5.78 (0.15) | 5.54 (0.16) | <0.001 |
| Men | 6.03 (0.22) | 6.08 (0.21) | 5.74 (0.21) | 5.65 (0.21) | 5.28 (0.22) | 0.001 | |
| Women | 6.31 (0.24) | 6.29 (0.18) | 6.04 (0.20) | 6.00 (0.18) | 5.84 (0.20) | 0.07 | |
| 11a. During cooking | Overall | 2.97 (0.11) | 2.81 (0.11) | 2.61 (0.98) | 2.41 (0.12) | 2.32 (0.13) | <0.001 |
| Men | 2.88 (0.17) | 2.82 (0.17) | 2.62 (0.15) | 2.34 (0.15) | 2.28 (0.16) | 0.001 | |
| Women | 3.05 (0.15) | 2.79 (0.11) | 2.57 (0.14) | 2.56 (0.15) | 2.37 (0.17) | 0.001 | |
| 11b. Added at the table | Overall | 3.20 (0.11) | 3.37 (0.10) | 3.29 (0.09) | 3.37 (0.08) | 3.22 (0.10) | 0.81 |
| Men | 3.15 (0.15) | 3.26 (0.13) | 3.11 (0.13) | 3.31 (0.12) | 3.00 (0.14) | 0.64 | |
| Women | 3.26 (0.14) | 3.50 (0.13) | 3.48 (0.14) | 1.45 (0.12) | 3.47 (0.13) | 0.38 | |
| 12. Limit extra sugar | Overall | 6.91 (0.25) | 6.44 (0.22) | 6.47 (0.16) | 6.39 (0.23) | 6.42 (0.23) | 0.14 |
| Men | 6.66 (0.34) | 6.11 (0.35) | 6.02 (0.33) | 6.32 (0.33) | 6.17 (0.35) | 0.51 | |
| Women | 7.18 (0.29) | 6.83 (0.33) | 6.94 (0.21) | 6.48 (0.29) | 6.73 (0.33) | 0.18 | |
| 13. Limit alcohol | Overall | 8.45 (0.18) | 8.79 (0.15) | 8.58 (0.17) | 8.66 (0.15) | 8.34 (0.17) | 0.62 |
| Men | 7.89 (0.31) | 8.43 (0.23) | 8.23 (0.28) | 8.07 (0.26) | 7.68 (0.26) | 0.47 | |
| Women | 9.08 (0.16) | 9.21 (0.15) | 9.00 (0.20) | 9.29 (0.16) | 9.10 (0.21) | 0.79 | |
| DGI sub-components | Sample | Education | Gross Equivalised Income of Household (Weekly) | ||||||||
|---|---|---|---|---|---|---|---|---|---|---|---|
| University Qualification 1 | High-School/Diploma | Some High-School or Less | p-Trend2 | Highest 20% (≥$1152) 1 | Q2 ($959–1151) | Q3 ($639–958) | Q4 ($399–638) | Lowest 20% (Below Poverty Line; ≤$398) | p-Trend 2 | ||
| 1. Food variety | Overall | 3.73 (0.07) | 3.43 (0.06) | 3.26 (0.06) | <0.001 | 3.80 (0.07) | 3.61 (0.08) | 3.39 (0.08) | 3.38 (0.08) | 3.08 (0.07) | <0.001 |
| Men | 3.65 (0.10) | 3.27 (0.07) | 3.12 (0.09) | 0.001 | 3.57 (0.10) | 3.45 (0.11) | 3.32 (0.12) | 3.13 (0.11) | 3.02 (0.12) | 0.001 | |
| Women | 3.84 (0.09) | 3.63 (0.07) | 3.42 (0.08) | 0.001 | 4.07 (0.11) | 3.79 (0.10) | 3.47 (0.10) | 3.67 (0.10) | 3.12 (0.10) | <0.001 | |
| 2. Vegetables | Overall | 5.26 (0.13) | 4.67 (0.09) | 4.72 (0.11) | 0.002 | 5.20 (0.13) | 4.86 (0.13) | 4.56 (0.12) | 4.63 (0.15) | 4.95 (0.16) | 0.07 |
| Men | 5.17 (0.21) | 4.46 (0.12) | 4.59 (0.17) | 0.021 | 4.93 (0.21) | 4.58 (0.19) | 4.42 (0.17) | 4.43 (0.23) | 4.99 (0.22) | 0.65 | |
| Women | 5.34 (0.18) | 4.91 (0.15) | 4.97 (0.15) | 0.10 | 5.50 (0.21) | 5.17 (0.17) | 4.71 (0.20) | 4.88 (0.19) | 5.01 (0.21) | 0.035 | |
| 3. Fruit | Overall | 6.07 (0.17) | 5.55 (0.11) | 5.17 (0.18) | 0.002 | 5.68 (0.15) | 5.76 (0.15) | 5.39 (0.16) | 5.94 (0.21) | 5.22 (0.18) | 0.15 |
| Men | 5.92 (0.27) | 5.45 (0.16) | 4.97 (0.29) | 0.029 | 5.46 (0.21) | 5.66 (0.26) | 5.17 (0.25) | 5.90 (0.32) | 5.18 (0.27) | 0.72 | |
| Women | 6.23 (0.21) | 5.63 (0.13) | 5.39 (0.23) | 0.018 | 5.96 (0.20) | 5.88 (0.20) | 5.65 (0.22) | 6.00 (0.22) | 5.29 (0.27) | 0.10 | |
| 4. Cereal (total) | Overall | 5.58 (0.12) | 5.29 (0.09) | 5.23 (0.13) | 0.10 | 5.38 (0.15) | 5.45 (0.13) | 5.45 (0.15) | 5.35 (0.10) | 5.13 (0.15) | 0.30 |
| Men | 5.85 (0.16) | 5.33 (0.10) | 5.26 (0.22) | 0.023 | 5.52 (0.20) | 5.48 (0.17) | 5.59 (0.22) | 5.27 (0.16) | 5.27 (0.23) | 0.41 | |
| Women | 5.32 (0.18) | 5.28 (0.12) | 5.17 (0.13) | 0.56 | 51.9 (0.19) | 5.42 (0.20) | 5.28 (0.17) | 5.43 (0.18) | 4.98 (0.21) | 0.51 | |
| 4a. Serves per day | Overall | 2.85 (0.05) | 2.94 (0.04) | 3.05 (0.07) | 0.033 | 2.73 (0.05) | 2.94 (0.06) | 2.94 (0.06) | 3.07 (0.07) | 3.11 (0.07) | <0.001 |
| Men | 3.17 (0.06) | 3.12 (0.05) | 3.17 (0.10) | 0.94 | 3.03 (0.08) | 3.13 (0.08) | 3.15 (0.08) | 3.20 (0.80) | 3.27 (0.11) | 0.11 | |
| Women | 2.55 (0.07) | 2.77 (0.05) | 2.81 (0.09) | 0.028 | 2.38 (0.09) | 2.71 (0.10) | 2.70 (0.09) | 2.91 90.09) | 2.89 (0.08) | <0.001 | |
| 4b. Mostly wholegrain | Overall | 2.56 (0.10) | 2.20 (0.07) | 2.04 (0.11) | 0.002 | 2.46 (0.14) | 2.39 (0.12) | 2.38 (0.13) | 2.10 (0.09) | 1.86 (0.12) | 0.001 |
| Men | 2.56 (0.14) | 2.09 (0.09) | 1.97 (0.18) | 0.007 | 2.38 (0.18) | 2.24 (0.15) | 2.34 (0.18) | 1.88 (0.15) | 1.90 (0.20) | 0.048 | |
| Women | 2.57 (0.15) | 2.34 (0.11) | 2.13 (0.11) | 0.039 | 2.52 (0.18) | 2.56 (0.17) | 2.43 (0.15) | 2.36 (0.15) | 1.87 (0.18) | 0.016 | |
| 5. Meat and alternatives (total) | Overall | 7.96 (0.10) | 7.99 (0.07) | 7.84 (0.10) | 0.48 | 8.39 (0.09) | 7.85 (0.13) | 7.96 (0.10) | 7.86 (0.13) | 7.56 (0.10) | <0.001 |
| Men | 7.94 (0.13) | 7.95 (0.11) | 7.92 (0.17) | 0.96 | 8.38 (0.13) | 7.78 (0.16) | 7.90 (0.15) | 7.81 (0.19) | 7.62 (0.14) | 0.002 | |
| Women | 7.98 (0.12) | 8.06 (0.08) | 7.76 (0.12) | 0.20 | 8.40 (0.10) | 7.92 (0.21) | 8.01 (0.13) | 7.93 (0.17) | 7.52 (0.13) | <0.001 | |
| 5a. Serves per day | Overall | 3.26 (0.06) | 3.32 (0.05) | 3.21 (0.06) | 0.71 | 3.58 (0.07) | 3.26 (0.08) | 3.27 (0.08) | 3.22 (0.08) | 2.98 (0.06) | <0.001 |
| Men | 3.28 (0.09) | 3.34 (0.07) | 3.32 (0.11) | 0.79 | 3.65 (0.09) | 3.24 (0.10) | 3.30 (0.09) | 3.20 (0.14) | 3.04 (0.09) | <0.001 | |
| Women | 3.23 (0.08) | 3.31 (0.06) | 3.11 (0.08) | 0.36 | 3.48 (0.09) | 3.28 (0.12) | 3.22 (0.10) | 3.24 (0.10) | 2.93 (0.10) | <0.001 | |
| 5b. Mostly lean | Overall | 4.70 (0.05) | 4.67 (0.03) | 4.62 (0.05) | 0.30 | 4.81 (0.03) | 4.59 (0.07) | 4.69 (0.04) | 4.65 (0.05) | 4.58 (0.05) | 0.012 |
| Men | 4.65 (0.06) | 4.61 (0.05) | 4.60 (0.08) | 0.59 | 4.73 (0.05) | 4.54 (0.08) | 4.60 (0.07) | 4.61 (0.08) | 4.58 (0.08) | 0.24 | |
| Women | 4.75 (0.07) | 4.76 (0.04) | 4.65 (0.06) | 0.18 | 4.92 (0.03) | 4.65 (0.12) | 4.79 (0.05) | 4.69 (0.08) | 4.59 (0.06) | 0.001 | |
| 6. Total dairy and alternatives | Overall | 5.31 (0.13) | 4.88 (0.10) | 4.58 (0.12) | <0.001 | 5.49 (0.13) | 5.17 (0.14) | 4.75 (0.17) | 4.66 (0.16) | 4.37 (0.14) | <0.001 |
| Men | 5.82 (0.20) | 5.34 (0.14) | 4.87 (0.17) | 0.001 | 5.92 (0.18) | 5.70 (0.18) | 5.23 (0.22) | 4.87 (0.26) | 4.70 (0.21) | <0.001 | |
| Women | 4.75 (0.19) | 4.35 (0.13) | 4.18 (0.16) | 0.032 | 4.99 (0.18) | 4.57 (0.22) | 4.20 (0.20) | 4.41 (0.19) | 3.97 (0.18) | 0.001 | |
| 7. Fluid intake (total) | Overall | 8.54 (0.08) | 8.42 (0.07) | 8.36 (0.09) | 0.15 | 8.55 (0.11) | 8.56 (0.08) | 8.45 (0.08) | 8.36 (0.09) | 8.21 (0.10) | 0.002 |
| Men | 8.23 (0.13) | 8.13 (0.11) | 8.02 (0.14) | 0.29 | 8.11 (0.17) | 8.20 (0.12) | 8.19 (0.13) | 7.95 (0.15) | 8.20 (0.14) | 0.90 | |
| Women | 8.92 (0.08) | 8.76 (008) | 8.68 (0.11) | 0.10 | 9.10 (0.09) | 8.97 (0.10) | 8.76 (0.11) | 8.80 (0.13) | 8.30 (0.16) | <0.001 | |
| 7a. Serves per day | Overall | 4.01 (0.05) | 3.90 (0.04) | 3.81 (0.06) | 0.023 | 4.13 (0.06) | 3.96 (0.06) | 3.83 (0.06) | 3.86 (0.07) | 3.70 (0.06) | <0.001 |
| Men | 3.78 (0.09) | 3.66 (0.07) | 3.52 (0.10) | 0.06 | 3.84 (0.09) | 3.68 (0.08) | 3.59 (0.09) | 3.53 (0.11) | 3.60 (0.10) | 0.015 | |
| Women | 4.29 (0.06) | 4.17 (0.05) | 4.11 (0.06) | 0.06 | 4.48 (0.05) | 4.28 (0.06) | 4.11 (0.08) | 4.23 (0.08) | 3.85 (0.08) | <0.001 | |
| 7b. Mostly water | Overall | 4.53 (0.05) | 4.52 (0.04) | 4.55 (0.05) | 0.86 | 4.42 (0.06) | 4.60 (0.04) | 4.62 (0.05) | 4.50 (0.05) | 4.52 (0.07) | 0.35 |
| Men | 4.45 (0.08) | 4.47 (0.06) | 4.50 (0.07) | 0.64 | 4.27 (0.10) | 4.52 (0.06) | 4.60 (0.07) | 4.42 (0.09) | 4.60 (0.07) | 0.033 | |
| Women | 4.63 (0.05) | 4.59 (0.05) | 4.57 (0.06) | 0.49 | 4.62 (0.06) | 4.69 (0.06) | 4.65 (0.06) | 4.57 (0.07) | 4.45 (0.11) | 0.12 | |
| 8. Limit discretionary foods | Overall | 3.06 (0.18) | 2.56 (0.13) | 2.49 (0.19) | 0.033 | 2.65 (0.22) | 2.52 (0.17) | 2.66 (0.17) | 2.63 (0.22) | 2.99 (0.22) | 0.30 |
| Men | 2.79 (0.28) | 2.29 (0.18) | 1.87 (0.23) | 0.022 | 2.37 (0.33) | 2.17 (0.22) | 2.24 (0.26) | 2.14 (0.30) | 2.88 (0.31) | 0.46 | |
| Women | 3.42 (0.23) | 2.86 (0.19) | 3.02 (0.26) | 0.21 | 2.97 (0.30) | 2.94 (0.25) | 3.16 (0.25) | 3.15 (0.33) | 3.17 (0.31) | 0.52 | |
| 9. Limit saturated fat (total) | Overall | 8.74 (0.09) | 8.64 (0.07) | 8.71 (0.08) | 0.73 | 8.72 (0.08) | 8.54 (0.11) | 8.66 (0.12) | 8.81 (0.10) | 8.74 (0.10) | 0.34 |
| Men | 8.80 (0.14) | 8.50 (0.08) | 8.57 (0.14) | 0.17 | 8.62 (0.11) | 8.40 (0.17) | 8.59 (0.16) | 8.81 (0.11) | 8.60 (0.17) | 0.51 | |
| Women | 8.67 (0.12) | 8.81 (0.11) | 8.88 (0.12) | 0.19 | 8.82 (0.13) | 8.70 (0.16) | 8.74 (0.16) | 8.83 (0.13) | 8.88 (0.12) | 0.54 | |
| 9a. Mostly trimmed meat | Overall | 4.12 (0.06) | 4.04 (0.05) | 4.14 (0.07) | 0.86 | 4.07 (0.05) | 4.06 (0.07) | 4.08 (0.08) | 4.21 (0.08) | 4.03 (0.09) | 0.79 |
| Men | 4.13 (0.10) | 3.92 (0.06) | 4.02 (0.12) | 0.36 | 3.98 (0.08) | 4.00 (0.11) | 4.02 (0.12) | 4.11 (0.11) | 3.87 (0.14) | 0.89 | |
| Women | 4.11 (0.09) | 4.17 (0.07) | 4.29 (0.08) | 0.10 | 4.16 (0.09) | 4.13 (0.10) | 4.15 (0.12) | 4.31 (0.09) | 4.19 (0.10) | 0.52 | |
| 9b. Mostly low-fat milk | Overall | 4.63 (0.04) | 4.59 (0.05) | 4.54 (0.07) | 0.27 | 4.63 (0.05) | 4.51 (0.06) | 4.56 (0.06) | 4.55 (0.07) | 4.73 (0.05) | 0.20 |
| Men | 4.66 (0.06) | 4.53 (0.06) | 4.53 (0.10) | 0.20 | 4.58 (0.07) | 4.42 (0.09) | 4.56 (0.09) | 4.59 (0.09) | 4.75 (0.07) | 0.09 | |
| Women | 4.59 (0.06) | 4.67 (0.06) | 4.58 (0.08) | 0.98 | 4.68 (0.11) | 4.61 (0.07) | 4.57 (0.08) | 4.51 (0.11) | 4.72 (0.07) | 0.99 | |
| 10. Moderate unsaturated-fat | Overall | 8.10 (0.16) | 8.29 (0.12) | 8.54 (0.16) | 0.09 | 8.04 (0.15) | 8.35 (0.19) | 8.33 (0.14) | 8.25 (0.22) | 8.58 (0.20) | 0.10 |
| Men | 8.83 (0.18) | 8.92 (0.13) | 9.01 (0.19) | 0.53 | 8.93 (0.16) | 8.95 (0.16) | 8.86 (0.16) | 8.69 (0.25) | 9.14 (0.22) | 0.94 | |
| Women | 7.34 (0.25) | 7.62 (0.21) | 7.83 (0.28) | 0.19 | 6.99 (0.28) | 7.67 (0.35) | 7.74 (0.23) | 7.69 (0.32) | 7.88 (0.34) | 0.08 | |
| 11. Limit added salt (total) | Overall | 5.95 (0.11) | 6.06 (0.11) | 5.61 (0.14) | 0.08 | 6.14 (0.17) | 5.95 (0.16) | 5.93 (0.15) | 5.76 (0.14) | 5.77 (0.14) | 0.030 |
| Men | 5.86 (0.17) | 5.89 (0.14) | 5.32 (0.28) | 0.13 | 5.93 (0.23) | 5.76 (0.20) | 5.67 (0.19) | 5.78 (0.19) | 5.65 (0.21) | 0.39 | |
| Women | 6.05 (0.17) | 6.24 (0.16) | 5.95 (0.14) | 0.75 | 6.35 (0.24) | 6.17 (0.24) | 6.22 (0.20) | 5.77 (0.20) | 5.94 (0.20) | 0.08 | |
| 11a. During cooking | Overall | 2.51 (0.09) | 2.78 (0.07) | 2.48 (0.09) | 0.96 | 2.84 (0.11) | 2.74 (0.11) | 2.72 (0.11) | 2.44 (0.12) | 2.32 (0.11) | <0.001 |
| Men | 2.45 (0.13) | 2.73 (0.10) | 2.45 (0.18) | 0.81 | 2.80 (0.15) | 2.62 (0.14) | 2.68 (0.15) | 2.47 (0.17) | 2.28 (0.16) | 0.030 | |
| Women | 2.56 (0.12) | 2.84 (0.10) | 2.56 (0.12) | 0.86 | 2.86 (0.16) | 2.89 (0.16) | 2.77 (0.14) | 2.43 (0.16) | 2.39 (0.16) | 0.004 | |
| 11b. Added at the table | Overall | 3.44 (0.08) | 3.28 (0.06) | 3.13 (0.11) | 0.031 | 3.30 (0.10) | 3.21 (0.11) | 3.21 (0.10) | 3.32 (0.10) | 3.44 (0.11) | 0.23 |
| Men | 3.41 (0.11) | 3.17 (0.08) | 2.87 (0.17) | 0.013 | 3.13 (0.13) | 3.14 (0.13) | 2.99 (0.13) | 3.31 (0.13) | 3.37 (0.15) | 0.18 | |
| Women | 3.49 (0.10) | 3.40 (0.10) | 3.39 (0.15) | 0.57 | 3.49 (0.15) | 3.29 (0.16) | 3.45 (0.14) | 3.34 (0.14) | 3.54 (0.14) | 0.71 | |
| 12. Limit extra sugar | Overall | 6.89 (0.20) | 6.45 (0.14) | 6.29 (0.21) | 0.046 | 6.49 (0.23) | 6.40 (0.23) | 6.58 (0.19) | 6.57 (0.23) | 6.67 (0.23) | 0.53 |
| Men | 6.68 (0.33) | 6.07 (0.16) | 6.25 (0.32) | 0.33 | 6.02 (0.33) | 6.25 (0.37) | 6.26 (0.26) | 6.13 (0.34) | 6.84 (0.34) | 0.26 | |
| Women | 7.14 (0.28) | 6.92 (0.22) | 6.42 (0.29) | 0.10 | 7.09 (0.35) | 6.57 90.31) | 6.93 (0.31) | 7.07 (0.33) | 6.61 (0.26) | 0.59 | |
| 13. Limit alcohol | Overall | 8.67 (0.14) | 8.45 (0.10) | 8.69 (0.16) | 0.97 | 8.20 (0.14) | 8.42 (0.17) | 8.58 (0.15) | 8.85 (0.17) | 8.91 (0.16) | 0.003 |
| Men | 8.05 (0.23) | 8.02 (0.13) | 8.21 (0.29) | 0.70 | 7.57 (0.23) | 7.90 (0.27) | 8.10 (0.25) | 8.49 (0.25) | 8.64 (0.28) | 0.006 | |
| Women | 9.35 (0.14) | 8.90 (0.17) | 9.25 (0.15) | 0.54 | 8.97 (0.19) | 9.02 (0.21) | 9.13 (0.22) | 9.29 (0.17) | 9.27 (0.18) | 0.20 | |
| Energy/nutrient | Sample | n | Area-Level Disadvantage | |||||
|---|---|---|---|---|---|---|---|---|
| Least Disadvantaged 20% 1 | Q2 | Q3 | Q4 | Most Disadvantaged 20% | p-Trend2 | |||
| Energy intake (kJ/day) | Overall | 4875 | 8655 (47.9) | 8697 (60.8) | 8582 (46.9) | 8639 (45.9) | 8654 (55) | 0.75 |
| Men | 2356 | 9725 (76.5) | 9887 (90.8) | 9733 (58.1) | 9705 (62.1) | 9667 (74.9) | 0.21 | |
| Women | 2519 | 7456 (50.3) | 7259 (45.6) | 7316 (55) | 7452 (64.6) | 7450 (64.2) | 0.47 | |
| Protein intake (%E/day) | Overall | 4875 | 18.9 (0.21) | 18.9 (0.25) | 18.5 (0.22) | 18.5 (0.28) | 18.4 (0.27) | 0.06 |
| Men | 2356 | 18.9 (0.26) | 18.7 (0.34) | 18.5 (0.31) | 18.6 (0.42) | 18.4 (0.34) | 0.24 | |
| Women | 2519 | 19 (0.32) | 19.1 (0.36) | 18.5 (0.35) | 18.3 (0.33) | 18.4 (0.38) | 0.09 | |
| Total fat (%E/day) | Overall | 4875 | 31.2 (0.35) | 31.5 (0.36) | 30.4 (0.27) | 30.6 (0.29) | 30.5 (0.44) | 0.049 |
| Men | 2356 | 30.6 (0.51) | 31.4 (0.44) | 30.4 (0.53) | 30.2 (0.42) | 30.5 (0.63) | 0.48 | |
| Women | 2519 | 32 (0.47) | 31.6 (0.52) | 30.5 (0.39) | 30.9 (0.39) | 30.4 (0.55) | 0.016 | |
| Saturated fat intake (%E/day) | Overall | 4875 | 11.7 (0.18) | 11.6 (0.19) | 11.4 (0.17) | 11.4 (0.15) | 11.3 (0.2) | 0.05 |
| Men | 2356 | 11.7 (0.25) | 11.8 (0.24) | 11.4 (0.22) | 11.2 (0.2) | 11.3 (0.3) | 0.09 | |
| Women | 2519 | 11.8 (0.25) | 11.3 (0.27) | 11.5 (0.25) | 11.6 (0.23) | 11.2 (0.25) | 0.33 | |
| Trans fat intake (%E/day) | Overall | 4875 | 0.58 (0.012) | 0.56 (0.016) | 0.58 (0.016) | 0.56 (0.011) | 0.56 (0.015) | 0.34 |
| Men | 2356 | 0.59 (0.019) | 0.57 (0.019) | 0.59 (0.019) | 0.56 (0.013) | 0.58 (0.023) | 0.51 | |
| Women | 2519 | 0.57 (0.015) | 0.54 (0.025) | 0.58 (0.024) | 0.56 (0.018) | 0.54 (0.019) | 0.48 | |
| Mono-unsaturated fat intake (%E/day) | Overall | 4875 | 11.9 (0.17) | 12.2 (0.17) | 11.6 (0.13) | 11.7 (0.13) | 11.7 (0.19) | 0.10 |
| Men | 2356 | 11.6 (0.24) | 12.1 (0.22) | 11.7 (0.24) | 11.7 (0.19) | 11.8 (0.29) | 0.79 | |
| Women | 2519 | 12.4 (0.21) | 12.2 (0.25) | 11.5 (0.2) | 11.7 (0.17) | 11.6 (0.25) | 0.005 | |
| Poly-unsaturated fat intake (%E/day) | Overall | 4875 | 4.8 (0.08) | 5 (0.13) | 4.7 (0.08) | 4.8 (0.08) | 4.8 (0.1) | 0.60 |
| Men | 2356 | 4.6 (0.11) | 4.8 (0.19) | 4.7 (0.15) | 4.7 (0.11) | 4.7 (0.14) | 0.70 | |
| Women | 2519 | 5.1 (0.13) | 5.2 (0.19) | 4.7 (0.11) | 4.9 (0.13) | 4.9 (0.16) | 0.27 | |
| Carbohydrate intake (%E/day) | Overall | 4875 | 41.4 (0.44) | 42.3 (0.47) | 44.2 (0.42) | 44.2 (0.39) | 44.3 (0.5) | <0.001 |
| Men | 2356 | 41.8 (0.53) | 42.2 (0.56) | 44 (0.77) | 43.6 (0.55) | 43.5 (0.66) | 0.011 | |
| Women | 2519 | 40.9 (0.63) | 42.3 (0.68) | 44.4 (0.64) | 44.8 (0.53) | 45.2 (0.67) | <0.001 | |
| Total sugars intake (%E/day) | Overall | 4875 | 17.7 (0.38) | 18.6 (0.35) | 19.7 (0.36) | 19.3 (0.35) | 18.6 (0.41) | 0.027 |
| Men | 2356 | 17.4 (0.45) | 18.1 (0.5) | 19 (0.49) | 18.9 (0.49) | 17.8 (0.68) | 0.29 | |
| Women | 2519 | 18.1 (0.47) | 19.1 (0.44) | 20.6 (0.55) | 19.7 (0.39) | 19.4 (0.51) | 0.02 | |
| Fibre intake (g/MJ) | Overall | 4875 | 2.7 (0.04) | 2.8 (0.05) | 2.8 (0.05) | 2.8 (0.04) | 2.8 (0.04) | 0.58 |
| Men | 2356 | 2.6 (0.07) | 2.7 (0.06) | 2.6 (0.08) | 2.6 (0.05) | 2.6 (0.06) | 0.81 | |
| Women | 2519 | 2.9 (0.07) | 3 (0.07) | 3 (0.06) | 3 (0.06) | 2.9 (0.07) | 0.64 | |
| Sodium intake (g/MJ) | Overall | 4875 | 284.4 (3.95) | 289.7 (5.7) | 280.8 (4.27) | 275.2 (4.06) | 289.7 (4.94) | 0.76 |
| Men | 2356 | 288.1 (6.06) | 286.3 (7.31) | 284.1 (6.6) | 272.1 (5.67) | 289.4 (6.86) | 0.51 | |
| Women | 2519 | 280.2 (5.44) | 294.2 (8.21) | 277.3 (6.34) | 278.3 (6.03) | 289.9 (6.12) | 0.77 | |
| Energy/nutrient | Sample | n | Education | Gross Equivalised Income of Household (Weekly) | ||||||||
|---|---|---|---|---|---|---|---|---|---|---|---|---|
| University Qualification 1 | High-School/Diploma | Some High-School or Less | p-Trend 2 | Highest 20% (≥$1152) 1 | Q2 ($959–1151) | Q3 ($639–958) | Q4 ($399–638) | Lowest 20% (Below Poverty Line; ≤$398) | p-Trend 2 | |||
| Energy intake (kJ/day) | Overall | 4875 | 8646 (44.5) | 8626 (28.5) | 8677 (53.3) | 0.72 | 8795 (38.4) | 8728 (50.5) | 8626 (53.9) | 8541 (50.9) | 8465 (45.2) | <0.001 |
| Men | 2356 | 9833 (68.3) | 9716 (41.1) | 9707 (82.5) | 0.20 | 9959 (61.4) | 9808 (59.9) | 9748 (83.2) | 9556 (81.6) | 9490 (70.1) | <0.001 | |
| Women | 2519 | 7346 (44.1) | 7422 (34.4) | 7382 (60.1) | 0.56 | 7456 (49) | 7511 (74.4) | 7374 (44.7) | 7340 (55.2) | 7251 (54.1) | 0.002 | |
| Protein intake (%E/day) | Overall | 4875 | 18.3 (0.21) | 18.8 (0.14) | 18.8 (0.23) | 0.13 | 19.1 (0.24) | 18.6 (0.25) | 18.7 (0.24) | 18.7 (0.26) | 18.1 (0.25) | 0.038 |
| Men | 2356 | 18.3 (0.32) | 18.7 (0.17) | 18.8 (0.29) | 0.29 | 19 (0.31) | 18.6 (0.3) | 18.7 (0.31) | 18.4 (0.42) | 18.4 (0.33) | 0.22 | |
| Women | 2519 | 18.4 (0.25) | 18.8 (0.26) | 18.7 (0.31) | 0.38 | 19.2 (0.33) | 18.6 (0.34) | 18.7 (0.4) | 19 (0.29) | 17.9 (0.33) | 0.06 | |
| Total fat (%E/day) | Overall | 4875 | 31.3 (0.34) | 30.6 (0.2) | 30.7 (0.36) | 0.14 | 31.3 (0.34) | 30.2 (0.31) | 30.7 (0.28) | 31 (0.35) | 31 (0.35) | 0.78 |
| Men | 2356 | 31 (0.53) | 30.3 (0.26) | 30.8 (0.5) | 0.67 | 31.1 (0.43) | 29.7 (0.42) | 30.3 (0.31) | 31 (0.55) | 31.1 (0.6) | 0.63 | |
| Women | 2519 | 31.6 (0.41) | 31 (0.33) | 30.6 (0.42) | 0.07 | 31.7 (0.54) | 30.8 (0.46) | 31.2 (0.4) | 31 (0.5) | 30.8 (0.48) | 0.37 | |
| Saturated fat intake (%E/day) | Overall | 4875 | 11.6 (0.16) | 11.4 (0.1) | 11.7 (0.18) | 0.87 | 11.4 (0.15) | 11.3 (0.14) | 11.5 (0.15) | 11.7 (0.19) | 11.6 (0.19) | 0.15 |
| Men | 2356 | 11.6 (0.24) | 11.4 (0.14) | 11.6 (0.19) | 0.77 | 11.5 (0.18) | 11.2 (0.18) | 11.4 (0.17) | 11.8 (0.24) | 11.7 (0.28) | 0.22 | |
| Women | 2519 | 11.5 (0.21) | 11.3 (0.17) | 11.7 (0.25) | 0.60 | 11.3 (0.23) | 11.4 (0.26) | 11.6 (0.24) | 11.6 (0.25) | 11.6 (0.25) | 0.44 | |
| Trans fat intake (%E/day) | Overall | 4875 | 0.56 (0.009) | 0.56 (0.008) | 0.61 (0.015) | 0.002 | 0.56 (0.011) | 0.56 (0.012) | 0.56 (0.011) | 0.58 (0.015) | 0.6 (0.016) | 0.037 |
| Men | 2356 | 0.56 (0.013) | 0.57 (0.011) | 0.62 (0.019) | 0.013 | 0.58 (0.015) | 0.57 (0.019) | 0.56 (0.013) | 0.58 (0.021) | 0.6 (0.023) | 0.42 | |
| Women | 2519 | 0.55 (0.012) | 0.54 (0.013) | 0.6 (0.021) | 0.019 | 0.53 (0.014) | 0.54 (0.016) | 0.56 (0.018) | 0.57 (0.021) | 0.59 (0.023) | 0.013 | |
| Mono-unsaturated fat intake (%E/day) | Overall | 4875 | 12 (0.16) | 11.8 (0.11) | 11.7 (0.17) | 0.17 | 12.1 (0.19) | 11.5 (0.15) | 11.8 (0.12) | 11.8 (0.15) | 11.8 (0.15) | 0.39 |
| Men | 2356 | 11.9 (0.23) | 11.7 (0.15) | 11.8 (0.25) | 0.79 | 12 (0.23) | 11.4 (0.21) | 11.7 (0.17) | 11.8 (0.24) | 12.1 (0.28) | 0.66 | |
| Women | 2519 | 12.1 (0.2) | 12 (0.15) | 11.5 (0.19) | 0.049 | 12.3 (0.28) | 11.8 (0.19) | 11.9 (0.17) | 11.8 (0.24) | 11.6 (0.19) | 0.047 | |
| Poly-unsaturated fat intake (%E/day) | Overall | 4875 | 5 (0.08) | 4.8 (0.07) | 4.7 (0.1) | 0.020 | 5 (0.1) | 4.7 (0.08) | 4.8 (0.09) | 4.8 (0.09) | 4.8 (0.11) | 0.11 |
| Men | 2356 | 4.8 (0.11) | 4.6 (0.09) | 4.7 (0.14) | 0.57 | 4.9 (0.17) | 4.5 (0.12) | 4.7 (0.12) | 4.7 (0.14) | 4.6 (0.15) | 0.26 | |
| Women | 2519 | 5.2 (0.1) | 5.1 (0.1) | 4.6 (0.13) | 0.005 | 5.2 (0.14) | 4.9 (0.11) | 4.9 (0.14) | 4.9 (0.14) | 4.9 (0.18) | 0.39 | |
| Carbohydrate intake (%E/day) | Overall | 4875 | 42.8 (0.42) | 43 (0.24) | 44.1 (0.43) | 0.03 | 40.8 (0.48) | 43.3 (0.46) | 43.6 (0.43) | 44 (0.39) | 45.1 (0.44) | <0.001 |
| Men | 2356 | 42.6 (0.58) | 42.9 (0.36) | 43.7 (0.58) | 0.19 | 40.6 (0.51) | 43.4 (0.61) | 43.6 (0.59) | 44 (0.61) | 44.6 (0.67) | <0.001 | |
| Women | 2519 | 43 (0.49) | 43.1 (0.35) | 44.6 (0.58) | 0.035 | 41.2 (0.8) | 43.2 (0.6) | 43.6 (0.67) | 44 (0.55) | 45.5 (0.57) | <0.001 | |
| Total sugars intake (%E/day) | Overall | 4875 | 18.2 (0.26) | 18.8 (0.22) | 19.4 (0.32) | 0.004 | 18.1 (0.34) | 18.9 (0.31) | 19 (0.4) | 19.2 (0.4) | 18.8 (0.38) | 0.13 |
| Men | 2356 | 17.2 (0.4) | 18.6 (0.27) | 18.7 (0.54) | 0.017 | 17.1 (0.4) | 18.6 (0.53) | 18.8 (0.51) | 19.1 (0.62) | 17.8 (0.58) | 0.17 | |
| Women | 2519 | 19.3 (0.33) | 18.9 (0.3) | 20.2 (0.48) | 0.19 | 19.4 (0.5) | 19.2 (0.38) | 19.3 (0.5) | 19.4 (0.46) | 19.7 (0.54) | 0.55 | |
| Fibre intake (g/MJ) | Overall | 4875 | 2.9 (0.04) | 2.7 (0.03) | 2.7 (0.04) | 0.005 | 2.8 (0.04) | 2.8 (0.05) | 2.7 (0.03) | 2.8 (0.04) | 2.8 (0.05) | 1.00 |
| Men | 2356 | 2.7 (0.06) | 2.6 (0.04) | 2.6 (0.05) | 0.031 | 2.6 (0.06) | 2.7 (0.06) | 2.6 (0.05) | 2.7 (0.06) | 2.6 (0.07) | 0.53 | |
| Women | 2519 | 3.1 (0.06) | 2.9 (0.04) | 2.9 (0.06) | 0.032 | 3 (0.06) | 3 (0.07) | 2.9 (0.05) | 2.9 (0.06) | 3 (0.07) | 0.45 | |
| Sodium intake (g/MJ) | Overall | 4875 | 282.5 (3.7) | 285.5 (2.47) | 281.6 (4.22) | 0.93 | 282.6 (4.16) | 282.5 (4.45) | 287.4 (5.41) | 282.4 (4.17) | 283.7 (5.38) | 0.83 |
| Men | 2356 | 286.4 (4.89) | 282.7 (3.56) | 284 (6.34) | 0.73 | 286.1 (5.65) | 279 (6.57) | 289.5 (7.52) | 286.3 (5.5) | 277.2 (7.73) | 0.72 | |
| Women | 2519 | 278.8 (5.04) | 289.4 (3.99) | 279.9 (6.19) | 0.78 | 277.4 (5.9) | 286.8 (6) | 285.2 (6.5) | 278.1 (7.1) | 289.1 (6.1) | 0.34 | |
© 2017 by the authors. Licensee MDPI, Basel, Switzerland. This article is an open access article distributed under the terms and conditions of the Creative Commons Attribution (CC BY) license (http://creativecommons.org/licenses/by/4.0/).
Share and Cite
Livingstone, K.M.; Olstad, D.L.; Leech, R.M.; Ball, K.; Meertens, B.; Potter, J.; Cleanthous, X.; Reynolds, R.; McNaughton, S.A. Socioeconomic Inequities in Diet Quality and Nutrient Intakes among Australian Adults: Findings from a Nationally Representative Cross-Sectional Study. Nutrients 2017, 9, 1092. https://doi.org/10.3390/nu9101092
Livingstone KM, Olstad DL, Leech RM, Ball K, Meertens B, Potter J, Cleanthous X, Reynolds R, McNaughton SA. Socioeconomic Inequities in Diet Quality and Nutrient Intakes among Australian Adults: Findings from a Nationally Representative Cross-Sectional Study. Nutrients. 2017; 9(10):1092. https://doi.org/10.3390/nu9101092
Chicago/Turabian StyleLivingstone, Katherine M., Dana Lee Olstad, Rebecca M. Leech, Kylie Ball, Beth Meertens, Jane Potter, Xenia Cleanthous, Rachael Reynolds, and Sarah A. McNaughton. 2017. "Socioeconomic Inequities in Diet Quality and Nutrient Intakes among Australian Adults: Findings from a Nationally Representative Cross-Sectional Study" Nutrients 9, no. 10: 1092. https://doi.org/10.3390/nu9101092