Brain and Hepatic Mt mRNA Is Reduced in Response to Mild Energy Restriction and n-3 Polyunsaturated Fatty Acid Deficiency in Juvenile Rats

USDA Agricultural Research Service Grand Forks Human Nutrition Research Center, Grand Forks, ND 58203, USA
*
Author to whom correspondence should be addressed.
Nutrients 2017, 9(10), 1145; https://doi.org/10.3390/nu9101145
Submission received: 7 September 2017
/
Revised: 10 October 2017
/
Accepted: 13 October 2017
/
Published: 19 October 2017
Abstract
:Metallothioneins (MTs) perform important regulatory and cytoprotective functions in tissues including the brain. While it is known that energy restriction (ER) and dietary n-3 polyunsaturated fatty acid (PUFA) deficiency impact postnatal brain growth and development, little data exist regarding the impact of undernutrition upon MT expression in growing animals. We tested the hypothesis that ER with and without dietary n-3 PUFA deficiency reduces MT expression in juvenile rats. ER rats were individually pair-fed at 75% of the ad libitum (AL) intake of control rats provided diets consisting of either soybean oil (SO) that is α-linolenic acid (ALA; 18:3n-3) sufficient or corn oil (CO; ALA-deficient). Fatty acids (FA) and metal concentrations of liver and brain regions were analyzed. Tissue expression of MTs (Mt1-3) and modulators of MT expression including glucocorticoid receptors (Nr3c1 and Nr3c2) and several mediators of thyroid hormone regulation (Dio1-3, Mct8, Oatp1c1, Thra, and Thrb) were measured. Plasma corticosterone and triiodothyronine levels were also evaluated. ER, but not metal deficiency, reduced Mt2 expression in the cerebellum (50%) and cerebral cortex (23%). In liver, a reduction in dietary n-3 PUFA reduced Mt1, Mt2, Nr3c1, Mct8, and Thrb. ER elevated Nr3c1, Dio1, and Thrb and reduced Thra in the liver. Given MT’s role in cellular protection, further studies are needed to evaluate whether ER or n-3 PUFA deficiency may leave the juvenile brain and/or liver more susceptible to endogenous or environmental stressors.
Keywords:
metallothionein; cerebellum; energy restriction; mRNA; juvenile; brain development; n-3 PUFA1. Introduction
Undernutrition is a global problem that impedes brain and body development during childhood. Infants and children are particularly susceptible to undernutrition because of the high energy demands required for normal growth [1]. Childhood stunting affects approximately 162 million children <5 years of age worldwide [2]. Stunting has several lasting effects on children, including reduced physical stature, declined learning ability, psychological deficits, and elevated infection rates [2]. Similarly, energy restriction (ER) in juvenile animal models modifies neuronal growth, disrupts energy balance, induces behavioral changes, and decreases the immune response [3,4,5,6].
Dietary fat intake is important to infants and children during development. It is well-established that the long chain n-3 polyunsaturated fatty acid (n-3 LCPUFA) docosahexaenoic acid (DHA, 22:6n-3) preferentially accumulates in the brain. Within the brain, DHA is incorporated into the cell membranes where it promotes brain development and manifests influential effects on learning, memory, and behavior [7]. DHA needs to be consumed directly or is produced indirectly through its precursor α-linolenic acid (ALA; 18:3n-3). n-3 PUFA deficiency may have several deleterious effects within the brain including altering immune response, increasing susceptibility to oxidative damage, modifying genes involved in neuronal growth, and disturbing energy regulation [7,8,9,10].
In the brain, metallothionein isoforms (MTs) provide important roles in cytoprotection and the regulation of cellular metal ion concentration. The downregulation of brain MTs increases the likelihood of cellular oxidative stress and damage associated with heavy metal exposure [11]. Moreover, MT-1/2-deficient mice are more susceptible to neuronal damage associated with kainic acid (KA)-induced seizures [12]. In mammals, MT-1 and MT-2 (MT-1/2) expression is ubiquitous, whereas MT-3 is mainly localized to the brain but is expressed to a lesser degree in other organs [13,14,15]. MT-4 expression is largely confined to stratified epithelial cells associated with skin, esophagus, and the stomach [16]. Brain MT-1/2 expression is highly enriched in astrocytes, while MT-3 is observed in both astrocytes and neurons. MTs have not been reported to be expressed in oligodendrocytes or microglia [17].
MTs are highly conserved, low-molecular-weight, cysteine-rich proteins. The high cysteine content of MTs enables them to regulate metal ion homeostasis, particularly zinc and copper. Through this mechanism, MTs regulate metal-dependent cellular processes such as gene transcription, translation, and enzyme activity [11]. MT expression is regulated by metals, oxidative stress, glucocorticoids, inflammatory mediators, and thyroid hormone (TH) [17,18].
Little information is available in regard to the nutritional regulation of MTs. In older animals, several studies have reported an increased expression of Mt1 and Mt2 in response to ER in various tissues including those of the cerebellum, cortex, hippocampus, striatum, cochlea, spinal cord, heart, lung, skeletal muscle, and colon [19,20,21]. Moreover, Mt3 along with several other antioxidant genes are upregulated in mammary glands of rats fed a low-fat (16% fat energy) n-3 PUFA-enriched diet compared to a high-fat (39% fat energy) n-3 PUFA-enriched diet [22]. In mice, MTs protect against development of obesity, insulin resistance, and diet-induced oxidative stress damage [23,24,25,26].
Given the neurotoxicological importance of MT expression in the postnatal brain, we explored the degree to which ER and dietary n-3 PUFA deficiency modifies MT expression. We tested the hypothesis that ER and dietary n-3 PUFA deficiency reduce MT expression in juvenile rats. Tissue concentrations of metals and the expression of glucocorticoid receptors and mediators of TH regulation along with plasma corticosterone (CORT) and triiodothyronine (free T3 or fT3) were studied as secondary endpoints given their ability to regulate MT levels and responsiveness to ER [18,27,28,29]. Fatty acid (FA) analysis was performed to confirm tissue n-3 PUFA depletion. Our data demonstrate that expression of Mt2 decreased 50% in an energy-dependent manner within the cerebellum, while Mt1, Mt2, Nr3c1, Mct8, and Thrb decreased in an n-3 FA-dependent fashion in the liver. ER increased Nr3c1, Dio1, and Thrb and decreased Thra in the liver. Plasma CORT was elevated in the SO-ER diet compared to ad libitum levels, while fT3 was unchanged.
2. Materials and Methods
2.1. Animals
All experiments were performed in accordance with the NIH guidelines for the use of live animals and were approved by the Institutional Animal Care and Use Committee of the USDA Agricultural Research Service, Grand Forks Human Nutrition Research Center. The animal experimentation and diets have been previously described [10]. Male Sprague–Dawley rats (21 days old) were purchased from Harlan Laboratories. Two days after arrival, rats were equally distributed, based on body mass, into four diet groups (n = 8/group): diets containing soybean oil (SO) with replete α-linolenic acid (ALA; 18:3n-3; 1.1% energy) with ad libitum (AL) intake (SO-AL), SO with ER (SO-ER), corn oil (CO; ALA-deficient; 0.13% energy) with AL intake (CO-AL), and CO with ER feeding (CO-ER). The SO and CO diets had linoleic acid (LA; 18:2n-6) at 8.6% energy and 8.8% energy, respectively. Oils constituted 16% fat energy. SO-ER and CO-ER rats were individually fed 75% of the diet consumed against a corresponding rat in the AL group receiving their respective dietary oil. All diets were based on the AIN93G formula [30]. SO-ER and CO-ER diets contained 25% more mineral and vitamin mix than the respective SO-AL and CO-AL diets to limit confounding factors resulting from micro-nutrient deficiency.
Vitamin-free casein (Harlan/Teklad) was used as a protein source. CO and SO were purchased from Dyets Inc. All diets contained AIN93 mineral mix (Dyets Inc., Bethlehem, PA, USA) and AIN93G vitamin mix (Harlan/Teklad). Mineral analysis was also performed on the diets. Caloric content of the diets was determined by bomb calorimetry as described previously [31]. Food consumption was measured daily, and fresh food was provided daily. Body mass was measured weekly. Body composition was determined by whole-body MRI (EchoMRI-700; Echo Medical Systems LLC) at the beginning and end of the study.
Rats remained in their dietary groups for 4 weeks. At the end of the experiment, rats were fasted overnight. Rats were killed by an overdose of anesthetic (xylazine 13 mg/kg and ketamine 100 mg/kg) followed by exsanguination. Blood was collected with EDTA for subsequent isolation of plasma. Brains were dissected into the cerebral cortex, hippocampus, and cerebellum. Brain regions, liver, and plasma were snap-frozen in liquid nitrogen and stored at −80 °C. Tissues were pulverized using a BioPulverizer (Biospec Products, Inc., Bartlesville, OK, USA) at liquid nitrogen temperature. Pulverized samples were stored at −80 °C until further use.
2.2. FA Analyses
A powdered sample of tissue (∼50 mg) was extracted twice into 3.6 mL of hexane/isopropanol (3:2 v/v) with BHT (50 μM; Sigma-Aldrich, St. Louis, MO, USA) added to limit lipid peroxidation. Samples were homogenized using a PRO200 Bio-Gen Series homogenizer (PRO Scientific Inc., Oxford, CT, USA) and then centrifuged at 2000× g for 10 min. The organic phase was removed, dried under nitrogen, and dissolved in 1 mL of hexane/2-propanol (3:2 v/v) containing 5% water and 50 μM BHT and stored at −80 °C under nitrogen. The FA content of the organic extract was determined by fatty acid methyl ester (FAME) analysis [32].
2.3. Gene Expression Analysis
RNA was isolated from pulverized tissue, ~20 mg, using a QIAcube system (Qiagen) as described previously [31,32]. qPCR was performed as described previously [32]. Primer pairs for gene expression are presented in Appendix A, Table A1.
2.4. Mineral Analysis
Pulverized tissues were lyophilized, weighed, and digested with an acid reflux until solubilized and then analyzed by inductively coupled argon plasma emission spectroscopy (ICP) or inductively coupled argon plasma mass spectrometry (ICPMS). We included standard reference materials (SRMs) during all steps of our analysis, attempting to match the sample’s matrix when possible. The SRM used for tissue (cerebellum, cerebral cortex, and liver) was bovine Liver-SRM 1577b (NIST, Gaithersburg, MD, USA). Blanks were run periodically to assure there was no cross-contamination from one sample to another. Liver mineral analysis was performed via ICP using a Thermo Fisher Scientific ICAP 6500 Duo (Thermo Fisher Scientific, Waltham, MA, USA) as previously described [33]. The wavelengths used to analyze the multiple elements using ICP are reported in Appendix A. Analysis of cerebellum and cerebral cortex was performed by ICPMS using a Nexion 350 D (PerkinElmer Inc., Waltham, MA, USA). Analysis for the following elements was measured at the following assigned mass:
| Element | Minimum Detection Limit |
| 63Cu | 0.63 ng/mL |
| 55Mn | 0.33 ng/mL |
| 66Zn | 2.61 ng/mL |
2.5. Plasma CORT and fT3
CORT (Enzo Life Sciences, Farmingdale, NY, USA) and free triiodothyronine (fT3) (Genway Biotech, San Diego, CA, USA) concentrations in EDTA plasma were determined using commercially available enzyme immunoassay kits according to the manufacturer’s instructions. The inter-assay coefficient of variation (CV) for CORT and fT3 was <10% and <5%, respectively.
2.6. Statistical Analyses
Two-way ANOVA was performed on all data sets using GraphPad Prism version 7.00 for Windows, GraphPad Software, La Jolla, CA, USA, www.graphpad.com. Tukey’s multiple comparison tests were performed when a significant interaction was identified (energy X oil). Significance was taken as p ≤ 0.05.
3. Results
3.1. Energy Intake and Body Composition
Energy intake data are provided in Figure 1. Oil type did not influence energy intake in the AL or in the ER groups. Energy intake was 25% lower in the ER animals compared to the AL animals. The body composition data are presented in Table 1. By the end of the 4-week study, rats in the ER groups had body masses that were ~24% lower than those in the AL groups. There was no influence of oil type on body mass. Liver mass was reduced by ~15% and ~17% in ER animals fed the SO and CO diets, respectively. Total brain mass was not altered from n-3 PUFA depletion, but the CO-ER animals had slightly reduced brain mass compared with the CO-AL animals (~6%). ER animals had an elevated brain/body mass ratio regardless of oil type.
3.2. ER and n-3 PUFA-Deficient Diet Effects on Mt1-3 mRNA Expression in the Cerebellum, Cerebral Cortex, Hippocampus, and Liver
The extent to which ER and reduced dietary n-3 PUFA modify Mt1-3 gene expression in multiple brain regions and the liver was examined (Table 2). In the cerebellum, both ER groups had reduced Mt1 (≥20%) and Mt2 (50%) expression compared to the ad libitum groups, while expression of Mt3 was unchanged. ER also reduced Mt2 expression in the cerebral cortex (20%) and hippocampus (15%), but had no effect on Mt1 and Mt3 expression. Mt2 expression was elevated (28%) in the cerebellum of CO-ER compared to SO-ER animals. Mt1 gene expression was reduced (~15%) in the cerebral cortex of animals receiving the CO diet.
n-3 PUFA depletion decreased Mt1-2 expression in the liver >50%; however, ER had no effect on Mt1-2 mRNA content in the liver. Mt3 mRNA in the liver was not considered expressed since the ΔCt values were much higher compared with Mt1 and Mt2 (Appendix A, Table A2). This finding coincides with several previous reports of Mt3 gene and protein expression being absent in mouse and rat liver [14,15,34,35]. The qPCR Ct values for β-actin that were used for target gene normalization are reported in Appendix A, Table A5.
3.3. Impact of the Low-n-3 FA Diet and ER on Liver PUFA Content
Because oil-induced changes in hepatic Mt gene expression were observed, we measured hepatic PUFA content. Consumption of the CO diet versus the SO diet reduced the hepatic content of ALA (92%), docosapentaenoic acid n-3 (DPAn-3; 22:5n-3) (49%), and DHA (51%) (Table 3). Hepatic content of eicosapentaenoic acid (EPA; 20:5n-3) was below the limit of detection in animals consuming the CO diet. ER reduced the hepatic concentration of ALA (51%) but not that of other n-3 PUFAs as previously reported [10].
Hepatic n-6 PUFA concentrations were modified by both oil types and ER. ALA restriction reduced hepatic LA content (14%). Intake of the low n-3 PUFA CO diet increased levels of docosatetraenoic acid (DTA; 22:4n-6) (149%). Hepatic content of docosapentaenoic acid n-6 (DPAn-6; 22:5n-6) was elevated greater than 20-fold by intake of the CO diet. Intake of the CO diet decreased dihomo-gamma-linolenic acid (DGLA; 20:3n-6) by 23%, while ER increased DGLA by 103%.
3.4. Impact of Low-n-3 FA Diet and ER on Cerebellar PUFA
Table 4 displays the cerebellar PUFA concentrations. Intake of the low-ALA CO diet elevated the concentration of arachidonic acid (ARA; 20:4n-6) (10%), DTAn-6 (16%), and DPAn-6 (520%), but reduced the amount of DGLA (14%). DPAn-6 was elevated by ER (30%). There were reductions in both DHA (10%) and DPAn-3 (~50%) in the CO groups.
3.5. Impact of Low-n-3 FA Diet and ER on Cerebral Cortex PUFA
The extent to which ER and a low n-3 PUFA diet affected PUFA levels in the cerebral cortex is reported in Table 5. ER elevated the concentration of ARA (7%), DPAn-6 (15%), and DHA (12%). Intake of the low n-3 PUFA CO diet increased the levels of DTA (25%) and DPAn-6 (230%), but reduced the level of DPAn-3 (30%). There were reductions in both LA (15%) and DGLA (12%) in the CO groups. This latter finding is likely the result of the elevated formation of the n-6 LCPUFA DTA and DPAn-6.
3.6. Copper, Manganese, and Zinc Levels in the Cerebellum, Cerebral Cortex, and Liver
MT tissue expression can be induced by exposures to essential metals, primarily zinc, copper, and manganese [36]. In order to determine whether ER or oil-dependent reductions in the tissue concentrations of these metals occurred, these metals were analyzed in the cerebellum, cerebral cortex, and liver by either ICP or ICP-MS. In the cerebellum and liver, the levels of all 3 metals were unchanged from ER (Table 6). Copper content was unchanged in all tissues. Hepatic manganese content was slightly increased (8%) from intake of the CO diet. Interestingly, the level of zinc in the cerebral cortex of the SO-AL group was lower (~36%) than the other three groups. Mineral analysis was not performed on the hippocampus due to the low sample amount.
3.7. Plasma CORT and fT3 Levels
Because MTs are regulated by both glucocorticoids and THs [18,29], we determined plasma concentrations of CORT and fT3. Plasma CORT concentration was elevated 140% in the SO-ER compared to SO-AL group and 47% by the CO-ER diet compared to the CO-AL diet. fT3 concentrations were not changed between the dietary groups (Table 7).
3.8. ER and n-3 PUFA-Deficient Diet Effects on Glucocorticoid and Mineralocorticoid mRNA Expression in the Cerebellum, Cerebral Cortex, Hippocampus, and Liver
MT mRNA and protein levels are induced by glucocorticoids and ER increases glucocorticoid receptor (GR) protein in mice. We analyzed the mRNA levels of the glucocorticoid and mineralocorticoid receptors (Nr3c1 and Nr3c2, respectively). There were no ER or n-3 PUFA effects on the mRNA levels of either gene in any of the brain regions analyzed (Table 8). However, in the liver, SO-ER and CO-ER diets increased Nr3c1 expression (78% and 62%, respectively) from the ad libitum groups. Hepatic Nr3c1 gene expression was reduced 18% by dietary n-3 PUFA deficiency. Appendix A, Table A3, shows the ΔCt values for Nr3c1 and Nr3c2.
3.9. ER and n-3 PUFA-Deficient Diet Effects on mRNA Expression of TH Regulators in the Cerebellum, Cerebral Cortex, Hippocampus, and Liver
We analyzed mRNA expression for several regulators of TH signaling including: TH activation/inactivation by type I, II, and III iodothyronine deiodinases (Dio1-3), TH transport by monocarboxylate transporter 8 (Mct8) and solute carrier organic anion transporter family member 1C1 (Oatp1c1), and thyroid hormone receptors alpha (Thra) and beta (Thrb). Appendix A, Table A4, displays the ΔCt values for Dio1-3, Mct8, Oatp1c1, Thra, and Thrb throughout the tissues analyzed in this study.
There was no change of Dio1 expression in the three brain regions among the dietary treatments (Table 9). The expression of Dio2 and Dio3 was increased 13% and 32%, respectively, in the cerebellum from ER. Oatp1c1 was decreased (23%) in the CO-ER compared to CO-AL groups in the cortex. ER elevated Thra (9%) and Thrb (19%) mRNA concentrations in the cerebral cortex. Similarly, cerebellar Thra expression was elevated (12%) from ER.
Expression of Dio2 was elevated (38%) in the cerebral cortex of the low n-3 PUFA CO-AL diet animals compared to SO-AL animals. Mct8 was decreased from n-3 PUFA deficiency in the cerebellum (60%) Oatp1c1 displayed an oil-dependent reduction in the cerebellum (28%) and cortex (21%). Cerebellar Thra and Thrb were decreased (10% and 14%, respectively) from dietary n-3 PUFA depletion, whereas increases in Thra and Thrb expression from n-3 PUFA depletion (~20%) occurred in the cerebral cortex.
Hepatic Dio1 expression for the SO-ER and CO-ER groups was elevated (67% and 87%, respectively) from the ad libitum groups. In the liver, Thra was decreased in response to SO-ER and CO-ER diets (43% and 39%, respectively) compared to the ad libitum groups. Thrb was increased in the liver by SO-ER and CO-ER diets (62% and 66%, respectively) compared to the ad libitum groups. TH transporter expression in the liver was not impacted by ER.
Dietary n-3 PUFA effects on liver TH regulators were minor. Mct8 expression was decreased by n-3 PUFA deficiency in the liver (26%). Hepatic Thrb was reduced (19%) in the n-3 PUFA-deficient group (CO-AL) compared to SO-AL.
4. Discussion
Undernutrition in children is a persistent global issue. Specifically, the developing cerebellum is particularly sensitive to undernutrition and is susceptible to environmental insults [37,38]. The cerebellum is best known for regulating motor coordination but plays critical roles in higher cognitive functions [39,40]. ER in juvenile animals, not unlike undernutrition in children, can disrupt brain growth, function, and behavior [3,4,5,6].
Reducing dietary ALA is used in animal models to deplete brain DHA [41,42]. In the current study, there was no additive effect to hepatic or cerebellar DHA loss when ER is combined with n-3 PUFA depletion. These findings correlate with our previous results using this juvenile undernutrition model [10].
The most prominent discoveries reported here were the >50% reduction of Mt2 in the cerebellum from ER and >50% reduction of Mt1-2 in the liver from n-3 PUFA depletion. The ER-dependent alterations of Mt-2 expression we report oppose the response, which has been described in aging animals. In older animals, microarray experiments have shown elevated Mt1 and Mt2 expression in response to ER in several rodent tissues [19,20,21]. The elevation of MTs by ER in older animals is not entirely clear, but may be a response in which MTs are regulating free radical activity, oxidative stress, apoptotic activity, and metal homeostasis. This notion is supported by the fact that overexpression of MTs increases the mouse lifespan [43].
In certain areas of the rat brain, Mt1 and Mt3 mRNA decrease in response to a zinc-deficient diet [44]. The downregulation of cerebellar Mt2 mRNA in the ER groups of our study does not appear to be a metal-dependent response given that there was no decrease in zinc, copper, or manganese concentrations in the analyzed tissues. This observation was not unexpected since we increased the vitamin and mineral content of the diets fed to the rats undergoing ER to compensate for the reduced energy intake. This finding is evidence that a metal-independent mechanism regulates Mt2 expression within the cerebellum of juvenile rats undergoing ER.
Several studies demonstrate that MTs are induced by glucocorticoids through a GR-mediated mechanism [13,45,46,47,48]. The secretion of glucocorticoids is a well-known endocrine response to stress, and glucocorticoids bind to either the GR (Nr3c1) or mineralocorticoid receptor (MR, or Nr3c2), both of which are ubiquitously expressed. Our results agree with those published demonstrating that ER in juvenile and adult rats increases plasma CORT concentrations, the main rodent glucocorticoid [4,28,49]. Thus, the ER-dependent decreases in Mt1-2 expression are not the result of decreased plasma CORT concentrations. We did not observe a clear transcriptional relationship of Mt2 levels in the cerebellum compared with Nr3c1 or Nr3c2 levels. While we did detect an ER-dependent increase and an n-3 PUFA-dependent reduction in hepatic Nr3c1, the impact of these changes is equivocal.
While THs (thyroxine, T4, and/or triiodothyronine, T3) are best known for their functions in regulating energy metabolism and immune responses, they play important roles in brain and cerebellar development [50,51]. Previous reports demonstrate that Mt3 mRNA is reduced by thyroxine in the developing rat brain [18]. Moreover, MT mRNA and protein levels are inducible by thyroid-stimulating hormone (TSH), and their induction is considered a thyroid stress marker of autoimmune diseases [52,53]. Studies in mammals report that ER decreases TH (T3 and/or T4) in serum or plasma [54,55]. It has also been demonstrated that type 1 iodothyronine deiodinase (D1, Dio1 gene) mRNA and enzyme activity is decreased in rodent livers from ER [55,56]. The most prominent ER-dependent modifications we observed were increases in Dio1 and its mediator Thrb mRNA concentrations within the livers of the ER groups and may be part of a compensatory mechanism to regulate TH levels under ER in our model. Further studies are necessary to determine if Dio1-3, Thra, Thrb, Oatp1c1, or Mct8 play a role in regulating Mt1-2 expression in the cerebellum or liver during ER and/or n-3 PUFA deficiency.
The decrease in cerebellar Mt1-2 and increase in liver Dio1 as well as the unchanged plasma concentrations of fT3 in response to ER are inconsistent with the previous studies described above [21,54,56]. However, there are important factors to take into consideration that may help explain these discrepancies. The previous studies were initiated in adult or ageing animals, whereas our study was initiated in juvenile animals (weanling rats). The other important factors are the durations and extent of ER. We employed a mild (75% of ad libitum) 4-week dietary ER supplemented with vitamins to compensate for any effects that micro/macro-nutrients might have had. On the other hand, several ER studies utilize anywhere between 35 and 50% ER without additional vitamins and the duration of ER can vary immensely. In general, the onset of ER (juveniles vs. adults), the extent of ER (25–50%), and the duration of ER (acute vs. chronic) are influencing factors on the physiological outcomes of ER in mammals [57].
A limitation of this study is the lack of protein levels for the MT isoforms. Their small size, high cysteine level, high sequence similarity, and large number of isoforms limits the effectiveness of traditional antibody-based methods to accurately quantify each MT isoform at the protein level. However, a previous study reported that Mt1 mRNA in the cerebellum and other brain areas correlate to MT-1/2 protein by radioimmunoassay methods in rats in response to glucocorticoids [13].
The hepatic n-3 PUFA-dependent reduction in MT1-2 may be explained in part through a mechanism that involves the generation of oxidized lipids such as cyclopentenones and multiple alkenals like 4-hydroxy-2-hexenal that are formed from the oxidation of DHA and EPA [58]. Cyclopentenones and 4-hydroxyalkenals are bioactive molecules capable of activating the antioxidant response element (ARE) pathway through nuclear factor erythroid 2-related factor 2 (Nrf2) and potentially Nrf1 [58,59]. Mt1-2 contain ARE binding sites within their promoter region, and data suggest that Mt1-2 expression is elevated in an ARE/Nrf1-dependent manner [60,61]. This decrease in hepatic levels of MT1-2 from n-3 PUFA depletion in our juvenile undernutrition rat model may indicate an increased vulnerability to the hepatoxic effects associated with infections, drugs, or heavy metals against which MTs provide protection [62,63,64,65].
Subsequent studies that include multiple time points are needed to fully characterize the effects of ER on cerebellar Mt2 expression since the exact regulatory mechanism is still unclear. MTs have clear neurotoxicological and neuropathological importance. Within the brain, MTs provide neuroprotection, and several studies have demonstrated their importance in the brain injury repair process. Brain MTs are elevated in response to ischemia, bacterial lipopolysaccharides (LPS), traumatic brain injury, seizures, and psychological stress [17]. This response of brain MTs is thought to be driven by oxidative stress and neuroinflammation. Accordingly, MTs are frequently elevated in several neuropathological conditions associated with inflammation such as Alzheimer’s disease, amyotrophic lateral sclerosis (ALS), multiple sclerosis (MS), and lysosomal storage disorders (LSD) [17,66]. If MT levels in the cerebellum are permanently modified from the ER in juveniles, this may increase their susceptibility to infection, heavy metal exposures, or other stressors that could potentially impede normal brain development leading to lifelong adverse health problems.
5. Conclusions
This study enhances the limited knowledge base pertaining to the biological effects of undernutrition in juvenile animals. More specifically, we analyzed Mt expression alterations in a postnatal developmental rat model undergoing ER and/or n-3 PUFA depletion. Further studies are needed to assess the possible health and toxicological outcomes associated with the cerebellar and hepatic downregulation of a gene (Mt) that serves several important functions within tissues.
Acknowledgments
This project was supported by the USDA Agricultural Research Service project 3062-51000-053-00D. The USDA Agricultural Research Service, Plains Area, is an equal opportunity/affirmative action employer, and all agency services are available without discrimination. Mention of trade names or commercial products in this article is solely for providing specific information and does not imply recommendation or endorsement by the USDA. We thank Joseph Idso, Deborah Johnson, Craig Lacher, Dale Christopherson, and Brian Gregoire for their technical assistance.
Author Contributions
A.A.M. and M.J.P. contributed to all aspects of this work including design and execution of the experiments, analysis of the data, and writing of the manuscript.
Conflicts of Interest
The authors declare no conflict of interest.
Appendix A
ICP Wavelengths Used to Analyze Mineral Content of Diets and Liver Tissue:
| Element | Wavelength | Minimum Detection Limit |
| Ca | 315.887 nm | 101 ppb |
| Cu | 324.752 nm | 10.4 ppb |
| Fe | 259.939 nm | 11 ppb |
| Mg | 279.077 nm | 131 ppb |
| Mn | 257.610 nm | 11.3 ppb |
| P | 214.914 nm | 784 ppb |
| Zn | 213.857 nm | 16 ppb |
| Sc | 361.383 nm | used as the internal standard |
| K | 766.491 nm | 3.328 ppm |
| Na | 588.995 nm | 2.037 ppm |

Table A1.
qPCR primer sequences.
| Gene | Forward Primer | Reverse Primer |
|---|---|---|
| β-actin | GTG TGG ATT GGT GGC TCT ATC | CAG TCC GCC TAG AAG CAT TT |
| Dio1 | TAC GGG CAA GGT GCT AAT G | GTC TGC TGC CTT GAA TGA AAT C |
| Dio2 | GAA TGC CAC CTT CTT GAC TTT G | CTT GGT TCC GGT GCT TCT TA |
| Dio3 | CGC GAC GTT GAC TTC CTT AT | ATA GGC ACC ATA TGC GGA AC |
| Mct8 | CAG GAG GCA AAC CAG GAA TAT C | TGG CTG CAA ACA CCA CTA TC |
| Mt1 | CCA GAT CTC GGA ATG GAC CCC AAC | GTG CAC TTG TCC GAG GCA CCT TTG |
| Mt2 | GCG ATC TCT CGT TGA TCT CC | CAG GAG CAG GAT CCA TCT GT |
| Mt3 | TGC CCC TGT CCT ACT GGT GGT TCC | CGC CTT TGC AAA CAC AGT CCT TGG |
| Nr3c1 | GGG ACA CGA ATG AGG ATT GTA A | CAG AGG TAC TCA CAC CAT GAA C |
| Nr3c2 | GAG GAC CAC TGA GAA CAA CTA C | GGA CCT GTG ACC ATT CTC TTT |
| Oatp1c1 | GGG CAG GTG TCA GAA AGA TAA | TGA AAG CAT GAG AGT CGT ACA G |
| Thra | CGG TTA TCA CTA CCG CTG TAT C | CAC CCG CTT TGA ATC GTC TA |
| Thrb | GGC ATG TCT CTG TCG TCT TT | CGT CAC CTT CAT CAG GAG TTT |
Table A2.
ΔCt values for Mt1-3.
| ΔCT | ||||
|---|---|---|---|---|
| Tissue/Gene | SO-AL | SO-ER | CO-AL | CO-ER |
| Cerebellum | ||||
| Mt1 | 6.33 ± 0.27 | 6.65 ± 0.33 | 6.38 ± 0.37 | 6.76 ± 0.22 |
| Mt2 | 4.87 ± 0.68 | 5.89 ± 0.36 | 4.51 ± 0.48 | 5.52 ± 0.28 |
| Mt3 | 0.95 ± 0.37 | 1.08 ± 0.19 | 0.95 ± 0.30 | 1.21 ± 0.23 |
| Cerebral Cortex | ||||
| Mt1 | 6.27 ± 0.18 | 6.51 ± 0.36 | 6.58 ± 0.34 | 6.70 ± 0.27 |
| Mt2 | 5.52 ± 0.32 | 5.93 ± 0.31 | 5.78 ± 0.52 | 6.05 ± 0.27 |
| Mt3 | 1.88 ± 0.13 | 1.95 ± 0.14 | 1.98 ± 0.17 | 2.03 ± 0.14 |
| Hippocampus | ||||
| Mt1 | 6.54 ± 0.16 | 6.62 ± 0.22 | 6.50 ± 0.22 | 6.47 ± 0.18 |
| Mt2 | 5.51 ± 0.16 | 5.79 ± 0.27 | 5.50 ± 0.31 | 5.73 ± 0.16 |
| Mt3 | 2.08 ± 0.14 | 2.03 ± 0.15 | 2.17 ± 0.13 | 2.10 ± 0.08 |
| Liver | ||||
| Mt1 | −1.08 ± 0.62 | −0.95 ± 0.73 | 0.19 ± 0.78 | −0.60 ± 0.35 |
| Mt2 | 0.18 ± 0.67 | 0.35 ± 0.91 | 1.64 ± 1.00 | 0.76 ± 0.46 |
| Mt3† | 15.67 ± 0.59 | 15.45 ± 0.80 | 16.05 ± 0.63 | 14.69 ± 1.56 |
Data are reported as mean ± SD, n = 8. AL: ad libitum; CO: corn oil; ER: energy restriction; Mt1-3: metallothionein 1-3; SO: soybean oil; ΔCt: change in cycle threshold normalized to β-actin. † signifies that the gene is not considered expressed in this tissue.
Table A3.
ΔCt values for glucocorticoid and mineralocorticoid receptors.
| ΔCt | ||||
|---|---|---|---|---|
| Tissue/Gene | SO-AL | SO-ER | CO-AL | CO-ER |
| Cerebellum | ||||
| Nr3c1 | 11.10 ± 0.46 | 11.09 ± 0.51 | 11.49 ± 0.33 | 11.19 ± 0.32 |
| Nr3c2 | 6.81 ± 0.24 | 6.68 ± 0.16 | 6.57 ± 0.21 | 6.62 ± 0.24 |
| Cerebral Cortex | ||||
| Nr3c1 | 9.32 ± 0.49 | 9.29 ± 0.46 | 9.30 ± 0.28 | 9.34 ± 0.38 |
| Nr3c2 | 7.48 ± 0.36 | 7.40 ± 0.30 | 7.33 ± 0.30 | 7.13 ± 0.26 |
| Hippocampus | ||||
| Nr3c1 | 6.31 ± 0.12 | 6.28 ± 0.17 | 6.21 ± 0.17 | 6.42 ± 0.26 |
| Nr3c2 | 6.40 ± 1.40 | 5.92 ± 0.37 | 5.60 ± 0.23 | 5.71 ± 0.15 |
| Liver | ||||
| Nr3c1 | 3.78 ± 0.26 | 2.99 ± 0.49 | 4.05 ± 0.17 | 3.36 ± 0.35 |
| Nr3c2 | 8.54 ± 1.15 | 8.03 ± 0.87 | 8.32 ± 0.72 | 8.00 ± 0.48 |
Data are reported as mean ± SD, n = 8. AL: ad libitum; CO: corn oil; ER: energy restriction; Nr3c1, nuclear receptor subfamily 3 group C member 1; Nr3c2, nuclear receptor subfamily 3 group C member 2; SO: soybean oil; ΔCt: change in cycle threshold normalized to β-actin.
Table A4.
ΔCt values for TH mediators.
| ΔCt | ||||
|---|---|---|---|---|
| Tissue/Gene | SO-AL | SO-ER | CO-AL | CO-ER |
| Cerebellum | ||||
| Dio1 | 11.95 ± 0.35 | 11.88 ± 0.42 | 12.02 ± 0.31 | 11.98 ± 0.45 |
| Dio2 | 5.38 ± 0.26 | 5.19 ± 0.19 | 5.41 ± 0.26 | 5.29 ± 0.16 |
| Dio3 | 13.04 ± 0.64 | 12.76 ± 0.28 | 13.32 ± 0.39 | 12.91 ± 0.34 |
| Mct8 | 13.06 ± 0.80 | 13.07 ± 1.08 | 13.34 ± 1.09 | 14.09 ± 0.46 |
| Oatp1c1 | 4.72 ± 0.28 | 4.78 ± 0.25 | 4.92 ± 0.37 | 5.27 ± 0.46 |
| Thra | 4.79 ± 0.09 | 4.73 ± 0.12 | 4.93 ± 0.09 | 4.78 ± 0.15 |
| Thrb | 9.65 ± 0.60 | 9.76 ± 0.18 | 10.10 ± 0.18 | 9.98 ± 0.24 |
| Cerebral Cortex | ||||
| Dio1 | 14.00 ± 1.80 | 13.51 ± 1.21 | 13.19 ± 1.67 | 13.76 ± 0.87 |
| Dio2 | 5.61 ± 0.18 | 5.35 ± 0.24 | 5.15 ± 0.14 | 5.26 ± 0.31 |
| Dio3 | 11.03 ± 0.62 | 11.62 ± 0.67 | 10.95 ± 0.95 | 10.71 ± 1.13 |
| Mct8 | 13.98 ± 0.39 | 13.99 ± 0.30 | 13.83 ± 0.46 | 13.69 ± 0.32 |
| Oatp1c1 | 5.41 ± 0.12 | 5.50 ± 0.27 | 5.44 ± 0.27 | 5.84 ± 0.30 |
| Thra | 3.95 ± 0.09 | 3.84 ± 0.13 | 3.70 ± 0.15 | 3.61 ± 0.18 |
| Thrb | 6.91 ± 0.20 | 6.67 ± 0.26 | 6.62 ± 0.17 | 6.51 ± 0.17 |
| Hippocampus | ||||
| Dio1 | 14.49 ± 1.24 | 13.93 ± 1.30 | 14.16 ± 1.23 | 14.28 ± 1.18 |
| Dio2 | 5.53 ± 0.16 | 5.39 ± 0.18 | 5.50 ± 0.21 | 5.45 ± 0.26 |
| Dio3 | 11.33 ± 0.62 | 11.02 ± 0.76 | 10.85 ± 0.97 | 10.97 ± 0.85 |
| Mct8 | 12.49 ± 0.46 | 12.39 ± 0.52 | 12.32 ± 0.28 | 12.42 ± 0.42 |
| Oatp1c1 | 5.47 ± 0.38 | 5.41 ± 0.31 | 5.42 ± 0.20 | 5.37 ± 0.22 |
| Thra | 2.82 ± 0.24 | 2.75 ± 0.22 | 2.67 ± 0.22 | 2.62 ± 0.19 |
| Thrb | 6.96 ± 0.17 | 6.75 ± 0.29 | 6.84 ± 0.55 | 6.63 ± 0.37 |
| Liver | ||||
| Dio1 | 1.43 ± 0.37 | 0.68 ± 0.33 | 1.75 ± 0.36 | 0.87 ± 0.41 |
| Dio2† | 11.85 ± 0.95 | 13.24 ± 3.13 | 13.27 ± 1.04 | 13.52 ± 1.55 |
| Dio3 | 11.61 ± 0.98 | 12.13 ± 1.60 | 12.72 ± 1.04 | 12.37 ± 1.07 |
| Mct8 | 8.33 ± 0.41 | 8.29 ± 0.36 | 8.77 ± 0.40 | 8.71 ± 0.36 |
| Oatp1c1† | 16.03 ± 1.01 | 15.65 ± 0.91 | 16.43 ± 1.19 | 16.02 ± 0.43 |
| Thra | 6.13 ± 0.18 | 6.92 ± 0.14 | 6.25 ± 0.19 | 6.95 ± 0.24 |
| Thrb | 5.03 ± 0.18 | 4.32 ± 0.16 | 5.31 ± 0.14 | 4.61 ± 0.25 |
Data are reported as mean ± SD, n = 8. AL: ad libitum; CO: corn oil; Dio1-3: deiodinase 1-3; ER: energy restriction; Mct8: monocarboxylate transporter 8; Oatp1c1: solute carrier organic anion transporter family member 1C1; SO: soybean oil; Thra: thyroid hormone receptor alpha; Thrb: thyroid hormone receptor beta; ΔCt: change in cycle threshold normalized to β-actin. † signifies that the gene is not considered expressed in this tissue.
Table A5.
qPCR Ct values for β-actin.
| Tissue/Gene | SO-AL | SO-ER | CO-AL | CO-ER | pa | pb | pc |
|---|---|---|---|---|---|---|---|
| Cerebellum | |||||||
| β-actin | 14.92 ± 0.18 | 14.81 ± 0.12 | 14.81 ± 0.29 | 14.59 ± 0.20 | 0.73 | 0.15 | 0.75 |
| Cerebral Cortex | |||||||
| β-actin | 14.11 ± 0.27 | 14.00 ± 0.12 | 14.21 ± 0.24 | 14.20 ± 0.21 | 0.72 | >0.99 | 0.82 |
| Hippocampus | |||||||
| β-actin | 14.26 ± 0.22 | 14.13 ± 0.19 | 14.06 ± 0.21 | 14.11 ± 0.19 | 0.57 | 0.95 | 0.20 |
| Liver | |||||||
| β-actin | 16.83 ± 0.33 | 17.15 ± 0.25 | 16.55 ± 0.24 | 16.81 ± 0.25 | 0.11 | 0.22 | 0.17 |
Data are reported as mean ± SD, n = 8. Two-way ANOVA was performed on the Ct. Values in each tissue. pa comparing SO with SO-ER; pb comparing CO with CO-ER; pc comparing SO with CO. AL: ad libitum; CO: corn oil; ER: energy restriction; SO: soybean oil; Ct: cycle threshold.
References
- Hulzebos, C.V.; Sauer, P.J. Energy requirements. Semin. Fetal Neonatal Med. 2007, 12, 2–10. [Google Scholar] [PubMed]
- WHO. Global nutrition targets 2025: stunting policy brief. (WHO/NMH/NHD/14.3); World Health Organization: Geneva, Switzerland, 2014. [Google Scholar]
- Cardoso, A.; Marrana, F.; Andrade, J.P. Caloric restriction in young rats disturbs hippocampal neurogenesis and spatial learning. Neurobiol. Learn. Mem. 2016, 133, 214–224. [Google Scholar] [CrossRef] [PubMed]
- Jahng, J.W.; Kim, J.G.; Kim, H.J.; Kim, B.T.; Kang, D.W.; Lee, J.H. Chronic food restriction in young rats results in depression- and anxiety-like behaviors with decreased expression of serotonin reuptake transporter. Brain Res. 2007, 1150, 100–107. [Google Scholar] [PubMed]
- Messaoudi, I.; Fischer, M.; Warner, J.; Park, B.; Mattison, J.; Ingram, D.K.; Totonchy, T.; Mori, M.; Nikolich-Zugich, J. Optimal window of caloric restriction onset limits its beneficial impact on T-cell senescence in primates. Aging Cell 2008, 7, 908–919. [Google Scholar] [CrossRef] [PubMed]
- Remmers, F.; Verhagen, L.A.; Adan, R.A.; Delemarre-van de Waal, H.A. Hypothalamic neuropeptide expression of juvenile and middle-aged rats after early postnatal food restriction. Endocrinology 2008, 149, 3617–3625. [Google Scholar] [CrossRef] [PubMed]
- Innis, S.M. Dietary (n-3) fatty acids and brain development. J. Nutr. 2007, 137, 855–859. [Google Scholar] [PubMed]
- Madore, C.; Nadjar, A.; Delpech, J.C.; Sere, A.; Aubert, A.; Portal, C.; Joffre, C.; Laye, S. Nutritional n-3 PUFAs deficiency during perinatal periods alters brain innate immune system and neuronal plasticity-associated genes. Brain Behav. Immun. 2014, 41, 22–31. [Google Scholar] [CrossRef] [PubMed]
- Ximenes da Silva, A.; Lavialle, F.; Gendrot, G.; Guesnet, P.; Alessandri, J.M.; Lavialle, M. Glucose transport and utilization are altered in the brain of rats deficient in n-3 polyunsaturated fatty acids. J. Neurochem. 2002, 81, 1328–1337. [Google Scholar] [PubMed]
- Picklo, M.J., Sr; Johnson, L.; Idso, J. PPAR mRNA Levels Are Modified by Dietary n-3 Fatty Acid Restriction and Energy Restriction in the Brain and Liver of Growing Rats. J. Nutr. 2017, 147, 161–169. [Google Scholar] [PubMed]
- Aschner, M. The functional significance of brain metallothioneins. FASEB J. 1996, 10, 1129–1136. [Google Scholar] [PubMed]
- Carrasco, J.; Penkowa, M.; Hadberg, H.; Molinero, A.; Hidalgo, J. Enhanced seizures and hippocampal neurodegeneration following kainic acid-induced seizures in metallothionein-I + II-deficient mice. Eur. J. Neurosci. 2000, 12, 2311–2322. [Google Scholar] [CrossRef] [PubMed]
- Hidalgo, J.; Belloso, E.; Hernandez, J.; Gasull, T.; Molinero, A. Role of Glucocorticoids on Rat Brain Metallothionein-I and -III Response to Stress. Stress 1997, 1, 231–240. [Google Scholar] [CrossRef] [PubMed]
- Hozumi, I.; Suzuki, J.S.; Kanazawa, H.; Hara, A.; Saio, M.; Inuzuka, T.; Miyairi, S.; Naganuma, A.; Tohyama, C. Metallothionei n-3 is expressed in the brain and various peripheral organs of the rat. Neurosci. Lett. 2008, 438, 54–58. [Google Scholar] [CrossRef] [PubMed]
- Szrok, S.; Stelmanska, E.; Turyn, J.; Bielicka-Gieldon, A.; Sledzinski, T.; Swierczynski, J. Metallothioneins 1 and 2, but not 3, are regulated by nutritional status in rat white adipose tissue. Genes Nutr. 2016, 11, 18. [Google Scholar] [CrossRef] [PubMed]
- Quaife, C.J.; Findley, S.D.; Erickson, J.C.; Froelick, G.J.; Kelly, E.J.; Zambrowicz, B.P.; Palmiter, R.D. Induction of a new metallothionein isoform (MT-IV) occurs during differentiation of stratified squamous epithelia. Biochemistry 1994, 33, 7250–7259. [Google Scholar] [CrossRef] [PubMed]
- West, A.K.; Hidalgo, J.; Eddins, D.; Levin, E.D.; Aschner, M. Metallothionein in the central nervous system, Roles in protection, regeneration and cognition. Neurotoxicology 2008, 29, 489–503. [Google Scholar] [CrossRef] [PubMed]
- Yeiser, E.C.; Fitch, C.A.; Horning, M.S.; Rutkoski, N.; Levenson, C.W. Regulation of metallothionei n-3 mRNA by thyroid hormone in developing rat brain and primary cultures of rat astrocytes and neurons. Dev. Brain Res. 1999, 115, 195–200. [Google Scholar] [CrossRef]
- Swindell, W.R. Comparative analysis of microarray data identifies common responses to caloric restriction among mouse tissues. Mech. Ageing Dev. 2008, 129, 138–153. [Google Scholar] [CrossRef] [PubMed]
- Swindell, W.R. Genes regulated by caloric restriction have unique roles within transcriptional networks. Mech. Ageing Dev. 2008, 129, 580–592. [Google Scholar] [CrossRef] [PubMed]
- Swindell, W.R. Genes and gene expression modules associated with caloric restriction and aging in the laboratory mouse. BMC Genomics 2009, 10, 585. [Google Scholar] [CrossRef] [PubMed]
- Olivo-Marston, S.E.; Zhu, Y.; Lee, R.Y.; Cabanes, A.; Khan, G.; Zwart, A.; Wang, Y.; Clarke, R.; Hilakivi-Clarke, L. Gene signaling pathways mediating the opposite effects of prepubertal low-fat and high-fat n-3 polyunsaturated fatty acid diets on mammary cancer risk. Cancer Prev. Res. 2008, 1, 532–545. [Google Scholar] [CrossRef] [PubMed]
- Beattie, J.H.; Wood, A.M.; Newman, A.M.; Bremner, I.; Choo, K.H.; Michalska, A.E.; Duncan, J.S.; Trayhurn, P. Obesity and hyperleptinemia in metallothionein (-I and -II) null mice. Proc. Natl. Acad. Sci. USA 1998, 95, 358–363. [Google Scholar] [CrossRef] [PubMed]
- Dong, F.; Li, Q.; Sreejayan, N.; Nunn, J.M.; Ren, J. Metallothionein prevents high-fat diet induced cardiac contractile dysfunction, role of peroxisome proliferator activated receptor gamma coactivator 1alpha and mitochondrial biogenesis. Diabetes 2007, 56, 2201–2212. [Google Scholar] [CrossRef] [PubMed]
- Sato, M.; Kawakami, T.; Kondoh, M.; Takiguchi, M.; Kadota, Y.; Himeno, S.; Suzuki, S. Development of high-fat-diet-induced obesity in female metallothionein-null mice. FASEB J. 2010, 24, 2375–2384. [Google Scholar] [CrossRef] [PubMed]
- Lindeque, J.Z.; Jansen van Rensburg, P.J.; Louw, R.; van der Westhuizen, F.H.; Florit, S.; Ramirez, L.; Giralt, M.; Hidalgo, J. Obesity and metabolomics, metallothioneins protect against high-fat diet-induced consequences in metallothionein knockout mice. Omics 2015, 19, 92–103. [Google Scholar] [CrossRef] [PubMed]
- Herlihy, J.T.; Stacy, C.; Bertrand, H.A. Long-term food restriction depresses serum thyroid hormone concentrations in the rat. Mech. Ageing Dev. 1990, 53, 9–16. [Google Scholar] [CrossRef]
- Levay, E.A.; Tammer, A.H.; Penman, J.; Kent, S.; Paolini, A.G. Calorie restriction at increasing levels leads to augmented concentrations of corticosterone and decreasing concentrations of testosterone in rats. Nutr. Res. 2010, 30, 366–373. [Google Scholar] [CrossRef] [PubMed]
- Kelly, E.J.; Sandgren, E.P.; Brinster, R.L.; Palmiter, R.D. A pair of adjacent glucocorticoid response elements regulate expression of two mouse metallothionein genes. Proc. Natl. Acad. Sci. USA 1997, 94, 10045–10050. [Google Scholar] [CrossRef] [PubMed]
- Reeves, P.G. Components of the AIN-93 diets as improvements in the AIN-76A diet. J. Nutr. 1997, 127, 838s–841s. [Google Scholar] [PubMed]
- Picklo, M.J.; Thyfault, J.P. Vitamin E and vitamin C do not reduce insulin sensitivity but inhibit mitochondrial protein expression in exercising obese rats. Appl. Physiol. Nutr. Metab. 2015, 40, 343–352. [Google Scholar] [CrossRef] [PubMed]
- Picklo, M.J.; Murphy, E.J. A High-Fat, High-Oleic Diet, But Not a High-Fat, Saturated Diet, Reduces Hepatic α-Linolenic Acid and Eicosapentaenoic Acid Content in Mice. Lipids 2016, 51, 537–547. [Google Scholar] [CrossRef] [PubMed]
- Thavarajah, D.; Thavarajah, P.; Vial, E.; Gebhardt, M.; Lacher, C.; Kumar, S.; Combs, G.F. Will selenium increase lentil (Lens culinaris Medik) yield and seed quality? Front Plant Sci. 2015, 6, 356. [Google Scholar] [CrossRef] [PubMed]
- Palmiter, R.D.; Findley, S.D.; Whitmore, T.E.; Durnam, D.M. MT-III, a brain-specific member of the metallothionein gene family. Proc. Natl. Acad. Sci. USA 1992, 89, 6333–6337. [Google Scholar] [CrossRef] [PubMed]
- Velazquez, R.A.; Cai, Y.; Shi, Q.; Larson, A.A. The distribution of zinc selenite and expression of metallothionein-III mRNA in the spinal cord and dorsal root ganglia of the rat suggest a role for zinc in sensory transmission. J. Neurosci. 1999, 19, 2288–2300. [Google Scholar] [PubMed]
- Kobayashi, K.; Kuroda, J.; Shibata, N.; Hasegawa, T.; Seko, Y.; Satoh, M.; Tohyama, C.; Takano, H.; Imura, N.; Sakabe, K.; et al. Induction of metallothionein by manganese is completely dependent on interleukin-6 production. J. Pharmacol. Exp. Ther. 2007, 320, 721–727. [Google Scholar] [CrossRef] [PubMed]
- Neville, H.E.; Chase, H.P. Undernutrition and cerebellar development. Exp. Neurol. 1971, 33, 485–497. [Google Scholar] [CrossRef]
- Lesnik, P.G.; Ciesielski, K.T.; Hart, B.L.; Benzel, E.C.; Sanders, J.A. Evidence for cerebellar-frontal subsystem changes in children treated with intrathecal chemotherapy for leukemia, enhanced data analysis using an effect size model. Arch. Neurol. 1998, 55, 1561–1568. [Google Scholar] [CrossRef] [PubMed]
- Tiemeier, H.; Lenroot, R.K.; Greenstein, D.K.; Tran, L.; Pierson, R.; Giedd, J.N. Cerebellum development during childhood and adolescence, a longitudinal morphometric MRI study. Neuroimage 2010, 49, 63–70. [Google Scholar] [CrossRef] [PubMed]
- Riva, D.; Giorgi, C. The cerebellum contributes to higher functions during development, evidence from a series of children surgically treated for posterior fossa tumours. Brain 2000, 123 Pt 5, 1051–1061. [Google Scholar] [CrossRef] [PubMed]
- Bourre, J.M.; Durand, G.; Pascal, G.; Youyou, A. Brain cell and tissue recovery in rats made deficient in n-3 fatty acids by alteration of dietary fat. J. Nutr. 1989, 119, 15–22. [Google Scholar] [PubMed]
- Carrie, I.; Smirnova, M.; Clement, M.; De, J.D.; Frances, H.; Bourre, J.M. Docosahexaenoic acid-rich phospholipid supplementation, effect on behavior, learning ability, and retinal function in control and n-3 polyunsaturated fatty acid deficient old mice. Nutr. Neurosci. 2002, 5, 43–52. [Google Scholar] [CrossRef] [PubMed]
- Yang, X.; Doser, T.A.; Fang, C.X.; Nunn, J.M.; Janardhanan, R.; Zhu, M.; Sreejayan, N.; Quinn, M.T.; Ren, J. Metallothionein prolongs survival and antagonizes senescence-associated cardiomyocyte diastolic dysfunction, role of oxidative stress. FASEB J. 2006, 20, 1024–1026. [Google Scholar] [CrossRef] [PubMed]
- Giralt, M.; Molinero, A.; Carrasco, J.; Hidalgo, J. Effect of dietary zinc deficiency on brain metallothionein-I and -III mRNA levels during stress and inflammation. Neurochem. Int. 2000, 36, 555–562. [Google Scholar] [CrossRef]
- Ghoshal, K.; Wang, Y.; Sheridan, J.F.; Jacob, S.T. Metallothionein induction in response to restraint stress. Transcriptional control, adaptation to stress, and role of glucocorticoid. J. Bio.l Chem. 1998, 273, 27904–27910. [Google Scholar] [CrossRef]
- Hidalgo, J.; Campmany, L.; Marti, O.; Armario, A. Metallothionein-I induction by stress in specific brain areas. Neurochem. Res. 1991, 16, 1145–1148. [Google Scholar] [CrossRef] [PubMed]
- Jacob, S.T.; Ghoshal, K.; Sheridan, J.F. Induction of metallothionein by stress and its molecular mechanisms. Gene Expr. 1999, 7, 301–310. [Google Scholar] [PubMed]
- Mayo, K.E.; Palmiter, R.D. Glucocorticoid regulation of metallothionein-I mRNA synthesis in cultured mouse cells. J. Bio.l Chem. 1981, 256, 2621–2624. [Google Scholar]
- Gursoy, E.; Cardounel, A.; Hu, Y.; Kalimi, M. Biological effects of long-term caloric restriction, adaptation with simultaneous administration of caloric stress plus repeated immobilization stress in rats. Exp. Biol. Med. 2001, 226, 97–102. [Google Scholar] [CrossRef]
- Koibuchi, N. The role of thyroid hormone on cerebellar development. Cerebellum 2008, 7, 530–533. [Google Scholar] [CrossRef] [PubMed]
- De Vito, P.; Incerpi, S.; Pedersen, J.Z.; Luly, P.; Davis, F.B.; Davis, P.J. Thyroid hormones as modulators of immune activities at the cellular level. Thyroid 2011, 21, 879–890. [Google Scholar] [CrossRef] [PubMed]
- Back, C.M.; Stohr, S.; Schafer, E.A.; Biebermann, H.; Boekhoff, I.; Breit, A.; Gudermann, T.; Buch, T.R. TSH induces metallothionein 1 in thyrocytes via Gq/11- and PKC-dependent signaling. J. Mol. Endocrinol. 2013, 51, 79–90. [Google Scholar] [CrossRef] [PubMed]
- Ruiz-Riol, M.; Martinez-Arconada, M.J.; Alonso, N.; Soldevila, B.; Marchena, D.; Armengol, M.P.; Sanmarti, A.; Pujol-Borrell, R.; Martinez-Caceres, E.M. Overexpression of metallothionein I/II, a new feature of thyroid follicular cells in Graves’ disease. J. Clin. Endocrinol. Metab. 2012, 97, 446–454. [Google Scholar] [CrossRef] [PubMed]
- Ravussin, E.; Redman, L.M.; Rochon, J.; Das, S.K.; Fontana, L.; Kraus, W.E.; Romashkan, S.; Williamson, D.A.; Meydani, S.N.; Villareal, D.T.; et al. A 2-Year Randomized Controlled Trial of Human Caloric Restriction, Feasibility and Effects on Predictors of Health Span and Longevity. J. Gerontol. A-Biol. Sci. Med. Sci. 2015, 70, 1097–1104. [Google Scholar] [CrossRef] [PubMed]
- Araujo, R.L.; de Andrade, B.M.; de Figueiredo, A.S.; da Silva, M.L.; Marassi, M.P.; Pereira Vdos, S.; Bouskela, E.; Carvalho, D.P. Low replacement doses of thyroxine during food restriction restores type 1 deiodinase activity in rats and promotes body protein loss. J. Endocrinol. 2008, 198, 119–125. [Google Scholar] [CrossRef] [PubMed]
- Cao, S.X.; Dhahbi, J.M.; Mote, P.L.; Spindler, S.R. Genomic profiling of short- and long-term caloric restriction effects in the liver of aging mice. Proc. Natl. Acad. Sci. USA 2001, 98, 10630–10635. [Google Scholar] [CrossRef] [PubMed]
- Heilbronn, L.K.; Ravussin, E. Calorie restriction and aging, review of the literature and implications for studies in humans. Am. J. Clin. Nutr. 2003, 78, 361–369. [Google Scholar] [PubMed]
- Long, E.K.; Picklo, M.J., Sr. Trans-4-hydroxy-2-hexenal, a product of n-3 fatty acid peroxidation, make some room HNE. Free Radic. Biol. Med. 2010, 49, 1–8. [Google Scholar] [PubMed]
- Gao, L.; Wang, J.; Sekhar, K.R.; Yin, H.; Yared, N.F.; Schneider, S.N.; Sasi, S.; Dalton, T.P.; Anderson, M.E.; Chan, J.Y.; et al. Novel n-3 fatty acid oxidation products activate Nrf2 by destabilizing the association between Keap1 and Cullin3. J. Biol. Chem. 2007, 282, 2529–2537. [Google Scholar] [CrossRef] [PubMed]
- Van Lookeren Campagne, M.; Thibodeaux, H.; van Bruggen, N.; Cairns, B.; Lowe, D.G. Increased binding activity at an antioxidant-responsive element in the metallothionein-1 promoter and rapid induction of metallothionein-1 and -2 in response to cerebral ischemia and reperfusion. J. Neurosci. 2000, 20, 5200–5207. [Google Scholar] [PubMed]
- Ohtsuji, M.; Katsuoka, F.; Kobayashi, A.; Aburatani, H.; Hayes, J.D.; Yamamoto, M. Nrf1 and Nrf2 play distinct roles in activation of antioxidant response element-dependent genes. J. Biol. Chem. 2008, 283, 33554–33562. [Google Scholar] [CrossRef] [PubMed]
- Liu, J.; Liu, Y.; Hartley, D.; Klaassen, C.D.; Shehin-Johnson, S.E.; Lucas, A.; Cohen, S.D. Metallothionein-I/II knockout mice are sensitive to acetaminophen-induced hepatotoxicity. J. Pharmacol. Exp. Ther. 1999, 289, 580–586. [Google Scholar] [PubMed]
- Klaassen, C.D.; Liu, J.; Diwan, B.A. Metallothionein Protection of Cadmium Toxicity. Toxicol. Appl. Pharmacol. 2009, 238, 215–220. [Google Scholar] [CrossRef] [PubMed]
- Kimura, T.; Itoh, N.; Takehara, M.; Oguro, I.; Ishizaki, J.I.; Nakanishi, T.; Tanaka, K. Sensitivity of metallothionein-null mice to LPS/d-galactosamine-induced lethality. Biochem. Biophys. Res. Commun. 2001, 280, 358–362. [Google Scholar] [CrossRef] [PubMed]
- Inoue, K.; Takano, H.; Shimada, A.; Satoh, M. Metallothionein as an Anti-Inflammatory Mediator. Mediat. Inflamm. 2009, 2009, 101659. [Google Scholar] [CrossRef] [PubMed]
- Cesani, M.; Cavalca, E.; Macco, R.; Leoncini, G.; Terreni, M.R.; Lorioli, L.; Furlan, R.; Comi, G.; Doglioni, C.; Zacchetti, D.; et al. Metallothioneins as dynamic markers for brain disease in lysosomal disorders. Ann. Neurol. 2014, 75, 127–137. [Google Scholar] [CrossRef] [PubMed] [Green Version]
Figure 1.
Energy intake of the experimental groups. Growing male rats at 3 weeks of age were fed AIN93G-based diets formulated to provide 16% of energy as fat derived from SO or CO. SO-ER and CO-ER rats were individually fed 75% of the diet amount of the SO-AL and CO-AL rats, respectively. For clarity of the graph, data are presented for every 3rd day on diet. Comparisons of food consumption by two-way ANOVA demonstrated no effect of oil type. Data are reported as mean ± SD; n = 8. AL: ad libitum; CO: corn oil; ER: energy restriction; SO: soybean oil.
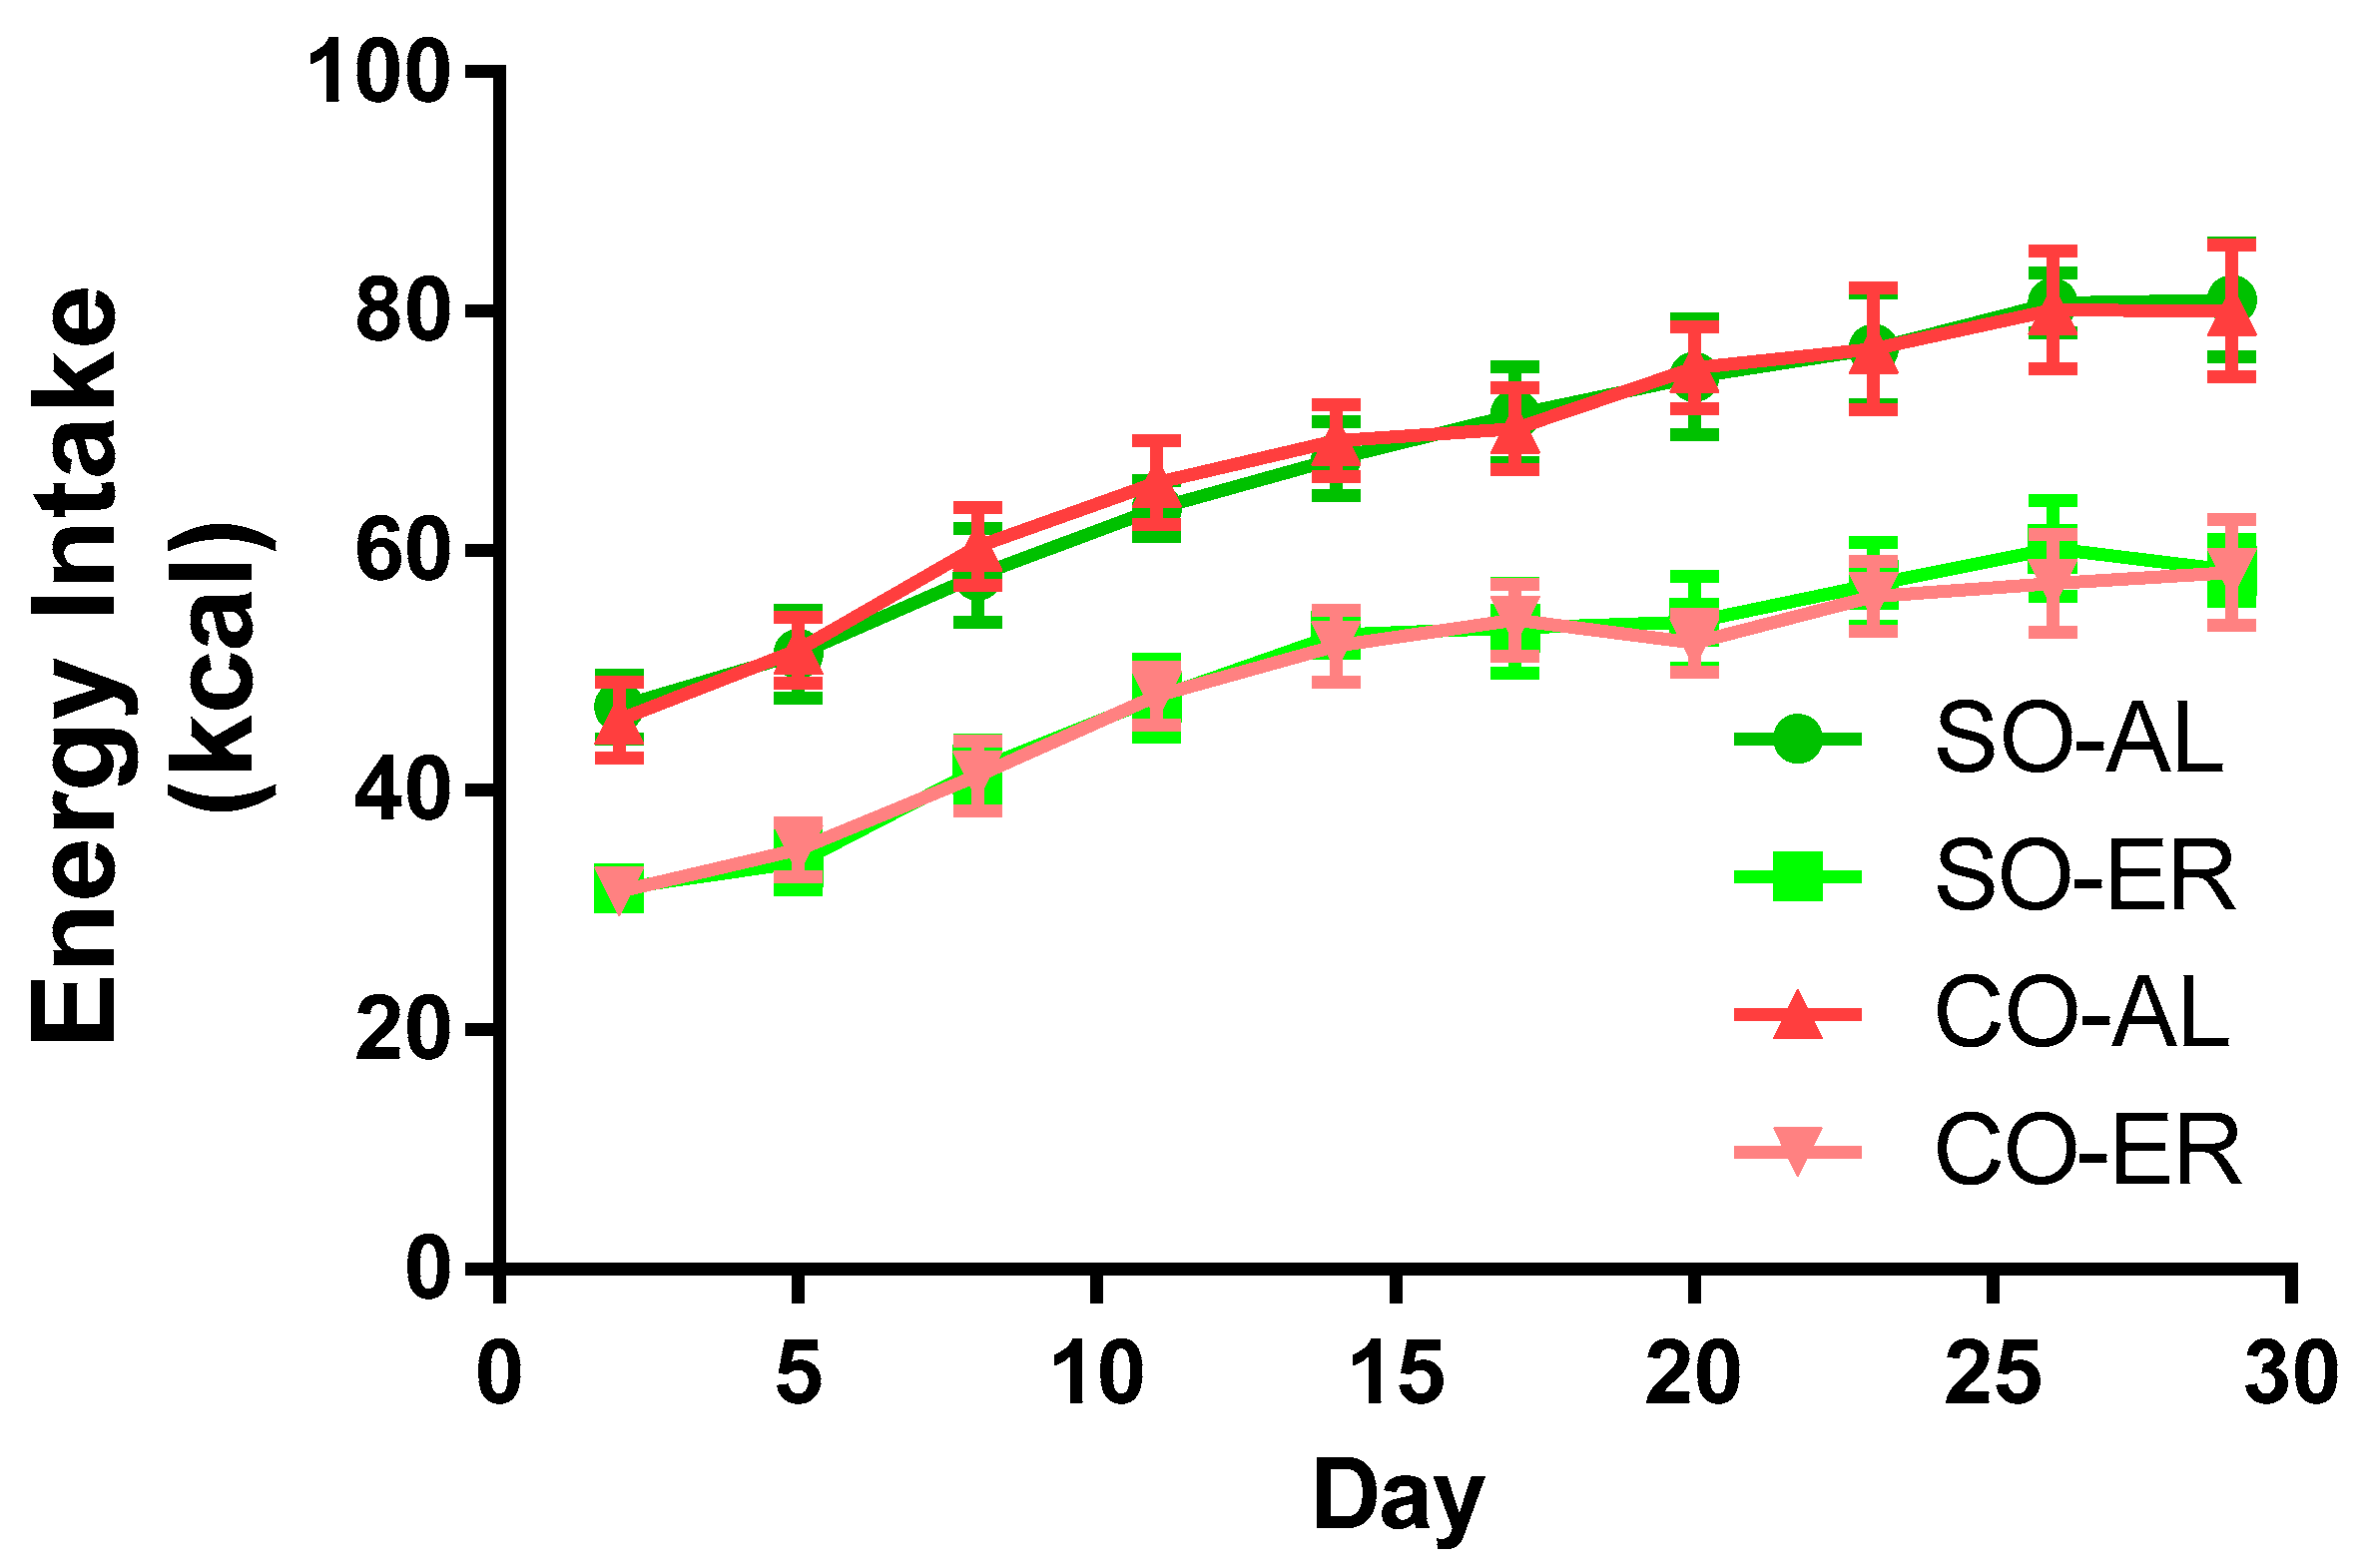
Table 1.
Body composition in growing male rats.
| p | |||||||
|---|---|---|---|---|---|---|---|
| Endpoint | SO-AL | SO-ER | CO-AL | CO-ER | Energy | Oil | Energy X Oil |
| Body Mass (g) | |||||||
| Begin | 54.6 ± 1.7 | 54.7 ± 1.6 | 54.5 ± 1.7 | 54.3 ± 2.4 | 0.92 | 0.72 | 0.83 |
| End | 258.4 ± 9.4 | 197.5 ± 7.5 | 251.0 ± 10.8 | 192.3 ± 10.0 | <0.01 | 0.07 | 0.75 |
| Liver Mass (g) | 7.6 ± 0.4 | 6.5 ± 0.7 | 7.2 ± 0.8 | 6.0 ± 0.7 | <0.01 | 0.07 | 0.71 |
| Brain Mass (g) | 1.6 ± 0.1 | 1.6 ± 0.1 | 1.7 ± 0.1 | 1.6 ± 0.1 | 0.01 | 0.82 | 0.38 |
| Brain/Body (%) | 0.63 ± 0.03 | 0.80 ± 0.04 | 0.66 ± 0.02 | 0.81 ± 0.06 | <0.01 | 0.25 | 0.65 |
Data are reported as mean ± SD, n = 8. Two-way ANOVA was performed for each parameter. Bold indicates significance, p < 0.05. AL: ad libitum; CO: corn oil; ER: energy restriction; SO: soybean oil.
Table 2.
Tissue expression of metallothionein mRNA.
| mRNA Fold-Change Compared with SO-AL | p | ||||||
|---|---|---|---|---|---|---|---|
| Tissue/Gene | SO-AL | SO-ER | CO-AL | CO-ER | Energy | Oil | Energy X Oil |
| Cerebellum | |||||||
| Mt1 | 1.02 ± 0.18 | 0.82 ± 0.19 | 0.99 ± 0.26 | 0.75 ± 0.12 | <0.01 | 0.44 | 0.79 |
| Mt2 | 1.11 ± 0.61 | 0.50 ± 0.12 | 1.34 ± 0.45 | 0.64 ± 0.11 | <0.01 | 0.04 | 0.97 |
| Mt3 | 1.03 ± 0.29 | 0.92 ± 0.12 | 1.02 ± 0.22 | 0.84 ± 0.14 | 0.06 | 0.48 | 0.51 |
| Cerebral Cortex | |||||||
| Mt1 | 1.00 ± 0.13 | 0.87 ± 0.21 | 0.83 ± 0.21 | 0.76 ± 0.14 | 0.10 | 0.03 | 0.57 |
| Mt2 | 1.02 ± 0.27 | 0.77 ± 0.17 | 0.88 ± 0.32 | 0.70 ± 0.12 | 0.02 | 0.15 | 0.62 |
| Mt3 | 1.00 ± 0.09 | 0.96 ± 0.09 | 0.94 ± 0.11 | 0.91 ± 0.09 | 0.23 | 0.10 | 0.86 |
| Hippocampus | |||||||
| Mt1 | 1.01 ± 0.11 | 0.96 ± 0.15 | 1.04 ± 0.16 | 1.06 ± 0.12 | 0.72 | 0.18 | 0.42 |
| Mt2 | 1.01 ± 0.12 | 0.84 ± 0.16 | 1.03 ± 0.22 | 0.86 ± 0.10 | <0.01 | 0.69 | 0.75 |
| Mt3 | 1.00 ± 0.10 | 1.04 ± 0.11 | 0.94 ± 0.09 | 0.99 ± 0.06 | 0.21 | 0.08 | 0.81 |
| Liver | |||||||
| Mt1 | 1.08 ± 0.40 A | 1.01 ± 0.44 A | 0.47 ± 0.24 B | 0.73 ± 0.18 A,B | 0.16 | <0.01 | 0.05 |
| Mt2 | 1.09 ± 0.48 | 1.05 ± 0.58 | 0.44 ± 0.27 | 0.70 ± 0.22 | 0.21 | <0.01 | 0.07 |
| Mt3 † | - | - | - | - | - | - | - |
Data are reported as mean ± SD, n = 8. Two-way ANOVA was performed on the initial ΔCt values for each gene. Labeled means in a row without a common superscript letter differ, p ≤ 0.05. Bold indicates significance. AL: ad libitum; CO: corn oil; ER: energy restriction; Mt1-3: metallothionein 1-3; SO: soybean oil; ΔCt: change in cycle threshold normalized to β-actin; † signifies that the gene is not considered expressed in this tissue (ΔCt values reported in Appendix A, Table A1).
Table 3.
Polyunsaturated fatty acid (PUFA) concentration in the liver of juvenile male rats.
| Tissue Concentration, µmol/g | p | ||||||
|---|---|---|---|---|---|---|---|
| FAs | SO-AL | SO-ER | CO-AL | CO-ER | Energy | Oil | Energy X Oil |
| n-6 PUFAs | |||||||
| 18:2 | 21.33 ± 4.26 | 18.88 ± 4.14 | 18.29 ± 4.57 | 15.46 ± 3.29 | 0.08 | 0.03 | 0.90 |
| 18:3 | 0.30 ± 0.10 | 0.30 ± 0.07 | 0.26 ± 0.06 | 0.25 ± 0.12 | 0.88 | 0.18 | 0.87 |
| 20:2 | 0.34 ± 0.06 | 0.38 ± 0.08 | 0.34 ± 0.08 | 0.30 ± 0.14 | 0.95 | 0.26 | 0.22 |
| 20:3 | 0.31 ± 0.05 A | 0.63 ± 0.18 B | 0.24 ± 0.06 A | 0.37 ± 0.18 A | <0.01 | <0.01 | 0.04 |
| 20:4 | 21.98 ± 3.32 | 23.11 ± 8.00 | 25.47 ± 5.94 | 23.66 ± 4.41 | 0.87 | 0.32 | 0.47 |
| 22:4 | 0.39 ± 0.08 | 0.39 ± 0.13 | 0.97 ± 0.19 | 0.98 ± 0.19 | 0.92 | <0.01 | 0.92 |
| 22:5 | 0.10 ± 0.11 | 0.19 ± 0.09 | 2.23 ± 0.62 | 2.46 ± 0.57 | 0.29 | <0.01 | 0.67 |
| n-6 LCPUFAs 1 | 23.10 ± 3.53 | 24.70 ± 8.41 | 29.26 ± 6.48 | 27.77 ± 5.23 | 0.98 | 0.04 | 0.49 |
| n-3 PUFAs | |||||||
| 18:3 | 0.87 ± 0.37 A | 0.43 ± 0.15 B | 0.07 ± 0.05 C | 0.02 ± 0.03 C | <0.01 | <0.01 | 0.01 |
| 20:5 | 0.26 ± 0.18 | 0.30 ± 0.06 | BDL | BDL | 0.54 | <0.01 | 0.49 |
| 22:5 | 1.06 ± 0.19 A | 1.42 ± 0.55 A | 0.54 ± 0.13 B | 0.39 ± 0.20 B | 0.34 | <0.01 | 0.03 |
| 22:6 | 6.71 ± 1.04 | 7.11 ± 2.65 | 3.26 ± 0.88 | 2.91 ± 0.46 | 0.97 | <0.01 | 0.49 |
| n-3 LCPUFAs 2 | 8.03 ± 1.23 | 8.83 ± 3.20 | 3.80 ± 1.00 | 3.30 ± 0.65 | 0.82 | <0.01 | 0.32 |
Data are reported as mean ± SD, n = 8. Two-way ANOVA was performed for each parameter. Labeled means in a row without a common superscript letter differ, p ≤ 0.05. Bold indicates significance. 1 n-6 LCPUFAs sums all n-6 PUFAs except 18:2n-6 and 18:3n-6. 2 n-3 LCPUFAs sums all n-3 PUFAs except 18:3n-3. AL: ad libitum; BDL: below detection level; CO: corn oil; ER: energy restriction; FA: fatty acid; LCPUFA: long-chain polyunsaturated fatty acid; SO: soybean oil.
Table 4.
PUFA concentration in the cerebellum of juvenile male rats.
| Tissue Concentration, µmol/g | p | ||||||
|---|---|---|---|---|---|---|---|
| FAs | SO-AL | SO-ER | CO-AL | CO-ER | Energy | Oil | Energy X Oil |
| n-6 PUFAs | |||||||
| 18:2 | 1.90 ± 0.14 | 1.81 ± 0.20 | 1.65 ± 0.10 | 2.08 ± 1.49 | 0.53 | 0.97 | 0.34 |
| 20:2 | 0.55 ± 0.07 | 0.53 ± 0.10 | 0.52 ± 0.06 | 0.51 ± 0.05 | 0.63 | 0.30 | 0.89 |
| 20:3 | 0.68 ± 0.05 | 0.65 ± 0.10 | 0.61 ± 0.07 | 0.56 ± 0.03 | 0.08 | <0.01 | 0.71 |
| 20:4 | 9.19 ± 0.58 | 9.06 ± 0.80 | 9.69 ± 0.52 | 9.93 ± 0.72 | 0.81 | <0.01 | 0.44 |
| 22:4 | 2.92 ± 0.22 | 2.84 ± 0.35 | 3.38 ± 0.19 | 3.26 ± 0.18 | 0.27 | <0.01 | 0.80 |
| 22:5 | 0.27 ± 0.11 | 0.35 ± 0.03 | 1.68 ± 0.24 | 1.93 ± 0.20 | <0.01 | <0.01 | 0.16 |
| n-6 LCPUFAs 1 | 13.61 ± 0.78 | 13.43 ± 1.26 | 15.87 ± 0.94 | 16.18 ± 0.79 | 0.84 | <0.01 | 0.48 |
| n-3 PUFAs | |||||||
| 22:5 | 0.27 ± 0.03 | 0.25 ± 0.02 | 0.14 ± 0.02 | 0.15 ± 0.04 | 0.25 | <0.01 | 0.20 |
| 22:6 | 15.11 ± 1.16 | 15.13 ± 1.12 | 13.67 ± 0.70 | 14.07 ± 0.63 | 0.53 | <0.01 | 0.57 |
| n-3 LCPUFAs 2 | 15.38 ± 1.19 | 15.37 ± 1.11 | 13.82 ± 0.71 | 14.22 ± 0.61 | 0.56 | <0.01 | 0.54 |
Data are reported as mean ± SD, n = 8. Two-way ANOVA was performed for each parameter with significance as p ≤ 0.05. Bold indicates significance. 1 n-6 LCPUFAs sums all n-6 PUFAs except 18:2n-6. 2 n-3 LCPUFAs sums all n-3 PUFAs. AL: ad libitum; CO: corn oil; ER: energy restriction; FA: fatty acid; LCPUFA: long-chain polyunsaturated fatty acid; SO: soybean oil.
Table 5.
PUFA concentration in the cerebral cortex of juvenile male rats.
| Tissue Concentration, µmol/g | p | ||||||
|---|---|---|---|---|---|---|---|
| FAs | SO-AL | SO-ER | CO-AL | CO-ER | Energy | Oil | Oil X Energy |
| n-6 PUFAs | |||||||
| 18:2 | 1.23 ± 0.11 | 1.19 ± 0.09 | 1.06 ± 0.07 | 1.01 ± 0.08 | 0.21 | <0.01 | 0.93 |
| 20:2 | 0.18 ± 0.02 | 0.18 ± 0.02 | 0.19 ± 0.02 | 0.19 ± 0.03 | 0.95 | 0.39 | 0.73 |
| 20:3 | 0.41 ± 0.04 | 0.42 ± 0.04 | 0.36 ± 0.03 | 0.38 ± 0.05 | 0.28 | <0.01 | 0.93 |
| 20:4 | 12.08 ± 0.75 | 12.93 ± 0.59 | 12.77 ± 1.19 | 13.42 ± 0.72 | 0.02 | 0.06 | 0.74 |
| 22:4 | 3.20 ± 0.23 | 3.45 ± 0.09 | 4.01 ± 0.41 | 4.19 ± 0.43 | 0.06 | <0.01 | 0.73 |
| 22:5 | 0.72 ± 0.04 | 0.83 ± 0.09 | 2.37 ± 0.37 | 2.66 ± 0.18 | 0.01 | <0.01 | 0.23 |
| n-6 LCPUFAs 1 | 16.59 ± 1.01 | 17.82 ± 0.63 | 19.69 ± 1.90 | 20.84 ± 1.23 | 0.01 | <0.01 | 0.92 |
| n-3 PUFAs | |||||||
| 22:5 | 0.21 ± 0.03 | 0.23 ± 0.02 | 0.15 ± 0.02 | 0.15 ± 0.02 | 0.25 | <0.01 | 0.40 |
| 22:6 | 14.32 ± 1.29 | 15.59 ± 0.92 | 14.53 ± 1.27 | 15.19 ± 1.50 | 0.04 | 0.84 | 0.50 |
| n-3 LCPUFAs 2 | 14.53 ± 1.31 | 15.82 ± 0.93 | 14.67 ± 1.29 | 15.34 ± 1.50 | 0.04 | 0.71 | 0.49 |
Data are reported as mean ± SD, n = 8. Two-way ANOVA was performed for each parameter with significance as p ≤ 0.05. Bold indicates significance. 1 n-6 LCPUFAs sums all n-6 PUFAs except 18:2n-6. 2 n-3 LCPUFAs sums all n-3 PUFAs. AL: ad libitum; CO: corn oil; ER: energy restriction; FA: fatty acid; LCPUFA: long-chain polyunsaturated fatty acid; SO: soybean oil.
Table 6.
Tissue mineral analysis.
| p | |||||||
|---|---|---|---|---|---|---|---|
| Mineral (µg/g) | SO-AL | SO-ER | CO-AL | CO-ER | Energy | Oil | Energy X Oil |
| Cerebellum | |||||||
| Copper | 7.8 ± 3.6 | 9.9 ± 2.7 | 7.7 ± 1.2 | 8.8 ± 1.7 | 0.08 | 0.54 | 0.56 |
| Manganese | 2.6 ± 1.6 | 2.2 ± 0.5 | 2.2 ± 0.3 | 2.0 ± 0.3 | 0.27 | 0.28 | 0.79 |
| Zinc | 34.5 ± 10.7 | 51.9 ± 21.9 | 39.6 ± 6.0 | 39.1 ± 5.7 | 0.07 | 0.40 | 0.06 |
| Cerebral Cortex | |||||||
| Copper | 10.3 ± 5.4 | 10.1 ± 1.5 | 11.6 ± 3.8 | 12.0 ± 3.9 | 0.97 | 0.25 | 0.85 |
| Manganese | 2.2 ± 0.5 | 1.8 ± 0.2 | 2.0 ± 0.4 | 1.9 ± 0.2 | 0.07 | 0.58 | 0.09 |
| Zinc | 48.7 ± 11.2 A | 77.7 ± 11.2 B | 77.2 ± 11.3 B | 73.8 ± 12.5 B | <0.01 | <0.01 | <0.01 |
| Liver | |||||||
| Copper | 15.5 ± 2.2 | 14.9 ± 3.9 | 15.2 ± 2.0 | 17.1 ± 2.0 | 0.50 | 0.31 | 0.19 |
| Manganese | 9.0 ± 0.8 | 8.9 ± 0.9 | 9.7 ± 0.6 | 9.7 ± 0.7 | 0.82 | <0.01 | 0.86 |
| Zinc | 107.7 ± 10.1 | 107.8 ± 13.4 | 113.8 ± 7.3 | 112.2 ± 5.1 | 0.82 | 0.13 | 0.81 |
Data are reported as mean ± SD, n = 8. Two-way ANOVA was performed for each parameter. Labeled means in a row without a common superscript letter differ, p ≤ 0.05. Bold indicates significance. AL: ad libitum; CO: corn oil; ER: energy restriction; SO: soybean oil.
Table 7.
Plasma concentrations of CORT and fT3.
| p | |||||||
|---|---|---|---|---|---|---|---|
| Analyte | SO-AL | SO-ER | CO-AL | CO-ER | Energy | Oil | Energy X Oil |
| CORT (ng/mL) | 51.6 ± 25.7 | 125.6 ± 42.7 | 89.9 ± 34.2 | 132.3 ± 79.6 | <0.01 | 0.21 | 0.38 |
| fT3 (pg/mL) | 2.5 ± 0.3 | 2.9 ± 0.4 | 2.8 ± 0.3 | 2.7 ± 0.3 | 0.16 | 0.51 | 0.06 |
Data are reported as mean ± SD, n = 8. Two-way ANOVA was performed for each parameter with significance as p ≤ 0.05. Bold indicates significance. AL: ad libitum; CO: corn oil; CORT: corticosterone; ER: energy restriction; SO: soybean oil; T3: triiodothyronine.
Table 8.
Tissue expression of glucocorticoid and mineralocorticoid receptor mRNA.
| mRNA Fold-Change Compared with SO-AL | p | ||||||
|---|---|---|---|---|---|---|---|
| Tissue/Gene | SO-AL | SO-ER | CO-AL | CO-ER | Energy | Oil | Energy X Oil |
| Cerebellum | |||||||
| Nr3c1 | 1.05 ± 0.33 | 1.07 ± 0.34 | 0.78 ± 0.16 | 0.96 ± 0.21 | 0.29 | 0.10 | 0.33 |
| Nr3c2 | 1.01 ± 0.17 | 1.10 ± 0.12 | 1.19 ± 0.18 | 1.15 ± 0.19 | 0.58 | 0.07 | 0.26 |
| Cerebral Cortex | |||||||
| Nr3c1 | 1.06 ± 0.41 | 1.07 ± 0.36 | 1.03 ± 0.21 | 1.02 ± 0.26 | 0.96 | 0.92 | 0.80 |
| Nr3c2 | 1.03 ± 0.24 | 1.07 ± 0.25 | 1.13 ± 0.24 | 1.29 ± 0.23 | 0.22 | 0.06 | 0.57 |
| Hippocampus | |||||||
| Nr3c1 | 1.00 ± 0.08 | 1.02 ± 0.12 | 1.00 ± 0.14 | 0.94 ± 0.17 | 0.17 | 0.81 | 0.08 |
| Nr3c2 | 1.30 ± 0.66 | 1.43 ± 0.34 | 1.75 ± 0.24 | 1.61 ± 0.17 | 0.49 | 0.06 | 0.27 |
| Liver | |||||||
| Nr3c1 | 1.02 ± 0.20 | 1.81 ± 0.65 | 0.84 ± 0.10 | 1.36 ± 0.30 | <0.01 | 0.01 | 0.68 |
| Nr3c2 | 1.25 ± 0.76 | 1.59 ± 0.54 | 1.28 ± 0.52 | 1.53 ± 0.50 | 0.17 | 0.67 | 0.76 |
Data are reported as mean ± SD, n = 8. Two-way ANOVA was performed on the initial ΔCt values for each gene with significance as p ≤ 0.05. Bold indicates significance. AL: ad libitum; CO: corn oil; ER: energy restriction; Nr3c1: nuclear receptor subfamily 3 group C member 1; Nr3c2: nuclear receptor subfamily 3 group C member 2; SO: soybean oil; ΔCt: change in cycle threshold normalized to β-actin.
Table 9.
Tissue mRNA expression of thyroid hormone (TH) mediators.
| mRNA Fold-Change Compared with SO-AL | p | ||||||
|---|---|---|---|---|---|---|---|
| Tissue/Gene | SO-AL | SO-ER | CO-AL | CO-ER | Energy | Oil | Energy X Oil |
| Cerebellum | |||||||
| Dio1 | 1.03 ± 0.26 | 1.09 ± 0.30 | 0.97 ± 0.23 | 1.02 ± 0.27 | 0.70 | 0.54 | 0.91 |
| Dio2 | 1.02 ± 0.20 | 1.15 ± 0.15 | 1.00 ± 0.18 | 1.07 ± 0.12 | 0.05 | 0.41 | 0.62 |
| Dio3 | 1.08 ± 0.43 | 1.23 ± 0.23 | 0.85 ± 0.20 | 1.12 ± 0.32 | 0.04 | 0.18 | 0.68 |
| Mct8 | 1.16 ± 0.76 | 1.31 ± 1.25 | 1.02 ± 0.60 | 0.52 ± 0.16 | 0.24 | 0.05 | 0.25 |
| Oatp1c1 | 1.02 ± 0.18 | 0.98 ± 0.18 | 0.90 ± 0.20 | 0.71 ± 0.19 | 0.11 | <0.01 | 0.25 |
| Thra | 1.00 ± 0.06 | 1.04 ± 0.09 | 0.90 ± 0.05 | 1.01 ± 0.11 | 0.02 | 0.03 | 0.23 |
| Thrb | 1.10 ± 0.64 | 0.94 ± 0.13 | 0.77 ± 0.10 | 0.81 ± 0.14 | 0.87 | 0.02 | 0.48 |
| Cerebral Cortex | |||||||
| Dio1 | 1.61 ± 1.45 | 1.85 ± 1.31 | 3.20 ± 3.70 | 1.39 ± 0.92 | 0.93 | 0.59 | 0.31 |
| Dio2 | 1.01 ± 0.12A | 1.21 ± 0.21A,B | 1.39 ± 0.15B | 1.30 ± 0.26B | 0.39 | <0.01 | 0.03 |
| Dio3 | 1.07 ± 0.37 | 0.75 ± 0.50 | 1.33 ± 1.18 | 1.56 ± 0.92 | 0.58 | 0.12 | 0.19 |
| Mct8 | 1.03 ± 0.30 | 1.01 ± 0.23 | 1.16 ± 0.38 | 1.25 ± 0.28 | 0.63 | 0.10 | 0.57 |
| Oatp1c1 | 1.00 ± 0.09 | 0.96 ± 0.18 | 0.99 ± 0.19 | 0.76 ± 0.15 | 0.01 | 0.05 | 0.10 |
| Thra | 1.00 ± 0.07 | 1.09 ± 0.10 | 1.20 ± 0.13 | 1.28 ± 0.15 | 0.05 | <0.01 | 0.77 |
| Thrb | 1.01 ± 0.14 | 1.20 ± 0.21 | 1.23 ± 0.15 | 1.32 ± 0.16 | 0.02 | <0.01 | 0.33 |
| Hippocampus | |||||||
| Dio1 | 1.51 ± 1.83 | 1.96 ± 1.25 | 1.75 ± 1.51 | 1.55 ± 1.24 | 0.62 | 0.98 | 0.44 |
| Dio2 | 1.01 ± 0.11 | 1.11 ± 0.13 | 1.03 ± 0.15 | 1.07 ± 0.19 | 0.21 | 0.84 | 0.53 |
| Dio3 | 1.08 ± 0.42 | 1.41 ± 0.82 | 1.75 ± 1.42 | 1.49 ± 0.83 | 0.74 | 0.36 | 0.45 |
| Mct8 | 1.05 ± 0.34 | 1.14 ± 0.48 | 1.15 ± 0.24 | 1.09 ± 0.33 | 0.99 | 0.65 | 0.50 |
| Oatp1c1 | 1.03 ± 0.29 | 1.07 ± 0.22 | 1.04 ± 0.14 | 1.08 ± 0.15 | 0.58 | 0.68 | 0.97 |
| Thra | 1.01 ± 0.16 | 1.05 ± 0.15 | 1.12 ± 0.17 | 1.15 ± 0.15 | 0.47 | 0.08 | 0.94 |
| Thrb | 1.01 ± 0.12 | 1.18 ± 0.24 | 1.14 ± 0.32 | 1.29 ± 0.31 | 0.13 | 0.39 | >0.99 |
| Liver | |||||||
| Dio1 | 1.03 ± 0.26 | 1.72 ± 0.41 | 0.82 ± 0.19 | 1.53 ± 0.37 | <0.01 | 0.07 | 0.61 |
| Dio2 † | - | - | - | - | - | - | - |
| Dio3 | 1.19 ± 0.68 | 1.44 ± 2.41 | 0.59 ± 0.46 | 0.78 ± 0.69 | 0.85 | 0.12 | 0.32 |
| Mct8 | 1.04 ± 0.30 | 1.06 ± 0.26 | 0.77 ± 0.22 | 0.79 ± 0.22 | 0.72 | <0.01 | 0.96 |
| Oatp1c1 † | - | - | - | - | - | - | - |
| Thra | 1.01 ± 0.12 | 0.58 ± 0.06 | 0.93 ± 0.12 | 0.57 ± 0.09 | <0.01 | 0.31 | 0.50 |
| Thrb | 1.01 ± 0.13 | 1.64 ± 0.18 | 0.82 ± 0.08 | 1.36 ± 0.23 | <0.01 | <0.01 | 0.99 |
Data are reported as mean ± SD, n = 8. Two-way ANOVA was performed on the initial ΔCt values for each gene. Labeled means in a row without a common superscript letter differ, p ≤ 0.05. Bold indicates significance. AL: ad libitum; CO: corn oil; Dio1-3: deiodinase 1-3; ER: energy restriction; Mct8: monocarboxylate transporter 8; Oatp1c1: solute carrier organic anion transporter family member 1C1; SO: soybean oil; Thra: thyroid hormone receptor alpha; Thrb: thyroid hormone receptor beta; ΔCt: change in cycle threshold normalized to β-actin. † signifies that the gene is not considered expressed in this tissue.
© 2017 by the authors. Licensee MDPI, Basel, Switzerland. This article is an open access article distributed under the terms and conditions of the Creative Commons Attribution (CC BY) license (http://creativecommons.org/licenses/by/4.0/).
Share and Cite
MDPI and ACS Style
Mehus, A.A.; Picklo Sr, M.J. Brain and Hepatic Mt mRNA Is Reduced in Response to Mild Energy Restriction and n-3 Polyunsaturated Fatty Acid Deficiency in Juvenile Rats. Nutrients 2017, 9, 1145. https://doi.org/10.3390/nu9101145
AMA Style
Mehus AA, Picklo Sr MJ. Brain and Hepatic Mt mRNA Is Reduced in Response to Mild Energy Restriction and n-3 Polyunsaturated Fatty Acid Deficiency in Juvenile Rats. Nutrients. 2017; 9(10):1145. https://doi.org/10.3390/nu9101145
Chicago/Turabian StyleMehus, Aaron A., and Matthew J. Picklo Sr. 2017. "Brain and Hepatic Mt mRNA Is Reduced in Response to Mild Energy Restriction and n-3 Polyunsaturated Fatty Acid Deficiency in Juvenile Rats" Nutrients 9, no. 10: 1145. https://doi.org/10.3390/nu9101145
Note that from the first issue of 2016, this journal uses article numbers instead of page numbers. See further details here.