Major Differences in Diet across Three Linguistic Regions of Switzerland: Results from the First National Nutrition Survey menuCH

 ,
,
Abstract
:1. Introduction
2. Materials and Methods
2.1. Study Design and Sampling
2.2. Dietary Assessment
2.3. Food Grouping and Comparisons to FBDG
2.4. Anthropometry and Other Parameters
2.5. Quality Controls
2.6. Weighting
2.7. Statistical Analysis
2.8. Ethics
3. Results
3.1. Sample Characteristics
3.2. Food Group and Macronutrient Intakes
3.3. Adherence to FBDG
4. Discussion
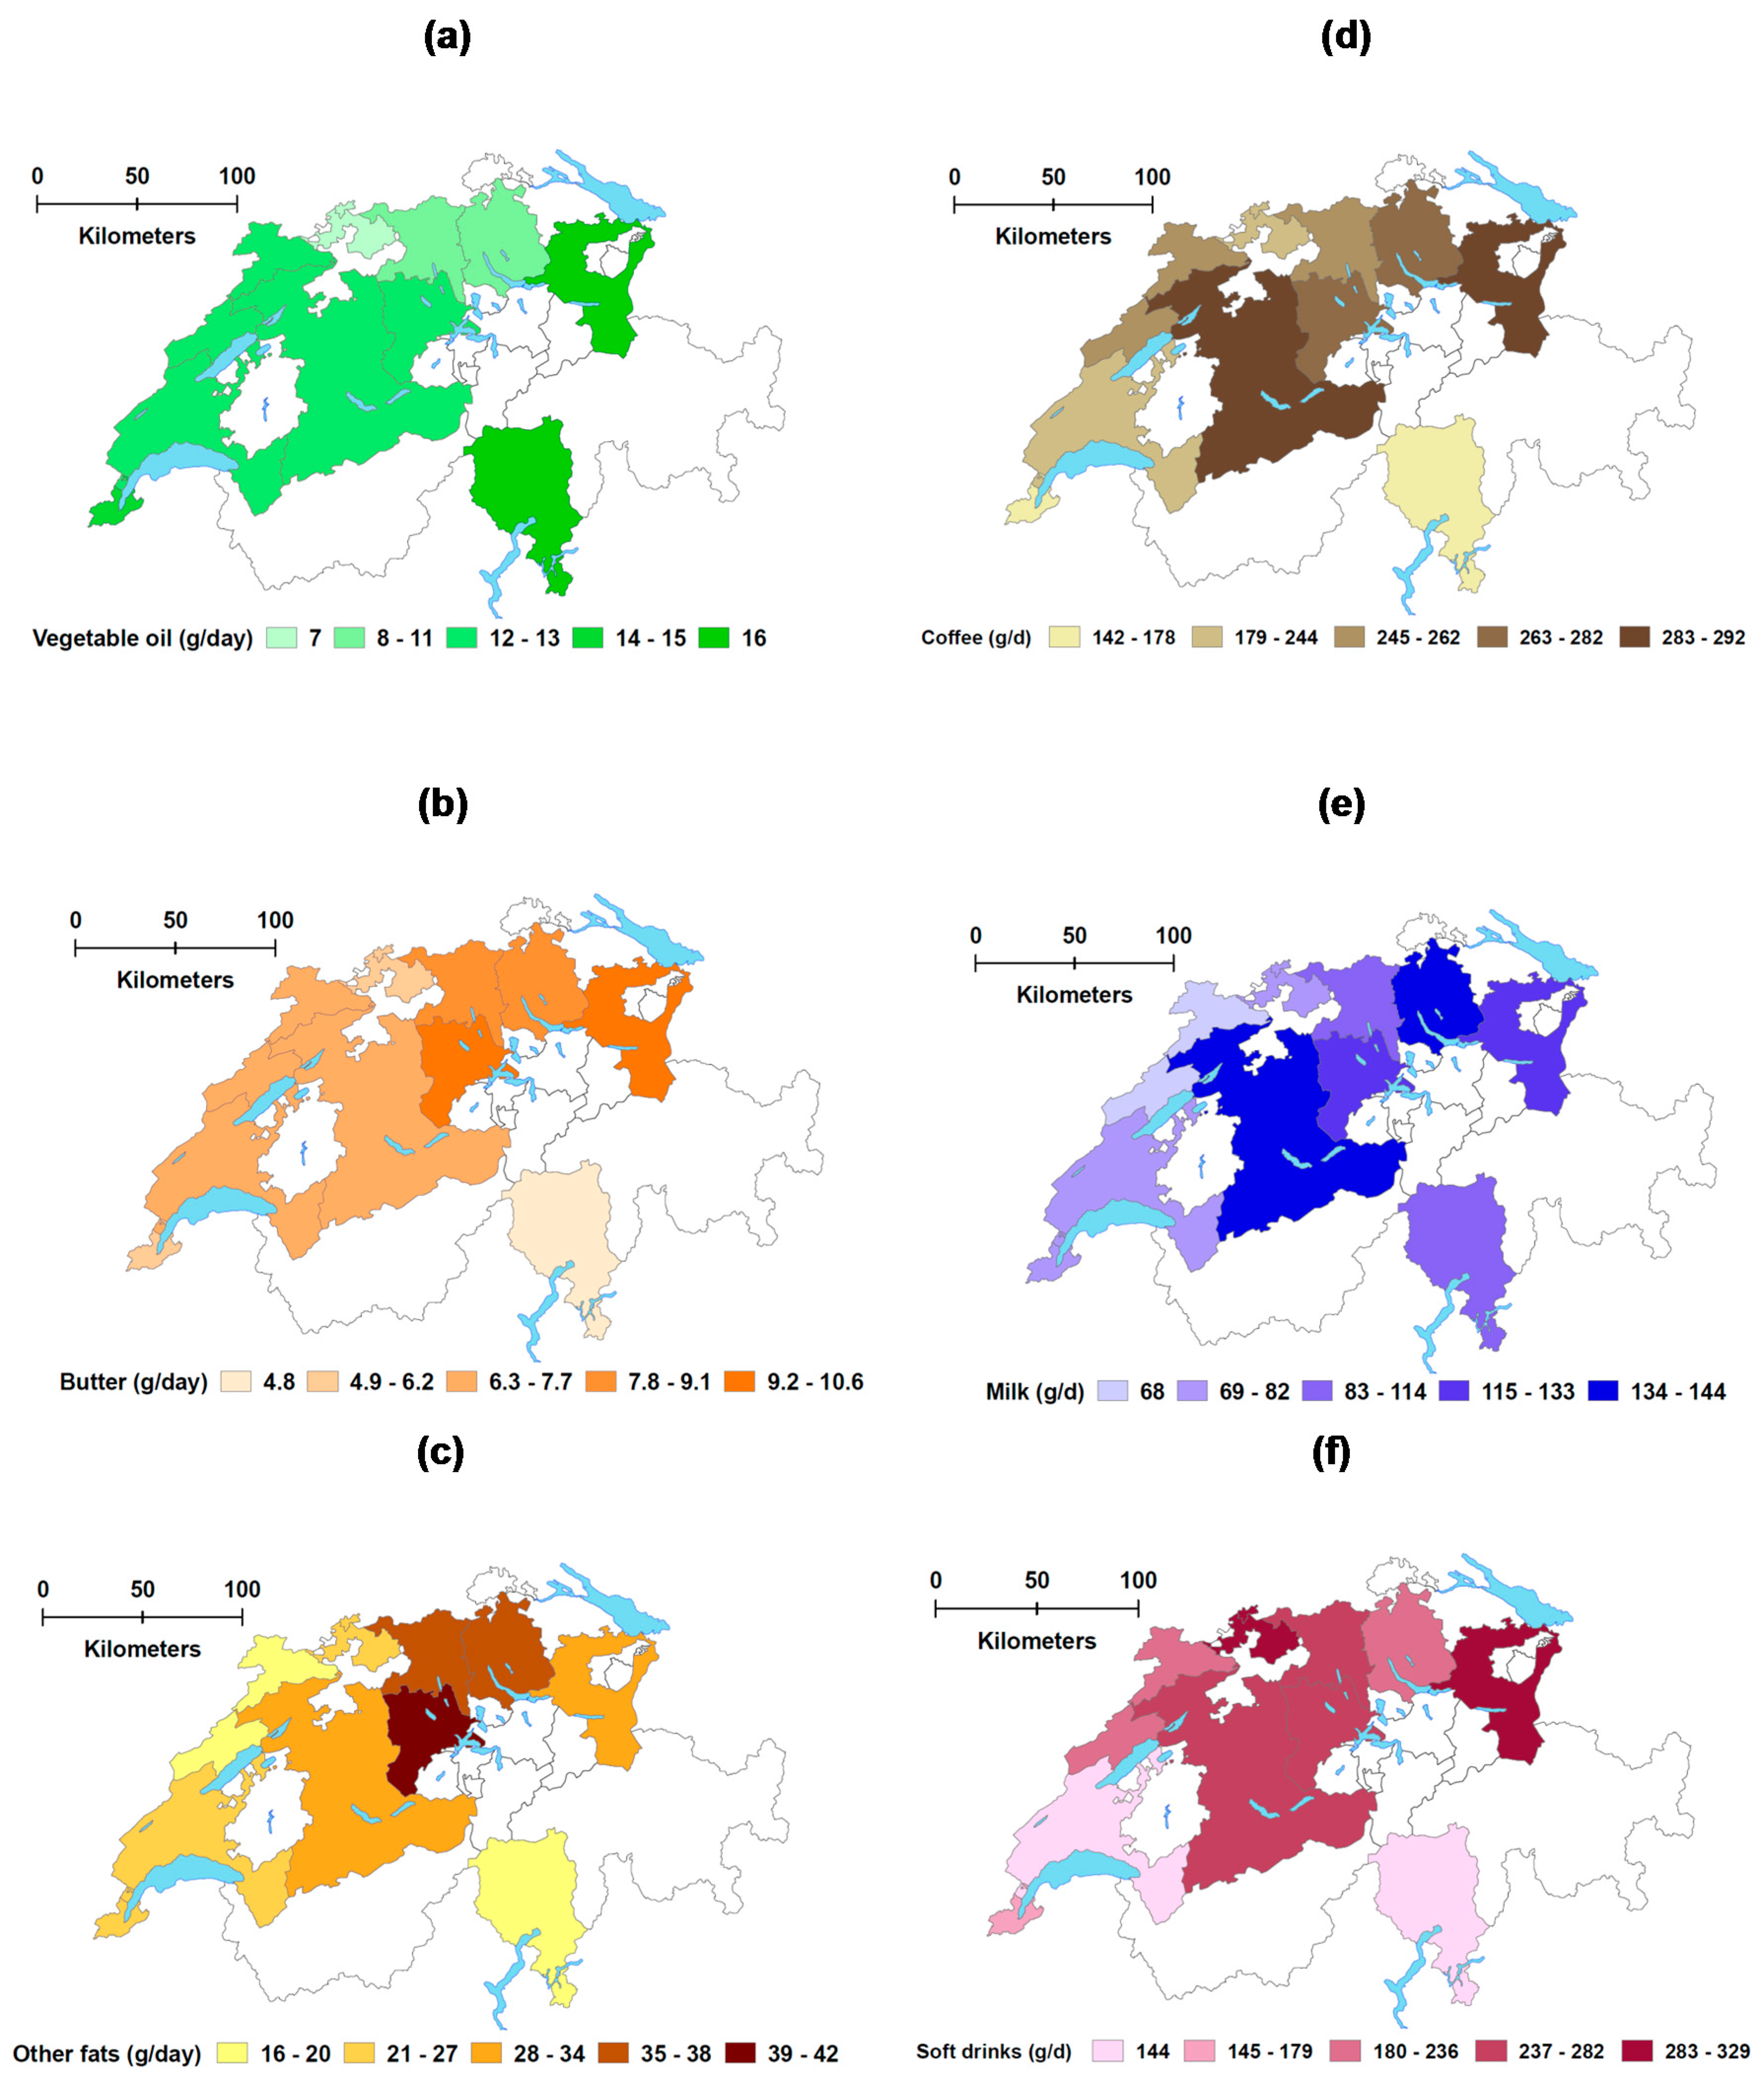
4.1. Regional Differences in Food Consumption
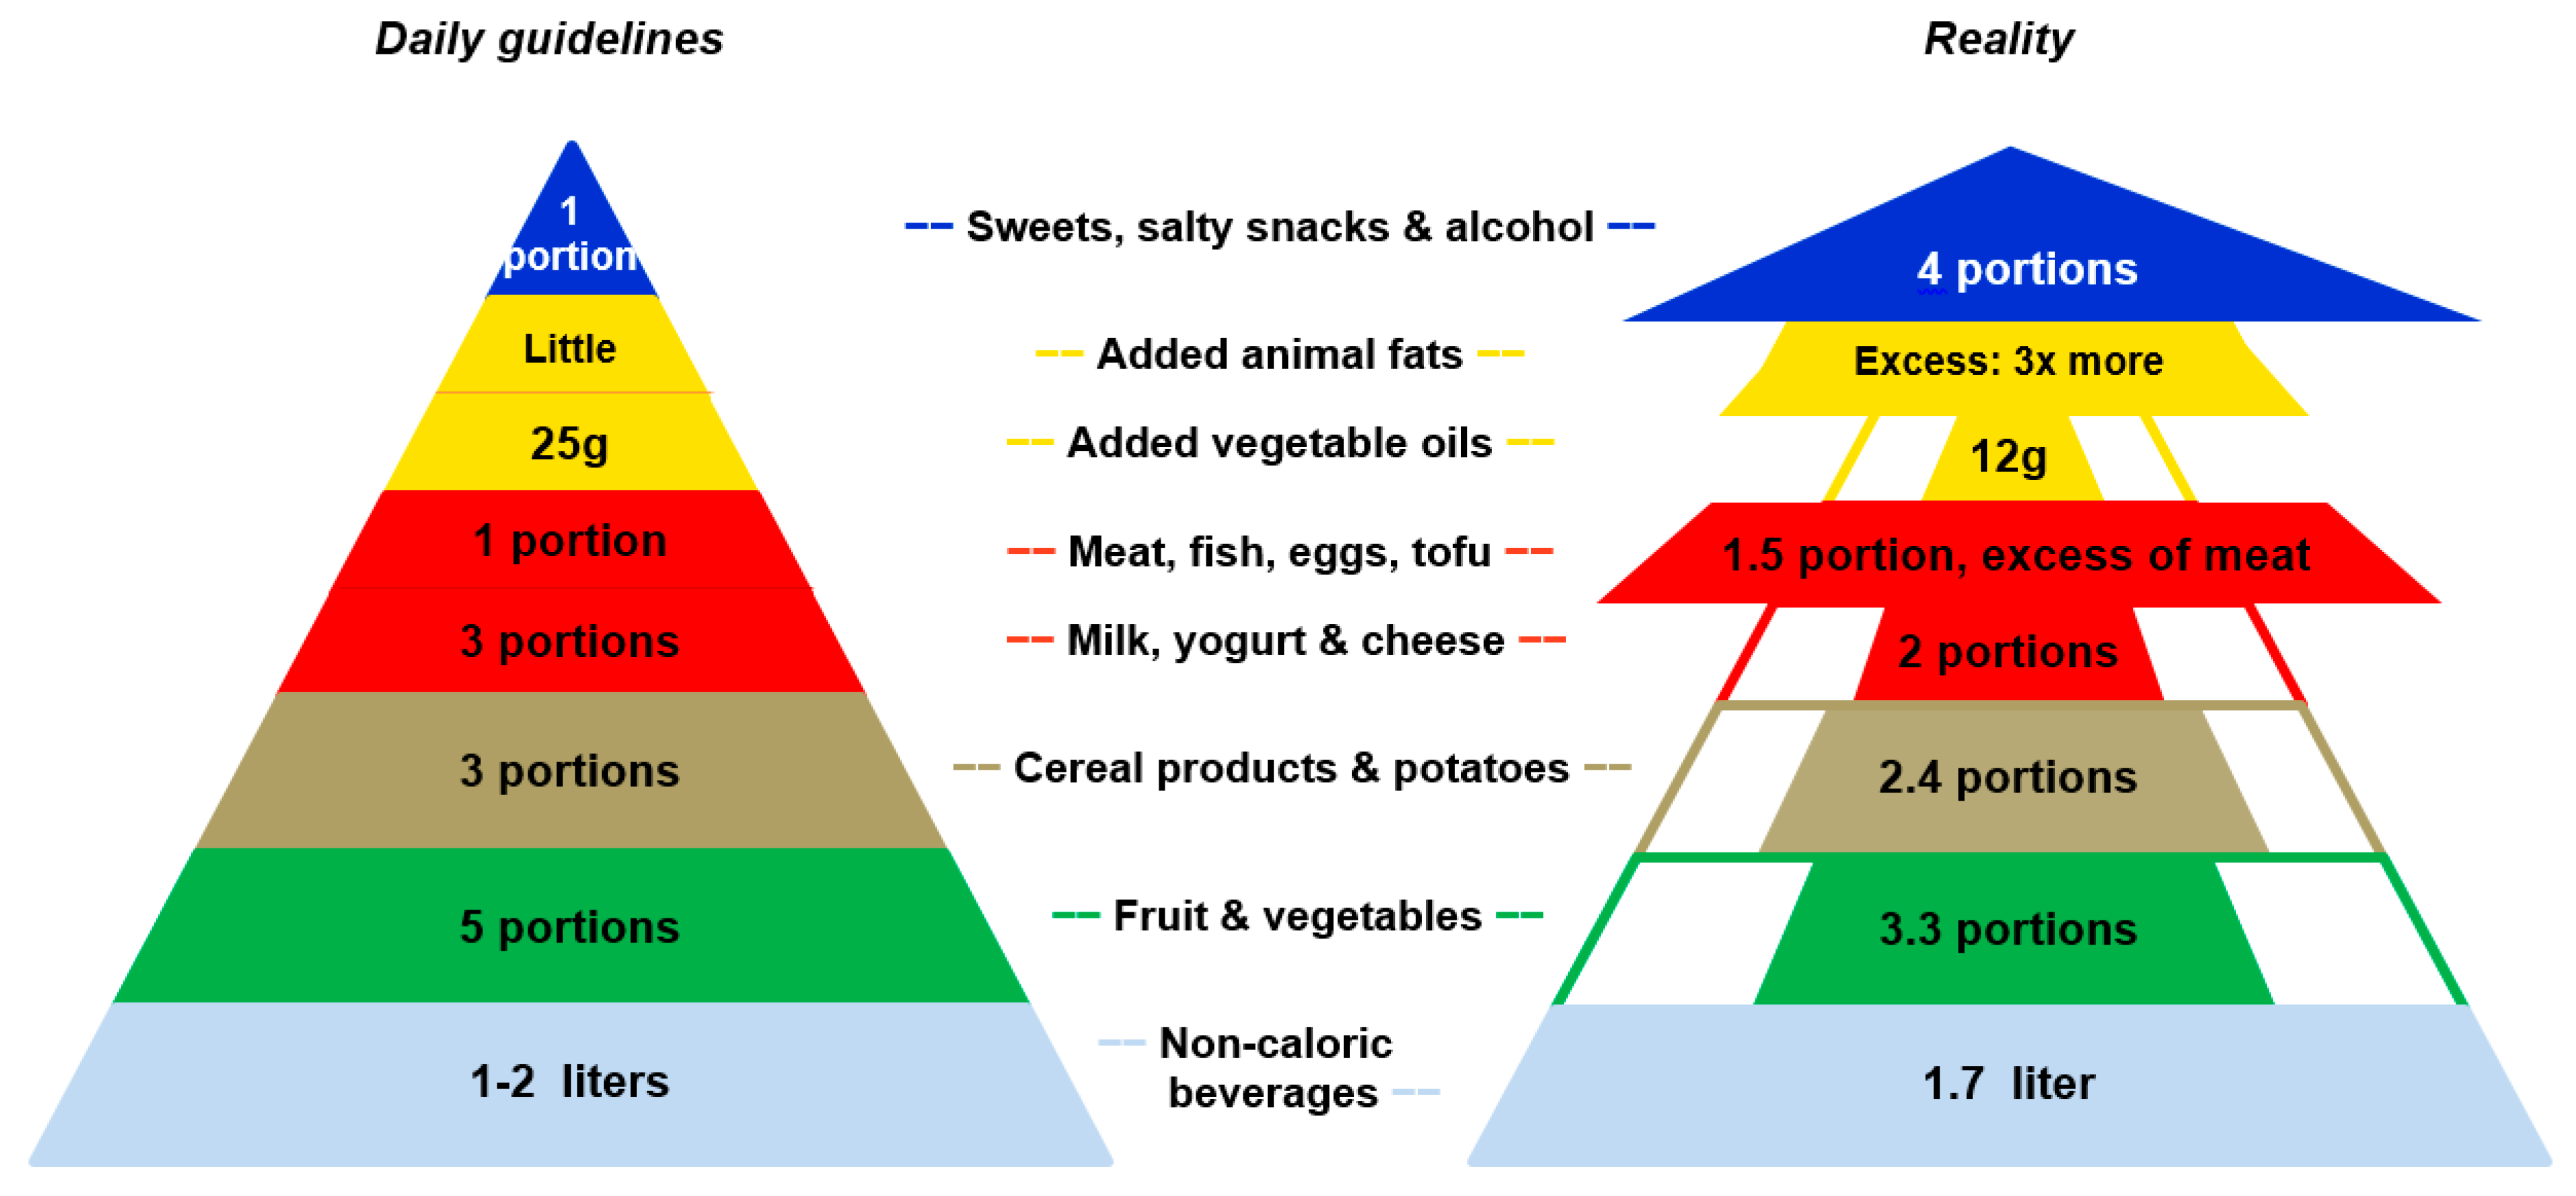
4.2. Adherence to FBDG
4.3. Strengths
4.4. Limitations
5. Conclusions
Supplementary Materials
Acknowledgments
Author Contributions
Conflicts of Interest
Abbreviations
| 24HDR | 24 h dietary recalls |
| GD | GloboDiet® |
| FBDG | Food-based dietary guidelines |
| EI:BMR | Ratio of reported Energy Intake and Basal Metabolic Rate |
| EPIC study | European Prospective Investigation into Cancer and Nutrition study |
| IARC | International Agency for Research on Cancer |
| ICMJE | International Committee of Medical Journal Editors |
| IPAQ | International Physical Activity Questionnaire |
| ISRCTN | International Standard Randomised Controlled Trial Number |
| MSM | Multiple Source Method |
| PAL | Physical activity level |
| SPADE | Statistical Program to Assess Dietary Exposure |
| STROBE | STrengthening the Reporting of OBservational studies in Epidemiology |
| WHO | World Health Organization |
References
- Federal Statistical Office. Language—Facts and Figures. Available online: https://www.eda.admin.ch/aboutswitzerland/en/home/gesellschaft/sprachen/die-sprachen---fakten-und-zahlen.html (accessed on 6 October 2017).
- Organisation for Economic Cooperation and Development (OECD). OECD Better Life Index. Available online: http://www.oecdbetterlifeindex.org/countries/switzerland/ (accessed on 5 July 2017).
- Swiss Health Observatory. Indicators. Available online: http://www.obsan.admin.ch/en/indicators (accessed on 10 April 2017).
- Federal Statistical Office. Revenus et Dépenses des Ménages Selon la Région Linguistique (Household Income and Expenditure per Linguistic Region Based on 2012–2014 Household Budget Survey). Available online: https://www.bfs.admin.ch/bfs/en/home/statistics/economic-social-situation-population/income-consumption-wealth/household-budget.assetdetail.1400471.html (accessed on 7 June 2017).
- Organisation for Economic Cooperation and Development. Obesity and the Economics of Prevention: Fit not Fat. Key Facts—Switzerland, Update 2014. Available online: https://www.oecd.org/switzerland/Obesity-Update-2014-SWITZERLAND.pdf (accessed on 5 April 2017).
- Chammartin, F.; Probst-Hensch, N.; Utzinger, J.; Vounatsou, P. Mortality atlas of the main causes of death in Switzerland, 2008–2012. Swiss Med. Wkly. 2016, 146, w14280. [Google Scholar] [CrossRef] [PubMed]
- Faeh, D.; Minder, C.; Gutzwiller, F.; Bopp, M.; Swiss National Cohort Study Group. Culture, risk factors and mortality: Can Switzerland add missing pieces to the European puzzle? J. Epidemiol. Community Health 2009, 63, 639–645. [Google Scholar] [CrossRef] [PubMed] [Green Version]
- Mozaffarian, D. Dietary and policy priorities for cardiovascular disease, diabetes, and obesity: A comprehensive review. Circulation 2016, 133, 187–225. [Google Scholar] [CrossRef] [PubMed]
- Kastorini, C.M.; Milionis, H.J.; Esposito, K.; Giugliano, D.; Goudevenos, J.A.; Panagiotakos, D.B. The effect of Mediterranean diet on metabolic syndrome and its components: A meta-analysis of 50 studies and 534,906 individuals. J. Am. Coll. Cardiol. 2011, 57, 1299–1313. [Google Scholar] [CrossRef] [PubMed]
- American Institute for Cancer Research; World Cancer Research Fund. Food, Nutrition, Physical Activity and the Prevention of Cancer: A Global Perspective; American Institute for Cancer Research: Washington, DC, USA, 2007. [Google Scholar]
- Federal Office of Public Health. Swiss Nutrition Policy 2013–2016. In Based on the Main Findings of the 6th Swiss Nutrition Report; FOPH: Bern, Switzerland, 2012. [Google Scholar]
- Federal Office of Public Health. Sixième Rapport sur la Nutrition en Suisse (6th Swiss Nutrition Report); FOPH: Bern, Switzerland, 2012.
- De Abreu, D.; Guessous, I.; Vaucher, J.; Preisig, M.; Waeber, G.; Vollenweider, P.; Marques-Vidal, P. Low compliance with dietary recommendations for food intake among adults. Clin. Nutr. 2013, 32, 783–788. [Google Scholar] [CrossRef] [PubMed]
- De Abreu, D.; Guessous, I.; Gaspoz, J.M.; Marques-Vidal, P. Compliance with the Swiss Society for Nutrition’s dietary recommendations in the population of Geneva, Switzerland: A 10-year trend study (1999–2009). J. Acad. Nutr. Diet. 2014, 114, 774–780. [Google Scholar] [CrossRef] [PubMed]
- Suggs, L.S.; Della Bella, S.; Marques-Vidal, P. Low adherence of Swiss children to national dietary guidelines. Prev. Med. Rep. 2016, 3, 244–249. [Google Scholar] [CrossRef] [PubMed]
- De Mestral, C.; Khalatbari-Soltani, S.; Stringhini, S.; Marques-Vidal, P. Fifteen-year trends in the prevalence of barriers to healthy eating in a high-income country. Am. J. Clin. Nutr. 2017, 105, 660–668. [Google Scholar] [CrossRef] [PubMed]
- Federal Statistical Office. Swiss Health Survey 2012. Overview; FSO: Neuchatel, Switzerland, 2013. [Google Scholar]
- Slimani, N.; Fahey, M.; Welch, A.A.; Wirfalt, E.; Stripp, C.; Bergstrom, E.; Linseisen, J.; Schulze, M.B.; Bamia, C.; Chloptsios, Y.; et al. Diversity of dietary patterns observed in the European Prospective Investigation into Cancer and Nutrition (EPIC) project. Public Health Nutr. 2002, 5, 1311–1328. [Google Scholar] [CrossRef] [PubMed]
- Freisling, H.; Fahey, M.T.; Moskal, A.; Ocke, M.C.; Ferrari, P.; Jenab, M.; Norat, T.; Naska, A.; Welch, A.A.; Navarro, C.; et al. Region-specific nutrient intake patterns exhibit a geographical gradient within and between European countries. J. Nutr. 2010, 140, 1280–1286. [Google Scholar] [CrossRef] [PubMed]
- De Ridder, K.; Bel, S.; Brocatus, L.; Lebacq, T.; Ost, C.; Teppers, E. Enquête de Consommation Alimentaire 2014–2015 (Belgian Food Consumption Survey); Institut Scientifique de Santé Publique (WIV-ISP): Bruxelles, Belgique, 2016. [Google Scholar]
- Lachat, C.; Hawwash, D.; Ocke, M.C.; Berg, C.; Forsum, E.; Hornell, A.; Larsson, C.; Sonestedt, E.; Wirfalt, E.; Akesson, A.; et al. Strengthening the Reporting of Observational Studies in Epidemiology-Nutritional Epidemiology (STROBE-nut): An extension of the STROBE statement. PLoS Med. 2016, 13, e1002036. [Google Scholar] [CrossRef] [PubMed] [Green Version]
- Federal Statistical Office. Stichprobenrahmen für Personen- und Haushaltserhebungen (Swiss Persons and Households Registry). Available online: https://www.bfs.admin.ch/bfs/de/home/grundlagen/volkszaehlung/volkszaehlung-teil-gesamtsystem/stichprobenrahmen.html (accessed on 28 April 2017).
- Chatelan, A.; Marques-Vidal, P.; Bucher, S.; Siegenthaler, S.; Metzger, N.; Zuberbuehler, C.; Camenzind-Frey, E.; Renggli, A.; Bochud, M.; Beer-Borst, S. Lessons learnt about conducting a multilingual nutrition survey in Switzerland: Results from menuCH pilot survey. Int. J. Vitam. Nutr. Res. 2017, in press. [Google Scholar]
- Slimani, N.; Casagrande, C.; Nicolas, G.; Freisling, H.; Huybrechts, I.; Ocke, M.C.; Niekerk, E.M.; van Rossum, C.; Bellemans, M.; De Maeyer, M.; et al. The standardized computerized 24-h dietary recall method EPIC-Soft adapted for pan-European dietary monitoring. Eur. J. Clin. Nutr. 2011, 65, S5–S15. [Google Scholar] [CrossRef] [PubMed]
- Crispim, S.P.; de Vries, J.H.; Geelen, A.; Souverein, O.W.; Hulshof, P.J.; Lafay, L.; Rousseau, A.S.; Lillegaard, I.T.; Andersen, L.F.; Huybrechts, I.; et al. Two non-consecutive 24 h recalls using EPIC-Soft software are sufficiently valid for comparing protein and potassium intake between five European centres--results from the European Food Consumption Validation (EFCOVAL) study. Br. J. Nutr. 2011, 105, 447–458. [Google Scholar] [CrossRef] [PubMed]
- Camenzind-Frey, E.; Zuberbuehler, C. menuCH—Schweizerisches Fotobuch/Livre Photo Suisse/Manuale Fotografico Svizzero (menuCH Picture Book); Federal Office of Public Health & Federal Food Safety and Veterinary Office: Bern, Switzerland, 2014.
- Federal Food Safety and Veterinary Office. Swiss Food Composition Database. Available online: http://naehrwertdaten.ch/request?xml=MessageData&xml=MetaData&xsl=Start&lan=en&pageKey=Start (accessed on 13 July 2017).
- Swiss Society for Nutrition & Federal Food Safety and Veterinary Office. Pyramide Alimentaire Suisse 2011 (Swiss Food Pyramid). Available online: http://www.sge-ssn.ch/fr/toi-et-moi/boire-et-manger/equilibre-alimentaire/pyramide-alimentaire-suisse/ (accessed on 16 July 2017).
- World Health Organization. MONICA Manual, Part III: Population Survey. Section 1: Population Survey Data Component. 4.6 Height, Weight, Waist and Hip Measurement. Available online: http://www.thl.fi/publications/monica/manual/part3/iii-1.htm#s4-6 (accessed on 1 July 2017).
- Bochud, M.; Chatelan, A.; Blanco, J.; Beer-Borst, S. Anthropometric Characteristics and Indicators of Eating and Physical Activity Behaviors in the SWISS Adult Population. Results from menuCH 2014–2015; Institute of Social and Preventive Medicine (on behalf of Federal Office of Public Health and the Food Safety and Veterinary Office): Lausanne, Switzerland, 2017. [Google Scholar]
- Hagstromer, M.; Oja, P.; Sjostrom, M. The International Physical Activity Questionnaire (IPAQ): A study of concurrent and construct validity. Public Health Nutr. 2006, 9, 755–762. [Google Scholar] [CrossRef] [PubMed]
- Craig, C.L.; Marshall, A.L.; Sjostrom, M.; Bauman, A.E.; Booth, M.L.; Ainsworth, B.E.; Pratt, M.; Ekelund, U.; Yngve, A.; Sallis, J.F.; et al. International physical activity questionnaire: 12-country reliability and validity. Med. Sci. Sports Exerc. 2003, 35, 1381–1395. [Google Scholar] [CrossRef] [PubMed]
- International Physical Activity Questionnaire. Guidelines for Data Processing and Analysis of the International Physical Activity Questionnaire—Short and Long Forms. Available online: http://www.academia.edu/5346814/Guidelines_for_Data_Processing_and_Analysis_of_the_International_Physical_Activity_Questionnaire_IPAQ_Short_and_Long_Forms_Contents (accessed on 17 March 2017).
- Crispim, S.P.; Nicolas, G.; Casagrande, C.; Knaze, V.; Illner, A.K.; Huybrechts, I.; Slimani, N. Quality assurance of the international computerised 24 h dietary recall method (EPIC-Soft). Br. J. Nutr. 2014, 111, 506–515. [Google Scholar] [CrossRef] [PubMed]
- International Agency for Research on Cancer (IARC). GloboDiet Data Cleaning Protocol: Draft Version; IARC: Lyon, France, 2013. [Google Scholar]
- Crispim, S. Quality Control and Data Handling of the Epic-Soft 24-HDR Interviews; International Agency for Research on Cancer: Lyon, France, 2013. [Google Scholar]
- European Food Safety Authority (EFSA). Guidance on the EU Menu methodology. Appendix 8.2.1. Example of a protocol for identification of misreporting (under- and overreporting of energy intake) based on the PILOT-PANEU project. EFSA J. 2014, 12, 3944. [Google Scholar]
- Schofield, W.N. Predicting basal metabolic rate, new standards and review of previous work. Hum. Nutr. Clin. Nutr. 1985, 39, 5–41. [Google Scholar] [PubMed]
- Goldberg, G.R.; Black, A.E.; Jebb, S.A.; Cole, T.J.; Murgatroyd, P.R.; Coward, W.A.; Prentice, A.M. Critical evaluation of energy intake data using fundamental principles of energy physiology: 1. Derivation of cut-off limits to identify under-recording. Eur. J. Clin. Nutr. 1991, 45, 569–581. [Google Scholar] [PubMed]
- Black, A.E. Critical evaluation of energy intake using the Goldberg cut-off for energy intake: Basal metabolic rate. A practical guide to its calculation, use and limitations. Int. J. Obes. Relat. Metab. Disord. 2000, 24, 1119–1130. [Google Scholar] [CrossRef] [PubMed]
- Souverein, O.W.; Dekkers, A.L.; Geelen, A.; Haubrock, J.; de Vries, J.H.; Ocke, M.C.; Harttig, U.; Boeing, H.; van’t Veer, P.; Efcoval Consortium. Comparing four methods to estimate usual intake distributions. Eur. J. Clin. Nutr. 2011, 65, S92–S101. [Google Scholar] [CrossRef] [PubMed]
- Dekkers, A.L.; Verkaik-Kloosterman, J.; van Rossum, C.T.; Ocke, M.C. SPADE, a new statistical program to estimate habitual dietary intake from multiple food sources and dietary supplements. J. Nutr. 2014, 144, 2083–2091. [Google Scholar] [CrossRef] [PubMed]
- R Core Team. R: A Language and Environment for Statistical Computing. Available online: http://www.R-project.org/ (accessed on 31 July 2017).
- Harttig, U.; Haubrock, J.; Knuppel, S.; Boeing, H.; Consortium, E. The MSM program: Web-based statistics package for estimating usual dietary intake using the multiple source method. Eur. J. Clin. Nutr. 2011, 65, S87–S91. [Google Scholar] [CrossRef] [PubMed]
- World Health Organization (WHO). Waist Circumference and Waist-Hip Ratio: Report of a WHO Expert Consultation; WHO: Geneva, Switzerland, 2008. [Google Scholar]
- Batal, M.; Makvandi, E.; Imbeault, P.; Gagnon-Arpin, I.; Grenier, J.; Chomienne, M.H.; Bouchard, L. Comparison of dietary intake between Francophones and Anglophones in Canada: Data from CCHS 2.2. Can. J. Public Health 2013, 104, S31–S38. [Google Scholar] [CrossRef] [PubMed]
- Garriguet, D. Overview of Canadians’ Eating Habits. Statistics Canada; Health Statistics Division: Ottawa, ON, Canada, 2006.
- Linseisen, J.; Bergstrom, E.; Gafa, L.; Gonzalez, C.A.; Thiebaut, A.; Trichopoulou, A.; Tumino, R.; Navarro Sanchez, C.; Martinez Garcia, C.; Mattisson, I.; et al. Consumption of added fats and oils in the European Prospective Investigation into Cancer and Nutrition (EPIC) centres across 10 European countries as assessed by 24-hour dietary recalls. Public Health Nutr. 2002, 5, 1227–1242. [Google Scholar] [CrossRef] [PubMed]
- Linseisen, J.; Kesse, E.; Slimani, N.; Bueno-De-Mesquita, H.B.; Ocke, M.C.; Skeie, G.; Kumle, M.; Dorronsoro Iraeta, M.; Morote Gomez, P.; Janzon, L.; et al. Meat consumption in the European Prospective Investigation into Cancer and Nutrition (EPIC) cohorts: Results from 24-hour dietary recalls. Public Health Nutr. 2002, 5, 1243–1258. [Google Scholar] [CrossRef] [PubMed]
- Heuer, T.; Krems, C.; Moon, K.; Brombach, C.; Hoffmann, I. Food consumption of adults in Germany: Results of the German national nutrition survey II based on diet history interviews. Br. J. Nutr. 2015, 113, 1603–1614. [Google Scholar] [CrossRef] [PubMed]
- Agence Française de Sécurité Sanitaire des Aliments. Étude Individuelle Nationale des Consommations Alimentaires 3 (INCA 3) (3rd French Food Consumption Survey); AFSSA: Maisons-Alfort, France, 2017. [Google Scholar]
- Leclercq, C.; Arcella, D.; Piccinelli, R.; Sette, S.; Le Donne, C.; Turrini, A.; Group, I.-S.S. The Italian National Food Consumption Survey INRAN-SCAI 2005–06: Main results in terms of food consumption. Public Health Nutr. 2009, 12, 2504–2532. [Google Scholar] [CrossRef] [PubMed]
- Muller-Nordhorn, J.; Binting, S.; Roll, S.; Willich, S.N. An update on regional variation in cardiovascular mortality within Europe. Eur. Heart J. 2008, 29, 1316–1326. [Google Scholar] [CrossRef] [PubMed]
- World Cancer Research Fund International. Animal Foods. Limit Red Meat and Avoid Processed Meat. Available online: http://www.wcrf.org/int/research-we-fund/cancer-prevention-recommendations/animal-foods (accessed on 16 April 2017).
- Imamura, F.; Micha, R.; Khatibzadeh, S.; Fahimi, S.; Shi, P.; Powles, J.; Mozaffarian, D.; Global Burden of Diseases Nutrition and Chronic Diseases Expert Group (NutriCoDE). Dietary quality among men and women in 187 countries in 1990 and 2010: A systematic assessment. Lancet Glob. Health 2015, 3, e132–e142. [Google Scholar] [CrossRef]
- Alkerwi, A.; Sauvageot, N.; Nau, A.; Lair, M.L.; Donneau, A.F.; Albert, A.; Guillaume, M. Population compliance with national dietary recommendations and its determinants: Findings from the ORISCAV-LUX study. Br. J. Nutr. 2012, 108, 2083–2092. [Google Scholar] [CrossRef] [PubMed]
- Diethelm, K.; Jankovic, N.; Moreno, L.A.; Huybrechts, I.; De Henauw, S.; De Vriendt, T.; Gonzalez-Gross, M.; Leclercq, C.; Gottrand, F.; Gilbert, C.C.; et al. Food intake of European adolescents in the light of different food-based dietary guidelines: Results of the HELENA (Healthy Lifestyle in Europe by Nutrition in Adolescence) Study. Public Health Nutr. 2012, 15, 386–398. [Google Scholar] [CrossRef] [PubMed]
- Swiss Society for Nutrition (SGE); Austrian Society for Nutrition (OEGE); German Society for Nutrition (DGE). D-A-CH Referenzwerte für die Nährstoffzufuhr (Reference Daily Intake for Germany, Austria and Switzerland), 2nd ed.; SGE, OEGE, DGE: Bonn, Germany, 2015. [Google Scholar]
- Max Rubner-Institut. Nationale Verzehrsstudie II (NVS II)—Ergebnisbericht Teil 2 (2nd German Food Consumption Survey); MRI: Karlsruhe, Germany, 2008. [Google Scholar]
- Sette, S.; Le Donne, C.; Piccinelli, R.; Arcella, D.; Turrini, A.; Leclercq, C.; Group, I.-S.S. The third Italian National Food Consumption Survey, INRAN-SCAI 2005-06-part 1: Nutrient intakes in Italy. Nutr. Metab. Cardiovasc. Dis. 2011, 21, 922–932. [Google Scholar] [CrossRef] [PubMed]
- Laureano, G.H.; Torman, V.B.; Crispim, S.P.; Dekkers, A.L.; Camey, S.A. Comparison of the ISU, NCI, MSM, and SPADE Methods for Estimating Usual Intake: A Simulation Study of Nutrients Consumed Daily. Nutrients 2016, 8, 166. [Google Scholar] [CrossRef] [PubMed]
- Ferrari, P.; Slimani, N.; Ciampi, A.; Trichopoulou, A.; Naska, A.; Lauria, C.; Veglia, F.; Buenode-Mesquita, H.B.; Ocke, M.C.; Brustad, M.; et al. Evaluation of under- and overreporting of energy intake in the 24-hour diet recalls in the European Prospective Investigation into Cancer and Nutrition (EPIC). Public Health Nutr. 2002, 5, 1329–1345. [Google Scholar] [CrossRef] [PubMed]
- Archer, E.; Hand, G.A.; Blair, S.N. Validity of U.S. nutritional surveillance: National Health and Nutrition Examination Survey caloric energy intake data, 1971–2010. PLoS ONE 2013, 8, e76632. [Google Scholar] [CrossRef]
- Federal Food Safety and Veterinary Office. Swiss Nutrition Strategy. Available online: https://www.blv.admin.ch/blv/en/home/das-blv/strategien/schweizer-ernaehrungsstrategie.html (accessed on 8 October 2017).


| Characteristics | Non-Participants | Participants | p-Value 1 |
|---|---|---|---|
| Total (n, %) | 11,520 (84.7) | 2086 (15.3) | |
| Sex (n, %) | |||
| Men | 5757 (50.0) | 946 (45.3) | <0.001 |
| Women | 5763 (50.0) | 1140 (54.7) | |
| Age | |||
| (year, mean ± SD) | 46.1 (±15.4) | 46.8 (±15.8) | 0.096 |
| Marital status (n, %) | |||
| Single | 3864 (33.5) | 695 (33.3) | 0.114 |
| Married | 6118 (53.1) | 1147 (55.0) | |
| Widowed | 332 (2.9) | 43 (2.1) | |
| Divorced | 1177 (10.2) | 194 (9.3) | |
| Others | 29 (0.3) | 7 (0.3) | |
| Number of household members (n, %) | |||
| 1 person | 2085 (18.1) | 309 (14.8) | 0.003 |
| 2 people | 3712 (32.2) | 712 (34.1) | |
| 3 people | 2154 (18.7) | 381 (18.3) | |
| 4 people | 2209 (19.2) | 440 (21.1) | |
| 5 or more | 1360 (11.8) | 244 (11.7) | |
| Nationality (n, %) | |||
| Swiss | 8251 (71.6) | 1801 (86.3) | <0.001 |
| Non-Swiss | 3269 (28.4) | 285 (13.7) | |
| Major areas (n, %) | |||
| Lake Geneva (French) | 2387 (20.7) | 405 (19.4) | 0.029 |
| Midlands (French & German) | 2060 (17.9) | 387 (18.6) | |
| Northwest (German) | 1677 (14.6) | 304 (14.6) | |
| Zurich (German) | 1497 (13.0) | 304 (14.6) | |
| East (German) | 1333 (11.6) | 251 (12.0) | |
| Center (German) | 1114 (9.7) | 219 (10.5) | |
| South (Italian) | 1452 (12.6) | 216 (10.4) |
| Characteristics | All | Men | Women | German-Speaking Region 4 | French-Speaking Region 4 | Italian-Speaking Region 4 | p-Value 5 |
|---|---|---|---|---|---|---|---|
| Participants with 2 complete 24HDR (n (%)) | 2057 (100) | 933 (45) | 1124 (55) | 1341 (65) | 502 (24) | 214 (10) | |
| People for weighted analyses (n (%)) | 4,627,878 (100) | 2,305,141 (50) | 2,322,737 (50) | 3,203,780 (69) | 1,167,173 (25) | 256,925 (6) | |
| Age 1 | |||||||
| (year, mean ± SD) | 46.1 ± 15.4 | 46.9 ± 15.4 | 45.3 ± 15.3 | 46.5 ± 15.6 | 45.0 ± 14.6 | 46.0 ± 15.7 | 0.134 |
| Age groups 1 (%) | |||||||
| 18–34 years old | 28.5 | 27.4 | 29.6 | 27.5 | 30.7 | 30.2 | 0.007 |
| 35–49 years old | 30.6 | 29.4 | 31.8 | 30.7 | 31.1 | 27.3 | |
| 50–64 years old | 26.9 | 28.0 | 25.8 | 26.5 | 27.5 | 28.4 | |
| 65–75 years old | 14.0 | 15.2 | 12.9 | 15.3 | 10.7 | 14.1 | |
| Education: Highest degree 1 (%) | |||||||
| Only primary school or no degree | 4.7 | 4.8 | 4.6 | 3.6 | 6.4 | 10.3 | <0.001 |
| Secondary (e.g., apprenticeship) | 42.6 | 39.2 | 46.0 | 41.4 | 44.5 | 49.6 | |
| Tertiary (e.g., high technical school, university) | 52.7 | 56.0 | 49.4 | 55.0 | 49.1 | 40.1 | |
| Self-rep. physical activity 1 (%) | 8 | ||||||
| Low | 10.9 | 13.0 | 8.8 | 11.7 | .1 | 12.8 | 0.313 |
| Moderate | 24.9 | 23.2 | 26.7 | 24.8 | 25.0 | 25.8 | |
| High | 40.4 | 43.2 | 37.6 | 40.4 | 41.5 | 34.8 | |
| Does not know | 23.8 | 20.6 | 26.9 | 23.0 | 25.4 | 26.5 | |
| Body Mass Index (BMI) 1 | |||||||
| (kg/m2, mean ± SD) | 25.0 ± 4.4 | 25.9 ± 3.9 | 24.0 ± 4.7 | 25.0 ± 4.4 | 24.8 ± 4.3 | 25.5 ± 4.9 | 0.325 |
| BMI categories 1 (%) | |||||||
| Underweight (BMI < 18.5 kg/m2) | 2.4 | 0.9 | 3.8 | 2.5 | 2.1 | 2.1 | 0.948 |
| Normal (18.5 ≤ BMI < 25 kg/m2) | 54.2 | 43.3 | 65.0 | 53.8 | 55.7 | 52.7 | |
| Overweight (25 ≤ BMI < 30 kg/m2) | 30.5 | 41.2 | 19.8 | 30.8 | 29.9 | 29.9 | |
| Obese (BMI ≥ 30 kg/m2) | 12.9 | 14.5 | 11.3 | 12.9 | 12.4 | 15.4 | |
| Risk of metab. complications 1 (%) | |||||||
| Waist circumference: ≥94 cm (♂); ≥80 cm (♀) | 33.1 | 35.1 | 31.2 | 34.4 | 28.7 | 37.4 | 0.028 |
| Waist circumference: ≥102 cm (♂); ≥88 cm (♀) | 16.5 | 16.7 | 16.3 | 17.2 | 14.2 | 18.8 | 0.208 |
| Energy Intake: Basal Metabolic Rate (EI:BMR) 2 | |||||||
| (mean ± SD) | 1.43 ± 0.44 | 1.44 ± 0.47 | 1.42 ± 0.41 | 1.46 ± 0.44 | 1.39 ± 0.43 | 1.33 ± 0.50 | <0.001 |
| Energy misreporting 2,3 (%) | |||||||
| Under-reporters | 16.9 | 18.9 | 15.0 | 15.9 | 17.6 | 27.3 | 0.051 |
| Plausible reporters | 81.6 | 79.3 | 83.8 | 82.7 | 81.1 | 70.3 | |
| Over-reporters | 1.5 | 1.7 | 1.2 | 1.4 | 1.3 | 2.4 |
| Swiss Food Pyramid Stage | Daily food Subgroup or Nutrient Intakes, (g or Kcal for Energy) | Total Population | Total Population | German | French | Italian | Diff. (p-Value) 3 | ||||||||
|---|---|---|---|---|---|---|---|---|---|---|---|---|---|---|---|
| 2 Recalls | Usual Intakes 2 | Usual Intakes 2 | |||||||||||||
| Crude Mean | Weighted Mean 1 | Weighted Mean 1 | SEM 1 | Weighted P25 1 | Weighted P50 1 | Weighted P75 1 | Weighted Mean 1 | Weighted Mean 1 | Weighted Mean 1 | Ger. vs. Fre. | Ger. vs. Ita. | Fre. vs. Ita. | |||
| 1 | Non-caloric beverages | Water | 1199.9 | 1188.0 | 1190.6 | 16.6 | 715.2 | 1088.2 | 1612.1 | 1215.1 | 1075.3 | 1291.6 | 0.001 * | 0.250 | 0.002 |
| Tea | 295.2 | 289.6 | 278.0 | 10.5 | 29.3 | 190.7 | 432.9 | 281.6 | 299.8 | 162.7 | 0.457 | <0.001 * | <0.001 * | ||
| Coffee | 250.5 | 254.1 | 246.5 | 5.8 | 108.3 | 220.3 | 350.0 | 273.4 | 214.4 | 135.4 | <0.001 * | <0.001 * | <0.001 * | ||
| 2 | Fruit & vegetables | Vegetables | 204.3 | 203.2 | 203.1 | 3.2 | 137.9 | 192.3 | 256.8 | 205.9 | 214.4 | 168.0 | 0.269 | <0.001 * | <0.001 * |
| Fruit | 171.2 | 171.0 | 163.2 | 4.2 | 86.4 | 145.7 | 220.4 | 162.0 | 160.3 | 140.6 | 0.855 | 0.109 | 0.174 | ||
| 100% juices | 59.9 | 58.6 | 60.1 | 3.0 | 9.7 | 34.1 | 83.2 | 59.5 | 62.7 | 38.0 | 0.636 | 0.006 | 0.006 | ||
| 3 | Cereal products & potatoes | Tuber products | 49.6 | 50.7 | 44.8 | 1.8 | 33.8 | 43.4 | 61.6 | 50.9 | 46.9 | 49.7 | 0.470 | 0.863 | 0.721 |
| Bread products | 113.7 | 114.7 | 111.5 | 2.4 | 72.9 | 102.4 | 140.0 | 118.0 | 101.9 | 95.6 | 0.002 | 0.008 | 0.477 | ||
| Pasta, rice | 91.5 | 93.4 | 93.3 | 2.5 | 55.0 | 85.0 | 122.5 | 88.6 | 96.8 | 114.5 | 0.159 | 0.019 | 0.131 | ||
| Other cereal products | 38.1 | 38.5 | 39.3 | 1.5 | 18.6 | 31.8 | 51.5 | 37.1 | 41.5 | 41.0 | 0.232 | 0.443 | 0.927 | ||
| 4 | Protein-based products | Milk | 114.1 | 113.4 | 110.6 | 3.9 | 29.1 | 73.5 | 149.9 | 126.6 | 71.5 | 108.9 | <0.001 * | 0.124 | 0.001 * |
| Yogurt, fresh cheese | 61.5 | 59.8 | 60.1 | 2.1 | 14.9 | 44.6 | 89.9 | 61.7 | 57.7 | 35.4 | 0.411 | <0.001 * | 0.001 * | ||
| Soft cheese | 16.5 | 16.2 | 16.1 | 0.7 | 7.4 | 13.4 | 21.9 | 15.7 | 15.2 | 24.7 | 0.740 | 0.002 | 0.002 | ||
| Hard cheese | 25.7 | 27.0 | 25.6 | 1.1 | 12.1 | 20.8 | 33.6 | 26.8 | 22.8 | 20.2 | 0.101 | 0.029 | 0.445 | ||
| Red meat | 36.5 | 37.2 | 36.1 | 1.4 | 20.4 | 32.7 | 46.7 | 31.7 | 44.5 | 42.7 | <0.001 * | 0.085 | 0.787 | ||
| Other unprocessed meat | 26.3 | 29.0 | 27.5 | 5.5 | 18.7 | 26.5 | 34.8 | 26.1 | 34.4 | 33.4 | 0.417 | 0.576 | 0.939 | ||
| Processed meat | 42.0 | 42.7 | 42.3 | 1.4 | 20.4 | 36.1 | 54.6 | 43.4 | 36.7 | 43.0 | 0.030 | 0.938 | 0.206 | ||
| Fish, seafood | 19.5 | 21.0 | 20.6 | 1.1 | 7.9 | 16.3 | 28.3 | 17.7 | 29.0 | 34.0 | <0.001 * | <0.001 * | 0.318 | ||
| Other protein-based products | 23.6 | 23.9 | 22.3 | 1.2 | 7.9 | 15.3 | 28.5 | 23.7 | 20.7 | 17.5 | 0.293 | 0.126 | 0.453 | ||
| 5 | Added fats & nuts | Vegetable oil | 12.8 | 12.4 | 12.3 | 0.3 | 7.7 | 11.1 | 15.6 | 11.4 | 13.9 | 15.0 | 0.003 | 0.010 | 0.468 |
| Butter | 8.1 | 7.9 | 7.6 | 0.3 | 2.7 | 5.8 | 10.5 | 8.1 | 6.4 | 3.7 | 0.004 | <0.001 * | <0.001 * | ||
| Cream, fatty sauces, oth. fats | 30.9 | 31.0 | 30.7 | 1.07 | 18.1 | 27.2 | 39.4 | 35.5 | 22.2 | 16.7 | <0.001 * | <0.001 * | 0.045 | ||
| Nuts, seeds, olives | 9.3 | 10.5 | 9.73 | 0.6 | 2.2 | 5.72 | 12.5 | 10.7 | 9.0 | 5.6 | 0.197 | 0.002 | 0.045 | ||
| 6 | Sweets, salty snacks & alcohol | Added sweeteners | 22.1 | 22.1 | 21.6 | 0.7 | 8.9 | 17.5 | 29.6 | 20.7 | 25.1 | 17.5 | 0.010 | 0.131 | 0.002 |
| Cakes, desserts, ice-cream | 38.3 | 39.2 | 38.7 | 1.5 | 19.8 | 34.3 | 52.0 | 38.8 | 39.0 | 36.2 | 0.959 | 0.601 | 0.615 | ||
| Chocolate products | 10.4 | 10.7 | 10.1 | 0.4 | 3.3 | 7.5 | 14.1 | 10.7 | 10.1 | 6.0 | 0.566 | <0.001 * | 0.002 | ||
| Other sweet products | 11.8 | 11.2 | 11.1 | 0.5 | 2.9 | 7.5 | 15.3 | 11.0 | 10.2 | 14.9 | 0.496 | 0.088 | 0.048 | ||
| Salty snacks | 9.1 | 9.7 | 9.15 | 0.7 | 2.7 | 6.1 | 12.1 | 8.9 | 11.1 | 5.6 | 0.304 | 0.064 | 0.019 | ||
| Soft drinks | 219.8 | 240.6 | 212.2 | 8.9 | 41.5 | 135.7 | 302.5 | 245.0 | 155.3 | 140.0 | <0.001 * | <0.001 * | 0.574 | ||
| Beer | 96.7 | 107.3 | 101.5 | 6.8 | 7.1 | 42.5 | 136.7 | 109.5 | 82.2 | 100.3 | 0.072 | 0.651 | 0.415 | ||
| Wine, other alcohols | 87.6 | 91.9 | 89.5 | 3.7 | 20.2 | 61.3 | 129.3 | 81.6 | 104.5 | 84.9 | 0.013 | 0.757 | 0.124 | ||
| Macronutrients | Total energy | 2183.1 | 2225.7 | 2185.5 | 16.6 | 1781.8 | 2126.4 | 2526.4 | 2240.7 | 2114.3 | 2025.6 | 0.001 * | <0.001 * | 0.155 | |
| Total proteins | 82.6 | 84.6 | 82.7 | 0.7 | 66.5 | 80.3 | 96.4 | 82.5 | 83.5 | 82.0 | 0.570 | 0.853 | 0.614 | ||
| Total carbohydrates | 230.0 | 233.0 | 230.4 | 2.1 | 177.9 | 221.9 | 274.0 | 237.3 | 219.9 | 215.2 | <0.001 * | 0.003 | 0.569 | ||
| Total fat | 89.0 | 90.8 | 89.7 | 1.2 | 71.6 | 87.2 | 105.2 | 92.6 | 89.3 | 77.7 | 0.349 | <0.001 * | 0.006 | ||
| Total alcohol | 12.8 | 13.8 | 13.4 | 0.5 | 3.7 | 8.5 | 17.7 | 13.1 | 14.4 | 12.0 | 0.274 | 0.488 | 0.170 | ||
| Food-Based Dietary Guidelines (FBDG) 1 | Total Population | Men | Women | German | French | Italian | Diff. (p-Value) 4 | |||
|---|---|---|---|---|---|---|---|---|---|---|
| 2 Recalls | 2 Recalls | 2 Recalls | ||||||||
| Crude | Weighted | Weighted | Weighted | Weighted | Weighted | Weighted | Ger.vs. Fre. | Ger. vs. Ita. | Fre. vs. Ita. | |
| % | % 3 | % 3 | % 3 | % 3 | % 3 | % 3 | ||||
| Non-caloric beverages ≥1 L/day of water, tea and coffee | 82.8 | 81.9 | 77.6 | 86.2 | 82.6 | 80.4 | 79.8 | 0.359 | 0.340 | 0.864 |
| Fruit and vegetables ≥5 portions/day: max. 1 portion can be provided by 2 dL of 100% fruit or vegetable juices | 18.2 | 18.1 | 16.5 | 19.6 | 18.1 | 18.3 | 17.2 | 0.920 | 0.824 | 0.790 |
| Vegetables ≥3 portions/day: 1 portion =120 g, 30 g if dried, 2.5 dL of soup, and 100 g of sauce | 9.4 | 9.4 | 8.8 | 10.0 | 8.9 | 10.1 | 12.1 | 0.527 | 0.291 | 0.545 |
| Fruit ≥2 portions/day: 1 portion = 120 g, 30 g if dried | 29.3 | 28.1 | 24.4 | 31.8 | 29.0 | 27.2 | 20.0 | 0.510 | 0.013 | 0.063 |
| Dairy products ≥3 portions/day: 1 portion = 200 mL of milk, 175 g of yogurt or fresh cheese, 60 g of soft cheese and 30 g of hard cheese | 21.1 | 21.7 | 24.7 | 18.7 | 23.4 | 17.6 | 19.1 | 0.036 | 0.226 | 0.696 |
| Total meat ≤35 g/day of prepared meat2 | 22.6 | 22.1 | 16.1 | 28.1 | 23.4 | 19.3 | 19.7 | 0.098 | 0.340 | 0.904 |
| Red meat ≤35 g/day of prepared meat | 62.6 | 62.9 | 56.0 | 69.8 | 64.8 | 57.7 | 63.3 | 0.021 | 0.703 | 0.238 |
| Processed meat ≤15 g/day | 43.0 | 41.7 | 31.8 | 51.6 | 40.0 | 46.0 | 43.1 | 0.054 | 0.477 | 0.542 |
| Vegetable oil ≥25 g/day | 13.8 | 13.5 | 15.2 | 11.7 | 11.8 | 15.4 | 24.5 | 0.077 | <0.001* | 0.020 |
| Nuts, seeds, and olives ≥25 g/day | 6.2 | 6.2 | 5.9 | 6.6 | 6.7 | 5.9 | 2.4 | 0.634 | 0.110 | 0.174 |
| Alcohol ≤30 g (♂) or ≤15 g (♀) of pure alcohol | 77.9 | 76.7 | 75.7 | 77.7 | 78.2 | 72.2 | 79.0 | 0.029 | 0.814 | 0.094 |
| All 7 FBDG above | 0.1 | 0.1 | 0.0 | 0.2 | 0.1 | 0.0 | 0.0 | Not applicable | ||
| At least 3 FBDG | 41.9 | 40.5 | 37.3 | 43.7 | 42.4 | 36.0 | 38.1 | 0.037 | 0.341 | 0.666 |
© 2017 by the authors. Licensee MDPI, Basel, Switzerland. This article is an open access article distributed under the terms and conditions of the Creative Commons Attribution (CC BY) license (http://creativecommons.org/licenses/by/4.0/).
Share and Cite
Chatelan, A.; Beer-Borst, S.; Randriamiharisoa, A.; Pasquier, J.; Blanco, J.M.; Siegenthaler, S.; Paccaud, F.; Slimani, N.; Nicolas, G.; Camenzind-Frey, E.; et al. Major Differences in Diet across Three Linguistic Regions of Switzerland: Results from the First National Nutrition Survey menuCH. Nutrients 2017, 9, 1163. https://doi.org/10.3390/nu9111163
Chatelan A, Beer-Borst S, Randriamiharisoa A, Pasquier J, Blanco JM, Siegenthaler S, Paccaud F, Slimani N, Nicolas G, Camenzind-Frey E, et al. Major Differences in Diet across Three Linguistic Regions of Switzerland: Results from the First National Nutrition Survey menuCH. Nutrients. 2017; 9(11):1163. https://doi.org/10.3390/nu9111163
Chicago/Turabian StyleChatelan, Angeline, Sigrid Beer-Borst, Alex Randriamiharisoa, Jerome Pasquier, Juan Manual Blanco, Stefan Siegenthaler, Fred Paccaud, Nadia Slimani, Genevieve Nicolas, Esther Camenzind-Frey, and et al. 2017. "Major Differences in Diet across Three Linguistic Regions of Switzerland: Results from the First National Nutrition Survey menuCH" Nutrients 9, no. 11: 1163. https://doi.org/10.3390/nu9111163