The Role of Mammalian Target of Rapamycin (mTOR) in Insulin Signaling

Department of Molecular Medicine, School of Medicine, Gachon University, Incheon 21999, Korea
Nutrients 2017, 9(11), 1176; https://doi.org/10.3390/nu9111176
Submission received: 21 September 2017
/
Revised: 23 October 2017
/
Accepted: 24 October 2017
/
Published: 27 October 2017
Abstract
:The mammalian target of rapamycin (mTOR) is a serine/threonine kinase that controls a wide spectrum of cellular processes, including cell growth, differentiation, and metabolism. mTOR forms two distinct multiprotein complexes known as mTOR complex 1 (mTORC1) and mTOR complex 2 (mTORC2), which are characterized by the presence of raptor and rictor, respectively. mTOR controls insulin signaling by regulating several downstream components such as growth factor receptor-bound protein 10 (Grb10), insulin receptor substrate (IRS-1), F-box/WD repeat-containing protein 8 (Fbw8), and insulin like growth factor 1 receptor/insulin receptor (IGF-IR/IR). In addition, mTORC1 and mTORC2 regulate each other through a feedback loop to control cell growth. This review outlines the current understanding of mTOR regulation in insulin signaling in the context of whole body metabolism.
1. Introduction
The mammalian target of rapamycin (mTOR) is a highly conserved serine/threonine (Ser/Thr) kinase that is involved in a diverse array of physiological processes, including cell metabolism, cell survival, cell growth, and autophagy [1]. In mammals, mTOR exists in two functionally distinct complexes, mTOR complex1 (mTORC1) and mTOR complex 2 (mTORC2) [2] (Figure 1).
mTORC1 consists of mTOR, regulatory-associated protein of mTOR (raptor), mammalian lethal with Sec13 protein 8 (mLST8), and the two inhibitory subunits, proline-rich Akt substrate of 40 kDa (PRAS40) and DEP domain-containing mTOR-interacting protein (DEPTOR) [1]. Rapamycin forms a complex with the peptidyl-prolyl-isomerase FKBP12 (12 kDa FK506-binding protein) and then binds to mTORC1 in a highly specific manner. However, it does not bind to mTORC2 [3]. mTORC2 is unresponsive to FKBP12-rapamycin [4,5], but prolonged treatment with rapamycin inhibits mTORC2 indirectly by preventing either de novo mTORC2 assembly or the synthesis of new mTOR via its inhibition [5,6]. mTORC2 contains mTOR, the rapamycin insensitive companion of the mammalian target of rapamycin (rictor), stress-activated map kinase (SAPK)-interacting 1 (SIN1), mLST8, proline-rich protein 5 (PRR5), proline-rich protein 5-like (PRR5L) (also known as protor1 and protor2) and DEPTOR. Whereas mTORC1 senses and integrates several extracellular and intracellular signals, including growth factors [7], the stimulus of mTORC2 is poorly understood; only growth factors are known to activate mTORC2 kinase activity [8].
The growth factor insulin is known as the most potent physiological anabolic agent [9]. Insulin is synthesized in pancreatic β cells of Langerhans islets as preproinsulin. It is then processed to proinsulin, converted to insulin and C-peptide, and stored in secretory granules awaiting release on demand [10]. Monomeric insulin consists of 21 amino acid residues in the “A” chain and 30 amino acid residues in the “B” chain bound by disulfide linkages [10]. Insulin is released with an increase in blood glucose levels. It serves as the primary glucose concentration regulator, which promotes glucose uptake in fat and skeletal muscle and inhibits hepatic glucose production [11]. Insulin promotes substrate storage by stimulating glycogen synthesis, protein synthesis, and lipogenesis, while simultaneously inhibiting lipolysis, glucogenolysis, and protein breakdown [11,12]. Moreover, insulin regulates cell growth and differentiation, indicating the profound roles of insulin in overall cell physiology. The resistance and dysregulation of insulin signaling induces the elevation of fasting and postprandial glucose, as well as lipid levels. It also leads to the dysregulation of these processes [11]. mTOR is a master regulator of cell growth and is also closely implicated in metabolic changes in the liver, adipose tissue, and muscle upon postprandial elevation of insulin levels [2,13,14,15]. This review summarizes the major findings on the involvement of mTOR in insulin signaling, with particular emphasis on the molecular regulation of insulin signaling.
2. Regulation of mTORC1
2.1. Upstream and Downstream Targets of mTORC1
As a master regulator of cell growth, mTORC1 is activated by several growth factors and mitogen-dependent pathways [12]. mTORC1 is also responsive to intracellular and environmental stresses that are opposed to cell growth such as low levels of adenosine triphosphate (ATP) or oxygen and DNA damage [16]. The tuberous sclerosis complex 1/2 (TSC1/2) and the small guanine-5′-triphosphate (GTP) ase, a RAS homolog enriched in the brain (RHEB), serve as a major hub for transducing the upstream signal to mTOR [7]. TSC acts as a GTPase-activating protein (GAP) for RHEB [12]. While GTP-loaded RHEB activates mTORC1, TSC negatively regulates RHEB and mTORC1 signaling [8]. Insulin-stimulated protein kinase B (PKB, also known as Akt) activates mTORC1 signaling by phosphorylating and inhibiting TSC2, enabled by the dissociation of TSC2 from the lysosomal membrane, where a fraction of RHEB is localized [17].
The two best-known downstream targets of mTORC1 are ribosomal protein S6 kinase 1 (S6K1) and eukaryotic translation initiation factor 4E-binding protein 1 (4EBP1) [7]. Activated mTORC1 phosphorylates the hydrophobic motif of S6K1, thus sequentially activating S6 to induce ribosome biogenesis [8]. The phosphorylation of 4EBP1 at multiple sites by mTORC1 inhibits 4EBP1, leading to the translational initiation [8]. Insulin also directly activates mTORC1 kinase activity, followed by increasing the association of 4EBP1 and raptor in mTORC1 [18]. The major insulin-responsive form of mTORC1 is the dimeric mTORC1 complex, a structure containing two heterodimers of mTOR, raptor, and mLST8 [18]. This complex has been confirmed by both cryo-electromicroscopy (EM) and single molecule pull-down (SiMPull) [19,20]. Two of the upstream stimuli of mTORC1, namely phosphatidic acid and amino acids, will be discussed in the following sections.
2.2. Phosphatidic Acid: An Upstream Stimulus of mTORC1
The lipid second messenger phosphatidic acid (PA) has been identified as a critical mediator of mTOR signaling [21]. PA physically associates with the FKBP12-rapamycin-binding (FRB) domains of mTOR surrounding amino acids 2015 to 2114 in a highly specific manner, as confirmed by nuclear magnetic resonance (NMR) spectroscopy [22,23]. Among several enzymes in PA biogenesis, phospholipase D1 (PLD1), which hydrolyzes phosphatidylcholine to produce phosphatidic acid, is a critical regulator of mTOR signaling induced by mitogens and amino acids [21,24,25]. Recent reports have revealed the mechanism of how PLD1-generated PA activates mTOR kinase activity. PA specifically activates mTORC1 activity in vitro without affecting mTORC2 activity [26]. Although PA maintains the stability of mTORC1 and mTORC2 at the steady state [27], PLD1-generated PA displaces DEPTOR from mTORC1 [28]. PLD1-generated PA has at least one unsaturated fatty acid chain [29], which confers affinity to the FK506 binding protein (FKBP)-rapamycin binding (FRB) domain of mTOR, leading to the displacement of DEPTOR and subsequent mTORC1 activation in vivo and in vitro [28].
2.3. Amino Acids: An Upstream Stimulus of mTORC1
Amino acid availability regulates mTORC1 activity through the RAS-related GTP-binding protein (Rag) family of small GTPases [30], which is distinct from the growth factors. Whereas growth factors regulate mTORC1 kinase activity, amino acid availability induces mTORC1 localization to the lysosome, which is essential for mTORC1 activation [31]. Rags form heterodimers of either Rag A or Rag B with either Rag C or Rag D [30]. Amino acids convert Rags to active conformation (Rag A or Rag B is loaded with GTP and Rag C or Rag D with GDP) [8,30]. Amino acid availability and mTORC1 translocation by Rag family GTPases are prerequisites for mTORC1 activation on the outer surface of the lysosome, where RHEB resides [30]. Ragulator (also known as LAMTOR: Lysosomal Adaptor and Mitogen-activated protein kinase and mTOR activator) is a pentameric complex that is responsible for tethering the Rag proteins to the lysosomal surface. It also acts as a guanine nucleotide exchange factor (GEF) for Rag A or Rag B [32,33]. In addition, several cell-based biochemical studies demonstrated that GAPs as well as other regulatory proteins operate upstream of Rag GTPases [34,35,36,37,38,39].
Vps34, a class III phosphoinositide 3-kinase (PI3K), also acts as an amino acid mediator in mTOR signaling [40,41]. In the presence of amino acids, Vps34 produces phosphatidylinositol-3-phosphate (PtdIns(3)P) from phosphatidylinositol (PtdIns), which is followed by mTORC1 activation. The mechanisms by which Vps34 regulates mTORC1 in amino acid signaling have been suggested. Gulati et al. proposed that amino acids enhance the interaction of Ca2+/calmodulin (CaM) with Vps34-mTOR by facilitating Ca2+ influx, resulting in mTORC1 activation [42]. A recent study identified leucyl-tRNA synthetase (LeuRS) as an amino acid sensor of Vps34 [43]. In addition to the conservative LeuRS function of producing Leu-tRNA, LeuRS has been identified as a cytosolic amino acid sensor in mTORC1 signaling, serving as a GAP for Rag D [44]. Moreover, LeuRS binds to Vps34 via the minimum-binding site (amino acid 361 to 720) at the N-terminus and activates Vps34 through the C-terminal unique domain of LeuRS, UNE-L, in a nonautophagic complex (Atg14L-deficient Vps34 complexes), in which amino acids activate Vps34 kinase activity [43,45]. Vps34-generated PtdIns(3)P activates PLD1 through the Phox (PX) domain of PLD1 and translocates PLD1 to the lysosome where mTORC1 is recruited [25]. PLD1 translocation to the lysosome parallels Rag-regulated mTORC1 localization to the lysosome, although LeuRS acts as a cytosolic amino acid sensor in both processes [25]. Whether LeuRS prefers one of these parallel pathways in certain biological contexts requires further investigation.
3. Regulation of mTORC2
In contrast to mTORC1 regulation, mTORC2 regulation is poorly understood. Active mTORC2 phosphorylates the hydrophobic motif in a subset of AGC (cyclic adenosine monophosphate (cAMP)-dependent, cyclic guanosine monophosphate (cGMP)-dependent, and protein kinase C) family kinases, including Akt, serum/glucocorticoid-regulated kinase 1 (SGK1), and protein kinase C (PKC) [8]. Among the mTORC2 substrates, Akt regulates mTORC2 activity by forming a positive feedback loop [46]. 3-phosphoinositide-dependent protein kinase 1 (PDK1)-stimulated Akt phosphorylates SIN1 at threonine (T) 36, resulting in further mTORC2 activation to then fully activate Akt by phosphorylating serine (S) 473 [46].
mTORC2 is stimulated by growth factors such as insulin, insulin like growth factor (IGF), and hormones, which signal to PI3K [47]. Although both mTORC1 and mTORC2 are activated by growth factors, including insulin, the signaling mechanism of mTORC2 activation is distinct from that of mTORC1 [8]. PI3K dependent insulin signaling promotes the association of mTORC2 with ribosomes that increase mTORC2 activity [48]. In line with this, elevated PI3K signaling increases the binding of mTORC2 to ribosomes in cancer cells [49]. Ribosomes function as a scaffold for mTORC2 phosphorylation to substrates or confer the proper localization of mTORC2. However, the mechanism that induces mTORC2 activation needs to be elucidated [49].
Based on mTORC2 dependency on PI3K in insulin signaling, whether the mTORC1-driven negative feedback loop could affect mTORC2 activity is worth investigation. Using a data-driven dynamic insulin mTOR network model that integrates the entire core network, Pezze et al. suggested that mTORC2 activity is dependent on PI3K activity, which is insensitive to the mTORC1-dependent negative feedback loop [50]. This study also indicated that TSC complexes, a negative upstream regulator of mTORC1, are not required for insulin-induced mTORC2 activation [50]. However, the requirement for the TSC1-TSC2 complex was suggested for proper mTORC2 activation based on their physical interaction [51]. The existence of a negative feedback loop-independent of PI3K is conceivable and requires further investigation.
Upon growth factor stimulation, ras-related C3 botulinum toxin substrate 1 (Rac1) GTPases are proposed to translocate to the plasma membrane and recruit mTORC2 for the regulation of its activity [52]. In line with this observation, leucine induces Rac activation and cell migration through phosphatidylinositol 3,4,5-triphosphate-dependent Rac exchanger 1 (P-Rex1) and P-Rex2 in an mTORC2 dependent manner [53]. Additionally, P-Rex1 also associates with both mTORC1 and mTORC2, but activates only mTORC2 [53]. However, the mechanism of Rac1 and P-Rex-induced mTORC2 activation needs to be further clarified.
4. Insulin Signaling
Insulin binding to its receptor evokes a series of signaling events. Insulin receptor (IR) belongs to a subfamily of receptor tyrosine kinases that include the IGF-I receptor and the insulin receptor-related receptor (IRR) [11]. These receptors consist of two extracellular α-subunits (135 kDa) and two transmembrane β subunits (95 kDa), which form a tetrameric protein complex [54]. Insulin binding to its receptor leads to the autophosphorylation of its receptor on tyrosine residues of the β subunit (Tyr1158, Tyr1162, and Tyr1163), resulting in the activation of IR tyrosine kinase. The activated IR tyrosine kinase recruits its substrates and phosphorylates their tyrosine residues [55]. The family of insulin receptor substrates (IRSs: IRS-1, IRS-2, IRS-3, and IRS-4) and other substrates (GRB2-associated-binding protein1 (Gab-1), docking protein P62dok, E3 ubiquitin-protein ligase Cbl, adapter protein containing PH and SH2 domain (APS), and SHC-transforming protein (Shc)), mediating the binding of their effectors, which contain Src homology domain2 (SH2), unlike other receptor tyrosine kinases that directly bind their effectors [56,57].
While IR and IRS proteins are activated by tyrosine phosphorylation, they are inhibited by protein tyrosine phosphatases (PTPs) and serine phosphorylation [56]. Serine phosphorylation of IR and IRS proteins impairs insulin stimulated signaling by reducing their tyrosine phosphorylation and promoting their interaction with 14-3-3 [11,58]. The rapid dephosphorylation of tyrosine phosphorylation by PTPs also attenuates insulin signaling. Knockout of protein tyrosine phosphatase 1B (PTP1B), a cytoplasmic PTP, increased tyrosine phosphorylation of IR and IRS-1 in muscle, leading to an increase in insulin sensitivity [59,60].
The association of IRSs with p85, the regulatory subunit of PI3K [61], leads to the recruitment of p110, a PI3K catalytic subunit. p110 is recruited near its physiological substrate phosphatidylinositol (4,5) bisphosphate (PtdIns(4,5)P2), which it phosphorylates at the D3 position of the inositol ring to generate PtdIns(3,4,5)P3 [62]. The subsequent increase of PtdIns(3,4,5)P3 leads to the recruitment of its key effector of insulin signaling, Akt from the cytosol to the plasma membrane by binding to a pleckstrin homology (PH) domain in the amino terminus of Akt [62]. This association brings Akt close to PDK1 and mTORC2 (functions as PDK2), leading to the phosphorylation of Akt on threonine 308 and serine 473, respectively [8].
Activated Akt is dissociated from the plasma membrane and is phosphorylated by a myriad of substrates, which is important for regulating insulin dependent processes [62]. Glycogen synthase kinase 3 (GSK-3) is inactivated following its phosphorylation by Akt [11], leading to the activation of glycogen synthase, which catalyzes the final step of glycogen synthesis [62]. Akt also phosphorylates and inhibits the Rab-GTPase-activating protein, AS160 (for Akt substrate of 160 KD) [63]. This prompts the translocation of the glucose transporter GLUT4 to the plasma membrane by activating Rab small GTPases and controlling cytoskeletal reorganization [63]. In addition, Akt phosphorylates several of the winged helix or forkhead box protein O (FOXO) class of transcription factors that are critical for the expression of gluconeogenic and lipogenic enzymes. For example, FOXO1 activates gluconeogenic genes in the liver [64] and inhibits adipogenesis [65]. Insulin-activated Akt phosphorylates FOXO1 at serine 256, facilitating the interaction with 14-3-3 proteins and sequestration into the cytoplasm, leading to the inhibition of the expression of gluconeogenic enzymes [56]. Akt also regulates mTORC1 signaling by phosphorylating and inhibiting TSC1/2, a negative regulator of mTORC1 [8].
Recently, the Hippo pathway has been shown to affect insulin signaling via its regulation of mTORC1 and mTORC2 [8]. The Hippo pathway plays a role in the determination of organ size by restraining the cell number through the enhancement of apoptosis and the suppression of cell proliferation [66]. G-protein coupled receptors (GPCRs) inhibit the Hippo pathway component, large tumor suppressor homolog (LATS) kinase, resulting in hypophosphorylation of the Yes-associated protein (YAP) that translocates to the nucleus [67,68]. YAP promotes the expression of the microRNA (miR)-29, which targets phosphatase and tensin homolog (PTEN) mRNA and inhibits PTEN translation [67]. The decrease in the level of PTEN, a negative regulator of PI3K-Akt signaling, increases the level of PtdIns(3,4,5)P3, leading to a further activation of both mTORC1 and mTORC2 in insulin signaling.
5. IRS Regulation by mTORC1
IRS-1 and IRS-2 contain highly similar amino-terminal pleckstrin homology (PH) and phosphotyrosine-binding (PTB) domains (~100 amino acids each), followed by long C-terminal tail regions that are apparently unstructured, whereas only IRS-2 includes the kinase regulatory loop-binding (KRLB) domain [58,69]. In addition, IRS interacts with a key phosphotyrosine in IR, which is inhibited by growth factor receptor-bound protein 10 (Grb10). mTORC1 phosphorylates and stabilizes Grb10 to block insulin signaling [70] (Figure 2).
Insulin-IRS-induced Akt activation results in indirect mTORC1 activation through the phosphorylation of TSC and PRAS40. Akt directly phosphorylates TSC2 at two sites (S939 and T1462 on the full length of the human protein) and possibly at two or three more sites (S981 and S1130/S1132) [71]. TSC2 forms a complex with TSC1 and functions as a GAP for RHEB, as discussed in Section 2. Additionally, Akt directly phosphorylates PRAS40 at T246 [72]. PRAS40 has been shown to interact with mTORC1, which negatively regulates mTORC1 signaling [73]. Phosphorylated PRAS40 binds to 14-3-3 proteins, which have been proposed to sequester PRAS40 away from mTORC1 [74]. In addition to Akt signaling to mTORC1, nutrient signals, (e.g., amino acids, especially branched chain amino acids (BCAAs)) stimulate mTORC1/S6K1 independently of Akt-IRS-1.
Serine/threonine phosphorylation of IRS affects its tyrosine dephosphorylation, its dissociation from IR, its intracellular localization, and its eventual degradation in a proteasome dependent manner through the different mechanisms [58,75,76]. Activated mTORC1 negatively regulates insulin signaling by phosphorylating IRS-1 at serine residues. In vitro studies demonstrated that S6K1 phosphorylates mouse (m)S302 and mS522 (human (h)S307 and hS527) of IRS-1 [77], and mTORC1 phosphorylates mS632 (hS636) of IRS-1 [78]. In addition, in vivo S6K1 phosphorylates other S/T residues (mS265/hS270 and mS1097/hS1101) [79,80], whereas mTORC1 and other kinases phosphorylate S/T residues (mS307 /hS312 and mS612/hS616) [77]. Genetic deletion of S6K1 protects mice from obesity and insulin resistance under high fat diet (HFD)-fed conditions. In these mice, IRS-1 phosphorylation at S302, S632 (in adipose tissue), and S1097 (in liver) are reduced to similar levels in regular chow (RC)-fed mice, supporting the role of active S6K1 in IRS-1 phosphorylation at serine residues [13]. However, raptor binds to Shc and IRS-1 NPXY binding (SAIN) domain of IRS-1 and phosphorylates S636/639 by mTOR [78]. This is regulated in a nutrient dependent and S6K1 independent manner. These results suggest that mTORC1 and S6K1 regulate IRS-1 independently. A recent study using quantitative mass-spectrometry of hyperinsulinemic-euglycemic clamped human muscle demonstrated that the desensitization of insulin signaling correlates with the phosphorylation of IRS-1 at hS312, hS616, hS636, and hS1101, supporting the negative feedback regulation of mTORC1-S6K1 [81]. The over-supply of nutrients in obesity is suspected to activate mTORC1, resulting in an increase of IRS phosphorylation at serine residues and the development of insulin resistance. Therefore, IRS acts as not only an upstream regulator of mTORC1 but also as a receiver of feedback regulation through Ser/Thr phosphorylation (Figure 2).
However, several reports have suggested that serine phosphorylation correlates with insulin sensitivity. hS307 (mS302) phosphorylation of IRS-1 promotes insulin signaling in cell culture, which affects the insulin-stimulated tyrosine phosphorylation of IRS-1 and p85 binding, as well as mTORC1 signaling [82]. Consistent with this study, hS307 phosphorylation of IRS-1 in human primary adipocytes correlates with the insulin sensitivity in an mTORC1 dependent manner [83] and is attenuated in adipocytes of patients with type 2 diabetes [84]. IRS-1 mS307 (hS312) has been shown to protect mice against HFD-induced insulin resistance without affecting phosphorylation at other serine residues and while maintaining PI3K binding to IRS-1 [85]. Furthermore, several studies suggest that serine phosphorylation of IRS-1 serves as a priming signal to insulin signaling [86] or reduces tyrosine dephosphorylation [87] and inhibitory S/T phosphorylation [88] to strengthen the output insulin signal. The mechanism by which mTORC1/S6K1-induces IRS-1 serine phosphorylation in opposite directions of insulin signaling warrants further investigation.
6. IR/IRS Regulation by mTORC2
As discussed above, the roles of mTORC1 in activating and down regulating insulin signaling have been relatively well characterized. On the other hand, the positive role of mTORC2 in IGF signaling was suggested through its regulation of IGF II translation [89]. mTORC2 promotes IGF II translation by phosphorylating the RNA-binding protein IMP1 (IGF2 mRNA-binding protein 1) at serine 181. S181 phosphorylation of IMP1 strongly increased the binding of IMP1 to the 5′ untranslated region of IGF II-leader 3, which is essential for its mRNA translational initiation via internal ribosomal entry.
Recently, Yin et al. demonstrated the direct regulation of mTORC2 in IGF-IR and IR [90]. Unexpectedly, in addition to the well-established mTOR serine/threonine kinase activity, mTOR directly phosphorylates tyrosine residues in IGF-IR/IR in a cell free system [90]. Rictor is required for the tyrosine kinase activity of mTOR in cells. In addition, IRS-1 directly interacts with SIN1 to recruit mTORC2 to IGF-IR/IR and promote the phosphorylation of IGF-IR/IR on Y1131/1136 and Y1146/1151. These phosphorylations are not regulated by the intrinsic kinase activity of IGF-IR/IR. Hence, these results suggest that mTORC2 functions as a tyrosine kinase for IGF-IR/IR.
In addition, the role of mTORC2 was suggested in IRS-1 degradation. Kim et al. reported that mTORC2 negatively regulates IRS-1 levels by regulating the stability and localization of F-box/WD repeat-containing protein 8 (Fbw8), the substrate-targeting subunit of the cullin-7 (CUL7) E3 ligase complex [91]. mTORC2 phosphorylates Fbw8 to enable its translocation to the cytosol upon insulin stimulation. Fbw8 mediates the ubiquitylation and degradation of IRS-1, which is required for the proper turnover of IRS-1 and the removal of inactive IRS-1 in the cytosol [91]. However, other reports showed discrepant observations that acute rapamycin treatment or mTORC2 inhibition did not decrease IRS-1 [78,92], which is requires further investigation.
7. The Role of mTOR in Insulin-Induced Glucose and Lipid Metabolism
The postprandial increase of glucose and insulin activates mTOR within metabolic tissues to control whole body metabolic homeostasis (Figure 3). mTORC2 regulates glucose homeostasis through Akt. Akt promotes glucose uptake by increasing GLUT4 translocation to the membrane in adipocytes [93]. In addition, Akt phosphorylates and deactivates GSK-3, which decreases the rate of phosphorylation of glycogen synthase. This leads to an increase in glycogen synthase activity, thus elevating the accumulation of glycogen, which is especially important in the muscles and liver [71]. Akt also controls glucose homeostasis by phosphorylating and inhibiting FOXO1, a transcription factor that regulates gluconeogenesis [94].
mTOR signaling promotes hepatic lipogenesis through the regulation of sterol regulatory element-binding protein (SREBP)s, which include three isoforms, SREBP1a, SREBP1c, and SREBP2. Insulin-stimulated mTORC1/S6K1 facilitates to accumulate the mature form of SREBP1, activates the expression of SREBP1 and genes involved in both steroid and fatty acid biosynthesis, and elevates lipogenesis [95,96]. In addition, S6K1 promotes the processing of SREBP1 in the liver and of SREBP2 in a hepatocellular carcinoma cell line [97,98,99]. Additionally, mTORC1 phosphorylates and blocks the nuclear entry of the phosphatidic acid phosphatase lipin1, which has an inhibitory effect on nuclear SREBP levels by controlling nuclear lamina [100]. Further, mTORC2 plays an essential role in regulating SREBPs in mTORC1 dependent and independent manners [101]. Akt activates SREBP via the repression of the SREBP inhibitor Insig, Insig2a [102], or the inactivation of GSK3, which mediates SREBP phosphorylation and degradation [103].
mTORC1 is involved in promoting the storage of fatty acids in lipid stores by inhibiting lipolysis [2]. Elevated lipolysis was observed under the inhibition of mTORC1 activity in adipose tissue through genetic modulation (S6K1 knockout mice or 4EBP1/2 double knockout) or rapamycin treatment [13,104,105,106]. In addition, mTORC1 has been shown to have an impact on three lipases: adipose triglyceride lipase (ATGL), hormone-sensitive lipase (HSL), and lipoprotein lipase (LPL) [2]. ATGL in adipocytes catalyzes the lipolysis of triacylglycerol (TAGs) to diacylglycerol (DAG), and then HSL converts DAG to monoacylglycerols (MAGs). mTORC1 suppresses the transcription of ATGL [14], reduces HSL activity by phosphorylating at Ser563 [106], and decreases the activity of the extracellular lipase LPL [107], a water-soluble lipase in plasma that facilitates the uptake of lipoprotein in tissues.
In line with the negative role of mTOR in lipolysis, mTORC1 is implicated in the inhibition of the β-oxidation of fatty acids and ketogenesis. mTORC1 enhances the nuclear accumulation of nuclear receptor corepressor 1 (NcoR1) and thus inhibits the activity of PPARα, resulting in the suppression of ketogenic gene expression [108]. mTORC1 decreases the β-oxidation of fatty acids and promotes mitochondrial biogenesis in some cellular contexts [2]. In addition, mTORC1 coordinates various levels of gene expression, leading to its control of the mitochondrial mass and functions. mTORC1 controls the 4EBP1-mediated translation of nuclear-encoded mitochondrial mRNAs such as transcription factor A, mitochondrial (TFAM), mitochondrial ribosomal proteins, and components of complex I and V [109] The inhibition of mTORC1 activity blocks the interaction of Yin-Yang 1 (YY1) with peroxisome proliferator-activated receptor gamma coactivator 1 (PGC1)-α, subsequently decreasing the expression of mitochondrial genes [110]. mTOR directly governs the transcription of Estrogen related receptor α (ERRα)-target genes that is responsible for mitochondrial function and energy metabolism [111].
As the central controller of nutrient-sensing signaling pathways and cell growth, mTOR is involved in β-cell survival and insulin secretion. The survival and death of β cells are affected by intracellular and extracellular nutrients such as glucose and amino acids [112,113]. β-cell mass is reduced in chronic rapamycin-treated rats [114]. S6K1 knockout mice have small-sized β cells [13]. Mice with rictor deficiencies exhibit mild hyperglycemia and glucose intolerance, owing to reduced β-cell mass and defects in glucose-induced insulin secretion [115]. Hence, these observations suggest a crucial role of mTOR signaling in the growth and functions of β cells. Recently, mTOR has been shown to reduce the expression of thioredoxin-interacting protein (TXNIP), a potent inducer of β-cell death and oxidative stress, through its association with the carbohydrate-response element-binding protein (ChREBP)-Max-like protein (Mlx) complex [116]. mTOR deficiency reduces β-cell survival and aggravates oxidative stress, together with the elevation in TXNIP and ChREBP levels, suggesting the importance of the mTOR-controlled transcriptional regulation network in β-cell survival and glucose homeostasis [116]. However, Alejandro et al. showed that mTOR-induced signaling is required for β-cell functions, not for β-cell mass, under both normal and HFD conditions, using tetracycline-off inducible mice overexpressing a kinase-dead mTOR mutant in β cells [117]. mTOR activity is closely associated with the expression of Pdx-1, a critical transcription factor regulating pancreatic development and the function and survival of β cells [117]. Additional studies need to further dissect the role of mTOR in the survival and function of β cells.
8. mTOR and Autophagy
While mTOR promotes anabolic processes in response to growth factors and nutrients, it also inhibits catabolic processes, mainly autophagy, to support cell growth. Autophagy is a self-cannibalization that contributes to the removal of damaged cell components and provides the energy sources and substrates for protein synthesis under starvation [118]. A series of ATG proteins induces autophagosome formation by sensing stress and starvation. ULK1 (yeast Atg1 mammalian homolog) is a critical initiator of autophagosome formation, which is tightly regulated by mTORC1 and 5′-AMP-activated protein kinase (AMPK) [119]. Under the abundance of nutrients, mTORC1 binds to ULK1, phosphorylates ULK1 and the mammalian homolog of Atg13, and inhibits ULK1 activity, resulting in the overall inhibition of autophagosome formation [119]. When cells are starved, inactivated mTORC1 dissociates from the ULK1 complex (ATG101, Atg13, and FIP2000), freeing itself to initiate the autophagosome formation [118]. Of note, the dual regulation of ULK1 by AMPK and mTORC1 is important for determining the extent of autophagy induction [16]; AMPK directly phosphorylates ULK1 at Ser 317 and 377 and activates ULK1 under glucose starvation, whereas mTORC1 phosphorylates ULK1 at Ser 757 and dissociates ULK1-AMPK complex, inhibiting ULK1 with glucose [120]. In addition, mTOR directly phosphorylates ATG14 at multiple sites, which leads to the inhibition of Vps34 kinase activity and the subsequent production of PtdIns(3)P [121].
Moreover, mTOR controls autophagy at the transcriptional level; mTOR phosphorylates the transcription factor EB (TFEB) at Ser 211 and subsequently inhibits the nuclear translocation of TFEB [122,123]. TFEB belongs to the basic helix-loop-helix leucine-zipper family of transcription factors (TFs) and promotes the expression of lysosomal biogenesis and autophagic genes [124]. The nuclear localization of TFEB and its activity correlate to its phosphorylation; phosphorylated TFEB prefers to associate with the members of 14-3-3 tyrosine 3-monooxygenase/tryptophan 5-monooxygenase activation protein (YWHA) family and to remain in the cytosol [124].
Autophagy plays a cytoprotective role by maintaining the integrity of the endoplasmic reticulum (ER) and mitochondria [125,126]. Autophagy eliminates ubiquitinated proteins and damaged organelles, which could form toxic aggregates [127]. Mitochondrial dysfunction and damaged mitochondria result in the accumulation of reactive oxygen species (ROS), possibly leading to insulin resistance [127,128]. A recent study showed that the reverse of autophagic dysfunction enhances insulin sensitivity in the adipose tissue of obese mice [129], suggesting the correlation between autophagy and insulin sensitivity. Furthermore, the regulation of autophagy in β cells is important for the proper functioning of the ER and mitochondria, which is critical for β cell survival [130]. Interferon α-induced ER stress in β cells impairs insulin secretion [131]. β cell-specific ATG7 deletion reduces β-cell mass and pancreatic insulin levels, together with mitochondrial swelling and ER distension [132]. Additionally, autophagy is required for the homeostasis of glucose tolerance and β-cell hyperplasia under high-fat diet conditions [133]. Thus, autophagy can protect β cells from cellular damage and maintain β-cell functions regarding insulin sensitivity.
9. Conclusions and Future Directions
We have summarized and highlighted the studies of mTOR regulation in insulin signaling. mTORC1 and mTORC2 are the main protein kinases that phosphorylate and activate several downstream protein kinases and AGC family member kinases. mTOR senses the external and the internal signals, especially nutrient signals, to regulate cellular growth and survival. Insulin serves as a major controller of blood glucose levels to regulate the glucose uptake into muscle and fat and gluconeogenesis in the liver. Insulin also facilitates the accumulation of glycogen and lipid by promoting lipogenesis and glycogen and protein synthesis in the muscles, liver, and fat. A postprandial increase of insulin and glucose acutely activates mTOR within metabolic tissues, in which mTOR plays an important role in glucose and lipid metabolism.
Hyperactive mTORC1 has been observed in obesity and nutrient overload, probably due to hyperglycemia and hyperinsulinemia. The increased levels of BCAAs, mTORC1 stimuli, are closely connected to insulin resistance and obesity [134,135]. Chronic mTORC1 activation could further increase lipid storage in adipose tissues and develop insulin resistance via negative feedback regulation through the phosphorylation of IRS-1 at serine residues [7,134]. Thus it has been suggested that mTOR inhibitors might offer therapeutic benefits in metabolic diseases such as insulin resistance and obesity [2]. However, since mTOR inhibitors block mTORC2/Akt activity and thereby further exacerbate insulin insensitivity, it might be more promising to target mTORC1 specifically in a direct or indirect manner. There are two mTORC1–specific regulations, amino acid- or AMPK-dependent. Amino acids activate mTORC1 without affecting mTORC2 activity through amino acid sensors and mediators [16]. AMPK inhibits mTORC1 through the phosphorylation of the TSC-TBC complex and raptor [136]. Therefore, inhibitors of amino acid-mediated signaling or AMPK might provide beneficial metabolic effects; however, this requires further investigation.
Acknowledgments
This research was supported by the Basic Science Research Program through the National Research Foundation of Korea (NRF) and funded by the Ministry of Education (Grant number: NRF-2015R1D1A1A01058313), the Korea Health Technology R&D Project through the Korea Health Industry Development Institute (KHIDI), funded by the Ministry of Health and Welfare (Grant number: HI17C0426) and the Gachon University Gil Medical Center (Grant number: 2015-15).
Conflicts of Interest
The author declares no conflicts of interest.
References
- Laplante, M.; Sabatini, D.M. mTOR signaling in growth control and disease. Cell 2012, 149, 274–293. [Google Scholar] [CrossRef] [PubMed]
- Ricoult, S.J.; Manning, B.D. The multifaceted role of mTORC1 in the control of lipid metabolism. Eur. Mol. Biol. Organ. Rep. 2013, 14, 242–251. [Google Scholar] [CrossRef] [PubMed]
- Sarbassov, D.D.; Ali, S.M.; Kim, D.H.; Guertin, D.A.; Latek, R.R.; Erdjument-Bromage, H.; Tempst, P.; Sabatini, D.M. Rictor, a novel binding partner of mTOR, defines a rapamycin-insensitive and raptor-independent pathway that regulates the cytoskeleton. Curr. Biol. 2004, 14, 1296–1302. [Google Scholar] [CrossRef] [PubMed]
- Polak, P.; Hall, M.N. mTOR and the control of whole body metabolism. Curr. Opin. Cell Biol. 2009, 21, 209–218. [Google Scholar] [CrossRef] [PubMed]
- Cybulski, N.; Hall, M.N. TOR complex 2: A signaling pathway of its own. Trends Biochem. Sci. 2009, 34, 620–627. [Google Scholar] [CrossRef] [PubMed]
- Sarbassov, D.D.; Ali, S.M.; Sengupta, S.; Sheen, J.H.; Hsu, P.P.; Bagley, A.F.; Markhard, A.L.; Sabatini, D.M. Prolonged rapamycin treatment inhibits mTORC2 assembly and Akt/PKB. Mol. Cell 2006, 22, 159–168. [Google Scholar] [CrossRef] [PubMed]
- Yoon, M.S.; Choi, C.S. The role of amino acid-induced mammalian target of rapamycin complex 1 (mTORC1) signaling in insulin resistance. Exp. Mol. Med. 2016, 48, e201. [Google Scholar] [CrossRef] [PubMed]
- Shimobayashi, M.; Hall, M.N. Making new contacts: The mTOR network in metabolism and signalling crosstalk. Nat. Rev. Mol. Cell Biol. 2014, 15, 155–162. [Google Scholar] [CrossRef] [PubMed]
- Chang, L.; Chiang, S.H.; Saltiel, A.R. Insulin signaling and the regulation of glucose transport. Mol. Med. 2004, 10, 65–71. [Google Scholar] [PubMed]
- Fu, Z.; Gilbert, E.R.; Liu, D. Regulation of insulin synthesis and secretion and pancreatic β-cell dysfunction in diabetes. Curr. Diabetes Rev. 2013, 9, 25–53. [Google Scholar] [CrossRef] [PubMed]
- Saltiel, A.R.; Kahn, C.R. Insulin signalling and the regulation of glucose and lipid metabolism. Nature 2001, 414, 799–806. [Google Scholar] [CrossRef] [PubMed]
- Dibble, C.C.; Manning, B.D. Signal integration by mTORC1 coordinates nutrient input with biosynthetic output. Nat. Cell Biol. 2013, 15, 555–564. [Google Scholar] [CrossRef] [PubMed]
- Um, S.H.; Frigerio, F.; Watanabe, M.; Picard, F.; Joaquin, M.; Sticker, M.; Fumagalli, S.; Allegrini, P.R.; Kozma, S.C.; Auwerx, J.; et al. Absence of S6K1 protects against age- and diet-induced obesity while enhancing insulin sensitivity. Nature 2004, 431, 200–205. [Google Scholar] [CrossRef] [PubMed]
- Chakrabarti, P.; English, T.; Shi, J.; Smas, C.M.; Kandror, K.V. Mammalian target of rapamycin complex 1 suppresses lipolysis, stimulates lipogenesis, and promotes fat storage. Diabetes 2010, 59, 775–781. [Google Scholar] [CrossRef] [PubMed]
- Kumar, A.; Lawrence, J.C., Jr.; Jung, D.Y.; Ko, H.J.; Keller, S.R.; Kim, J.K.; Magnuson, M.A.; Harris, T.E. Fat cell-specific ablation of rictor in mice impairs insulin-regulated fat cell and whole-body glucose and lipid metabolism. Diabetes 2010, 59, 1397–1406. [Google Scholar] [CrossRef] [PubMed]
- Saxton, R.A.; Sabatini, D.M. mTOR signaling in growth, metabolism, and disease. Cell 2017, 169, 361–371. [Google Scholar] [CrossRef] [PubMed]
- Menon, S.; Dibble, C.C.; Talbott, G.; Hoxhaj, G.; Valvezan, A.J.; Takahashi, H.; Cantley, L.C.; Manning, B.D. Spatial control of the TSC complex integrates insulin and nutrient regulation of mTORC1 at the lysosome. Cell 2014, 156, 771–785. [Google Scholar] [CrossRef] [PubMed]
- Wang, L.; Rhodes, C.J.; Lawrence, J.C., Jr. Activation of mammalian target of rapamycin (mTOR) by insulin is associated with stimulation of 4EBP1 binding to dimeric mTOR complex 1. J. Biol. Chem. 2006, 281, 24293–24303. [Google Scholar] [CrossRef] [PubMed]
- Yip, C.K.; Murata, K.; Walz, T.; Sabatini, D.M.; Kang, S.A. Structure of the human mTOR complex i and its implications for rapamycin inhibition. Mol. Cell 2010, 38, 768–774. [Google Scholar] [CrossRef] [PubMed] [Green Version]
- Jain, A.; Arauz, E.; Aggarwal, V.; Ikon, N.; Chen, J.; Ha, T. Stoichiometry and assembly of mTOR complexes revealed by single-molecule pulldown. Proc. Natl. Acad. Sci. USA 2014, 111, 17833–17838. [Google Scholar] [CrossRef] [PubMed]
- Fang, Y.; Vilella-Bach, M.; Bachmann, R.; Flanigan, A.; Chen, J. Phosphatidic acid-mediated mitogenic activation of mTOR signaling. Science 2001, 294, 1942–1945. [Google Scholar] [CrossRef] [PubMed]
- Sun, Y.; Chen, J. mTOR signaling: PLD takes center stage. Cell Cycle 2008, 7, 3118–3123. [Google Scholar] [CrossRef] [PubMed]
- Veverka, V.; Crabbe, T.; Bird, I.; Lennie, G.; Muskett, F.W.; Taylor, R.J.; Carr, M.D. Structural characterization of the interaction of mTOR with phosphatidic acid and a novel class of inhibitor: Compelling evidence for a central role of the FRB domain in small molecule-mediated regulation of mTOR. Oncogene 2008, 27, 585–595. [Google Scholar] [CrossRef] [PubMed]
- Fang, Y.; Park, I.H.; Wu, A.L.; Du, G.; Huang, P.; Frohman, M.A.; Walker, S.J.; Brown, H.A.; Chen, J. PLD1 regulates mTOR signaling and mediates Cdc42 activation of S6K1. Curr. Biol. 2003, 13, 2037–2044. [Google Scholar] [CrossRef] [PubMed]
- Yoon, M.S.; Du, G.; Backer, J.M.; Frohman, M.A.; Chen, J. Class III PI-3-kinase activates phospholipase D in an amino acid-sensing mTORC1 pathway. J. Cell Biol. 2011, 195, 435–447. [Google Scholar] [CrossRef] [PubMed]
- Yoon, M.S.; Sun, Y.; Arauz, E.; Jiang, Y.; Chen, J. Phosphatidic acid activates mammalian target of rapamycin complex 1 (mTORC1) kinase by displacing FK506 binding protein 38 (FKBP38) and exerting an allosteric effect. J. Biol. Chem. 2011, 286, 29568–29574. [Google Scholar] [CrossRef] [PubMed]
- Toschi, A.; Lee, E.; Xu, L.; Garcia, A.; Gadir, N.; Foster, D.A. Regulation of mTORC1 and mTORC2 complex assembly by phosphatidic acid: Competition with rapamycin. Mol. Cell Biol. 2009, 29, 1411–1420. [Google Scholar] [CrossRef] [PubMed]
- Yoon, M.S.; Rosenberger, C.L.; Wu, C.; Truong, N.; Sweedler, J.V.; Chen, J. Rapid mitogenic regulation of the mTORC1 inhibitor, deptor, by phosphatidic acid. Mol. Cell 2015, 58, 549–556. [Google Scholar] [CrossRef] [PubMed]
- Pettitt, T.R.; McDermott, M.; Saqib, K.M.; Shimwell, N.; Wakelam, M.J. Phospholipase D1b and D2a generate structurally identical phosphatidic acid species in mammalian cells. Biochem. J. 2001, 360, 707–715. [Google Scholar] [CrossRef] [PubMed]
- Sancak, Y.; Peterson, T.R.; Shaul, Y.D.; Lindquist, R.A.; Thoreen, C.C.; Bar-Peled, L.; Sabatini, D.M. The rag gtpases bind raptor and mediate amino acid signaling to mTORC1. Science 2008, 320, 1496–1501. [Google Scholar] [CrossRef] [PubMed]
- Efeyan, A.; Comb, W.C.; Sabatini, D.M. Nutrient-sensing mechanisms and pathways. Nature 2015, 517, 302–310. [Google Scholar] [CrossRef] [PubMed]
- Sancak, Y.; Bar-Peled, L.; Zoncu, R.; Markhard, A.L.; Nada, S.; Sabatini, D.M. Ragulator-rag complex targets mTORC1 to the lysosomal surface and is necessary for its activation by amino acids. Cell 2010, 141, 290–303. [Google Scholar] [CrossRef] [PubMed] [Green Version]
- Bar-Peled, L.; Schweitzer, L.D.; Zoncu, R.; Sabatini, D.M. Ragulator is a gef for the rag gtpases that signal amino acid levels to mTORC1. Cell 2012, 150, 1196–1208. [Google Scholar] [CrossRef] [PubMed]
- Bar-Peled, L.; Chantranupong, L.; Cherniack, A.D.; Chen, W.W.; Ottina, K.A.; Grabiner, B.C.; Spear, E.D.; Carter, S.L.; Meyerson, M.; Sabatini, D.M. A tumor suppressor complex with gap activity for the rag gtpases that signal amino acid sufficiency to mTORC1. Science 2013, 340, 1100–1106. [Google Scholar] [CrossRef] [PubMed]
- Panchaud, N.; Peli-Gulli, M.P.; De Virgilio, C. Amino acid deprivation inhibits TORC1 through a GTPase-activating protein complex for the Rag family GTPase Gtr1. Sci. Signal 2013, 6, ra42. [Google Scholar] [CrossRef] [PubMed]
- Tsun, Z.Y.; Bar-Peled, L.; Chantranupong, L.; Zoncu, R.; Wang, T.; Kim, C.; Spooner, E.; Sabatini, D.M. The folliculin tumor suppressor is a GAP for the RagC/D GTPases that signal amino acid levels to mTORC1. Mol. Cell 2013, 52, 495–505. [Google Scholar] [CrossRef] [PubMed]
- Petit, C.S.; Roczniak-Ferguson, A.; Ferguson, S.M. Recruitment of folliculin to lysosomes supports the amino acid-dependent activation of Rag GTPases. J. Cell Biol. 2013, 202, 1107–1122. [Google Scholar] [CrossRef] [PubMed]
- Chantranupong, L.; Wolfson, R.L.; Orozco, J.M.; Saxton, R.A.; Scaria, S.M.; Bar-Peled, L.; Spooner, E.; Isasa, M.; Gygi, S.P.; Sabatini, D.M. The sestrins interact with GATOR2 to negatively regulate the amino-acid-sensing pathway upstream of mTORC1. Cell Rep. 2014, 9, 1–8. [Google Scholar] [CrossRef] [PubMed]
- Peng, M.; Yin, N.; Li, M.O. Sestrins function as guanine nucleotide dissociation inhibitors for Rag GTPases to control mTORC1 signaling. Cell 2014, 159, 122–133. [Google Scholar] [CrossRef] [PubMed]
- Nobukuni, T.; Joaquin, M.; Roccio, M.; Dann, S.G.; Kim, S.Y.; Gulati, P.; Byfield, M.P.; Backer, J.M.; Natt, F.; Bos, J.L.; et al. Amino acids mediate mTOR/raptor signaling through activation of class 3 phosphatidylinositol 3OH-kinase. Proc. Natl. Acad. Sci. USA 2005, 102, 14238–14243. [Google Scholar] [CrossRef] [PubMed]
- Byfield, M.P.; Murray, J.T.; Backer, J.M. hVps34 is a nutrient-regulated lipid kinase required for activation of p70 S6 kinase. J. Biol. Chem. 2005, 280, 33076–33082. [Google Scholar] [CrossRef] [PubMed]
- Gulati, P.; Gaspers, L.D.; Dann, S.G.; Joaquin, M.; Nobukuni, T.; Natt, F.; Kozma, S.C.; Thomas, A.P.; Thomas, G. Amino acids activate mTOR complex 1 via Ca2+/CaM signaling to hVps34. Cell Metab. 2008, 7, 456–465. [Google Scholar] [CrossRef] [PubMed]
- Yoon, M.S.; Son, K.; Arauz, E.; Han, J.M.; Kim, S.; Chen, J. Leucyl-tRNA synthetase activates Vps34 in amino acid-sensing mTORC1 signaling. Cell Rep. 2016, 16, 1510–1517. [Google Scholar] [CrossRef] [PubMed]
- Han, J.M.; Lee, M.J.; Park, S.G.; Lee, S.H.; Razin, E.; Choi, E.C.; Kim, S. Hierarchical network between the components of the multi-tRNA synthetase complex: Implications for complex formation. J. Biol. Chem. 2006, 281, 38663–38667. [Google Scholar] [CrossRef] [PubMed]
- Russell, R.C.; Tian, Y.; Yuan, H.; Park, H.W.; Chang, Y.Y.; Kim, J.; Kim, H.; Neufeld, T.P.; Dillin, A.; Guan, K.L. ULK1 induces autophagy by phosphorylating beclin-1 and activating Vps34 lipid kinase. Nat. Cell Biol. 2013, 15, 741–750. [Google Scholar] [CrossRef] [PubMed]
- Yang, G.; Murashige, D.S.; Humphrey, S.J.; James, D.E. A positive feedback loop between Akt and mTORC2 via SIN1 phosphorylation. Cell Rep. 2015, 12, 937–943. [Google Scholar] [CrossRef] [PubMed]
- Arriola Apelo, S.I.; Lamming, D.W. mTORC2 puts its shoulder to krebs’ wheel. Mol. Cell 2016, 63, 723–725. [Google Scholar] [CrossRef] [PubMed]
- Zinzalla, V.; Stracka, D.; Oppliger, W.; Hall, M.N. Activation of mTORC2 by association with the ribosome. Cell 2011, 144, 757–768. [Google Scholar] [CrossRef] [PubMed]
- Oh, W.J.; Jacinto, E. mTOR complex 2 signaling and functions. Cell Cycle 2011, 10, 2305–2316. [Google Scholar] [CrossRef] [PubMed]
- Dalle Pezze, P.; Sonntag, A.G.; Thien, A.; Prentzell, M.T.; Godel, M.; Fischer, S.; Neumann-Haefelin, E.; Huber, T.B.; Baumeister, R.; Shanley, D.P.; et al. A dynamic network model of mTOR signaling reveals TSC-independent mTORC2 regulation. Sci. Signal 2012, 5, ra25. [Google Scholar] [CrossRef] [PubMed]
- Huang, J.; Dibble, C.C.; Matsuzaki, M.; Manning, B.D. The TSC1-TSC2 complex is required for proper activation of mTOR complex 2. Mol. Cell Biol. 2008, 28, 4104–4115. [Google Scholar] [CrossRef] [PubMed]
- Saci, A.; Cantley, L.C.; Carpenter, C.L. Rac1 regulates the activity of mTORC1 and mTORC2 and controls cellular size. Mol. Cell 2011, 42, 50–61. [Google Scholar] [CrossRef] [PubMed]
- Hernandez-Negrete, I.; Carretero-Ortega, J.; Rosenfeldt, H.; Hernandez-Garcia, R.; Calderon-Salinas, J.V.; Reyes-Cruz, G.; Gutkind, J.S.; Vazquez-Prado, J. P-Rex1 links mammalian target of rapamycin signaling to Rac activation and cell migration. J. Biol. Chem. 2007, 282, 23708–23715. [Google Scholar] [CrossRef] [PubMed]
- Guo, S. Insulin signaling, resistance, and the metabolic syndrome: Insights from mouse models into disease mechanisms. J. Endocrinol. 2014, 220, T1–T23. [Google Scholar] [CrossRef] [PubMed]
- Van Obberghen, E.; Baron, V.; Delahaye, L.; Emanuelli, B.; Filippa, N.; Giorgetti-Peraldi, S.; Lebrun, P.; Mothe-Satney, I.; Peraldi, P.; Rocchi, S.; et al. Surfing the insulin signaling web. Eur. J. Clin. Investig. 2001, 31, 966–977. [Google Scholar] [CrossRef]
- Taniguchi, C.M.; Emanuelli, B.; Kahn, C.R. Critical nodes in signalling pathways: Insights into insulin action. Nat. Rev. Mol. Cell Biol. 2006, 7, 85–96. [Google Scholar] [CrossRef] [PubMed]
- Ullrich, A.; Schlessinger, J. Signal transduction by receptors with tyrosine kinase activity. Cell 1990, 61, 203–212. [Google Scholar] [CrossRef]
- Copps, K.D.; White, M.F. Regulation of insulin sensitivity by serine/threonine phosphorylation of insulin receptor substrate proteins IRS1 and IRS2. Diabetologia 2012, 55, 2565–2582. [Google Scholar] [CrossRef] [PubMed]
- Delibegovic, M.; Bence, K.K.; Mody, N.; Hong, E.G.; Ko, H.J.; Kim, J.K.; Kahn, B.B.; Neel, B.G. Improved glucose homeostasis in mice with muscle-specific deletion of protein-tyrosine phosphatase 1b. Mol. Cell Biol. 2007, 27, 7727–7734. [Google Scholar] [CrossRef] [PubMed]
- Elchebly, M.; Payette, P.; Michaliszyn, E.; Cromlish, W.; Collins, S.; Loy, A.L.; Normandin, D.; Cheng, A.; Himms-Hagen, J.; Chan, C.C.; et al. Increased insulin sensitivity and obesity resistance in mice lacking the protein tyrosine phosphatase-1B gene. Science 1999, 283, 1544–1548. [Google Scholar] [CrossRef] [PubMed]
- Bevan, P. Insulin signalling. J. Cell Sci. 2001, 114, 1429–1430. [Google Scholar] [PubMed]
- Lizcano, J.M.; Alessi, D.R. The insulin signalling pathway. Curr. Biol. 2002, 12, R236–R238. [Google Scholar] [CrossRef]
- Sano, H.; Kane, S.; Sano, E.; Miinea, C.P.; Asara, J.M.; Lane, W.S.; Garner, C.W.; Lienhard, G.E. Insulin-stimulated phosphorylation of a Rab GTPase-activating protein regulates GLUT4 translocation. J. Biol. Chem. 2003, 278, 14599–14602. [Google Scholar] [CrossRef] [PubMed]
- Puigserver, P.; Rhee, J.; Donovan, J.; Walkey, C.J.; Yoon, J.C.; Oriente, F.; Kitamura, Y.; Altomonte, J.; Dong, H.; Accili, D.; et al. Insulin-regulated hepatic gluconeogenesis through FOXO1-PGC-1α interaction. Nature 2003, 423, 550–555. [Google Scholar] [CrossRef] [PubMed]
- Nakae, J.; Kitamura, T.; Kitamura, Y.; Biggs, W.H., III; Arden, K.C.; Accili, D. The forkhead transcription factor FOXO1 regulates adipocyte differentiation. Dev. Cell 2003, 4, 119–129. [Google Scholar] [CrossRef]
- Zhao, B.; Tumaneng, K.; Guan, K.L. The hippo pathway in organ size control, tissue regeneration and stem cell self-renewal. Nat. Cell Biol. 2011, 13, 877–883. [Google Scholar] [CrossRef] [PubMed]
- Tumaneng, K.; Schlegelmilch, K.; Russell, R.C.; Yimlamai, D.; Basnet, H.; Mahadevan, N.; Fitamant, J.; Bardeesy, N.; Camargo, F.D.; Guan, K.L. YAP mediates crosstalk between the hippo and PI(3)K-TOR pathways by suppressing PTEN via miR-29. Nat. Cell Biol. 2012, 14, 1322–1329. [Google Scholar] [CrossRef] [PubMed]
- Yu, F.X.; Zhao, B.; Panupinthu, N.; Jewell, J.L.; Lian, I.; Wang, L.H.; Zhao, J.; Yuan, H.; Tumaneng, K.; Li, H.; et al. Regulation of the Hippo-YAP pathway by G-protein-coupled receptor signaling. Cell 2012, 150, 780–791. [Google Scholar] [CrossRef] [PubMed]
- Wu, J.; Tseng, Y.D.; Xu, C.F.; Neubert, T.A.; White, M.F.; Hubbard, S.R. Structural and biochemical characterization of the KRLB region in insulin receptor substrate-2. Nat. Struct. Mol. Biol. 2008, 15, 251–258. [Google Scholar] [CrossRef] [PubMed]
- Hsu, P.P.; Kang, S.A.; Rameseder, J.; Zhang, Y.; Ottina, K.A.; Lim, D.; Peterson, T.R.; Choi, Y.; Gray, N.S.; Yaffe, M.B.; et al. The mTOR-regulated phosphoproteome reveals a mechanism of mTORC1-mediated inhibition of growth factor signaling. Science 2011, 332, 1317–1322. [Google Scholar] [CrossRef] [PubMed] [Green Version]
- Manning, B.D.; Cantley, L.C. AKT/PKB signaling: Navigating downstream. Cell 2007, 129, 1261–1274. [Google Scholar] [CrossRef] [PubMed]
- Kovacina, K.S.; Park, G.Y.; Bae, S.S.; Guzzetta, A.W.; Schaefer, E.; Birnbaum, M.J.; Roth, R.A. Identification of a proline-rich Akt substrate as a 14-3-3 binding partner. J. Biol. Chem. 2003, 278, 10189–10194. [Google Scholar] [CrossRef] [PubMed]
- Sancak, Y.; Thoreen, C.C.; Peterson, T.R.; Lindquist, R.A.; Kang, S.A.; Spooner, E.; Carr, S.A.; Sabatini, D.M. PRAS40 is an insulin-regulated inhibitor of the mTORC1 protein kinase. Mol. Cell 2007, 25, 903–915. [Google Scholar] [CrossRef] [PubMed]
- Vander Haar, E.; Lee, S.I.; Bandhakavi, S.; Griffin, T.J.; Kim, D.H. Insulin signalling to mTOR mediated by the Akt/PKB substrate PRAS40. Nat. Cell Biol. 2007, 9, 316–323. [Google Scholar] [CrossRef] [PubMed]
- Gual, P.; Le Marchand-Brustel, Y.; Tanti, J.F. Positive and negative regulation of insulin signaling through IRS-1 phosphorylation. Biochimie 2005, 87, 99–109. [Google Scholar] [CrossRef] [PubMed]
- Shah, O.J.; Wang, Z.; Hunter, T. Inappropriate activation of the TSC/Rheb/mTOR/S6k cassette induces IRS1/2 depletion, insulin resistance, and cell survival deficiencies. Curr. Biol. 2004, 14, 1650–1656. [Google Scholar] [CrossRef] [PubMed]
- Shah, O.J.; Hunter, T. Turnover of the active fraction of IRS1 involves raptor-mTOR- and S6K1-dependent serine phosphorylation in cell culture models of tuberous sclerosis. Mol. Cell Biol. 2006, 26, 6425–6434. [Google Scholar] [CrossRef] [PubMed]
- Tzatsos, A. Raptor binds the SAIN (Shc and IRS-1 npxy binding) domain of insulin receptor substrate-1 (IRS-1) and regulates the phosphorylation of IRS-1 at Ser-636/639 by mTOR. J. Biol. Chem. 2009, 284, 22525–22534. [Google Scholar] [CrossRef] [PubMed]
- Tremblay, F.; Brule, S.; Hee Um, S.; Li, Y.; Masuda, K.; Roden, M.; Sun, X.J.; Krebs, M.; Polakiewicz, R.D.; Thomas, G.; et al. Identification of IRS-1 Ser-1101 as a target of S6K1 in nutrient- and obesity-induced insulin resistance. Proc. Natl. Acad. Sci. USA 2007, 104, 14056–14061. [Google Scholar] [CrossRef] [PubMed]
- Zhang, J.; Gao, Z.; Yin, J.; Quon, M.J.; Ye, J. S6K directly phosphorylates IRS-1 on Ser-270 to promote insulin resistance in response to TNF-α signaling through IKK2. J. Biol. Chem. 2008, 283, 35375–35382. [Google Scholar] [CrossRef] [PubMed]
- Yi, Z.; Langlais, P.; De Filippis, E.A.; Luo, M.; Flynn, C.R.; Schroeder, S.; Weintraub, S.T.; Mapes, R.; Mandarino, L.J. Global assessment of regulation of phosphorylation of insulin receptor substrate-1 by insulin in vivo in human muscle. Diabetes 2007, 56, 1508–1516. [Google Scholar] [CrossRef] [PubMed]
- Giraud, J.; Leshan, R.; Lee, Y.H.; White, M.F. Nutrient-dependent and insulin-stimulated phosphorylation of insulin receptor substrate-1 on serine 302 correlates with increased insulin signaling. J. Biol. Chem. 2004, 279, 3447–3454. [Google Scholar] [CrossRef] [PubMed]
- Ost, A.; Svensson, K.; Ruishalme, I.; Brannmark, C.; Franck, N.; Krook, H.; Sandstrom, P.; Kjolhede, P.; Stralfors, P. Attenuated mTOR signaling and enhanced autophagy in adipocytes from obese patients with type 2 diabetes. Mol. Med. 2010, 16, 235–246. [Google Scholar] [CrossRef] [PubMed]
- Danielsson, A.; Ost, A.; Nystrom, F.H.; Stralfors, P. Attenuation of insulin-stimulated insulin receptor substrate-1 serine 307 phosphorylation in insulin resistance of type 2 diabetes. J. Biol. Chem. 2005, 280, 34389–34392. [Google Scholar] [CrossRef] [PubMed]
- Copps, K.D.; Hancer, N.J.; Opare-Ado, L.; Qiu, W.; Walsh, C.; White, M.F. IRS1 serine 307 promotes insulin sensitivity in mice. Cell Metab. 2010, 11, 84–92. [Google Scholar] [CrossRef] [PubMed]
- Weigert, C.; Kron, M.; Kalbacher, H.; Pohl, A.K.; Runge, H.; Haring, H.U.; Schleicher, E.; Lehmann, R. Interplay and effects of temporal changes in the phosphorylation state of serine-302, -307, and -318 of insulin receptor substrate-1 on insulin action in skeletal muscle cells. Mol. Endocrinol. 2008, 22, 2729–2740. [Google Scholar] [CrossRef] [PubMed]
- Luo, M.; Reyna, S.; Wang, L.; Yi, Z.; Carroll, C.; Dong, L.Q.; Langlais, P.; Weintraub, S.T.; Mandarino, L.J. Identification of insulin receptor substrate 1 serine/threonine phosphorylation sites using mass spectrometry analysis: Regulatory role of serine 1223. Endocrinology 2005, 146, 4410–4416. [Google Scholar] [CrossRef] [PubMed]
- Luo, M.; Langlais, P.; Yi, Z.; Lefort, N.; De Filippis, E.A.; Hwang, H.; Christ-Roberts, C.Y.; Mandarino, L.J. Phosphorylation of human insulin receptor substrate-1 at serine 629 plays a positive role in insulin signaling. Endocrinology 2007, 148, 4895–4905. [Google Scholar] [CrossRef] [PubMed]
- Dai, N.; Christiansen, J.; Nielsen, F.C.; Avruch, J. Mtor complex 2 phosphorylates IMP1 cotranslationally to promote IGF2 production and the proliferation of mouse embryonic fibroblasts. Genes Dev. 2013, 27, 301–312. [Google Scholar] [CrossRef] [PubMed]
- Yin, Y.; Hua, H.; Li, M.; Liu, S.; Kong, Q.; Shao, T.; Wang, J.; Luo, Y.; Wang, Q.; Luo, T.; et al. mTORC2 promotes type i insulin-like growth factor receptor and insulin receptor activation through the tyrosine kinase activity of mTOR. Cell Res. 2016, 26, 46–65. [Google Scholar] [CrossRef] [PubMed]
- Kim, S.J.; DeStefano, M.A.; Oh, W.J.; Wu, C.C.; Vega-Cotto, N.M.; Finlan, M.; Liu, D.; Su, B.; Jacinto, E. mTOR complex 2 regulates proper turnover of insulin receptor substrate-1 via the ubiquitin ligase subunit Fbw8. Mol. Cell 2012, 48, 875–887. [Google Scholar] [CrossRef] [PubMed]
- O’Reilly, K.E.; Rojo, F.; She, Q.B.; Solit, D.; Mills, G.B.; Smith, D.; Lane, H.; Hofmann, F.; Hicklin, D.J.; Ludwig, D.L.; et al. mTOR inhibition induces upstream receptor tyrosine kinase signaling and activates Akt. Cancer Res. 2006, 66, 1500–1508. [Google Scholar] [CrossRef] [PubMed]
- Kohn, A.D.; Summers, S.A.; Birnbaum, M.J.; Roth, R.A. Expression of a constitutively active Akt Ser/Thr kinase in 3T3-L1 adipocytes stimulates glucose uptake and glucose transporter 4 translocation. J. Biol. Chem. 1996, 271, 31372–31378. [Google Scholar] [CrossRef] [PubMed]
- Accili, D.; Arden, K.C. Foxos at the crossroads of cellular metabolism, differentiation, and transformation. Cell 2004, 117, 421–426. [Google Scholar] [CrossRef]
- Porstmann, T.; Santos, C.R.; Griffiths, B.; Cully, M.; Wu, M.; Leevers, S.; Griffiths, J.R.; Chung, Y.L.; Schulze, A. Srebp activity is regulated by mTORC1 and contributes to Akt-dependent cell growth. Cell Metab. 2008, 8, 224–236. [Google Scholar] [CrossRef] [PubMed]
- Duvel, K.; Yecies, J.L.; Menon, S.; Raman, P.; Lipovsky, A.I.; Souza, A.L.; Triantafellow, E.; Ma, Q.; Gorski, R.; Cleaver, S.; et al. Activation of a metabolic gene regulatory network downstream of mTOR complex 1. Mol. Cell 2010, 39, 171–183. [Google Scholar] [CrossRef] [PubMed]
- Li, S.; Ogawa, W.; Emi, A.; Hayashi, K.; Senga, Y.; Nomura, K.; Hara, K.; Yu, D.; Kasuga, M. Role of S6K1 in regulation of SREBP1c expression in the liver. Biochem. Biophys. Res. Commun. 2011, 412, 197–202. [Google Scholar] [CrossRef] [PubMed]
- Owen, J.L.; Zhang, Y.; Bae, S.H.; Farooqi, M.S.; Liang, G.; Hammer, R.E.; Goldstein, J.L.; Brown, M.S. Insulin stimulation of SREBP-1c processing in transgenic rat hepatocytes requires p70 S6-kinase. Proc. Natl. Acad. Sci. USA 2012, 109, 16184–16189. [Google Scholar] [CrossRef] [PubMed]
- Wang, B.T.; Ducker, G.S.; Barczak, A.J.; Barbeau, R.; Erle, D.J.; Shokat, K.M. The mammalian target of rapamycin regulates cholesterol biosynthetic gene expression and exhibits a rapamycin-resistant transcriptional profile. Proc. Natl. Acad. Sci. USA 2011, 108, 15201–15206. [Google Scholar] [CrossRef] [PubMed]
- Peterson, T.R.; Sengupta, S.S.; Harris, T.E.; Carmack, A.E.; Kang, S.A.; Balderas, E.; Guertin, D.A.; Madden, K.L.; Carpenter, A.E.; Finck, B.N.; et al. mTOR complex 1 regulates lipin 1 localization to control the SREBP pathway. Cell 2011, 146, 408–420. [Google Scholar] [CrossRef] [PubMed]
- Hagiwara, A.; Cornu, M.; Cybulski, N.; Polak, P.; Betz, C.; Trapani, F.; Terracciano, L.; Heim, M.H.; Ruegg, M.A.; Hall, M.N. Hepatic mTORC2 activates glycolysis and lipogenesis through Akt, glucokinase, and SREBP1c. Cell Metab. 2012, 15, 725–738. [Google Scholar] [CrossRef] [PubMed]
- Yecies, J.L.; Zhang, H.H.; Menon, S.; Liu, S.; Yecies, D.; Lipovsky, A.I.; Gorgun, C.; Kwiatkowski, D.J.; Hotamisligil, G.S.; Lee, C.H.; et al. Akt stimulates hepatic SREBP1c and lipogenesis through parallel mTORC1-dependent and independent pathways. Cell Metab. 2011, 14, 21–32. [Google Scholar] [CrossRef] [PubMed]
- Bengoechea-Alonso, M.T.; Ericsson, J. A phosphorylation cascade controls the degradation of active SREBP1. J. Biol. Chem. 2009, 284, 5885–5895. [Google Scholar] [CrossRef] [PubMed]
- Le Bacquer, O.; Petroulakis, E.; Paglialunga, S.; Poulin, F.; Richard, D.; Cianflone, K.; Sonenberg, N. Elevated sensitivity to diet-induced obesity and insulin resistance in mice lacking 4E-BP1 and 4E-BP2. J. Clin. Investig. 2007, 117, 387–396. [Google Scholar] [CrossRef] [PubMed]
- Zhang, C.; Yoon, M.S.; Chen, J. Amino acid-sensing mTOR signaling is involved in modulation of lipolysis by chronic insulin treatment in adipocytes. Am. J. Physiol. Endocrinol. Metab. 2009, 296, E862–E868. [Google Scholar] [CrossRef] [PubMed]
- Soliman, G.A.; Acosta-Jaquez, H.A.; Fingar, D.C. mTORC1 inhibition via rapamycin promotes triacylglycerol lipolysis and release of free fatty acids in 3T3-L1 adipocytes. Lipids 2010, 45, 1089–1100. [Google Scholar] [CrossRef] [PubMed]
- Blanchard, P.G.; Festuccia, W.T.; Houde, V.P.; St-Pierre, P.; Brule, S.; Turcotte, V.; Cote, M.; Bellmann, K.; Marette, A.; Deshaies, Y. Major involvement of mTOR in the ppargamma-induced stimulation of adipose tissue lipid uptake and fat accretion. J. Lipid Res. 2012, 53, 1117–1125. [Google Scholar] [CrossRef] [PubMed]
- Sengupta, S.; Peterson, T.R.; Laplante, M.; Oh, S.; Sabatini, D.M. mTORC1 controls fasting-induced ketogenesis and its modulation by ageing. Nature 2010, 468, 1100–1106. [Google Scholar] [CrossRef] [PubMed]
- Morita, M.; Gravel, S.P.; Hulea, L.; Larsson, O.; Pollak, M.; St-Pierre, J.; Topisirovic, I. Mtor coordinates protein synthesis, mitochondrial activity and proliferation. Cell Cycle 2015, 14, 473–480. [Google Scholar] [CrossRef] [PubMed]
- Cunningham, J.T.; Rodgers, J.T.; Arlow, D.H.; Vazquez, F.; Mootha, V.K.; Puigserver, P. mTOR controls mitochondrial oxidative function through a YY1-PGC-1α transcriptional complex. Nature 2007, 450, 736–740. [Google Scholar] [CrossRef] [PubMed]
- Chaveroux, C.; Eichner, L.J.; Dufour, C.R.; Shatnawi, A.; Khoutorsky, A.; Bourque, G.; Sonenberg, N.; Giguere, V. Molecular and genetic crosstalks between mTOR and ERRα are key determinants of rapamycin-induced nonalcoholic fatty liver. Cell Metab. 2013, 17, 586–598. [Google Scholar] [CrossRef] [PubMed]
- Krause, M.S.; McClenaghan, N.H.; Flatt, P.R.; de Bittencourt, P.I.; Murphy, C.; Newsholme, P. L-arginine is essential for pancreatic β-cell functional integrity, metabolism and defense from inflammatory challenge. J. Endocrinol. 2011, 211, 87–97. [Google Scholar] [CrossRef] [PubMed]
- Xu, G.; Kwon, G.; Cruz, W.S.; Marshall, C.A.; McDaniel, M.L. Metabolic regulation by leucine of translation initiation through the mTOR-signaling pathway by pancreatic β-cells. Diabetes 2001, 50, 353–360. [Google Scholar] [CrossRef] [PubMed]
- Houde, V.P.; Brule, S.; Festuccia, W.T.; Blanchard, P.G.; Bellmann, K.; Deshaies, Y.; Marette, A. Chronic rapamycin treatment causes glucose intolerance and hyperlipidemia by upregulating hepatic gluconeogenesis and impairing lipid deposition in adipose tissue. Diabetes 2010, 59, 1338–1348. [Google Scholar] [CrossRef] [PubMed]
- Gu, Y.; Lindner, J.; Kumar, A.; Yuan, W.; Magnuson, M.A. Rictor/mTORC2 is essential for maintaining a balance between β-cell proliferation and cell size. Diabetes 2011, 60, 827–837. [Google Scholar] [CrossRef] [PubMed]
- Chau, G.C.; Im, D.U.; Kang, T.M.; Bae, J.M.; Kim, W.; Pyo, S.; Moon, E.Y.; Um, S.H. mTOR controls ChREBP transcriptional activity and pancreatic β cell survival under diabetic stress. J. Cell Biol. 2017, 216, 2091–2105. [Google Scholar] [CrossRef] [PubMed]
- Alejandro, E.U.; Bozadjieva, N.; Blandino-Rosano, M.; Wasan, M.A.; Elghazi, L.; Vadrevu, S.; Satin, L.; Bernal-Mizrachi, E. Overexpression of kinase-dead mTOR impairs glucose homeostasis by regulating insulin secretion and not β-cell mass. Diabetes 2017, 66, 2150–2162. [Google Scholar] [CrossRef] [PubMed]
- Rabinowitz, J.D.; White, E. Autophagy and metabolism. Science 2010, 330, 1344–1348. [Google Scholar] [CrossRef] [PubMed]
- Ueno, T.; Komatsu, M. Autophagy in the liver: Functions in health and disease. Nat. Rev. Gastroenterol. Hepatol. 2017, 14, 170–184. [Google Scholar] [CrossRef] [PubMed]
- Kim, J.; Kundu, M.; Viollet, B.; Guan, K.L. AMPK and mTOR regulate autophagy through direct phosphorylation of Ulk1. Nat. Cell Biol. 2011, 13, 132–141. [Google Scholar] [CrossRef] [PubMed]
- Yuan, H.X.; Russell, R.C.; Guan, K.L. Regulation of PIK3C3/VPS34 complexes by mTOR in nutrient stress-induced autophagy. Autophagy 2013, 9, 1983–1995. [Google Scholar] [CrossRef] [PubMed]
- Settembre, C.; Zoncu, R.; Medina, D.L.; Vetrini, F.; Erdin, S.; Erdin, S.; Huynh, T.; Ferron, M.; Karsenty, G.; Vellard, M.C.; et al. A lysosome-to-nucleus signalling mechanism senses and regulates the lysosome via mTOR and TFEB. Eur. Mol. Biol. Organ. J. 2012, 31, 1095–1108. [Google Scholar] [CrossRef] [PubMed]
- Roczniak-Ferguson, A.; Petit, C.S.; Froehlich, F.; Qian, S.; Ky, J.; Angarola, B.; Walther, T.C.; Ferguson, S.M. The transcription factor TFEB links mTORC1 signaling to transcriptional control of lysosome homeostasis. Sci. Signal 2012, 5, ra42. [Google Scholar] [CrossRef] [PubMed]
- Martina, J.A.; Chen, Y.; Gucek, M.; Puertollano, R. MTORC1 functions as a transcriptional regulator of autophagy by preventing nuclear transport of TFEB. Autophagy 2012, 8, 903–914. [Google Scholar] [CrossRef] [PubMed]
- Bernales, S.; Schuck, S.; Walter, P. ER-phagy: Selective autophagy of the endoplasmic reticulum. Autophagy 2007, 3, 285–287. [Google Scholar] [CrossRef] [PubMed]
- Redmann, M.; Dodson, M.; Boyer-Guittaut, M.; Darley-Usmar, V.; Zhang, J. Mitophagy mechanisms and role in human diseases. Int. J. Biochem. Cell Biol. 2014, 53, 127–133. [Google Scholar] [CrossRef] [PubMed]
- Gonzalez, C.D.; Lee, M.S.; Marchetti, P.; Pietropaolo, M.; Towns, R.; Vaccaro, M.I.; Watada, H.; Wiley, J.W. The emerging role of autophagy in the pathophysiology of diabetes mellitus. Autophagy 2011, 7, 2–11. [Google Scholar] [CrossRef] [PubMed]
- Houstis, N.; Rosen, E.D.; Lander, E.S. Reactive oxygen species have a causal role in multiple forms of insulin resistance. Nature 2006, 440, 944–948. [Google Scholar] [CrossRef] [PubMed]
- Guo, Q.; Xu, L.; Li, H.; Sun, H.; Wu, S.; Zhou, B. 4-PBA reverses autophagic dysfunction and improves insulin sensitivity in adipose tissue of obese mice via Akt/mTOR signaling. Biochem. Biophys. Res. Commun. 2017, 484, 529–535. [Google Scholar] [CrossRef] [PubMed]
- Hur, K.Y.; Jung, H.S.; Lee, M.S. Role of autophagy in β-cell function and mass. Diabetes Obes. Metab. 2010, 12, 20–26. [Google Scholar] [CrossRef] [PubMed]
- Lombardi, A.; Tomer, Y. Interferon α impairs insulin production in human β cells via endoplasmic reticulum stress. J. Autoimmun. 2017, 80, 48–55. [Google Scholar] [CrossRef] [PubMed]
- Jung, H.S.; Chung, K.W.; Won Kim, J.; Kim, J.; Komatsu, M.; Tanaka, K.; Nguyen, Y.H.; Kang, T.M.; Yoon, K.H.; Kim, J.W.; et al. Loss of autophagy diminishes pancreatic β cell mass and function with resultant hyperglycemia. Cell Metab. 2008, 8, 318–324. [Google Scholar] [CrossRef] [PubMed]
- Ebato, C.; Uchida, T.; Arakawa, M.; Komatsu, M.; Ueno, T.; Komiya, K.; Azuma, K.; Hirose, T.; Tanaka, K.; Kominami, E.; et al. Autophagy is important in islet homeostasis and compensatory increase of β cell mass in response to high-fat diet. Cell Metab. 2008, 8, 325–332. [Google Scholar] [CrossRef] [PubMed]
- Yoon, M.S. The emerging role of branched-chain amino acids in insulin resistance and metabolism. Nutrients 2016, 8, 405. [Google Scholar] [CrossRef] [PubMed]
- Newgard, C.B.; An, J.; Bain, J.R.; Muehlbauer, M.J.; Stevens, R.D.; Lien, L.F.; Haqq, A.M.; Shah, S.H.; Arlotto, M.; Slentz, C.A.; et al. A branched-chain amino acid-related metabolic signature that differentiates obese and lean humans and contributes to insulin resistance. Cell Metab. 2009, 9, 311–326. [Google Scholar] [CrossRef] [PubMed]
- Dibble, C.C.; Elis, W.; Menon, S.; Qin, W.; Klekota, J.; Asara, J.M.; Finan, P.M.; Kwiatkowski, D.J.; Murphy, L.O.; Manning, B.D. TBC1D7 is a third subunit of the TSC1-TSC2 complex upstream of mTORC1. Mol. Cell 2012, 47, 535–546. [Google Scholar] [CrossRef] [PubMed]
Figure 1.
mTORC1 and mTORC2. mTOR is a serine/threonine kinase that forms two biochemically and functionally distinct complexes. mTORC1 consists of mTOR, raptor, mLST8 and the two inhibitory subunits, PRAS40 and DEPTOR, whereas mTORC2 consists of mTOR, rictor, mLST8, PRR5, SIN1 and the inhibitory subunit, DEPTOR. mTORC1 senses mitogens, oxygen levels, intracellular energy status, and amino acids to promote cell growth by regulating anabolic and catabolic processes. mTORC2 is activated by mitogen and controls cell survival, metabolism, and cytoskeletal organization. The inhibitory subunits in mTOR complexes are not presented here (PRAS40, DEPTOR). mTOR; mammalian target of rapamycin; mTORC1, mTOR complex 1; mTORC2, mTOR complex 2; mLST8, mammalian lethal with Sec13 protein 8; PRR5, proline-rich protein 5; SIN1, stress-activated map kinase-interacting protein 1; PRAS40, proline-rich Akt substrate of 40 kDa; DEPTOR, DEP domain-containing mTOR-interacting protein.
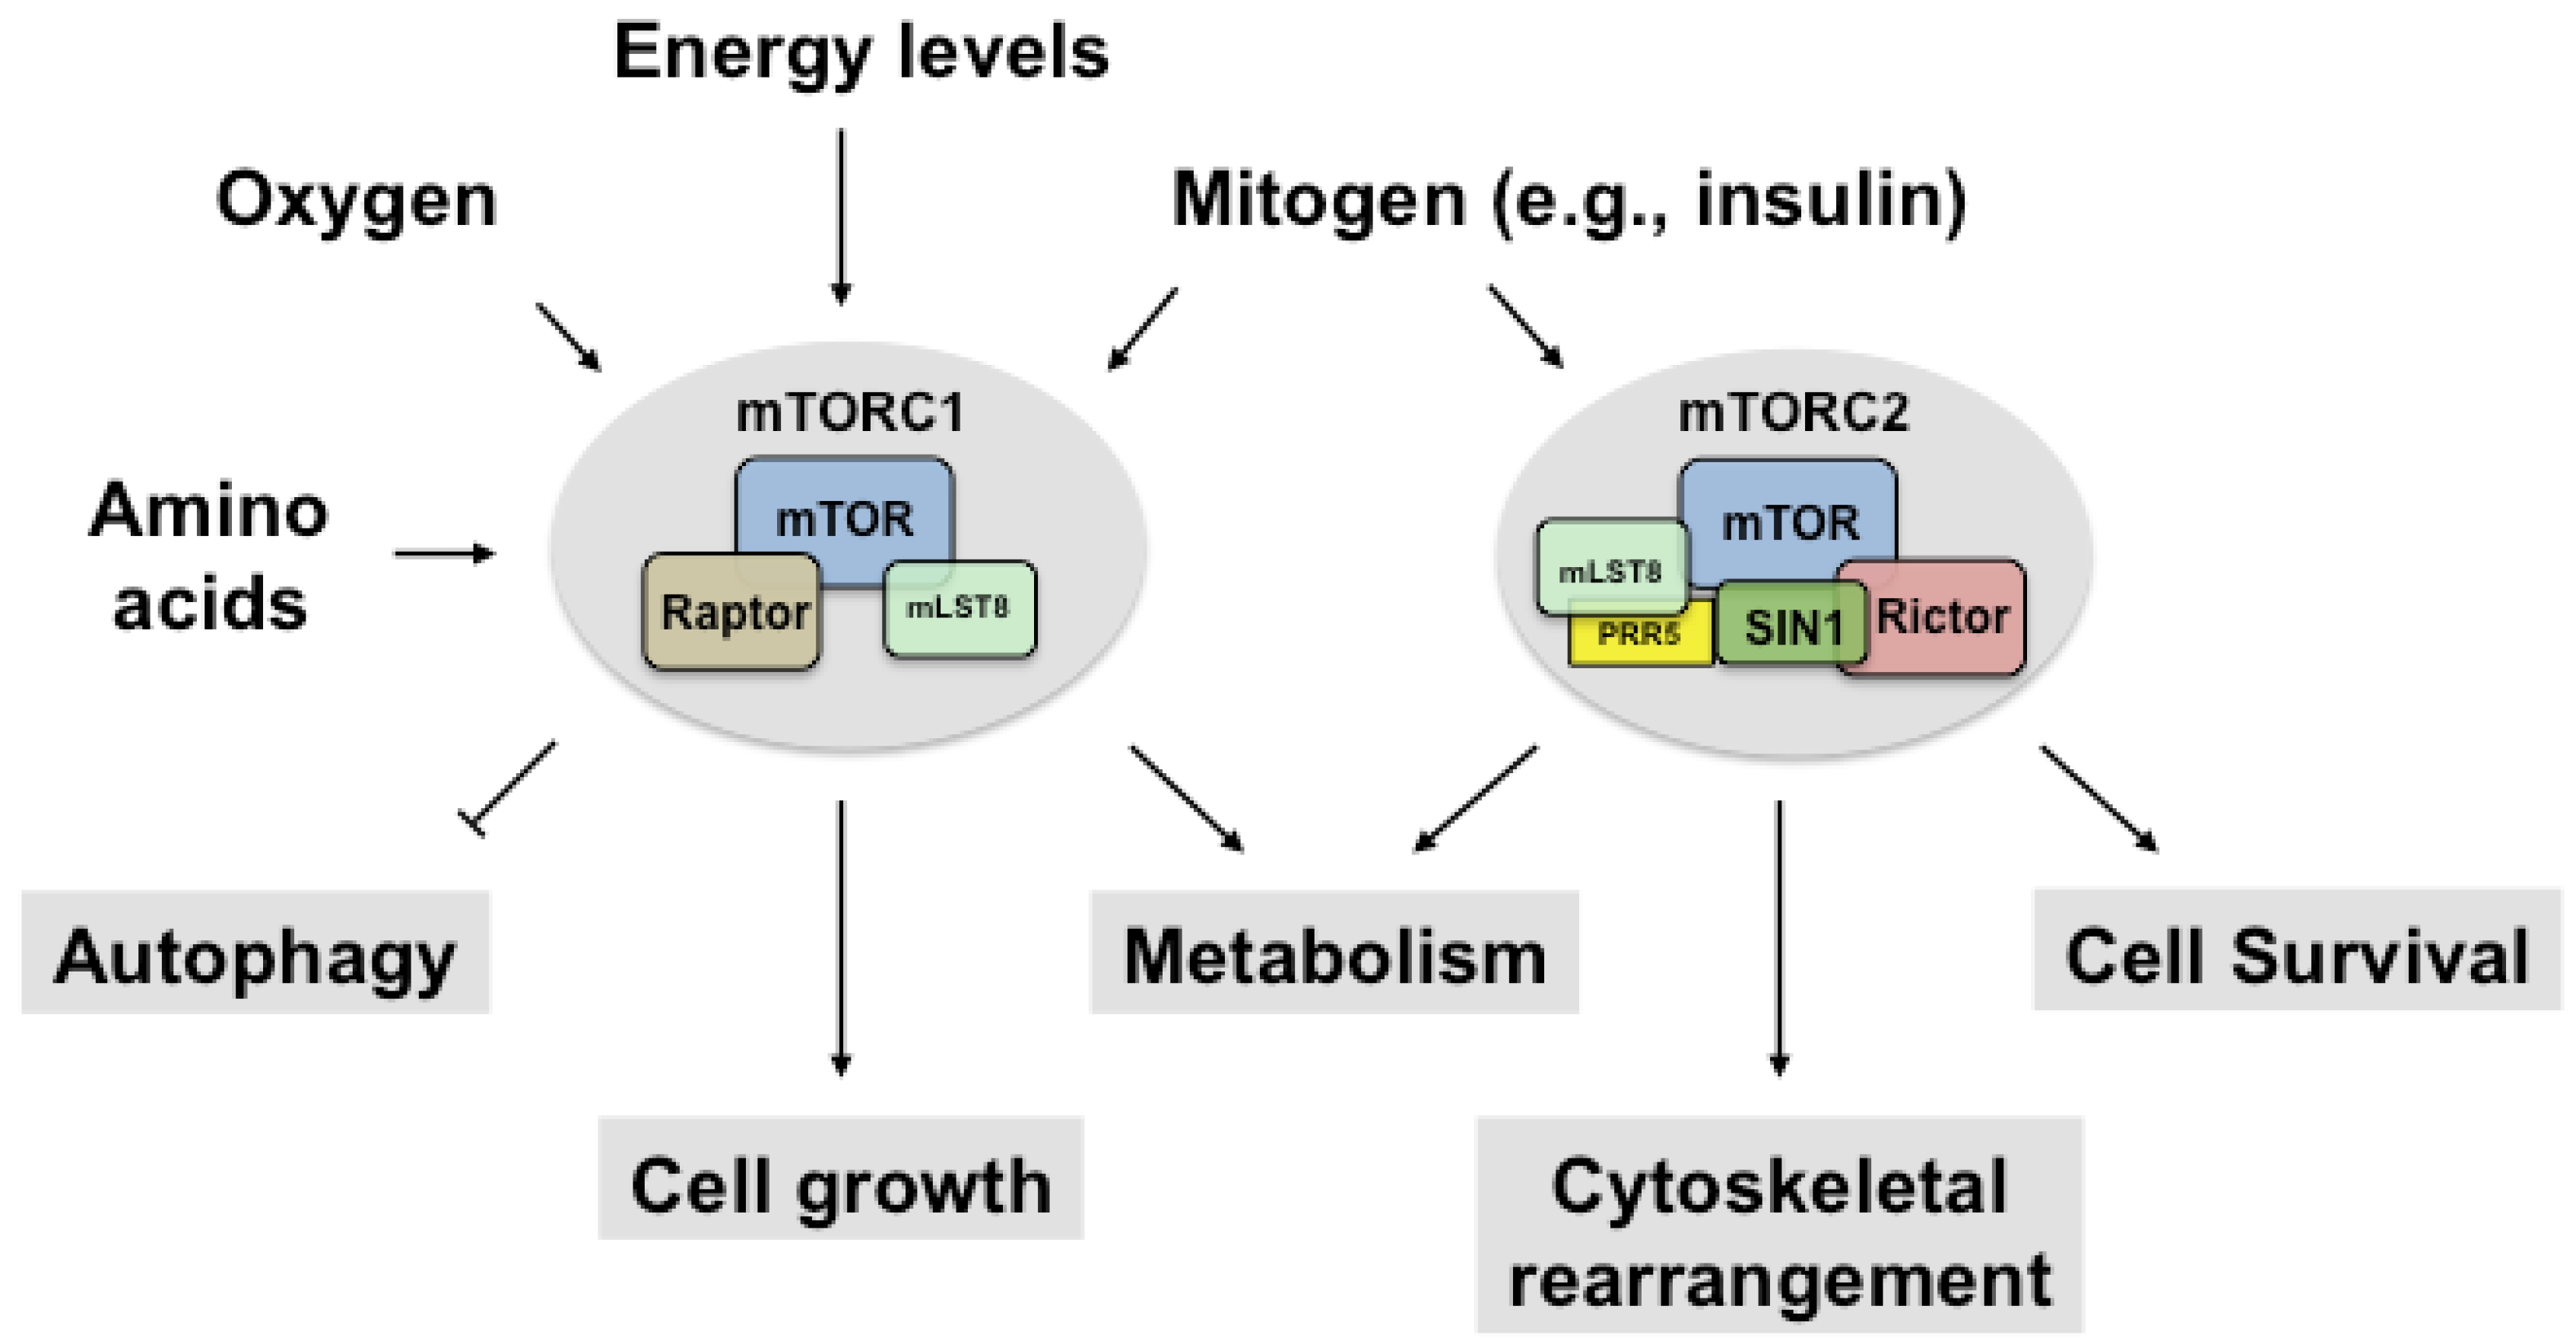
Figure 2.
Negative feedback regulation of insulin receptor substrate (IRS) by rapamycin complex 1 (mTORC1) Activated mTORC1/S6K1 inhibits IRS-1 by phosphorylating serine residues. mTOR phosphorylates mouse (m)S632 (human (h)S636), mS307 (hS312), and mS612 (hS616), and S6K1 phosphorylates mS302 (hS307), mS522 (hS527), mS265 (hS270), and mS1097 (hS1101). mTORC1 phosphorylates and stabilizes Grb10, which inhibits the interaction between IRS and the phosphorylated tyrosine of IR. Akt indirectly activates mTORC1 by phosphorylating tuberous sclerosis complex (TSC) and PRAS40. The gray images are mTORC1 targets in insulin signaling. The red line represents negative regulation. S6K1, ribosomal protein S6 kinase 1; pY, phosphotyrosine; pS, phosphoserine; PI3K, phosphoinositide 3-kinase; PIP3, phosphatidylinositol (3,4,5)-triphosphate; PDK1, 3-phosphoinositide-dependent protein kinase 1; pT, phosphothreonine; Akt, protein kinase B (PKB); GRB10, growth factor receptor-bound protein 10; PRAS40, proline-rich AKT substrate of 40 kDa; RHEB, RAS homolog enriched in the brain.
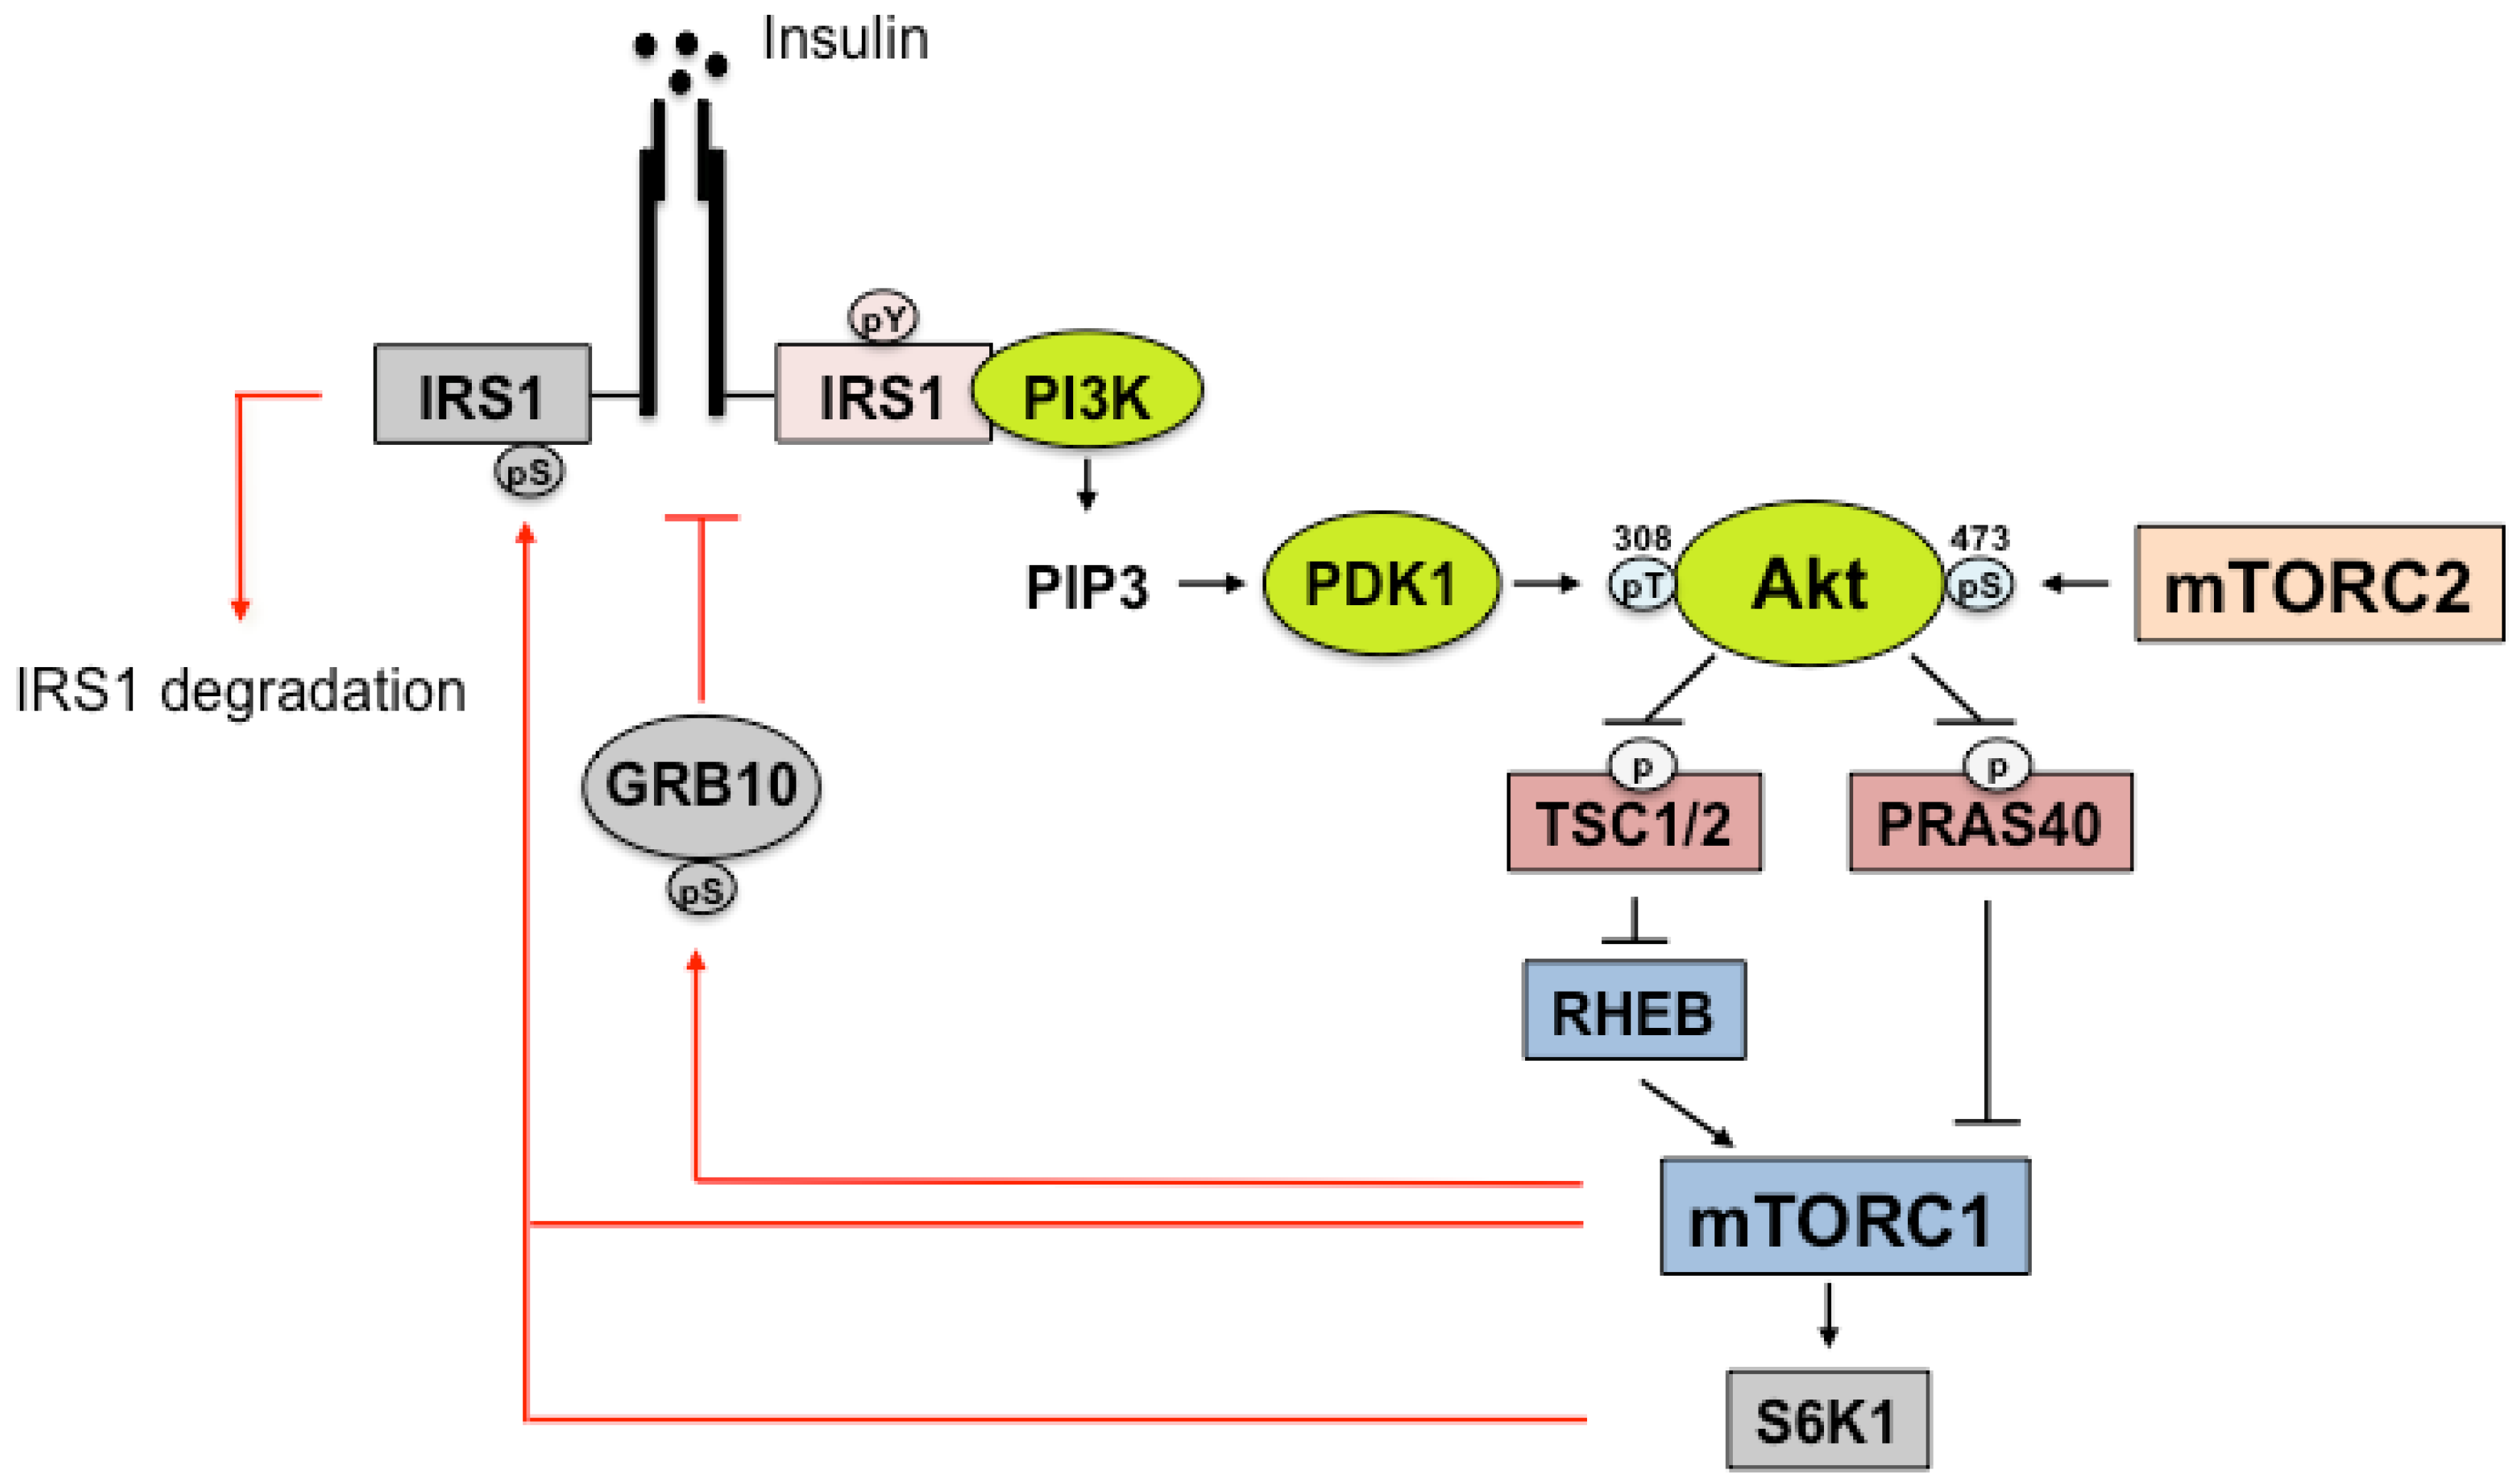
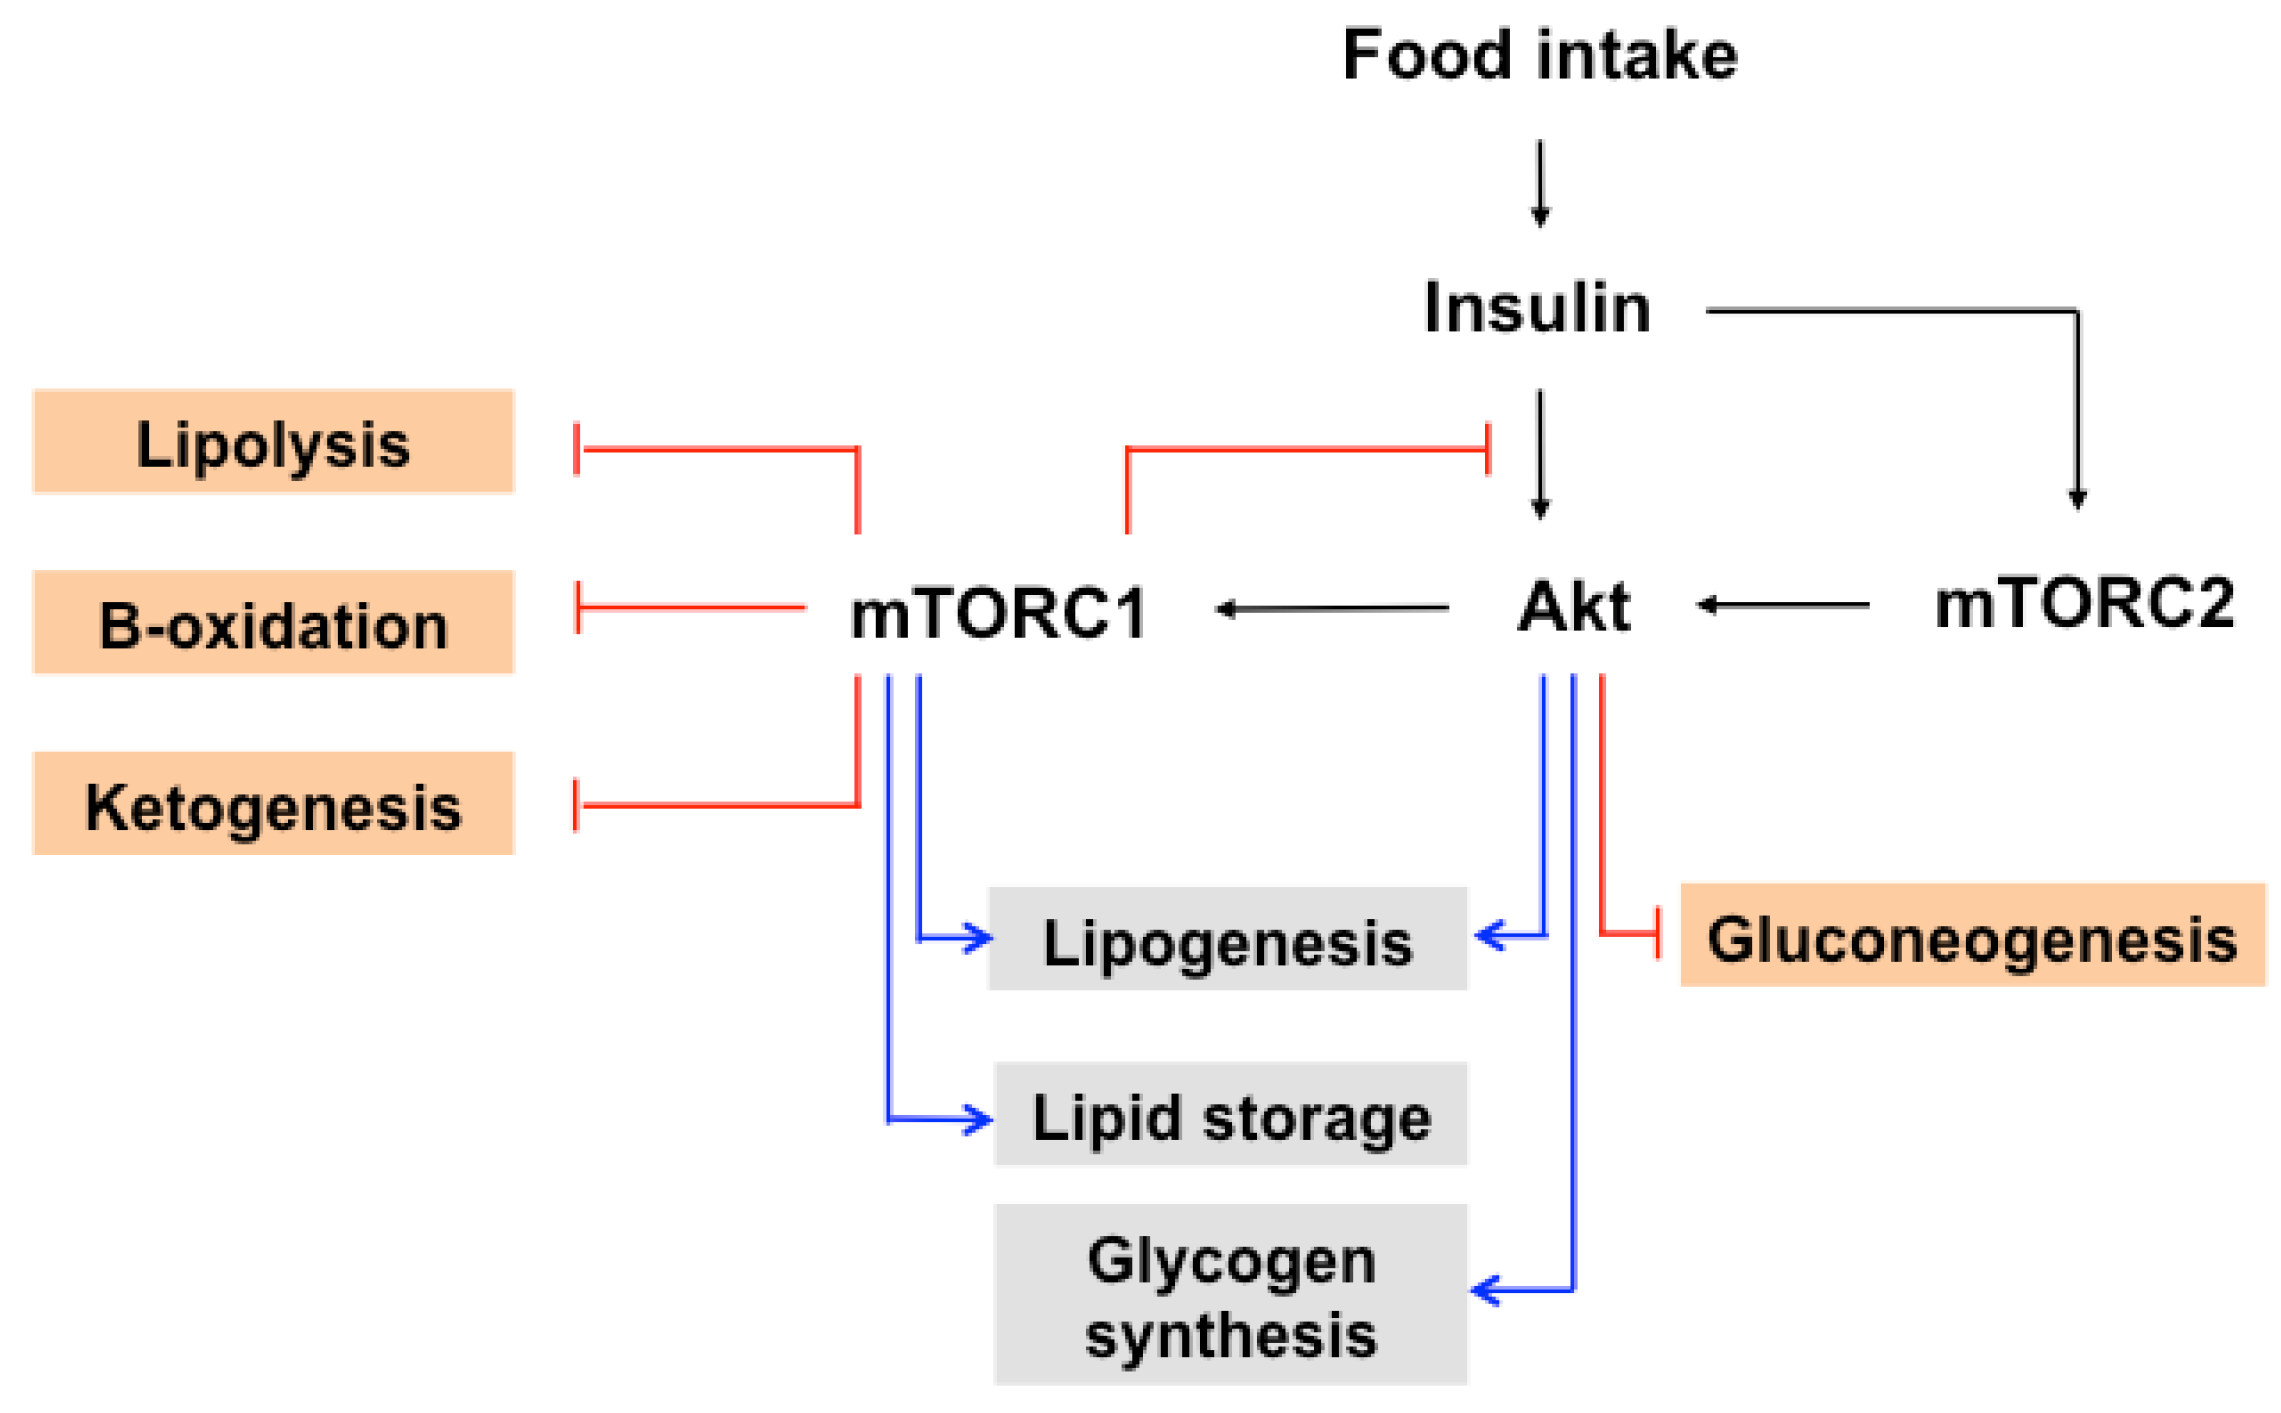
Figure 3.
The role of mTOR in insulin induced metabolic processes. The postprandial increase of insulin activates protein kinase B (PKB, also known as Akt) through PDK1and mTORC2. Akt activates mTORC1 by phosphorylating TSC1/2. Activated mTORC1 phosphorylates IRS-1, leading to negative feedback regulation of block insulin signaling. mTORC1 and mTORC2 promote lipogenesis by regulating SREBP. mTORC1 enhances lipid storage, whereas it inhibits lipolysis, β-oxidation, and ketogenesis. In addition, mTORC2 promotes glycogen synthesis and decreases gluconeogenesis. The blue line represents positive regulation, and the red line represents negative regulation. The detailed regulation is indicated in the text. PDK-1; 3-phosphoinositide-dependent protein kinase 1, SREBP; sterol regulatory element-binding protein.

© 2017 by the author. Licensee MDPI, Basel, Switzerland. This article is an open access article distributed under the terms and conditions of the Creative Commons Attribution (CC BY) license (http://creativecommons.org/licenses/by/4.0/).
Share and Cite
MDPI and ACS Style
Yoon, M.-S. The Role of Mammalian Target of Rapamycin (mTOR) in Insulin Signaling. Nutrients 2017, 9, 1176. https://doi.org/10.3390/nu9111176
AMA Style
Yoon M-S. The Role of Mammalian Target of Rapamycin (mTOR) in Insulin Signaling. Nutrients. 2017; 9(11):1176. https://doi.org/10.3390/nu9111176
Chicago/Turabian StyleYoon, Mee-Sup. 2017. "The Role of Mammalian Target of Rapamycin (mTOR) in Insulin Signaling" Nutrients 9, no. 11: 1176. https://doi.org/10.3390/nu9111176
Note that from the first issue of 2016, this journal uses article numbers instead of page numbers. See further details here.