Article

Associations between Nut Consumption and Health Vary between Omnivores, Vegetarians, and Vegans

1
Department of Human Nutrition, University of Otago, P.O. Box 56, Dunedin 9014, New Zealand
2
Nutrition Society of New Zealand, Whanganui 4543, New Zealand
3
Department of Preventive and Social Medicine, University of Otago, P.O. Box 56, Dunedin 9054, New Zealand
4
Nutrition Epidemiology Group, School of Food Science and Nutrition, University of Leeds, Leeds LS2 9JT, UK
5
Leeds Institute for Cardiovascular and Metabolic Medicine, University of Leeds, Leeds LS2 9JT, UK
*
Author to whom correspondence should be addressed.
Nutrients 2017, 9(11), 1219; https://doi.org/10.3390/nu9111219
Submission received: 15 September 2017 / Revised: 19 October 2017 / Accepted: 3 November 2017 / Published: 6 November 2017
(This article belongs to the Special Issue Nut Consumption for Human Health)

Abstract

:
Regular nut consumption is associated with reduced risk factors for chronic disease; however, most population-based studies lack consideration of effect modification by dietary pattern. The UK Women’s Cohort Study (UKWCS) provides an ideal opportunity to examine relationships between nut consumption and chronic disease risk factors in a large sample with diverse dietary patterns. Nut and nutrient intake from 34,831 women was estimated using a food frequency questionnaire among self-identified omnivores, vegetarians and vegans. In this cross-sectional analysis, higher nut consumption was associated with lower body weight (difference between highest and lowest consumption categories from adjusted model: 6.1 kg; 95% CI: 4.7, 7.6) body mass index (BMI, 2.4 units difference; 95% CI: 1.9, 2.9), and waist circumference (2.6 cm difference; 95% CI: 1.4, 3.8) (all p for linear trend < 0.001). Higher nut consumption was also associated with reduced prevalence of high cholesterol and high blood pressure; having a history of heart attack, diabetes and gallstones; and markers of diet quality (all adjusted p for linear trend ≤ 0.011). Higher nut consumption appeared overall to be associated with greater benefits amongst omnivores compared to vegetarians and vegans. Findings support existing literature around beneficial effects of nut consumption and suggest that benefits may be larger among omnivores. Nut promotion strategies may have the highest population impact by specifically targeting this group.

1. Introduction

Nuts are rich sources of cis-unsaturated fatty acids, fibre, vitamins, minerals, and a number of bioactive substances [1,2,3]. The regular consumption of nuts is associated with a reduction in all-cause mortality [4,5,6,7,8,9,10,11], and in particular cardiovascular disease (CVD) [4,5,6,7,8,9,10,11]. Some research has also shown that regular nut consumption is inversely associated with the incidence of cancer and diabetes, although these findings are less consistent [4,5,6,8,12,13,14,15,16].
While the health benefits of nut consumption are well documented, a number of studies have shown that nut intakes at the population level are far from ideal [17,18,19,20]. For example, data from the European Prospective Investigation into Cancer and Nutrition (EPIC) study showed that only 6.9% of the population consumed whole nuts on the day of the 24-h recall, with a mean population intake of 2.2 g/day [18]. This is similar to intakes reported in the United States of America (USA) [19] and New Zealand (NZ) [17], where the prevalence of whole nut intake was 6.0% and 6.9% respectively on a given day. Despite these low reported intakes, examining the predictors of nut intake is important to provide information for public health initiatives which aim to increase regular nut consumption as a means of reducing the risk of CVD and other chronic diseases.
Only a small number of studies have previously examined predictors of nut consumption. In the USA [21] and NZ [17], nuts were most likely to be consumed by Caucasians with higher education and income levels. Likewise, in the EPIC cohort [18], education level was positively associated with nut intake. Age was also an important predictor of nut intake. In the USA, among those aged 19–51 years, the percentage of participants consuming nuts on a given day was 5.5%, compared to 8.4% among those aged over 51 years [21]. In NZ, the prevalence of whole nut consumption on a given day was highest among those aged 31–70 years [17]. These studies have provided useful information on which to base public health messages, but all are limited by the relatively low prevalence of nut intake, which limits the complexity of statistical models investigating plausible confounders, effect modifiers, and mediators.
The Seventh-Day Adventist study examined the associations between levels of nut consumption and coronary heart disease (CHD) for vegetarians and non-vegetarian, finding protective associations for both [22]. Identifying associations between nut intake and risk factors for chronic disease can also provide important information for strategies to reduce disease risk. Studies have consistently reported that regular nut consumption is associated with reductions in total and low-density lipoprotein (LDL) cholesterol [23]. The evidence for effects on blood pressure is less clear. Findings from NHANES 1999–2004 indicate that nut consumers had significantly lower systolic blood pressure and prevalence of hypertension [24]. However, in a cross-sectional analysis of a nationally representative NZ sample, there was no evidence for a difference in systolic or diastolic blood pressure between nut consumers and non-nut consumers [25]. Results from clinical trials also show mixed results, with the majority reporting no evidence of any effect on blood pressure [26,27,28,29].
A more consistent finding among different populations is that lower body weight, BMI and waist circumference are all seen among those who consume nuts in comparison to non-nut consumers. Epidemiological studies have found that nut consumers are leaner than non-nut consumers [30,31,32,33,34], which is in agreement with intervention studies which report that when nuts are added to the diet, weight gain is either negligible or less than predicted based on energy content [34,35,36,37,38,39].
Most of the aforementioned studies have included samples where dietary intakes do not vary widely, which can make generalising to the full range of intakes problematic, and have not been able to consider the potential effect modification of the associations by dietary patterns. The UK Women’s Cohort Study provides an ideal opportunity to examine a wide range of dietary patterns and the effects of nut intakes within these patterns. Due to the high percentage of vegetarians purposefully recruited into this cohort, nut consumption patterns are more diverse than seen in most other studies. Therefore, we aim to identify predictors of nut intake, and identify associations between nut consumption and chronic disease risk in a cohort of women with diverse dietary patterns.

2. Materials and Methods

2.1. Study Design and Participants

The UK Women’s Cohort Study (UKWCS) has been described in detail elsewhere [40]. In brief, the cohort was derived from responders to a mail survey of the World Cancer Research Fund, living in England, Wales, and Scotland. Responders willing to participate in a more detailed survey composed the population who were then contacted to participate in the UKWCS. Eligible participants included women aged 35 to 69 years (inclusive) who self-reported being a vegetarian or non-red-meat eaters. A group of non-vegetarians were selected by choosing for each vegetarian the next non-vegetarian from the stored direct mail database who was aged within 10 years of the vegetarian. From the 61,000 women contacted, 35,372 returned completed questionnaires, a response rate of 58%. Permission to carry out the baseline UKWCS was obtained by 174 local research ethics committees.

2.2. Dietary Intake

Baseline dietary data were collected between 1995 and 1998 using a detailed self-administered 217-item postal food frequency questionnaire (FFQ) which was based on the European Prospective Investigation into Cancer and Nutrition (EPIC) study and asked about food intake over the last year. This FFQ was validated against a semi-weighed four-day record, and some biochemical measures [41], however, not for nut intake in particular.

2.3. Nut Intake

At baseline, total nut intake was derived from the FFQ which included items on almonds, cashews, peanuts, pecans, pistachios, and walnuts, but not including the items on nut butters or nut pates. Total intake of nuts was calculated by summing the intakes of nuts from the individual food items, which were determined by using the frequency categories to estimate weekly intake in terms of servings, which were then converted to servings per day. Amounts in g were then estimated using a serving size of 30 g [42]. Intakes in g per day were also grouped into consumption categories of ‘none’ (0 g/day), ‘less than one 30 g serving per week’ (less than 4.3 g/day), 2–6 servings per week’ (less than 30 g/day), ‘daily’ (30–59.9 g/day), and ‘more than daily’ (60 g/day or more).

2.4. Lifestyle Questionnaire

Each participant completed a self-administered lifestyle questionnaire where information was collected on age, employment, education level, physical activity, ethnicity, menopausal status, age of menarche, parity, use of hormone replacement therapy (HRT) and oral contraceptive pill (OCP), smoking status, body weight, height, and waist circumference [43]. Participants self-classified as omnivores, vegetarians, or vegans.

2.5. Statistical Analysis

For this cross-sectional analysis, participants were excluded if the data was biologically implausible i.e., they had extremely high (>6000 kcal/day or 25,080 kJ/day) (n = 80) or low (<500 kcal/day or 2090 kJ/day) (n = 6) energy intake, a BMI of less than 13 kg/m2 (n = 10) or implausibly high based on discordant height and weight measures (n = 2), a waist circumference of less than 50 cm (n = 25), or a height greater than 7 feet (213.36 cm) (n = 12). A total of 126 distinct participants were excluded from this analysis based on these criteria. We also only included women who provided information on nut consumption, thus a further 415 women were excluded. Thus, the final analysis was performed on 34,831 women.
Appropriate summary statistics were calculated for all measures of interest (participant characteristics, nut consumption, and measures of chronic disease risk), specifically means and standard deviations (SD) for approximately normally distributed continuous variables, medians and inter-quartile ranges (IQR) for non-normal continuous variables, and counts and percentages for categorical variables. Linear, binary logistic, and ordinal logistic regression models were used to identify associations with continuous, binary, and ordinal outcomes respectively. When ordinal predictor variables were investigated (nut consumption level), orthogonal polynomials were used to model linear and higher order trends. Linear trends are reported and while higher-order trends are noted, these are only discussed where they affect the interpretation of results (e.g., indicate non-monotonicity). Effect modification of associations between nut intakes and outcomes by dietary pattern (omnivore, vegetarian, and vegan) was investigated by adding an interaction between dietary pattern and each of the orthogonal polynomial terms for nut consumption levels. A Wald test was used to assess the overall significance of this interaction with pairwise comparisons performed only when this was significant. For continuous outcomes, where model residuals were skewed and/or heteroscedastic, log-transformations were investigated, and retained when this improved residual behaviour. For models using dietary pattern (omnivorous, vegetarian, and vegan), sensitivity analyses were performed using total meat servings per week. Analyses were conducted using Stata 13.1 (StataCorp LLC, College Station, TX, USA) and two-sided p < 0.05 was considered statistically significant.

3. Results

3.1. Participant Characteristics and Nut Consumption among the Cohort

The characteristics of all 34,831 women in the study are shown in Table 1, both overall and by nut consumption (none versus any). Mean age (SD) was 52.2 (9.3) years with a mean (SD) BMI of 24.5 (4.3) kg/m2. In general, the cohort had a low prevalence of smoking (11%), was well educated with over 27% with a degree, and over 50% were working in professional or managerial positions. The majority of the cohort reported being omnivores (n = 25,116, 72%), with over one-quarter being vegetarian (n = 9280, 27%), and 1% (n = 435) vegans.
Overall 16% of respondents reported consuming no nuts, with the 84% of participants who consumed nuts comprising 52% of the sample estimated to consume nuts less than once per week, 28% 2–6 times per week, 3% daily, and 1% at least 2 times per day.
Compared with non-nut consumers, nut consumers appear to be slightly younger (by four years), appreciably more physically active, leaner (by each of weight, BMI, and waist circumference), much more likely to be highly educated, with a higher proportion working in professional or managerial positions. Nut consumers also appear much more likely to be vegetarians and vegans, and consume around 10 % more energy and over two-thirds more alcohol. They also appeared to be more likely to be pre-menopausal, and use oral contraceptives, consistent with them being younger. No practically important differences were observed between these two groups in terms of height, smoking, age of menarche, or parity. The only substantial difference for ethnicity appeared to be amongst those classified as Asian who had around four times the odds of consuming nuts compared to those classified as White. It should be noted that the number of Asian participants was small.

3.2. Predictors of Nut Consumption

Table 2 reports the unadjusted and adjusted odds ratios (OR) for frequency of consuming nuts (5 ordinal levels from none to more than daily) from ordinal logistic regression modes using selected demographic variables as predictors. Nut consumption levels were statistically significantly lower with greater age. Compared with those aged in their forties, those aged in their fifties, sixties and seventies were less likely to consume higher quantities of nuts. There was a statistically significant association between nut consumption and physical activity, with those who performed no vigorous physical activity less likely to consume higher amounts of nuts than those who performed some vigorous activity. Those working in professional positions were more likely to consume greater quantities of nuts compared to those in clerical or skilled positions. The percentage consuming nuts was statistically significantly greater for those with higher educational qualifications, where those with a degree had 2.26 times the odds (95% CI: 2.07, 2.46; p < 0.001) of consuming greater amounts of nuts compared to those with no education. Former smokers were more likely to consume higher quantities of nuts compared to both current smokers and those who have never smoked.
Both vegetarians (OR: 2.23; 95% CI: 2.12, 2.35; p < 0.001) and vegans (OR: 3.76; 95% CI: 3.05, 4.64; p < 0.001) were statistically significantly more likely to consume higher amounts of nuts compared to omnivores, In a model also adjusting for energy intake, this association remained and higher energy intakes were associated with greater likelihoods of consuming higher quantities of nuts (p < 0.001).

3.3. Nut Consumption and Anthropometric Measures

In all unadjusted and adjusted models, for body weight, BMI and waist circumference there was evidence of a linear trend where higher nut consumption levels were associated with lower values (adjusted differences between the highest compared to lowest consumption categories, including total energy in the models: 6.1 kg (95% CI: 4.7, 7.6), 2.4 BMI units (95% CI: 1.9, 2.9), and 2.6 cm (95% CI: 1.4, 3.8), all p for linear trend < 0.001 (Table 3).

3.4. History of Selected Chronic Diseases and Risk Factors for Chronic Disease by Nut Consumption

For two risk factors for chronic disease, namely, high blood pressure (for highest compared to lowest consumption category unadjusted OR: 0.54 (95% CI: 0.40, 0.76) and adjusted for variables other than BMI, which could be on the causal pathway as well as potentially a confounder, OR: 0.69 (95% CI: 0.48, 0.98) and high blood cholesterol (unadjusted OR: 0.57 (95% CI: 0.36, 0.90) and adjusted OR: 0.67 (95% CI: 0.40, 1.14)) there was evidence in all models for a linear trend where higher levels of nut consumption was associated with lower prevalence of these risk factors (all p for linear trend ≤0.010 for high blood pressure and ≤0.004 for high blood cholesterol) (Table 4).
For chronic disease, there was a statistically significant linear trend for all models for the prevalence of having a history of heart attack (unadjusted OR: 0.21 (95% CI: 0.05, 0.86), adjusted for variables other than BMI OR: 0.28 (95% CI: 0.07, 1.15)), diabetes (unadjusted OR: 0.40 (95% CI: 0.16, 0.99) and adjusted OR: 0.54 (95% CI: 0.20, 1.50)), and gallstones (unadjusted OR: 0.46 (95% CI: 0.26, 0.80) and adjusted OR: 0.46 (95% CI: 0.24, 0.92)) (all p for linear trend ≤0.011).
For angina, although there was evidence of a linear trend for most models (all p for linear trend <0.016 without adjusting for BMI), when the model was further adjusted for BMI, the linear trend became a non-statistically significant tendency (p for linear trend = 0.092). A similar pattern was seen for stroke, where there was evidence of a linear trend in the unadjusted and age-adjusted model, which was no longer statistically significant after further adjustment (both p ≥ 0.115).
For polyps and cancer, although there was evidence of a linear trend where higher levels of nut consumption was associated with lower prevalence of a history of these, in the unadjusted models (both p ≤ 0.003) and adjusting for age for polyps (p = 0.028), this was no longer statistically significant in the adjusted models (all p ≥ 0.119).

3.5. Nut Consumption and Nutrient Intake

As seen in Table 5, there was evidence of a linear trend for nutrients in all but one case for both unadjusted and adjusted models. Total energy, fibre, and the percentage of energy from total fat, monounsaturated fatty acids (MUFA) and polyunsaturated fatty acids (PUFA) were all higher amongst those with higher levels of nut consumption. The percentage of energy from saturated fat was lower amongst those with lower nut consumption in the adjusted model only. Likewise, the percentage of energy from protein, carbohydrate, and total sugar was lower amongst those with higher levels of nut consumption.
For the majority of micronutrients (exceptions being vitamins A and C), there was statistically significant evidence of a linear trend in the models further adjusted for energy intake. However, both vitamin A and vitamin C demonstrated quadratic trends where, although intakes were higher with higher levels of nut consumption, the differences were less pronounced in successive nut intake categories. For most micronutrients, intakes were higher for greater levels of nut consumption, except for vitamin B12 which showed the opposite trend.

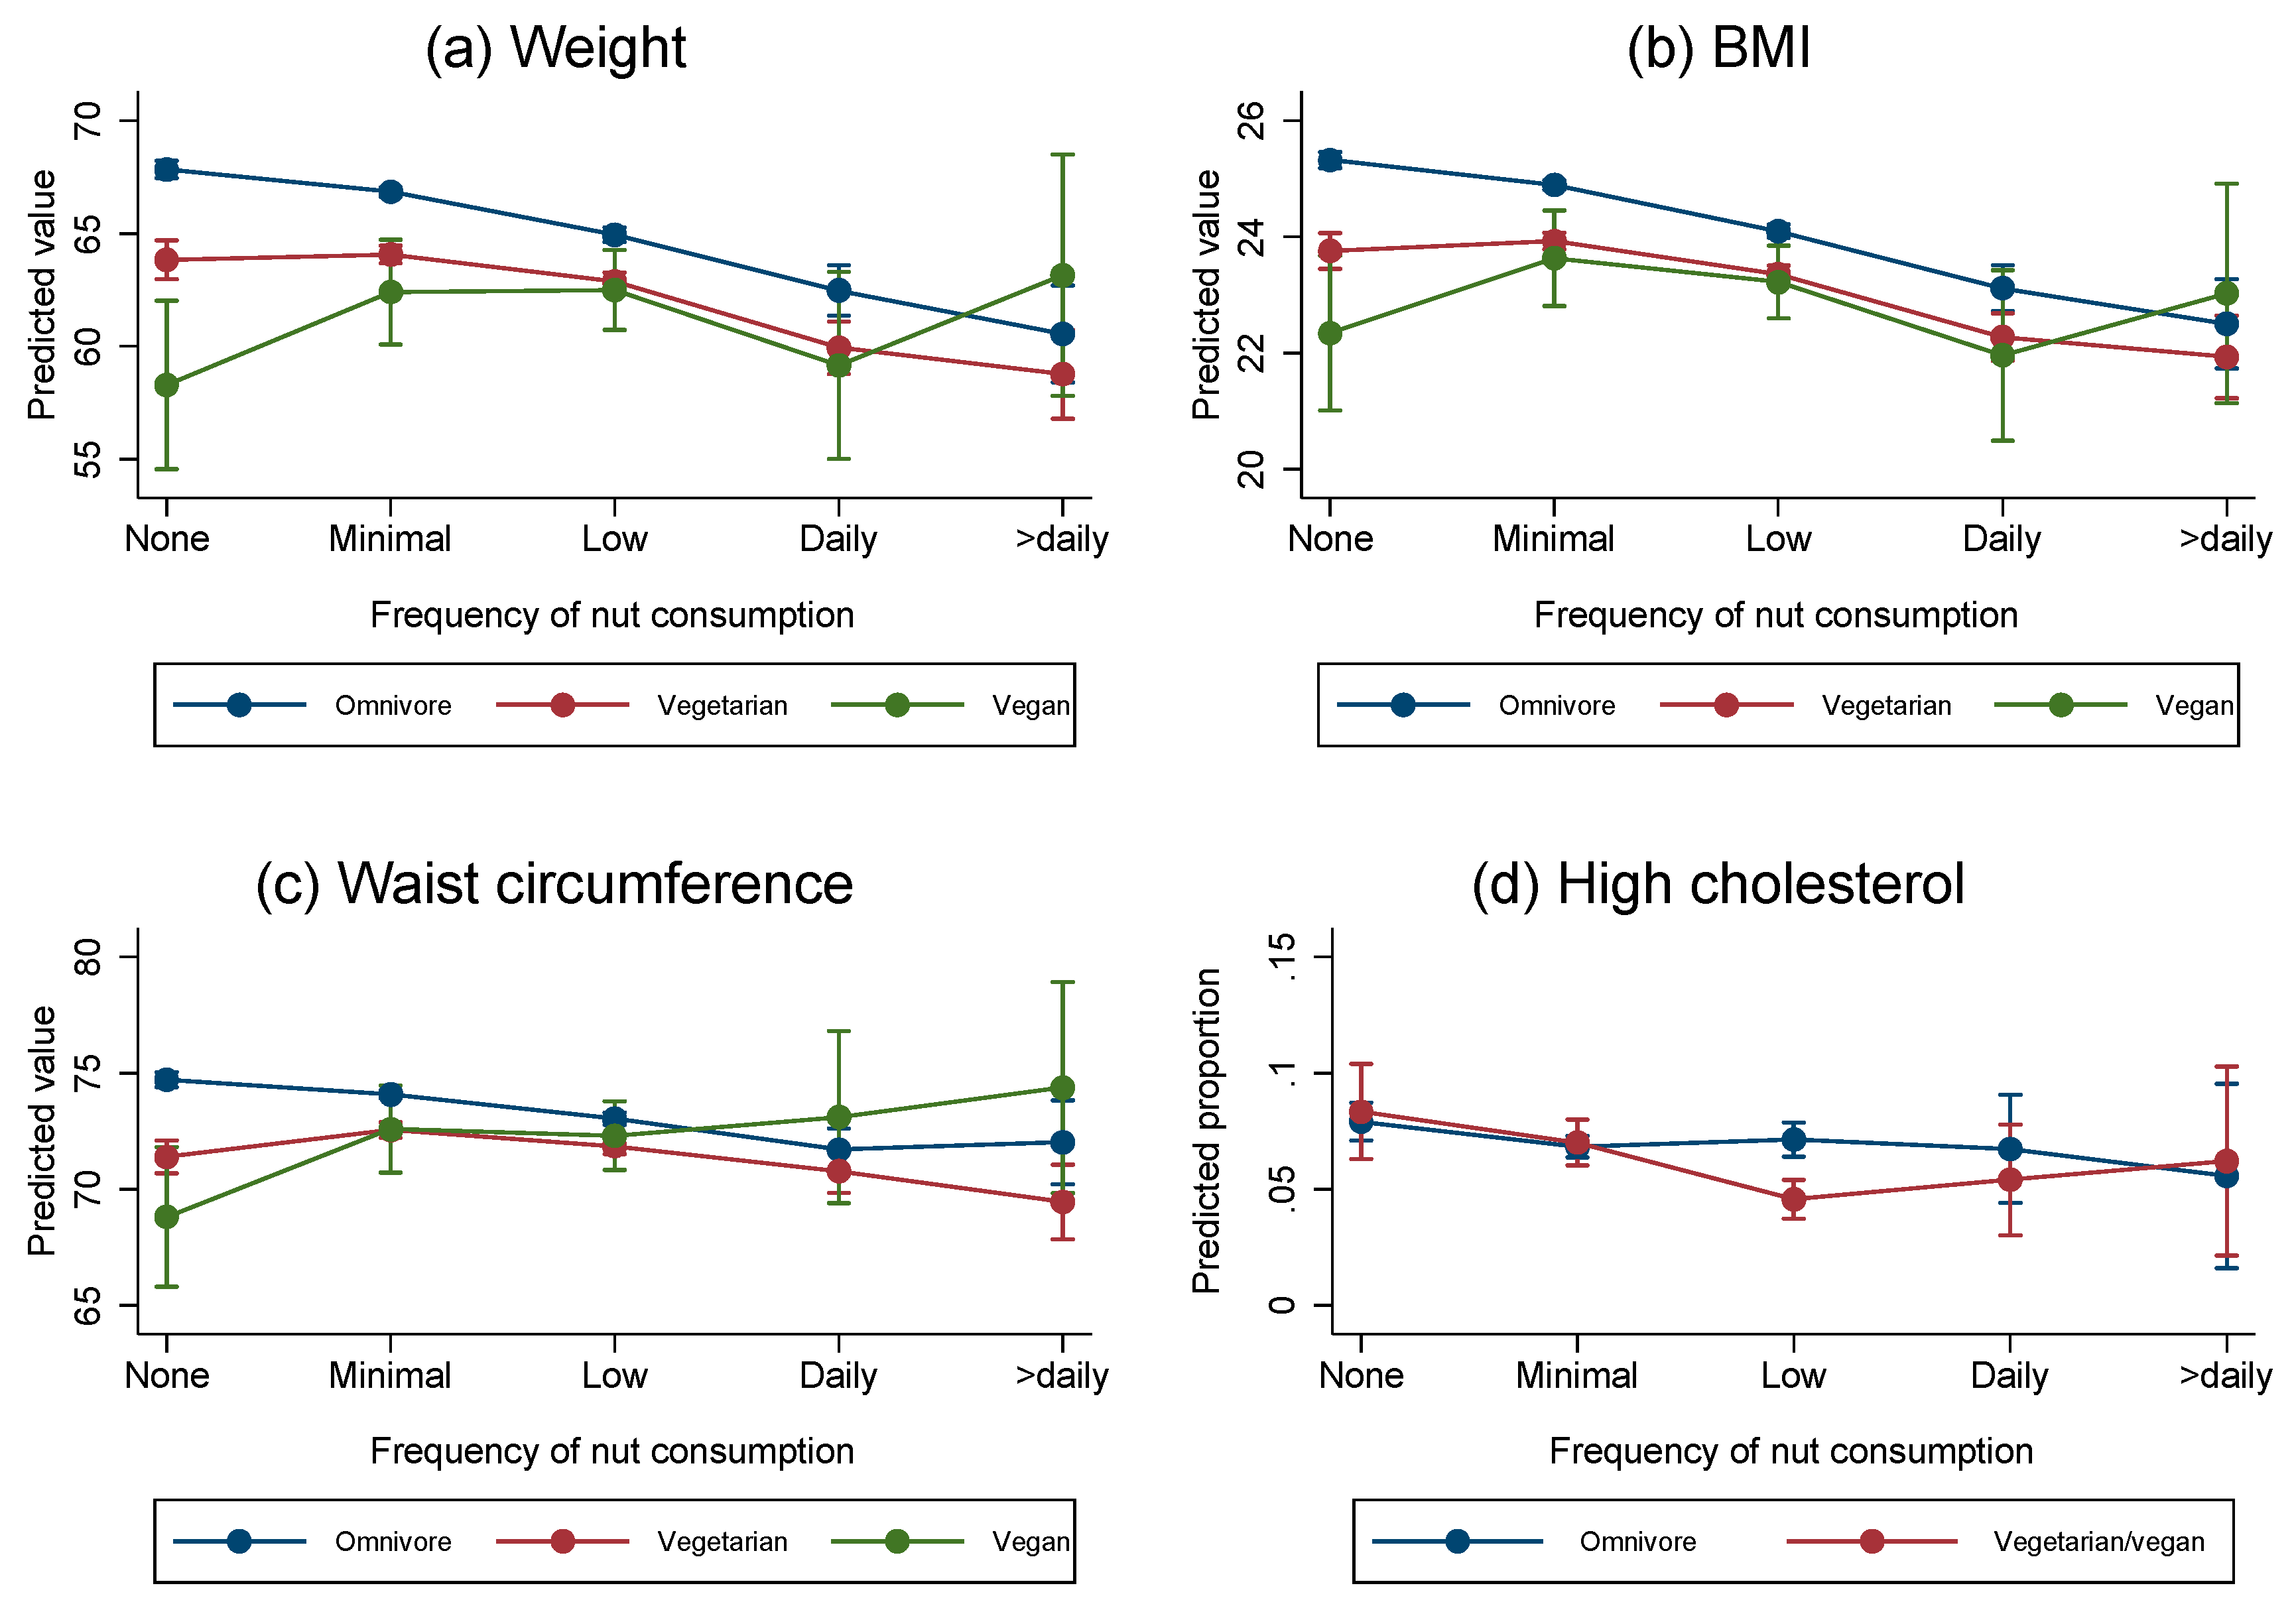
3.6. Effect Modification by Dietary Pattern

For body weight, there was evidence of between diet group differences in trends for increasing nut frequency categories (interaction Wald p < 0.001) (as indicated by the non-parallel associations seen in Figure 1a, Table 6). Among omnivores, for each higher nut consumption category, the linear trend showed a 1.30 kg lower body weight (95% CI: 1.12, 1.48; p < 0.001) with a quadratic trend suggesting an additional negative trend (p = 0.003) and no evidence for higher order trends (p ≥ 0.220 for both). Among vegetarians, for those in each higher nut frequency category the linear trend shows a 0.73 kg lower mean body weight (95% CI: 0.46, 1.01; p < 0.001). However, among vegans, for each higher nut frequency category there was a non-statistically significant higher mean body weight by 0.87 kg (95% CI: −0.29, 2.04; p = 0.141). The linear negative trend for omnivores was statistically significantly greater than the trend in either vegetarians or vegans (both pairwise difference in trends p < 0.001) and there was also a statistically significant difference in the linear trend between vegetarians and vegans (p = 0.008).
For BMI, there was again evidence of an overall difference in trends between diet groups (interaction Wald p < 0.001) (Figure 1b shows similar non-parallel slopes). Among omnivores, for each higher nut consumption category there was a 0.54 unit lower BMI (95% CI: 0.47, 0.60; p < 0.001), which was intensified in magnitude by a quadratic trend (p = 0.005). Among vegetarians, each higher nut consumption category was associated with a linear 0.3 unit lower BMI (95% CI: 0.20, 0.39; p < 0.001) further lowered by a statistically significant negative quadratic (p < 0.001), whereas for vegans, there was a non-statistically significant 0.07 unit higher BMI per category (95% CI: −0.34, 0.49; p = 0.727) and no evidence of a quadratic trend (p = 0.055). The linear trend for omnivores was statistically significantly more negative than that seen in vegetarians (difference in trends p < 0.001) and vegans (p = 0004), with no statistically significant difference between vegetarians and vegans (p = 0.087). The magnitude of the decreasing quadratic trend was greater among vegetarians than omnivores (p = 0.036).
For waist circumference, there was evidence of a difference in trends (interaction Wald p < 0.001) and overall differences in linear (p < 0.001) and quadratic (p = 0.002) trends between diet groups (Figure 1c). Among omnivores, for each higher nut frequency category, there was a 0.69 cm unit lower mean waist circumference (95% CI: 0.54, 0.83; p < 0.001) with no evidence for higher order trends (all p ≥ 0.099). Among vegetarians each higher nut frequency category was associated with a non-statistically significant 0.13 cm lower mean waist circumference (95% CI: −0.36, 0.09; p = 0.241), whereas among vegans the trend was in the opposite direction with a statistically significant 0.96 cm higher mean waist circumference per category (95% CI: 0.01, 1.92; p = 0.047). The linear trend in omnivores was statistically significantly different from the trend observed among vegetarians (difference in trends p < 0.001) and vegans (p = 0.001) with a more negative quadratic trend evident among vegetarians compared to omnivores (p = 0.001). However, the quadratic trend (p < 0.001) in vegetarians dominated the linear trend, leading to lower waist circumferences for higher frequencies of nut consumption in this group. The difference between vegetarians and vegans in the linear trend was statistically significant (difference in trends p = 0.028), but not the quadratic trend (p = 0.704).
For the prevalence of having high blood cholesterol, the vegetarian and vegan groups were combined because of the lack of any respondents reporting high cholesterol for all nut frequency categories amongst the vegan group. There was evidence of an overall difference in trends between omnivores and a combined vegetarian/vegan group (interaction Wald p = 0.005) with the difference only evident for linear trends (Wald p = 0.004) and not for quadratic trends (p = 0.507), although there was a small but statistically significant cubic trend (p = 0.015) (Figure 1d). Among omnivores, for each greater nut frequency category, there was a non-statistically significant 4% lower odds of having high cholesterol (95% CI: 0.91, 1.02; p = 0.228). Among the combined vegetarian and vegan group, the odds were 19% lower for each higher category (95% CI: 0.73, 0.90; p < 0.001) but the cubic trend led to greater odds in the highest nut frequency categories.
There were also several overall differences of linear trends for a number of nutrients between diet groups which are presented briefly and without discussion of higher order trends below. For the percentage energy from total fat, saturated fat, monounsaturated fat, and polyunsaturated fat there was an overall difference between diet groups (all pairwise p < 0.001). Among omnivores, vegetarians, and vegans each higher nut frequency category was associated with a 1.4%, 1.9%, and 1.6% higher mean percentage of energy derived from total fat (all p < 0.001). The positive association for vegetarians was statistically significantly greater than for omnivores (p < 0.001).
For the percentage of energy from saturated fat, for each higher nut frequency category this was 0.1% and 0.2% higher for omnivores and vegetarians respectively (both p < 0.001). Conversely, for vegans, this was non-statistically significantly lower by 0.3% per nut consumption category (p = 0.097). The trend was statistically significantly different between all diet groups (all pairwise p ≤ 0.017).
For the percentage of energy from MUFA, for each higher nut frequency category was associated with 0.7%, 0.9%, and 0.7% higher means for omnivores, vegetarians, and vegans respectively (all p < 0.001). There was a statistically significant difference between omnivores and vegetarians only (p < 0.001).
For the percentage of energy from PUFA, for each higher nut frequency category, the means were 0.5%, 0.6%, and 0.9% greater for omnivores, vegetarians, and vegans respectively (all p < 0.001). There was evidence that the trend was different between all diet groups (all pairwise p < 0.001).
Amongst those with higher nut consumption categories, statistically significantly higher intakes were seen for protein among omnivores (4.5 g higher per category, p < 0.001), and vegetarians (3.8 g, p < 0.001). There was a non-statistically significantly greater mean by 1.8 g among vegans for each category (p = 0.187), with evidence of a difference between omnivores and vegan (p = 0.048).
For the percentage of energy from sugar there was also a statistically significant difference for linear trend between diet groups (Wald p = 0.006). For omnivores, vegetarians, and vegans there was a 0.4%, 0.7%, 1.0% higher percentage energy from sugar per higher category (all p ≤ 0.001). The difference between omnivores and vegetarians only was statistically significant (p = 0.006).
In terms of micronutrients, there were statistically significant differences in linear trends between diet groups for thiamine, vitamin B12, vitamin D, vitamin E, and calcium (all p < 0.001). For thiamine this association was positive for both omnivores (p < 0.001) and vegans (p = 0.023), but not for vegetarians (p = 0.307). For vitamin B12, each category higher nut frequency was associated with higher values among omnivores (p < 0.001), but with a statistically significant lower value among vegans (p = 0.010), and with no statistically significant difference among vegetarians (p = 0.411). There was evidence for different trends between all diet groups (all pairwise p ≤ 0.019).
For Vitamin D, each higher nut intake category was associated with higher values among omnivores (p < 0.001). There was no association for vegetarians and vegans. The trend was statistically significantly different between omnivores and vegetarians (p ≤ 0.001).
For vitamin E, for each greater nut frequency category, there was a 1.2 mg, 1.4 mg, and 1.9 mg higher mean for omnivores, vegetarians, and vegans respectively (all p < 0.001). The trend appeared to differ between the three diet groups (all pairwise p ≤ 0.013).
For calcium there was a positive association with nut consumption categories for both omnivores and vegetarians (both p < 0.001), but not for vegans (p = 0.874). There was evidence of different linear trends between omnivores and vegetarians (p = 0.027), and between omnivores and vegans (p = 0.019).

4. Discussion

Examining the associations between nut intake and risk factors for chronic disease in this population with diverse dietary patterns has provided us with important information on the relationship between nut consumption and health. Higher nut consumption was associated with lower BMI, waist circumference, and prevalence of both high cholesterol and high blood pressure. In addition, higher nut consumption was associated with reduced prevalence of having had a heart attack, diabetes and gallstones. Greater nut intake was also associated with better diet quality overall. Predictors of nut consumption included younger age, greater education level, higher employment status, and more plant-based dietary categories. An understanding of these predictors can help target public health messages to increase regular nut consumption as part of a cardioprotective diet.
A commonly reported barrier to nut consumption is the fear of weight gain because nuts are high in fat and energy [44]. However, we found nut consumption was inversely associated with body weight, BMI and waist circumference. These associations remained evident in models including physical activity and energy intake. These findings replicate those found by previous epidemiology studies which have reported that nut consumers are leaner than non-nut consumers [30,31,32,33,34]. Similarly, when nuts are added to the diet in intervention studies, weight gain is not apparent, or is at least less than predicted [34,35,36,37,38,39]. There have been several mechanisms for this finding discussed in the literature, including the high satiety effects of nuts [45,46], increased metabolic rate due to the high unsaturated fat content of nuts [47,48,49], and loss of metabolisable energy as faecal fat [50,51,52]. Given we found that higher nut consumption was associated with a leaner body composition, and lower abdominal fat, among a population with diverse dietary intakes, this adds to the evidence that fear of weight gain with increased nut consumption is unfounded. Therefore, public health messages should emphasise this point, and dispel such fears among the general population who are concerned that regular nut consumption could result in unwanted weight gain.
There was evidence of a statistically significant linear trend where higher nut intake was associated with a lower prevalence of high blood cholesterol. This finding is supported by numerous intervention studies, which consistently report lower total and LDL cholesterol concentrations with greater nut consumption [23]. The prevalence of having had a heart attack was also lower amongst those with greater levels of nut consumption, a finding supported by numerous epidemiological studies, which have reported inverse associations between nut consumption and CVD [4,5,6,7,8,9,11]. One mechanism for these findings could be the higher intakes of unsaturated fat and lower intakes of saturated fat observed amongst those with greater nut intakes in this cohort.
We found that with greater nut consumption, the prevalence of having high blood pressure was lower. While some studies are in agreement with this finding [24], not all studies have reported such an association [25]. Intervention studies have also produced equivocal findings [26,27]. Blood pressure is an important risk factor for stroke. In this study the prevalence of having had a stroke was not associated with nut intake. This is a finding congruent with a number of other studies [6,8,16].
Among this cohort of women, the prevalence of having been diagnosed with diabetes was lower amongst those with higher nut intakes. Previous research in this area has also produced mixed results, with one meta-analysis by Afshin et al. [53] reporting a small but significant reduction in the incidence of type 2 diabetes with higher nut consumption, whereas a further three meta-analyses have reported no association [8,15,16]. The inconsistent results could have resulted from lack of adjustment for BMI by Afshin et al. [53]. In our study, although further adjustment for BMI attenuated the relationship between nut intake and the incidence of diabetes, the association remained statistically significant, and it is important to consider that BMI could both be a confounder of any such association and also be on the causal pathway between nut consumption and diabetes. Possible mechanisms for a reduction in the risk of developing type 2 diabetes from greater nut intakes are the higher intakes of monounsaturated and polyunsaturated fats, which were evident in this cohort, using both absolute amounts and as a percentage of total energy, for those with greater nut intakes. Higher intakes of these unsaturated fats are associated with improvements in insulin sensitivity [54]. However, given the inconsistent findings of research in this area to date, future carefully designed studies are required to address the possible relationship between nut intake and the development of type 2 diabetes.
Diet quality was better amongst those with higher nut intakes. As mentioned above, nut intake was associated with a more cardioprotective fat intake, namely, a higher percentage of energy from cis-unsaturated fats, with a lower proportion from saturated fat. Greater levels of nut consumption were also associated with a more nutrient-dense diet in terms of vitamins and minerals (except for vitamin A, C and B12), and also higher intakes of fibre, and lower intakes of sugar. The better nutrient profile observed among nut consumers is consistent with both previous epidemiologic [19,20,21,55,56] and intervention trials [39,57,58]. In fact, the results are remarkably similar to a NZ cross-sectional study using a 24-h recall, which showed higher intakes of unsaturated fats, lower intakes of saturated fat, higher intakes in most nutrients except for vitamin A and B12 [55]. This consistency is reassuring given that the studies used different dietary assessment techniques and were conducted using data from different populations.
In order to promote regular nut consumption, gaining some information on the factors associated with nut intake is important. Predictors of greater intake in this UK cohort included older age, more skilled job categories, higher levels of education, and more plant-based dietary patterns. Age has been associated with nut consumption in other epidemiological studies [17,21], although differences in age classification make comparisons difficult. In this cohort, nut consumption was negatively associated with age but in a US study, the percentage of those consuming nuts was higher in those aged over 51 years compared to those aged 19–51 years [21] and in a NZ sample, nut consumption was significantly higher among those aged 31–70 years compared those aged 18–30 years [17]. Differences in findings are likely to be due to differences in the age range studied. The UK cohort included participants aged 35–70 years, whereas those in the NZ and USA studies had lower age limits of 18 and 19 years respectively.
Higher education and occupational status were associated with a higher likelihood of consuming nuts. Education has also been positively associated with nut intake in NZ, Europe and the USA [17,21,59]. Education level and occupation can, with caution, be used as a rough proxy for socio-economic status (SES). Studies in NZ and the USA have reported a higher prevalence of nut intake among those with a higher SES [17]. Cost has been reported as a barrier to regular nut consumption [44]. Therefore public health initiatives could consider promoting more affordable nuts such as peanuts, which have been shown to improve health [11,35,56,60,61,62,63].
Those who were vegetarian or vegans were unsurprisingly more likely to consume nuts compared to those who reported eating meat, a finding supported by previous research [18,22]. Vegetarians, and in particular, vegans, are at higher risk of certain nutrient deficiencies compared to omnivores [64]. It is therefore reassuring that they consume more nuts, given that nuts are nutrient dense, and important sources of protein, unsaturated fats and a number of vitamins and minerals including iron and zinc [65].
A novel finding of this study is that the benefits of higher levels of nut consumption appear to be greater overall amongst omnivores than vegetarians and vegans, with vegans showing the least benefits in terms of anthropometry outcomes with higher nut intakes and some suggestions of potentially worse outcomes for the highest intake category (60 g per day and above) although these should be interpreted with caution due to the small number of participants in this group. This overall pattern may reflect generally healthier diets amongst non-omnivores with higher levels of nut consumption being associated with smaller differences between the dietary groups. This differs from the Seventh-Day Adventist results where statistically significant associations were observed for both vegetarians and non-vegetarians (vegans were not independently examined), and while that study did not investigate effect modification by dietary pattern, the protective gradient appeared steeper in vegetarians [22]. If our results are confirmed, then where appropriate, public health messages encouraging greater levels of nut consumption could be specifically targeted at omnivores, for example by encouraging incorporating nuts into meat dishes as well as consuming them as a snack food. As this is the largest dietary group in most western countries, and as the benefits from increasing intakes may be greater within this group than for non-omnivores, such targeted interventions could maximise the population–level impact from uptake of the intervention messages. The pattern of worsening anthropometry measures amongst vegans with the highest levels of nut intake (60 g per day and above) or having high cholesterol amongst vegetarians and vegans for the same high intake is also novel although these differences between 60 g per day and no nuts for these diet groups was only statistically significant for waist circumference (p = 0.045). Further research is needed as to whether this is a marker of particular vegan or vegetarian/vegan dietary patterns or whether this finding is spurious. While consumption of nuts has been found to be associated with lower BMI in general population surveys, such high intakes of nuts may not have the same association amongst vegans. It is worth noting that vegans in this highest intake category did not appear to be consuming meaningfully more nuts per day (88 g) than omnivores (85 g) or vegetarians (96 g) although these are all well above common recommendations for nut intakes.
There are several limitations which should be considered when interpreting the results of this study. Firstly, this was a cross-sectional analysis and so causal inference cannot be drawn, although consistency between the data and plausible causal models can be examined. The preferable risk factor profiles, and disease incidences observed amongst those with higher nut intakes might be due to the addition of nutrient-dense nuts to the diet; however, an alternative explanation could be that nut consumers are more health conscious. Thus, high nut consumption could also be a marker of a healthier lifestyle and the observed associations could be the result of residual confounding by health consciousness and associated health behaviours, despite the wide range of potential confounders included in the adjusted analyses. We have not, for example, adjusted for physical activity or stress and these could plausibly confound these associations. In general, the UKWCS was comprised of participants who appeared health conscious, with relatively low rates of smoking and low BMI. Additionally, this cohort included only females, and so results cannot be directly extrapolated to males. Nut intake was assessed by FFQ, which tends to over-estimate the consumption of certain foods [66]. However, the FFQ used has been validated against a semi-weighed four-day food dairy and biomarkers of intake [41]. In addition, a strength of this study is diverse nature of the population in terms of dietary patterns resulting in the wider range in nut intake than seen in other research, which reduces estimation error [67,68].

5. Conclusions

In conclusion, higher nut intakes in this cohort, which comprised participants with diverse dietary patterns, were associated with a lower prevalence of having diabetes, gallstones, and a heart attack. Better risk profiles from lower BMI, abdominal fat, blood cholesterol and blood pressure could account for these observed reductions. Further, the better diet quality observed amongst those with higher nut intakes, in particular with the type of fat, are likely to contribute to the protective effects of regular nut consumption. Predictors of nut intakes included age, education level and employment status, which are relatively consistent with other studies. The associations of more positive markers of health with higher levels of nut intake appear to be greatest for omnivores, followed by vegetarians, and least, and negatively associated in one case, for vegans. These predictors should be used to guide future health messages aimed at increasing regular nut consumption, especially amongst omnivores.

Acknowledgments

The UK Women’s Cohort Study is funded by the World Cancer Research Fund.

Author Contributions

All authors were involved in the conception of the current project. The original study was designed by J.C., V.B. and D.D.G.; R.B. and A.G. analysed the data; R.B. and A.G. wrote the paper which was reviewed and edited by all authors.

Conflicts of Interest

The authors declare no conflict of interest.

References

  1. Alasalvar, C.; Bolling, B.W. Review of nut phytochemicals, fat-soluble bioactives, antioxidant components and health effects. Br. J. Nutr. 2015, 113, S68–S78. [Google Scholar] [CrossRef] [PubMed]
  2. Brufau, G.; Boatella, J.; Rafecas, M. Nuts: Source of energy and macronutrients. Br. J. Nutr. 2006, 96, S24–S28. [Google Scholar] [CrossRef] [PubMed]
  3. Ros, E. Health benefits of nut consumption. Nutrients 2010, 2, 652–682. [Google Scholar] [CrossRef] [PubMed]
  4. Aune, D.; Keum, N.; Giovannucci, E.; Fadnes, L.T.; Boffetta, P.; Greenwood, D.C.; Tonstad, S.; Vatten, L.J.; Riboli, E.; Norat, T. Nut consumption and risk of cardiovascular disease, total cancer, all-cause and cause-specific mortality: A systematic review and dose-response meta-analysis of prospective studies. BMC Med. 2016, 14, 207. [Google Scholar] [CrossRef] [PubMed]
  5. Bao, Y.; Han, J.; Hu, F.B.; Giovannucci, E.L.; Stampfer, M.J.; Willett, W.C.; Fuchs, C.S. Association of nut consumption with total and cause-specific mortality. N. Engl. J. Med. 2013, 369, 2001–2011. [Google Scholar] [CrossRef] [PubMed]
  6. Grosso, G.; Yang, J.; Marventano, S.; Micek, A.; Galvano, F.; Kales, S. Nut consumption and all-cause, cardiovascular, and cancer mortality risk: A systematic review and meta-analysis of epidemiologic studies. Am. J. Clin. Nutr. 2015, 101, 783–793. [Google Scholar] [CrossRef] [PubMed]
  7. Hshieh, T.T.; Petrone, A.B.; Gaziano, J.M.; Djousse, L. Nut consumption and risk of mortality in the Physicians’ Health Study. Am. J. Clin. Nutr. 2015, 101, 407–412. [Google Scholar] [CrossRef] [PubMed]
  8. Luo, C.; Zhang, Y.; Ding, Y.S.; Shan, Z.L.; Chen, S.J.; Yu, M.; Hu, F.B.; Liu, L.G. Nut consumption and risk of type 2 diabetes, cardiovascular disease, and all-cause mortality: A systematic review and meta-analysis. Am. J. Clin. Nutr. 2014, 100, 256–269. [Google Scholar] [CrossRef] [PubMed]
  9. Mayhew, A.J.; de Souza, R.J.; Meyre, D.; Anand, S.S.; Mente, A. A systematic review and meta-analysis of nut consumption and incident risk of CVD and all-cause mortality. Br. J. Nutr. 2016, 115, 212–225. [Google Scholar] [CrossRef] [PubMed]
  10. Micha, R.; Penalvo, J.L.; Cudhea, F.; Imamura, F.; Rehm, C.D.; Mozaffarian, D. Association Between Dietary Factors and Mortality From Heart Disease, Stroke, and Type 2 Diabetes in the United States. JAMA 2017, 317, 912–924. [Google Scholar] [CrossRef] [PubMed]
  11. Van den Brandt, P.A.; Schouten, L.J. Relationship of tree nut, peanut and peanut butter intake with total and cause-specific mortality: A cohort study and meta-analysis. Int. J. Epidemiol. 2015, 44, 1038–1049. [Google Scholar] [CrossRef] [PubMed]
  12. Guo, K.; Zhou, Z.; Jiang, Y.; Li, W.; Li, Y. Meta-analysis of prospective studies on the effects of nut consumption on hypertension and type 2 diabetes mellitus mamm. J. Diabetes 2015, 7, 202–212. [Google Scholar] [CrossRef] [PubMed]
  13. Shao, C.; Tang, H.; Zhao, W.; He, J. Nut intake and stroke risk: A dose-response meta-analysis of prospective cohort studies. Sci. Rep. 2016, 6, 30394. [Google Scholar] [CrossRef] [PubMed]
  14. Shi, Z.Q.; Tang, J.J.; Wu, H.; Xie, C.Y.; He, Z.Z. Consumption of nuts and legumes and risk of stroke: A meta-analysis of prospective cohort studies. Nutr. Metab. Cardiovasc. Dis. 2014, 24, 1262–1271. [Google Scholar] [CrossRef] [PubMed]
  15. Wu, L.; Wang, Z.; Zhu, J.; Murad, A.L.; Prokop, L.J.; Murad, M.H. Nut consumption and risk of cancer and type 2 diabetes: A systematic review and meta-analysis. Nutr. Rev. 2015, 73, 409–425. [Google Scholar] [CrossRef] [PubMed]
  16. Zhou, D.H.; Yu, H.B.; He, F.; Reilly, K.H.; Zliang, J.L.; Li, S.S.; Zhang, T.; Wang, B.Z.; Ding, Y.L.; Xi, B. Nut consumption in relation to cardiovascular disease risk and type 2 diabetes: A systematic review and meta-analysis of prospective studies. Am. J. Clin. Nutr. 2014, 100, 270–277. [Google Scholar] [CrossRef] [PubMed]
  17. Brown, R.C.; Tey, S.L.; Gray, A.R.; Chisholm, A.; Smith, C.; Fleming, E.; Blakey, C.; Parnell, W. Patterns and predictors of nut consumption: Results from the 2008/09 New Zealand Adult Nutrition Survey. Br. J. Nutr. 2014, 112, 2028–2040. [Google Scholar] [CrossRef] [PubMed]
  18. Jenab, M.; Sabate, J.; Slimani, N.; Ferrari, P.; Mazuir, M.; Casagrande, C.; Deharveng, G.; Tyonneland, A.; Olsen, A.; Overvad, K.; et al. Consumption and portion sizes of tree nuts, peanuts and seeds in the European Prospective Investigation into Cancer and Nutrition (EPIC) cohorts from 10 European countries. Br. J. Nutr. 2006, 96, S12–S23. [Google Scholar] [CrossRef] [PubMed]
  19. O’Neil, C.E.; Keast, D.R.; Nicklas, T.A.; Fulgoni, V.L. Out-of-hand nut consumption is associated with improved nutrient intake and health risk markers in US children and adults: National Health and Nutrition Examination Survey 1999–2004. Nutr. Res. 2012, 32, 185–194. [Google Scholar] [CrossRef] [PubMed]
  20. O’Neil, C.E.; Nicklas, T.A.; Fulgoni, V.L. Tree nut consumption is associated with better nutrient adequacy and diet quality in adults: National Health and Nutrition Examination Survey 2005–2010. Nutrients 2015, 7, 595–607. [Google Scholar] [CrossRef] [PubMed]
  21. O’Neil, C.E.; Keast, D.R.; Fulgoni, V.L.; Nicklas, T.A. Tree nut consumption improves nutrient intake and diet quality in US adults: An analysis of National Health and Nutrition Examination Survey (NHANES) 1999–2004. Asia Pac. J. Clin. Nutr. 2010, 19, 142–150. [Google Scholar] [PubMed]
  22. Fraser, G.E.; Sabate, J.; Beeson, W.L.; Strahan, T.M. A possible protective effect of nut consumption on risk of coronary heart disease. The Adventist Health Study. Arch. Intern. Med. 1992, 152, 1416–1424. [Google Scholar] [CrossRef] [PubMed] [Green Version]
  23. Sabate, J.; Oda, K.; Ros, E. Nut consumption and blood lipid levels: A pooled analysis of 25 intervention trials. Arch. Intern. Med. 2010, 170, 821–827. [Google Scholar] [CrossRef] [PubMed]
  24. O’Neil, C.E.; Keast, D.R.; Nicklas, T.A.; Fulgoni, V.L. Nut consumption is associated with decreased health risk factors for cardiovascular disease and metabolic syndrome in U.S. adults: NHANES 1999–2004. J. Am. Coll. Nutr. 2011, 30, 502–510. [Google Scholar] [CrossRef] [PubMed]
  25. Brown, R.C.; Tey, S.L.; Gray, A.R.; Chisholm, A.; Smith, C.; Fleming, E.; Parnell, W. Association of Nut Consumption with Cardiometabolic Risk Factors in the 2008/2009 New Zealand Adult Nutrition Survey. Nutrients 2015, 7, 7523–7542. [Google Scholar] [CrossRef] [PubMed]
  26. Barbour, J.A.; Howe, P.R.; Buckley, J.D.; Bryan, J.; Coates, A.M. Nut consumption for vascular health and cognitive function. Nutr. Res. Rev. 2014, 27, 131–158. [Google Scholar] [CrossRef] [PubMed]
  27. Blanco Mejia, S.; Kendall, C.W.; Viguiliouk, E.; Augustin, L.S.; Ha, V.; Cozma, A.I.; Mirrahimi, A.; Maroleanu, A.; Chiavaroli, L.; Leiter, L.A.; et al. Effect of tree nuts on metabolic syndrome criteria: A systematic review and meta-analysis of randomised controlled trials. BMJ Open 2014, 4, e004660. [Google Scholar] [CrossRef] [PubMed]
  28. Del Gobbo, L.C.; Falk, M.C.; Feldman, R.; Lewis, K.; Mozaffarian, D. Effects of tree nuts on blood lipids, apolipoproteins, and blood pressure: Systematic review, meta-analysis, and dose-response of 61 controlled intervention trials. Am. J. Clin. Nutr. 2015, 102, 1347–1356. [Google Scholar] [CrossRef] [PubMed]
  29. Mohammadifard, N.; Salehi-Abarghouei, A.; Salas-Salvado, J.; Guasch-Ferre, M.; Humphries, K.; Sarrafzadegan, N. The effect of tree nut, peanut, and soy nut consumption on blood pressure: A systematic review and meta-analysis of randomized controlled clinical trials. Am. J. Clin. Nutr. 2015, 101, 966–982. [Google Scholar] [CrossRef] [PubMed]
  30. Bes-Rastrollo, M.; Sabate, J.; Gomez-Gracia, E.; Alonso, A.; Martinez, J.A.; Martinez-Gonzalez, M.A. Nut consumption and weight gain in a Mediterranean cohort: The SUN Study. Obesity 2007, 15, 107–116. [Google Scholar] [CrossRef] [PubMed]
  31. Bes-Rastrollo, M.; Wedick, N.M.; Martinez-Gonzalez, M.A.; Li, T.Y.; Sampson, L.; Hu, F.B. Prospective study of nut consumption, long-term weight change, and obesity risk in women. Am. J. Clin. Nutr. 2009, 89, 1913–1919. [Google Scholar] [CrossRef] [PubMed]
  32. Jackson, C.L.; Hu, F.B. Long-term associations of nut consumption with body weight and obesity. Am. J. Clin. Nutr. 2014, 100, 408S–411S. [Google Scholar] [CrossRef] [PubMed]
  33. Martinez-Gonzalez, M.A.; Bes-Rastrollo, M. Nut consumption, weight gain and obesity: Epidemiological evidence. Nutr. Metab. Cardiovasc. Dis. 2011, 21, S40–S45. [Google Scholar] [CrossRef] [PubMed]
  34. Tan, S.Y.; Dhillon, J.; Mattes, R.D. A review of the effects of nuts on appetite, food intake, metabolism, and body weight. Am. J. Clin. Nutr. 2014, 100, 412S–422S. [Google Scholar] [CrossRef] [PubMed]
  35. Alper, C.M.; Mattes, R.D. Effects of chronic peanut consumption on energy balance and hedonics. Int. J. Obes. Relat. Metab. Disord. 2002, 26, 1129–1137. [Google Scholar] [CrossRef] [PubMed]
  36. Flores-Mateo, G.; Rojas-Rueda, D.; Basora, J.; Ros, E.; Salas-Salvadó, J. Nut intake and adiposity: Meta-analysis of clinical trials. Am. J. Clin. Nutr. 2013, 97, 1346–1355. [Google Scholar] [CrossRef] [PubMed]
  37. Hollis, J.; Mattes, R. Effect of chronic consumption of almonds on body weight in healthy humans. Br. J. Nutr. 2007, 98, 651–656. [Google Scholar] [CrossRef] [PubMed]
  38. Mattes, R.D.; Kris-Etherton, P.M.; Foster, G.D. Impact of peanuts and tree nuts on body weight and healthy weight loss in adults. J. Nutr. 2008, 138, S1741–S1745. [Google Scholar]
  39. Tey, S.L.; Brown, R.; Gray, A.; Chisholm, A.; Delahunty, C. Nuts improve diet quality compared to other energy-dense snacks while maintaining body weight. J. Nutr. Metab. 2011, 2011, 357350. [Google Scholar] [CrossRef] [PubMed]
  40. Cade, J.E.; Burley, V.J.; Greenwood, D.C.; UK Women’s Cohort Study Steering Group. The UK Women’s Cohort Study: Comparison of vegetarians, fish-eaters and meat-eaters. Public Health Nutr. 2004, 7, 871–878. [Google Scholar] [CrossRef] [PubMed]
  41. Spence, M.; Cade, J.; Burley, V.; Greenwood, D. Ability of the UK Women’s Cohort food frequency questionnaire to rank dietary intakes: A preliminary validation study. Proc. Nutr. Soc. 2002, 61, 117. [Google Scholar]
  42. Tey, S.; Brown, R.; Chisholm, A. Nuts and Heart Health. National Heart Foundation of New Zealand Evidence-Based Position Statement on the Relationship of Nuts to Heart Health; National Heart Foundation of New Zealand: Auckland, New Zealand, 2012.
  43. Cade, J.E.; Burley, V.J.; Alwan, N.A.; Hutchinson, J.; Hancock, N.; Morris, M.A.; Threapleton, D.E.; Greenwood, D.C. Cohort Profile: The UK Women’s Cohort Study (UKWCS). Int. J. Epidemiol. 2017, 46, e11. [Google Scholar] [CrossRef] [PubMed]
  44. Pawlak, R.; Colby, S.; Herring, J. Beliefs, benefits, barriers, attitude, intake and knowledge about peanuts and tree nuts among WIC participants in eastern North Carolina. Nutr. Res. Pract. 2009, 3, 220–225. [Google Scholar] [CrossRef] [PubMed]
  45. Brennan, A.M.; Sweeney, L.L.; Liu, X.; Mantzoros, C.S. Walnut consumption increases satiation but has no effect on insulin resistance or the metabolic profile over a 4-day period. Obesity 2010, 18, 1176–1182. [Google Scholar] [CrossRef] [PubMed]
  46. Tan, S.Y.; Mattes, R.D. Appetitive, dietary and health effects of almonds consumed with meals or as snacks: A randomized, controlled trial. Eur. J. Clin. Nutr. 2013, 67, 1205–1214. [Google Scholar] [CrossRef] [PubMed]
  47. Alper, C.M.; Mattes, R.D. Peanut consumption improves indices of cardiovascular disease risk in healthy adults. J. Am. Coll. Nutr. 2003, 22, 133–141. [Google Scholar] [CrossRef] [PubMed]
  48. Claesson, A.-L.; Holm, G.; Ernersson, Ã.; Lindström, T.; Nystrom, F.H. Two weeks of overfeeding with candy, but not peanuts, increases insulin levels and body weight. Scand. J. Clin. Lab. Investig. 2009, 69, 598–605. [Google Scholar] [CrossRef] [PubMed]
  49. Coelho, S.B.; de Sales, R.L.; Iyer, S.S.; Bressan, J.; Costa, N.M.B.; Lokko, P.; Mattes, R. Effects of peanut oil load on energy expenditure, body composition, lipid profile, and appetite in lean and overweight adults. Nutrition 2006, 22, 585–592. [Google Scholar] [CrossRef] [PubMed]
  50. Ellis, P.R.; Kendall, C.W.C.; Ren, Y.; Parker, C.; Pacy, J.F.; Waldron, K.W.; Jenkins, D.J.A. Role of cell walls in the bioaccessibility of lipids in almond seeds. Am. J. Clin. Nutr. 2004, 80, 604–613. [Google Scholar] [PubMed]
  51. Grundy, M.; Grassby, T.; Mandalari, G.; Waldron, K.; Butterworth, P.; Berry, S.; Ellis, P. Effect of mastication on lipid bioaccessibility of almonds in a randomized human study and its implications for digestion kinetics, metabolizable energy, and postprandial lipemia. Am. J. Clin. Nutr. 2015, 101, 25–33. [Google Scholar] [CrossRef] [PubMed] [Green Version]
  52. Novotny, J.A.; Gebauer, S.K.; Baer, D.J. Discrepancy between the Atwater factor predicted and empirically measured energy values of almonds in human diets. Am. J. Clin. Nutr. 2012, 96, 296–301. [Google Scholar] [CrossRef] [PubMed]
  53. Afshin, A.; Micha, R.; Khatibzadeh, S.; Mozaffarian, D. Consumption of nuts and legumes and risk of incident ischemic heart disease, stroke, and diabetes: A systematic review and meta-analysis. Am. J. Clin. Nutr. 2014, 100, 278–288. [Google Scholar] [CrossRef] [PubMed]
  54. Lovejoy, J.C. The influence of dietary fat on insulin resistance. Curr. Diabetes Rep. 2002, 2, 435–440. [Google Scholar] [CrossRef]
  55. Brown, R.C.; Tey, S.L.; Gray, A.R.; Chisholm, A.; Smith, C.; Fleming, E.; Parnell, W. Nut consumption is associated with better nutrient intakes: Results from the 2008/09 New Zealand Adult Nutrition Survey. Br. J. Nutr. 2016, 115, 105–112. [Google Scholar] [CrossRef] [PubMed]
  56. King, J.C.; Blumberg, J.; Ingwersen, L.; Jenab, M.; Tucker, K.L. Tree nuts and peanuts as components of a healthy diet. J. Nutr. 2008, 138, S1736–S1740. [Google Scholar]
  57. Griel, A.E.; Eissenstat, B.; Juturu, V.; Hsieh, G.; Kris-Etherton, P.M. Improved diet quality with peanut consumption. J. Am. Coll. Nutr. 2004, 23, 660–668. [Google Scholar] [CrossRef] [PubMed]
  58. Jaceldo-Siegl, K.; Joan, S.; Rajaram, S.; Fraser, G.E. Long-term almond supplementation without advice on food replacement induces favourable nutrient modifications to the habitual diets of free-living individuals. Br. J. Nutr. 2004, 92, 533–540. [Google Scholar] [CrossRef] [PubMed]
  59. Aranceta, J.; Rodrigo, C.P.; Naska, A.; Vadillo, V.R.; Trichopoulou, A. Nut consumption in Spain and other countries. Br. J. Nutr. 2006, 96, S3–S11. [Google Scholar] [CrossRef] [PubMed]
  60. Barbour, J.A.; Howe, P.R.; Buckley, J.D.; Wright, G.C.; Bryan, J.; Coates, A.M. Lower energy intake following consumption of Hi-oleic and regular peanuts compared with iso-energetic consumption of potato crisps. Appetite 2014, 82, 124–130. [Google Scholar] [CrossRef] [PubMed]
  61. Kris-Etherton, P.M.; Hu, F.B.; Ros, E.; Sabate, J. The role of tree nuts and peanuts in the prevention of coronary heart disease: Multiple potential mechanisms. J. Nutr. 2008, 138, S1746–S1751. [Google Scholar]
  62. Luu, H.N.; Blot, W.J.; Xiang, Y.B.; Cai, H.; Hargreaves, M.K.; Li, H.; Yang, G.; Signorello, L.; Gao, Y.T.; Zheng, W.; et al. Prospective evaluation of the association of nut/peanut consumption with total and cause-specific mortality. JAMA Intern. Med. 2015, 175, 755–766. [Google Scholar] [CrossRef] [PubMed]
  63. Nouran, M.G.; Kimiagar, M.; Abadi, A.; Mirzazadeh, M.; Harrison, G. Peanut consumption and cardiovascular risk. Public Health Nutr. 2010, 13, 1581–1586. [Google Scholar] [CrossRef] [PubMed]
  64. Craig, W.J. Nutrition concerns and health effects of vegetarian diets. Nutr. Clin. Pract. 2010, 25, 613–620. [Google Scholar] [CrossRef] [PubMed]
  65. Messina, V.; Melina, V.; Mangels, A.R. A new food guide for North American vegetarians. J. Am. Diet. Assoc. 2003, 103, 771–775. [Google Scholar] [CrossRef] [PubMed]
  66. Cade, J.; Thompson, R.; Burley, V.; Warm, D. Development, validation and utilisation of food-frequency questionnaires—A review. Public Health Nutr. 2002, 5, 567–587. [Google Scholar] [CrossRef] [PubMed]
  67. Kaaks, R.; Riboli, E. Validation and calibration of dietary intake measurements in the EPIC project: Methodological considerations. European Prospective Investigation into Cancer and Nutrition. Int. J. Epidemiol. 1997, 26, S15–S25. [Google Scholar] [CrossRef] [PubMed]
  68. White, E.; Kushi, L.H.; Pepe, M.S. The effect of exposure variance and exposure measurement error on study sample size: Implications for the design of epidemiologic studies. J. Clin. Epidemiol. 1994, 47, 873–880. [Google Scholar] [CrossRef]
Figure 1. Association between frequency of nut consumption and predicted anthropometric and risk factors by dietary pattern. (a) Association between frequency of nut consumption and body weight by dietary pattern; (b) association between frequency of nut consumption and BMI by dietary pattern; (c) association between frequency of nut consumption and waist circumference by dietary pattern; (d) association between frequency of nut consumption and high blood cholesterol by dietary pattern.
Nutrients 09 01219 g001
Table 1. Characteristics of study participants by nut consumption.
Demographic VariableAll Participants * (n = 34,831)Non-Nut Consumers (n = 5631)Nut Consumers (n = 29,200)
Age (years) a52.2 (9.3)55.5 (9.6)51.6 (9.1)
Height (cm) a163.7 (6.8)163.1 (6.8)163.8 (6.7)
Weight (kg) a65.6 (11.9)67.4 (13.2)65.3 (11.6)
BMI (kg/m2) a24.5 (4.3)25.3 (4.7)24.3 (4.1)
Waist circumference (cm) a73.6 (9.3)75.0 (10.3)73.3 (9.0)
Physical activity b
  None42.2 (13,934) 52.9 (2769) 40.2 (11,165)
  <75 min/week20.0 (6606)14.1 (738)21.1 (5868)
  75 min/week or more37.7 (12,448)33.0 (1725)38.6 (10,723)
Ethnicity b
  White96.0 (33,432)95.9 (5400)96.0 (28,032)
  Asia0.5 (188)0.1 (8)0.6 (180)
  Black0.1 (50)0.1 (6)0.2 (44)
  Other3.3 (1161)3.9 (217)3.2 (944)
Employment b
  Professional 24.7 (8590)18.2 (1024)25.9 (7566)
  Managerial, technical, admin28.7 (9994)23.9 (1346)29.6 (8648)
  Clerical/Skilled41.2 (14,338)49.0 (2760)39.7 (11,578)
  Manual1.0 (344)1.6 (89)0.9 (255)
  Other/missing/no job4.5 (1565)7.3 (412)4.0 (1153)
Highest educational achievement b
  No qualifications16.8 (5347)30.2 (1507)14.3 (3840)
  O-level (16 years)31.2 (9940)33.8 (1688)30.7 (8252)
  A-level (18 years)24.7 (7859)20.2 (1009)25.5 (6850)
  Degree27.4 (8718)15.9 (794)29.5 (7924)
Dietary pattern b
  Omnivore72.1 (25,116)83.1 (4679)70.0 (20,437)
  Vegetarian26.6 (9280)16.1 (905)28.7 (8375)
  Vegan1.3 (435)0.8 (47)1.3 (388)
Energy intake (kJ/day) a9817 (2986)9029 (2954)9969 (2986)
Alcohol
  consume any alcohol b89.6 (29,848)80.4 (4302)91.3 (25,546)
  g/day among alcohol consumers c6.7 (11.8)4.1 (10.1)7.0 (12.1)
Smoking status b
  Never smoked57.9 (19,535)58.8 (3186)57.7 (16,349)
  Current smoker11.1 (3739)12.1 (657)10.9 (3082)
  Former smoker31.1 (10,486)29.1 (1580)31.4 (8906)
Menopausal status b
  Premenopausal47.6 (15,859)33.0 (1768)50.4 (14,091)
  Postmenopausal52.4 (17,462)67.0 (3586)49.6 (13,876)
Current HRT use (%) b23.2 (7539)23.1 (1195)23.2 (6344)
Current OCP use (%) b3.9 (1294)3.2 (166)4.1 (1128)
Age of menarche (year) a12.8 (1.6)12.8 (1.7)12.8 (1.6)
Parity b
  no children13.6 (4258)13.3 (667)13.7 (3591)
  1–2 children65.9 (17,775)55.6 (2790)57.2 (14,985)
  3–4 children27.1 (8449)27.9 (1399)26.9 (7050)
  ≥5 children2.3 (724)3.2 (162)2.2 (562)
* Included only participants with data on nut consumption (n = 34,831); a values are presented as means (standard deviations); b values are presented as % (number); c values are presented as medians (IQR); abbreviations: BMI, body mass index; HRT, hormone replacement therapy; OCP, oral contraceptive pill.
Table 2. Predictors of nut consumption *.
Demographic VariableTotal Nut ConsumptionUnadjusted OR Unadjusted p-ValueAdjusted OR †,‡Adjusted p-Value
No Nuts (n = 5631)<Once per Week (n = 17,992)2–6 Times per Week (n = 9887)Daily (n = 995)>Daily (n = 326)
Age (years) OR per 5 years 155.5 (55.3, 55.8)51.8 (51.7, 52.0)51.0 (50.8, 51.2)53.3 (52.7, 53.9)54.1 (53.1, 55.2) <0.001 <0.001
OR for 50 vs. 40 0.84 (0.83, 0.85) 0.95 (0.93, 0.97)
OR for 60 vs. 40 0.65 (0.63, 0.67) 0.88 (0.84, 0.92)
OR for 70 vs. 40 0.45 (0.42, 0.48) 0.79 (0.73, 0.86)
Physical activity 2
  None52.9 (2769)42.5 (7262)36.4 (3436)36.6 (348)38.8 (119)1.00 a<0.0011.00 a<0.001
  <75 min/week14.1 (738)20.8 (3543)21.8 (2054)21.7 (206)21.2 (65)1.54 (1.45, 1.62) b 1.31 (1.24, 1.40) b
  75 min/week or more33.0 (1725)36.7 (6264)41.8 (3940)41.7 (396)40.1 (123)1.47 (1.41, 1.54) b 1.29 (1.23, 1.36) b
Employment 2 <0.001 <0.001
  Professional 18.2 (1024)24.3 (4370)28.3 (2794)32.5 (323)24.2 (79)1.00 a 1.00 a
  Managerial, technical, admin23.9 (1346)28.5 (5133)31.7 (3138)29.0 (289)27.0 (88)0.90 (0.85, 0.95) b 1.12 (1.05, 1.19) b
  Clerical/Skilled49.0 (2760)42.1 (7580)35.6 (3514)34.4 (342)43.6 (142)0.63 (0.60, 0.66) c 1.01 (0.94, 1.08) a
  Manual1.6 (89)1.0 (183)0.7 (67)0.2 (2)0.9 (3)0.42 (0.35, 0.52) d 0.87 (0.68, 1.10) a,b
  other/missing/no job7.3 (412)4.0 (726)3.8 (374)3.9 (39)14 (4.3%)0.51 (0.46, 0.56) d 0.91 (0.80, 1.04) a
Highest educational achievement (%) 2 <0.001 <0.001
  no qualifications30.2 (1507)16.1 (2656)11.0 (1008)13.0 (120)18.4 (56)1.00 a 1.00 a
  O-level (16 years)33.8 (1688)32.8 (5404)27.5 (2529)25.4 (234)28.0 (85)1.66 (1.55, 1.77) b 1.41 (1.31, 1.52) b
  A-level (18 years)20.2 (1009)24.9 (4092)26.7 (2456)24.5 (226)25.0 (76)2.24 (2.09, 2.39) c 1.87 (1.73, 2.03) c
  Degree15.9 (794)26.2 (4302)34.8 (3194)37.0 (341)28.6 (87)2.98 (2.78, 3.18) d 2.26 (2.07, 2.46) d
Dietary status 2 <0.001 <0.001
  Omnivore83.1 (4679)77.4 (13,931)59.3 (5861)50.9 (506)42.6 (139)1.00 a 1.00 a
  Vegetarian16.1 (905)21.9 (3932)38.7 (3823)45.7 (455)50.6 (165)2.51 (2.40, 2.63) b 2.23 (2.12, 2.35) b
  Vegan0.8 (47)0.7 (12)2.1 (203)3.4 (34)6.8 (22)4.06 (3.36, 4.89) c 3.76 (3.05, 4.64) c
Energy intake (kJ/day) 19029 (8952, 9107)9474 (9434, 9514)10,565 (10,505, 10,642)11,819 (11,610, 12,028)13,596 (13,170, 14,022) <0.001
OR for 4 MJ vs. 10 MJ 0.31 (0.29, 0.32)
OR for 6 MJ vs. 10 MJ 0.49 (0.47, 0.50)
OR for 8 MJ vs. 10 MJ 0.71 (0.70, 0.72)
OR for 12 MJ vs. 10 MJ 1.36 (1.34, 1.38)
OR for 14 MJ vs. 10 MJ 1.80 (1.75, 1.85)
OR for 16 MJ vs. 10 MJ 2.34 (2.25, 2.43)
Smoking status 2
  Never smoked58.8 (3186)57.9 (10,132)57.2 (5482)57.3 (545)61.5 (190)1.00 a<0.0011.00 a<0.001
  Current smoker12.1 (657)11.0 (1928)10.8 (1034)9.8 (93)8.7 (27)0.94 (0.88, 1.00) a 0.98 (0.91, 1.05) a
  Former smoker29.1 (1580)31.0 (5430)32.0 (3071)32.9 (313)29.8 (92)1.07 (1.02, 1.12) b 1.07 (1.02, 1.12) b
* Included participants with data on nut consumption (n = 34,831); 1 Values are presented as means (95% CI); 2 values are presented as % (number); calculated using ordinal logistic regression with fractional polynomials used for continuous variables; adjusted for all other variables in the table except for energy intake; MJ, Megajoule; OR, Odds ratio. Odds ratios with different superscript letters (e.g., a and b) are significantly different.
Table 3. Anthropometric measures by nut consumption category.
Anthropometry VariableTotal Nut Consumptionp for Linear Trend Unadjusted p for Linear Trend Adjusted †,‡p for Linear trend Further Adjusted for Energy Intake †,‡
All Participants (n = 34,831)No Nuts (n = 5631)<Once per Week (n = 17,992)2–6 Times per Week (n = 9887)Daily (n = 995)>Daily (n = 326)
Weight (kg)65.6 (65.5, 65.7)67.4 (67.1, 67.8)66.2 (66.0, 66.4)64.0 (63.8, 64.3)61.7 (63.8, 64.3)60.6 (59.5, 61.7)<0.001 §<0.001 §<0.001 §
BMI (kg/m2)24.5 (24.4, 24.5)25.3 (25.2, 25.4)24.7 (24.7, 24.8)23.7 (23.6, 23.9)22.8 (22.6, 23.1)22.5 (22.2, 22.9)<0.001 §<0.001 §<0.001 §
Waist circumference (cm)73.6 (73.5, 73.7)75.0 (74.7, 75.3)73.8 (73.6, 74.0)72.5 (72.3, 72.7)72.2 (71.6, 72.8)72.1 (71.1, 73.2)<0.001 §<0.001<0.001 §
Values are presented as means (95% CI); calculated using orthogonal polynomials; adjusted for age, vigorous physical activity category, dietary pattern, job category, and smoking status; § there was statistical significant evidence for a quadratic or higher order trend.
Table 4. Odds ratio (95%CI) for chronic disease and risk factors for chronic disease by nut consumption.
Disease/Risk Factor VariableTotal Nut Consumptionp for Linear Trend
No Nuts (n = 5631)<Once per Week (n = 17,992)2–6 Times per Week (n = 9887)Daily (n = 995)>Daily (n = 326)
High Blood Pressure
  Cases11902945132914444
  Unadjusted1.000.70 (0.65, 0.75)0.55 (0.51, 0.60)0.60 (0.5, 0.73)0.54 (0.40, 0.76)<0.001
  Adjusted for age only1.000.86 (0.80, 0.93)0.71 (0.65, 0.78)0.68 (0.56, 0.83)0.57 (0.41, 0.80)<0.001
  Adjusted 1.000.85 (0.78, 0.93)0.75 (0.67, 0.83)0.72 (0.58, 0.90)0.69 (0.48, 0.98)<0.001
  Further adjusted for BMI1.000.86 (0.78, 0.93)0.82 (0.74, 0.91)0.90 (0.72, 1.12)0.92 (0.63, 1.34)0.010
High cholesterol
  Cases54712615645820
  Unadjusted 1.000.66 (0.60, 0.74)0.53 (0.47, 0.60)0.54 (0.41, 0.72)0.57 (0.36, 0.90)<0.001
  Adjusted for age only1.000.87 (0.78, 0.97)0.73 (0.64, 0.83)0.63 (0.47, 0.83)0.62 (0.38, 0.99)<0.001
  Adjusted 1.000.84 (0.74, 0.95)0.75 (0.65, 0.87)0.70 (0.51, 0.96)0.67 (0.40, 1.14)<0.001
  Further adjusted for BMI1.000.85 (0.75, 0.96)0.78 (0.67, 0.91)0.78 (0.57, 1.08)0.76 (0.44, 1.32)0.004
Heart Attack
  Cases151212101172
  Unadjusted1.000.41 (0.33, 0.51)0.35 (0.27, 0.46)0.59 (0.36, 0.99)0.21 (0.05, 0.86)<0.001
  Adjusted for age only1.000.59 (0.47, 0.73)0.55 (0.42, 0.72)0.73 (0.44, 1.22)0.23 (0.06, 0.94)<0.001
  Adjusted 1.000.56 (0.44, 0.72)0.51 (0.37, 0.69)0.70 (0.38, 1.26)0.28 (0.07, 1.15)<0.001
  Further adjusted for BMI1.000.56 (0.44, 0.72)0.55 (0.40, 0.75)0.82 (0.45, 1.49)0.36 (0.09, 1.51)0.011
Angina
  Cases206314144209
  Unadjusted1.000.44 (0.37, 0.53)0.37 (0.30, 0.46)0.51 (0.32, 0.81)0.70 (0.25, 1.37)<0.001
  Adjusted for age only1.000.65 (0.54, 0.79)0.60 (0.48, 0.74)0.63 (0.39, 1.01)0.78 (0.39, 1.55)<0.001
  Adjusted 1.000.64 (0.51, 0.79)0.63 (0.48, 0.82)0.64 (0.36, 1.12)0.85 (0.38, 1.88)0.016
  Further adjusted for BMI1.000.65 (0.52, 0.82)0.67 (0.51, 0.88)0.74 (0.41, 1.30)0.95 (0.40, 2.22)0.092 §
Stroke
  Cases7910951104
  Unadjusted1.000.41 (0.30, 0.54)0.34 (0.24, 0.49)0.67 (0.35, 1.30)0.82 (0.30, 2.25)<0.001
  Adjusted for age only1.000.55 (0.41, 0.74)0.51 (0.35, 0.73)0.79 (0.41, 1.54)0.89 (0.32, 2.48)0.023
  Adjusted 1.000.62 (0.44, 0.87)0.54 (0.36, 0.83)0.89 (0.42, 1.91)1.31 (0.46, 3.71)0.115 §
  Further adjusted for BMI1.000.61 (0.43, 0.86)0.56 (0.36, 0.86)0.94 (0.44, 2.02)1.48 (0.52, 4.21)0.201 §
Diabetes
  Cases197297119125
  Unadjusted1.000.44 (0.37, 0.53)0.32 (0.25, 0.40)0.32 (0.18, 0.57)0.40 (0.16, 0.99)<0.001
  Adjusted for age only1.000.54 (0.45, 0.66)0.41 (0.32, 0.52)0.35 (0.20, 0.65)0.44 (0.18, 1.07)<0.001
  Adjusted 1.000.58 (0.47, 0.72)0.46 (0.35, 0.60)0.57 (0.31, 1.04)0.54 (0.20, 1.50)<0.001
  Further adjusted for BMI1.000.61 (0.48, 0.76)0.54 (0.40, 0.72)0.79 (0.43, 1.44)0.89 (0.32, 2.46)0.008
Gallstones
  Cases4409313914813
  Unadjusted1.000.61 (0.54, 0.69)0.46 (0.40, 0.53)0.56 (0.41, 0.76)0.46 (0.26, 0.80)<0.001
  Adjusted for age only1.000.73 (0.65, 0.83)0.58 (0.50, 0.66)0.59 (0.43, 0.81)0.49 (0.28, 0.86)<0.001
  Adjusted 1.000.77 (0.67, 0.88)0.64 (0.55, 0.76)0.73 (0.52, 1.03)0.46 (0.24, 0.92)<0.001
  Further adjusted for BMI1.000.78 (0.68, 0.90)0.70 (0.59, 0.83)0.85 (0.60, 1.22)0.63 (0.32, 1.25)0.002
Polyps
  Cases851729344
  Unadjusted1.000.60 (0.46, 0.77)0.58 (0.43, 0.78)0.25 (0.09, 0.67)0.76 (0.28, 2.07)0.001
  Adjusted for age only1.000.78 (0.60, 1.02)0.80 (0.59, 1.09)0.29 (0.10, 0.78)0.62 (0.19, 1.97)0.028
  Adjusted 1.000.80 (0.58, 1.09)0.83 (0.58, 1.19)0.31 (0.10, 0.99)0.85 (0.26, 2.79)0.119
  Further adjusted for BMI1.000.81 (l.59, 1.11)0.85 (0.59, 1.24)0.34 (0.11, 1.09)1.01 (0.31, 3.33)0.206
Cancer
  Cases46311756717220
  Unadjusted1.000.74 (0.66, 0.83)0.77 (0.68, 0.87)0.81 (0.63, 1.05)0.68 (0.43, 1.09)0.003
  Adjusted for age only1.000.89 (0.80, 1.00)0.98 (0.86, 1.11)0.91 (0.70, 1.19)0.66 (0.40, 1.07)0.632 §
  Adjusted 1.001.01 (0.88, 1.15)1.13 (0.97, 1.31)0.95 (0.70, 1.29)0.78 (0.46, 1.34)0.366
  Further adjusted for BMI1.001.01 (0.88, 1.16)1.15 (0.98, 1.33)0.94 (0.68, 1.28)0.84 (0.49, 1.44)0.267
Calculated using orthogonal polynomials; adjusted for age, vigorous physical activity category, dietary pattern, job category, and smoking status; § there was statistical significant evidence for a quadratic or higher order trend.
Table 5. Nutrient intakes by nut consumption category.
NutrientTotal Nut Consumptionp for Linear Trend Unadjusted †,‡p for Linear Trend Adjusted †,‡p for Linear Trend Further Adjusted for Energy Intake †,‡
All Participants (n = 34,831)No Nuts (n = 5631)<Once per Week (n = 17,992)2–6 Times per Week (n = 9887)Daily (n = 995)>Daily (n = 326)
Total energy (kJ)9817 (9786, 9849)9029 (8952, 9107)9474 (9434, 9514)10,565 (10,504, 10,624)11,819 (11,610, 12,028)13,596 (13,169, 14,023)<0.001 §<0.001§
Total fat (g)84.7 (84.4, 85.0)73.3 (72.5, 74.1)80.3 (79.9, 80.8)94.4 (93.8, 95.1)112.3 (110.0, 114.6)142.7 (137.2, 148.2)<0.001 §<0.001 §
  %TE32.4 (32.4, 32.5)30.5 (30.3, 30.6)32.0 (31.9, 32.1)33.7 (33.6, 33.8)35.9 (35.5, 36.2)39.5 (38.8, 40.3)<0.001 §<0.001 §
Saturated fat (g)29.3 (29.2, 29.4)26.5 (26.1, 26.8)28.5 (28.3, 28.7)31.7 (31.4, 31.9)33.8 (32.8, 34.7)37.4 (35.6, 39.2)<0.001 §<0.001 §
  %TE11.1 (11.1, 11.1)10.9 (10.8, 11.0)11.2 (11.2, 11.2)11.2 (11.1, 11.2)10.6 (10.4, 10.8)10.3 (9.9, 10.6)0.938 §<0.001 §
Monounsaturated fat (g)27.7 (27.6, 27.8)23.4 (23.1, 23.6)26.0 (25.9, 26.1)31.2 (31.0, 31.4)39.0 (38.2, 39.7)52.9 (50.7, 55.2)<0.001 §<0.001 §
  %TE10.5 (10.5, 10.6)9.7 (9.6, 9.7)10.3 (10.3, 10.3)11.1 (11.1, 11.2)12.5 (12.3, 12.6)14.7 (14.3, 15.1)<0.001 §<0.001 §
Polyunsaturated fat (g)16.3 (16.2, 16.4)13.4 (13.2, 13.6)15.0 (14.9, 15.1)18.8 (18.6, 18.9)25.0 (24.5, 25.5)36.2 (34.6, 37.8)<0.001 §<0.001 §
  %TE6.2 (6.2, 6.2)5.6 (5.5, 5.6)6.0 (6.0, 6.0)6.7 (6.7, 6.8)8.1 (8.0, 8.2)10.1 (9.8, 10.4)<0.001 §<0.001 §
Protein (g)89.3 (89.0, 89.6)87.5 (86.8, 88.2)87.7 (87.3, 88.1)91.5 (91.0, 92.1)98.1 (96.2, 100.0)110.1 (106.4, 113.9)<0.001 §<0.001 §
  %TE15.1 (15.0, 15.1)16.1 (16.0, 16.2)15.3 (15.2, 15.3)14.3 (14.3, 14.4)13.8 (13.7, 13.9)13.5 (13.3, 13.8)<0.001 §<0.001 §
Carbohydrate (g)313 (312, 314)297 (294, 300)303 (302, 305)322 (330, 335)365 (358, 372)394 (379, 409)<0.001 §<0.001 §
  %TE52.6 (52.6, 52.7)54.2 (54.0, 54.4)52.7 (52.6, 52.8)51.9 (51.8, 52.1)51.0 (50.6, 51.4)48.2 (47.3, 49.1)<0.001 §<0.001 §
Sugar (g)149 (148, 149)142 (140, 144)143 (142, 144)157 (156, 159)180 (176, 185)199 (189, 208)<0.001 §<0.001 §
  %TE25.2 (25.2, 25.3)26.2 (26.0, 26.4)25.1 (25.1, 25.2)24.8 (24.7, 24.9)25.5 (25.1, 25.9)24.3 (23.5, 25.0)<0.001 §<0.001 §
Fibre (g)25.6 (25.5, 25.7)23.6 (23.3, 23.9)24.3 (24.1, 24.4)28.0 (27.8, 28.2)33.1 (32.3, 33.8)39.5 (37.7, 41.3)<0.001 §<0.001 §0.002 §
Vitamin A (μg)1243 (1236, 1249)1175 (1158, 1192)1219 (1210, 1227)1303 (1291, 1314)1390 (1349, 1431)1477 (1382, 1572)<0.001 §<0.001 §0.340 §
Thiamin (mg)3.13 (3.10, 3.15)2.79 (2.72, 2.85)2.94 (2.90, 2.97)3.54 (3.48, 3.59)3.94 (3.76, 4.13)4.65 (4.28, 5.03)<0.001 §<0.001 §<0.001
Riboflavin (mg)2.52 (2.51, 2.53)2.48 (2.46, 2.50)2.47 (2.46, 2.48)2.58 (2.56, 2.60)2.75 (2.69, 2.81)2.94 (2.81, 3.06)<0.001 §<0.001 §<0.001 §
Vitamin B6 (mg)2.82 (2.81, 2.83)2.77 (2.74, 2.79)2.75 (2.74, 2.76)2.92 (2.90, 2.94)3.19 (3.13, 3.25)3.62 (3.48, 3.75)<0.001 §<0.001 §<0.001 §
Vitamin B12 (μg)5.69 (5.66, 5.72)5.93 (5.85, 6.01)5.80 (5.75, 5.84)5.44 (5.37, 5.50)5.21 (4.99, 5.43)4.76 (4.38, 5.15)<0.001 §<0.001 §<0.001 §
Folate (μg)402 (401, 403)384 (381, 388)388 (386, 389)426 (423, 429)476 (466, 485)550 (527, 573)<0.001 §<0.001 §<0.001 §
Vitamin C (mg)171 (170, 172)160 (158, 163)164 (163, 165)185 (184, 187)206 (200, 212)230 (213, 246)<0.001 §<0.001 §0.664 §
Vitamin E (mg)9.71 (9.66, 9.75)8.19 (8.09, 8.29)9.01 (8.96, 9.07)11.09 (11.01, 11.18)14.14 (13.84, 14.44)18.74 (17.97, 19.52)<0.001 §<0.001 §<0.001 §
Calcium (mg)1137 (1133, 1141)1099 (1089, 1109)1114 (1109, 1120)1182 (1174, 1190)1252 (1225, 1279)1367 (1313, 1421)<0.001 §<0.001 §<0.001 §
Iron (mg)18.8 (18.8, 18.9)17.8 (17.5, 18.0)18.2 (18.1, 18.3)20.0 (19.9, 20.2)22.7 (22.1, 23.2)25.7 (24.6, 26.9)<0.001 §<0.001 §<0.001
Zinc (mg)11.5 (11.4, 11.5)11.0 (10.9, 11.1)11.2 (11.1, 11.2)11.9 (11.9, 12.0)13.3 (13.1, 13.6)15.6 (15.1, 16.2)<0.001 §<0.001 §<0.001 §
Values are presented as means (95% CI); calculated using orthogonal polynomials; adjusted for age, vigorous physical activity category, dietary pattern, job category, and smoking status; values with different superscript letters are significantly different in the adjusted model; § there was statistically significant evidence for a quadratic or higher order trend; TE, total energy.
Table 6. Effect modification of anthropometric and risk factor associations by dietary pattern.
Anthropometry/Risk Factor VariableLinear Trend *Quadratic Trend after Accounting for Linear Trend *All Trends Combined *
OmnivoresVegetariansVegansp-Value for between Group DifferenceOmnivoresVegetariansVegansp-Value for between Group Differencep-Value for between Group Difference
Weight (kg)−1.30 (−1.48, −1.12)−0.73 (−1.01, −0.46)0.87 (−0.29, 2.04)<0.001−0.28 (−0.46, −0.09)−0.53 (−0.79, −0.27)−1.08 (−2.20, 0.05)0.133<0.001
BMI (kg/m2)−0.54 (−0.60, −0.47)−0.30 (−0.39, −0.20)0.07 (−0.34, 0.49)<0.001−0.09 (−0.16, −0.03)−0.21 (−0.31, −0.12)−0.39 (−0.79, 0.01)0.050<0.001
Waist circumference (cm)−0.69 (−0.83, −0.54)−0.13 (−0.36, 0.09)0.96 (0.01, 1.92)<0.001−0.04 (−0.19, 0.11)−0.50 (−0.72, −0.29)−0.68 (−1.60, 0.24)0.002<0.001
High cholesterol 0.96 (0.91, 1.02)0.81 (0.73, 0.90) 0.0041.02 (0.96, 1.09)1.06 (0.96, 1.16) 0.5070.005
* Adjusted for age, vigorous physical activity category, dietary pattern, job category, and smoking status; effects are odds ratios rather than slopes.

