Article

Prevalence and Predictors of Subclinical Micronutrient Deficiency in German Older Adults: Results from the Population-Based KORA-Age Study

1
Helmholtz Zentrum München, German Research Center for Environmental Health (GmbH), Institute of Epidemiology II, Ingolstädter Landtraße 1, 85764 Neuherberg, Germany
2
German Heart Centre Munich, Technical University of Munich, Lazarettstraße 36, 80636 Munich, Germany
3
DZHK (German Centre for Cardiovascular Research), Partner Site Munich Heart Alliance, 80802 Munich, Germany
4
Ulm Medical Center, Department of Internal Medicine II—Cardiology, University Hospital Ulm, Albert-Einstein-Allee 23, 89081 Ulm, Germany
5
Central Hospital of Augsburg, MONICA/KORA Myocardial Infarction Registry, Stenglinstraße 2, 86156 Augsburg, Germany
6
Institute for Medical Information Processing, Biometrics and Epidemiology, Ludwig-Maximilians-University Munich, Marchioninistraße 15, 81377 Munich, Germany
*
Author to whom correspondence should be addressed.
Nutrients 2017, 9(12), 1276; https://doi.org/10.3390/nu9121276
Submission received: 11 October 2017 / Revised: 16 November 2017 / Accepted: 20 November 2017 / Published: 23 November 2017
(This article belongs to the Special Issue Nutrition and Ageing)

Abstract

:
Subclinical micronutrient deficiency in older adults is associated with chronic age-related diseases and adverse functional outcomes. In Germany, the older population is at risk of insufficient micronutrient intake, but representative studies on micronutrient status in old and very old adults are scarce. This study’s objectives were to estimate the prevalence of subclinical vitamin D, folate, vitamin B12 and iron deficiencies among older adults, aged 65 to 93, from the KORA-Age study in Augsburg, Germany (n = 1079), and to examine associated predictors, using multiple logistic regression. Serum concentrations of 25-hydroxyvitamin D (25OHD), folate, vitamin B12, and iron were analyzed. The prevalence of subclinical vitamin D and vitamin B12 deficiencies were high, with 52.0% and 27.3% of individuals having low 25OHD (<50 nmol/L) and low vitamin B12 concentrations (<221 pmol/L), respectively. Furthermore, 11.0% had low iron (men <11.6 µmol/L, women <9.0 µmol/L) and 8.7% had low folate levels (<13.6 nmol/L). Common predictors associated with subclinical micronutrient deficiency included very old age, physical inactivity, frailty and no/irregular use of supplements. Subclinical micronutrient deficiency is a public health concern among KORA-Age participants, especially for vitamins D and B12. The predictors identified provide further rationale for screening high-risk subgroups and developing targeted public health interventions to tackle prevailing micronutrient inadequacies among older adults.

1. Introduction

Deficiencies in essential vitamins, minerals and trace elements (micronutrients) affect an estimated 2 billion people, in both developing and developed countries. This ‘hidden hunger’ has negative health impacts among vulnerable groups in the population, especially older adults [1].
Epidemiological evidence suggests that subclinical micronutrient deficiencies in older adults are associated with chronic age-related diseases and adverse functional outcomes. Older adults with low 25-hydroxyvitamin D (25OHD) levels have a significantly higher risk for type 2 diabetes mellitus, cardiovascular disease (CVD) and osteoporosis-related fractures [2]. Age-associated declines in muscle mass and strength (sarcopenia), which in turn affect balance, gait, and overall independence [3], have been linked to low 25OHD levels as well [4]. Vitamin B12 and folate are necessary for one-carbon metabolism and DNA synthesis, and have been investigated in relation to degenerative diseases, including CVD, cognitive dysfunction and osteoporosis [5]. Iron deficiency is the most prevalent nutritional deficiency worldwide and its main consequence is anemia [6], which has been associated with an increased risk of developing dementia in old age [7].
Ageing is associated with physiological changes that can impact the nutritional and more specifically the micronutrient status of older adults. Importantly, energy requirements decrease due to a loss of lean body mass and a reduction in physical activity, resulting in decreasing energy intakes. At a low energy intake, older adults may be at increased risk for specific micronutrient deficiencies, unless their diets contain micronutrient-rich foods. Moreover, older adults’ abilities to absorb and utilize specific micronutrients become less efficient (e.g., reduced gastric acid secretion preventing the release of vitamin B12 from foods [5]; decline in subcutaneous vitamin D synthesis capacity and lowered renal conversion to its active form [8]). Last, but not least, the likelihood of multiple chronic diseases, such as cardiovascular disease, type 2 diabetes mellitus and cancer, use of multiple medications and variable diet quality, associated with appetite loss, chewing/swallowing difficulties and socioeconomic barriers, may affect and even increase requirements for specific micronutrients [9,10]. All these factors make it difficult to ensure an optimal micronutrient supply for the older population.
Due to the role of micronutrient status in chronic disease and health prevention, it is important to quantify the magnitude of subclinical micronutrient deficiency and to identify subgroups at risk in the older population. Results from the second German National Nutrition Survey (NVS II) uncovered a high prevalence of insufficient dietary intake of vitamin D, folic acid and calcium in older adults aged 65 years and over. Vitamins B1, B2, B12 and iron were additional critical micronutrients in older women [11]. More recently, the national ‘German Health Interview and Examination Survey for Adults’ (DEGS1) revealed that 69.9% of women and 62.6% of men, aged 65 to 79, had low 25OHD <50 nmol/L [12], signaling a potentially serious public health issue. Nationally representative studies on the statuses of other micronutrients, in old and very old adults, in Germany, are scarce.
To support health care in developing purposive prevention measures that handle micronutrient inadequacies among older adults, factors associated with subclinical micronutrient deficiencies in older adults have to be identified. Besides insufficient dietary intake and impaired absorption, low micronutrient levels in older adults have been studied in relation to increasing age, female sex, poor eating habits, low physical activity, smoking, obesity, low kidney function, presence of chronic diseases, intake of drugs, non-use of supplements and, specifically for vitamin D, low sunlight exposure and winter season [13,14,15,16,17,18]. Despite recent concerns about the possible high prevalence of subclinical micronutrient deficiencies in the German older population, and apart from vitamin D [12,18], there is a lack of data on both micronutrient status and its predictors in older adults.
In light of the growing ageing population, as well as the high societal relevance of successful healthy ageing, this cross-sectional study aimed to provide insight into the magnitude of subclinical micronutrient deficiency in German older adults, aged 65 and over, from the population-based KORA (Cooperative Health Research in the Region of Augsburg)-Age study. Based on the micronutrients identified in the NVS II as possible public health concerns in the German older population, we selected four critical micronutrients with available nutritional biomarkers in the KORA-Age dataset. Specific objectives were (i) to determine the prevalence of subclinical vitamin D, folic acid, vitamin B12 and iron deficiencies in this older population, using serum biochemical biomarkers; and (ii) to identify predictors of subclinical micronutrient deficiency using multiple logistic regression. Possible predictors examined included socio-demographic, lifestyle, and health factors, as well as the use of supplements containing specific micronutrients.

2. Materials and Methods

2.1. Study Design and Participants

Data for the present analysis was obtained from the population-based KORA-Age study, conducted in 2008/2009, which was a follow-up of all participants, aged 65 and over on 31 December 2008 (n = 9197), who took part in at least one of four cross-sectional MONICA (Monitoring of Trends and Determinants in Cardiovascular Disease)/KORA health surveys S1–S4 conducted between 1984 and 2001, among the inhabitants of Augsburg and surrounding counties. Details about the general study design and participants have been described previously [19]. Briefly, a self-administered health questionnaire was mailed to all eligible participants of the KORA-Age cohort, i.e., those who were still alive and reachable in 2008/2009 (n = 5991). The response rate was 76.2% (n = 4565). Moreover, 68.9% of eligible participants took part in a standardized telephone interview (n = 4127). The present analysis refers to a sex and age-stratified random sample of n = 2005 eligible individuals of whom n = 1079 (537 men, 542 women) participated in an extensive physical examination in 2009 (response rate 53.8%). All examinations were performed by trained interviewers. A flowchart of the KORA-Age 2008/2009 recruitment and retention profile is shown in Supplementary Figure S1.

2.2. Ethical Considerations

Prior to their inclusion in the study, written informed consent was obtained from all participants or from the patient’s caregiver when the participant was unable to make an informed decision. The Ethics Committee of the Bavarian Medical Association (Bayerische Landesärtzekammer) approved the study protocol (date of approval: 11 November 2008, reference number: 08064).

2.3. Blood Sample Processing

Non-fasting blood samples were collected between February and November 2009 at the KORA study center and drawn into serum gel S-Monovette tubes (Sarstedt, Nümbrecht, Germany). Blood was gently inverted twice and rested for 30 min at room temperature until complete coagulation. After centrifugation at 15 °C for 10 min, the serum obtained was aliquoted into Nunc cryotubes (Thermo Fisher Scientific, Waltham, MA, USA). For the analysis of iron status, serum probes were kept at 4 °C for a maximum of 6 h and directly analyzed at the central laboratory of Augsburg Hospital. For vitamin D, folic acid and vitamin B12 status, serum probes were frozen at −80 °C at the KORA study center, transported on ice and stored at a minimum of −80 °C until analysis, in partner laboratories, between August and September 2011. Months of blood collection were categorized according to calendar seasons: spring (February–May), summer (June–August) and autumn (September–November).

2.4. Biochemical Analyses of Nutritional Biomarkers

Serum concentrations of 25-hydroxyvitamin D (25OHD), folate and cobalamin (vitamin B12) were measured by an electrochemiluminescence immunoassay (ECLIA, Elecsys 2010, Roche Diagnostics GmbH, Mannheim, Germany). The intra- and inter-assay coefficients of variations were 4.9% and <10% for 25OHD, 7.0% and <10% for folate and 5.3% and <10% for vitamin B12. Iron levels were measured by photometric measurements, using the chromophore Ferene® (Dimension® Iron Flex® reagent cartridge, Dade Behring, Inc., Newark, DE, USA). The inter-assay coefficient of variation was <10%, and the maximal permissible imprecision and inaccuracy were 4% and 6%, respectively.

2.5. Cut-Off Points to Classify Subclinical Micronutrient Deficiency

Exact cut-off points for classifying subclinical micronutrient deficiencies remain debated. Recently, a serum 25OHD level of ≥50 nmol/L was recommended as an indicator of optimal vitamin D status by the critical review of the German Nutrition Society (DGE) for DACH countries (Germany, Austria and Switzerland) [20] as well as the last Nordic Nutrition Recommendations (NNR 2012) [21]. Accordingly, subclinical vitamin D deficiency was defined as a serum 25OHD level of <50 nmol/L. Subclinical folate and vitamin B12 deficiencies were defined as serum folate <13.6 nmol/L [22] and serum vitamin B12 <221 pmol/L [23], respectively. For serum iron, cut-offs were <11.6 µmol/L for men and <9.0 µmol/L for women [24].

2.6. Assesment of Predictors

The selection of potential predictors of subclinical micronutrient deficiencies was informed by the literature and their availability in the KORA-Age dataset. Variables were grouped into three categories (socio-demographic, lifestyle, health factors) plus the season of blood collection for vitamin D. Assessment methods and categorization of variables are described in Supplementary Table S1.
Briefly, the variables—sex, age groups and family status—were collected using the short form of the Demographics Standards of the German Society of Epidemiology [25]. Educational attainment was estimated by recording years of school completed. With the Geriatric Nutritional Risk Index (GNRI), the risk for malnutrition was assessed by measuring albumin, weight and height [26]. The Nutrition Score, indicating the risk of general malnutrition, was calculated using the German short form of the SCREEN II (Seniors in the Community: Risk Evaluation for Eating and Nutrition, version II) questionnaire [27]. The physical activity assessment included the frequency and duration of activity in summer and in winter [28]. Alcohol intake was assessed as daily average intake, based on the last weekend and the last weekday, according to a validated recall method [29]. Multi-morbidity was defined as suffering from two or more morbidities [30]. Information on smoking status was based on self-report and participants were classified as never smokers, former smokers, or current smokers [31]. The body mass index (BMI) was defined as the body mass (weight) measured in kilograms divided by the square of the body height measured in meters. Frailty was defined according to the five criteria proposed by Fried et al. [32] in a slightly modified way, depending on the availability of information [33]. The glomerular filtration rate (eGFR) was estimated from serum creatinine as an indicator of renal function [34]. Use of medications and supplements ingested in the last seven days was collected through a database supported computer software (IDOM, Instrument for Databased Assessment Of Medication) [35], together with the mode, dosage and frequency of ingestion [36]. The micronutrient composition of supplements was available from a database established by staff of the Helmholtz Zentrum München. Polypharmacy was defined as the use of ≥5 medications, taken regularly and prescribed (without herbal or homeopathic medications).

2.7. Statistical Analysis

Descriptive statistics for categorical variables were expressed as frequencies and percentages. Due to non-normally distributed concentrations, serum levels of nutritional biomarkers were expressed as median and interquartile range (IQR), from the first (Q1) to the third quartile (Q3). When biomarker levels fell below the cut-offs for subclinical micronutrient deficiency, micronutrient status was categorized as ‘subclinical deficiency’ for the respective micronutrient. Prevalence estimates of subclinical micronutrient deficiency were reported with weighted percentages, using the Bavarian population per 31 December 2015 for age and sex standardization (www.statistikdaten.bayern.de/genesis/). Pearson’s chi-squared tests were conducted to assess sex and age differences in prevalence estimates.
To investigate predictors of subclinical micronutrient deficiencies, we defined subclinical micronutrient deficiency as the dependent variable and predictors as the categorical independent variables. The category with the ‘lowest risk’ was considered as reference for each independent variable (e.g., male sex, 65–74 years, never smoker etc.). Participants with missing information in one or more variables were excluded, except for frailty, which had a high number of missing values (n = 84). To avoid deletion of numerous information-rich participants, all participants with missing frailty status were considered as a separate category of the frailty variable. The analysis was performed separately for 25OHD, folate, vitamin B12 and iron, according to the following scheme. We started with a binary logistic regression, for each of the potential predictors, by calculating unadjusted odds ratios (ORs) and 95% confidence intervals (CIs). Variables that were significant at p < 0.25 were considered for inclusion in the multiple logistic regression model. Sex and age groups were forced into every model. As simultaneous intake of multiple supplements is frequent among older adults, we considered, for each nutritional biomarker, only supplement intake of the corresponding micronutrient. The final model, with variables significant at p < 0.05, resulted from a stepwise selection procedure, which is a combination of the forward and backward selection techniques. Model estimates are presented as fully adjusted ORs along with 95% CIs. All analyses were performed using the statistical software package, SAS version 9.4 (SAS Institute Inc., Cary, NC, USA).

3. Results

3.1. Baseline Characteristics of Study Participants

A description of baseline characteristics is shown in Table 1, stratified by sex. A total of n = 1079 individuals, aged 65 to 93 years, participated in the study, including 542 (50.2%) women. Overall, 47.7% of participants were physically inactive and 30.2% had a BMI ≥ 30 kg/m2, indicating obesity. Current smokers accounted for less than 5% of the population. Only 4.6% of all individuals were frail, but 37.9% were pre-frail. The prevalence of older adults having one or at least two diseases was 24.7% and 66.8%, respectively. Noticeable sex differences were observed for the variables, family status, educational level and alcohol consumption.
Seniors regularly using supplements containing vitamin D, folic acid, vitamin B12 and iron accounted for 6.7%, 9.5%, 8.9% and 2.8% of the male population, and 19.2%, 12.0%, 12.2% and 3.9% of the female population, respectively. In these regular users, the median amounts of vitamin D, folic acid, vitamin B12 and iron consumed from these supplements per day were, for men, 6.2 µg (IQR: 3.6–10.0), 400.0 µg (IQR: 200.0–714.3), 3.3 µg (IQR: 1.8–10.0) and 5.0 mg (IQR: 1.7–35.0), and for women 10.0 µg (IQR: 5.0–20.0), 300.0 µg (IQR: 200.0–400.0), 3.0 µg (IQR: 1.5–9.0) and 4.0 mg (IQR: 3.5–5.0), respectively.
Serum concentrations of 25OHD, folate, vitamin B12 and iron were measured in n = 1040, n = 1043, n = 1044 and n = 1050 KORA-Age individuals, respectively. Accordingly, a total of n = 39 (25OHD), n = 36 (folate), n = 35 (vitamin B12) and n = 29 individuals (iron) had missing values in serum nutritional biomarker measurements. Using Pearson’s chi-squared tests, KORA-Age individuals with missing micronutrient values were more likely to be very old (85–93 years); to live alone, to be divorced or widowed; to be less active or inactive; to be alcohol abstainers; to have a normal BMI (18.5 ≤ BMI < 25 kg/m2) and to have a low kidney function (eGFR < 60 mL/min/1.73 m2) (data not shown).

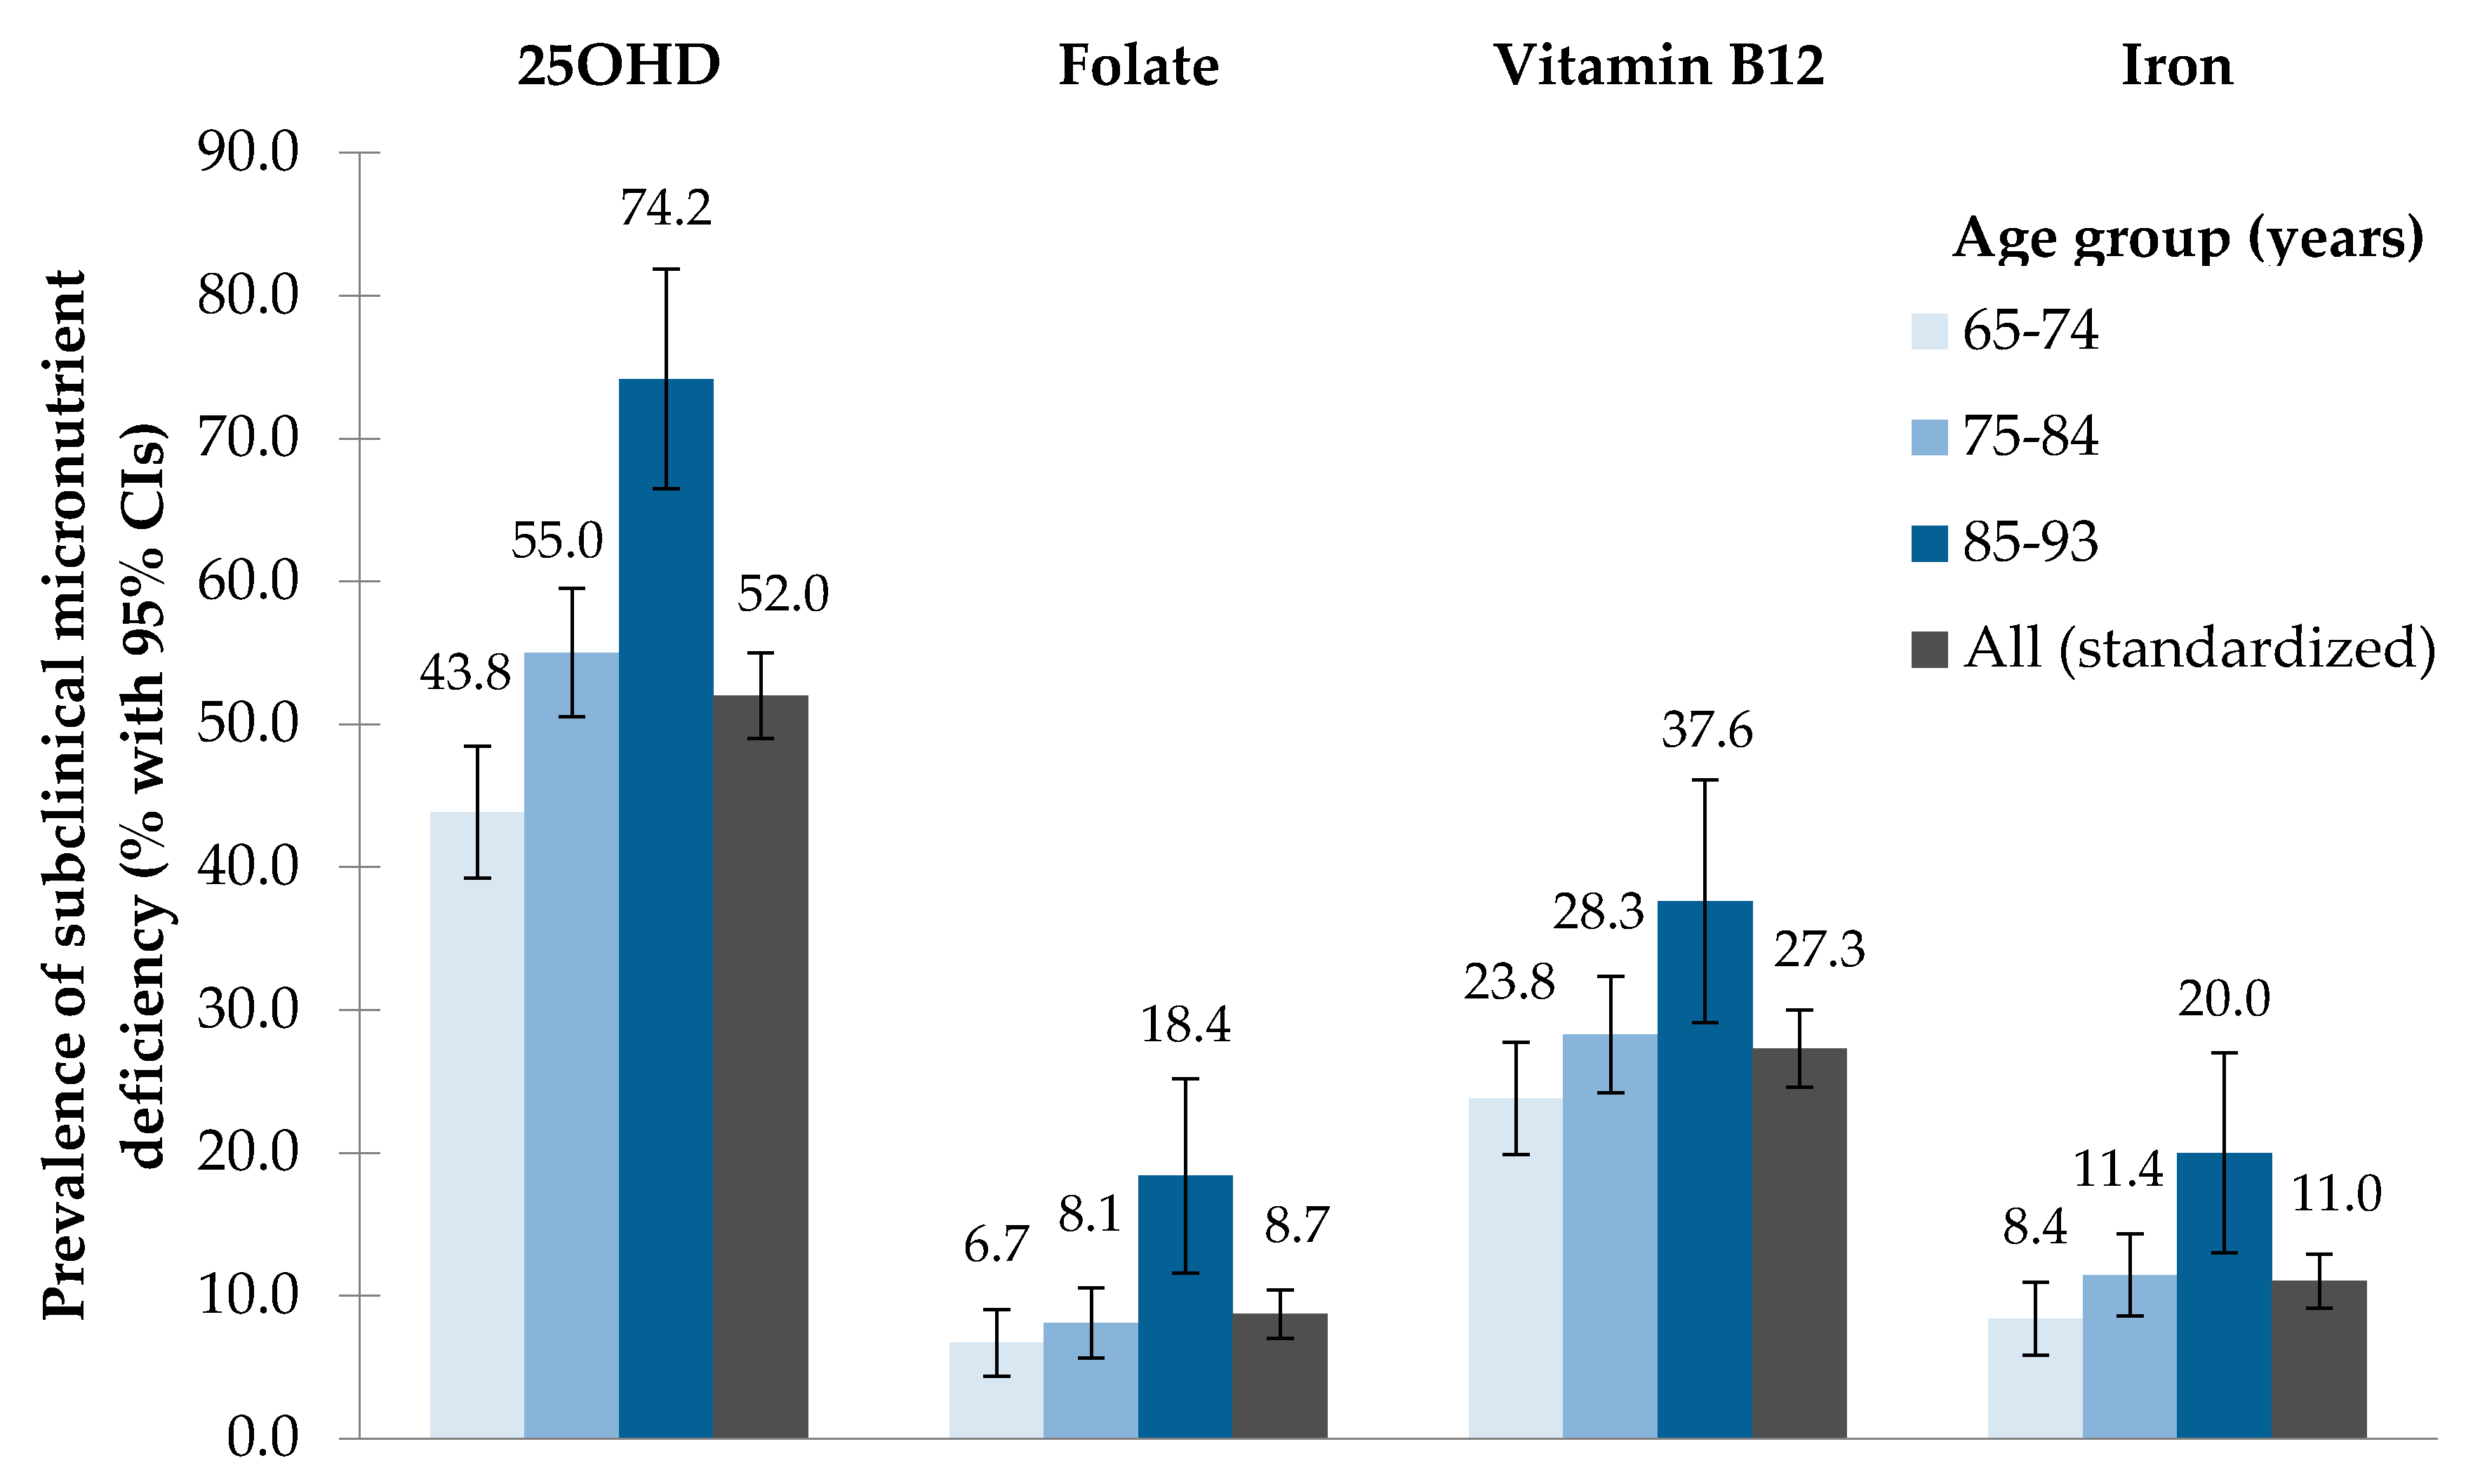
3.2. Prevalence of Subclinical Micronutrient Deficiency

Serum concentrations of nutritional biomarkers and total age- and sex-standardized prevalence of subclinical micronutrient deficiencies are presented in Table 2, stratified by sex.
Median concentrations of 25OHD, folate, vitamin B12 and iron were 48.3 nmol/L (IQR: 31.4–69.6), 24.5 nmol/L (IQR: 18.2–33.3), 277 pmol/L (IQR: 214–376) and 16.1 µmol/L (IQR: 13.1–20.0), respectively.
More than half of KORA-Age participants (52.0%) had low 25OHD concentrations. In season-specific analyses, the prevalence of a subclinical vitamin D deficiency was 60.9% in spring (February–May), 46.9% in summer (June–August) and 45.4% in fall (September–November). The prevalence of a subclinical vitamin B12 deficiency (27.3%) was also high. Approximately 10% of individuals had low levels of iron and folate. In sex-specific analyses, the prevalence of subclinical deficiencies were more common in women for 25OHD (59.0% vs. 44.4%) and folate (9.4% vs. 8.0%) and in men, for vitamin B12 (28.5% vs. 26.0%) and iron (13.5% vs. 8.4%). Using Pearson’s chi-squared tests, these sex differences in prevalence were significant for 25OHD and iron (p < 0.001).
The prevalence of subclinical micronutrient deficiencies, by age groups, is shown in Figure 1. The prevalence increased gradually with age for all micronutrients. Specifically, the proportion of participants with serum 25OHD <50 nmol/L increased from 43.8% in the age group 65–74 years, to 74.2% in the age group 85–93 years. In Pearson’s chi-squared tests, divergences between age groups were significant for all biomarkers (25OHD: p < 0.001; folate: p < 0.001; vitamin B12: p = 0.008; iron: p = 0.001).

3.3. Predictors of Subclinical Micronutrient Deficiency

As illustrated in Supplementary Tables S2 and S3, 15 variables were tested in a binary logistic regression for the association between subclinical micronutrient deficiencies and each of the potential predictors, plus the season of blood collection for 25OHD. Besides sex and age groups, common potential predictors with p-values < 0.25 included educational level, nutritional status (Nutrition Score), physical activity, alcohol consumption, frailty and use of micronutrient-containing supplements.
The final results of the multiple logistic regression analyses are shown in Table 3. Common predictors that were significantly (p < 0.05) associated with low levels of several micronutrients were identified. Seniors aged 85 and over had two times higher odds of having low 25OHD (OR = 2.2, 95% CI 1.3–3.8, p = 0.003), low folate (OR = 2.3, 95% CI 1.2–4.3, p = 0.011) and low vitamin B12 levels (OR = 2.0, 95% CI 1.2–3.2, p = 0.004) compared to their 65–74-year old counterparts. Physical inactivity remained significantly associated with low 25OHD (OR = 1.6, 95% CI 1.2–2.2, p = 0.001), low folate (OR = 2.0, 95% CI 1.2–3.4, p = 0.006) and low vitamin B12 levels (OR = 1.4, 95% CI 1.0–1.8, p = 0.042). Both pre-frailty and frailty were strong independent correlates of subclinical 25OHD and iron deficiency. Frailty increased four-fold, the odds of a subclinical iron deficiency, compared to non-frail individuals (OR = 4.2, 95% CI 1.6–10.2, p = 0.002). Moreover, non/irregular users of supplements, containing specific micronutrients, had four to five times higher odds of having low 25OHD (OR = 4.8, 95% CI 3.1–7.6, p < 0.001), low folate (OR = 3.9, 95% CI 1.4–16.1, p = 0.024) and low vitamin B12 levels (OR = 4.7, 95% CI 2.5–10.2, p < 0.001), compared to regular users.
A few predictors remained independently associated with low levels of specific micronutrients only (Table 3). Springtime, female sex and obesity were significantly associated with a subclinical 25OHD deficiency. Former smokers had lower odds of having low 25OHD levels, compared to non-smokers. Polypharmacy was associated with better vitamin B12 levels. Regarding folate, drinkers of ≥20 g alcohol per day had lower odds of having low folate levels than non-drinkers. Finally, having a moderate/major and even low risk for malnutrition (as assessed by the GNRI), male sex and polypharmacy were associated with an increased risk for low iron levels.

4. Discussion

The determination of the magnitude and predictors of subclinical micronutrient deficiency in KORA-Age older adults revealed that the prevalence of subclinical vitamin D and B12 deficiencies were high. Very old age, physical inactivity, frailty and no/irregular use of micronutrient-containing supplements were common predictors of subclinical micronutrient deficiencies.

4.1. Prevalence of Subclinical Micronutrient Deficiency

Direct comparison of our findings with other studies is hampered by the lack of international consensus as to which nutritional biomarker (biochemical and/or functional), which assay methodology, and which cut off point should be used to define a subclinical micronutrient deficiency in older adults [23,37]. Nevertheless, our population-based data is in line with previous studies that have suggested that subclinical vitamin D and B12 deficiencies are prevalent public health problems among older adults [12,15,38,39,40,41,42].
In the present study, low 25OHD levels were found in more than half (52.0%) of KORA-Age participants, and were more frequent in women (59.0%) than in men (44.4%). These findings lie in the range of national estimates from selected European countries that have used 25OHD < 50 nmol/L as the cut-off, including Germany (women 69.9%, men 62.9%) [12], Austria (women 62.3%, men 64.8%) [38], France (women 42.2%, men 36.5%) [39] and England (women 57.0%, men 49.0%) [15].
Around one out of four participants (27.3%) had a low vitamin B12 concentration in the KORA-Age study population. In line with our data, a subclinical vitamin B12 deficiency has been reported in 10–15% of older adults aged 60 and over in the USA [40,41], and even in 23–35% of older adults aged 80 and over in the USA [42].
The prevalence of subclinical deficiencies for both serum folate and serum iron (~10%) was less of a concern in the studied older adults. Recent studies in the USA [43] and in Brazil [44] pointed to a prevalence of <5% for folate deficiency among older adults aged 60 and over, though it is important to note that these countries have adopted national folic acid fortification policies. For serum iron, comparable studies in older adults are lacking; other studies have focused on identifying more advanced cases of iron deficiency or anemia, or they have used, in combination with serum iron or without, other functional nutritional biomarkers of iron status, such as transferrin saturation, serum ferritin, or blood hemoglobin measurements [45,46,47]. In these studies, the prevalence of iron deficiency or anemia was only moderate (≤11%) in the older population.
Risk factors for subclinical micronutrient deficiency among older adults include: (i) decreased energy needs due to a loss of lean body mass and a decline in physical activity; (ii) age-associated physiological changes that affect absorption and utilization of micronutrients (e.g., decreased renal production of the active vitamin D form by the aging kidney [8]), and finally (iii) the presence of multiple chronic diseases, nutrient-drug interactions and variable diet quality, which may affect micronutrient requirements [9,10]. To identify older adults who would benefit most from subclinical micronutrient deficiency screening, we next discuss other factors that are associated with subclinical micronutrient deficiencies among older adults.

4.2. Predictors of Subclinical Micronutrient Deficiency

4.2.1. Common Predictors of Subclinical Micronutrient Deficiency

Very Old Age

Seniors aged 85 and over were two times more likely to have low 25OHD, low folate and low vitamin B12 levels compared to their younger counterparts. It is well known that micronutrient inadequacies increase beyond 65 years [37,48], and even more in octogenarians and older [15,42].
The efficiency of producing vitamin D in the skin decreases with age [8], and may be coupled to age-related factors that limit sunlight exposure, such as being more housebound. A subclinical vitamin B12 deficiency in older adults is mainly caused by inadequate dietary intake and malabsorption. Chronic atrophic gastritis (a chronic inflammation causing loss of the gastric acid-producing cells, which is prevalent in ~30% of older adults) and the intake of drugs, such as proton pump inhibitors, histamine receptor 2 antagonists and biguanides, affect the secretion of gastric acid, thereby preventing the release of vitamin B12 from foods. Other contributing risk factors for low vitamin B12 levels in older adults include Helicobacter pylori infection and intestinal bacterial overgrowth [5,23]. An insufficient folate status in older adults seems to be mainly due to poor diet [49].

Physical Inactivity

Physical inactivity was associated with low 25OHD, folate and vitamin B12 concentrations. In epidemiological studies on vitamin D status, physical activity is often used as a proxy for time spent outdoors and indirectly for sunlight exposure. Accordingly, housebound seniors and those spending less time doing outdoor physical activity have decreased 25OHD levels [16]. Not surprisingly, being physically active was associated with higher 25OHD levels in our study. It has to be noted that our variable probably only gives a rough estimate of time spent outside, as it was not possible to distinguish outdoor from indoor activities.
Brock et al. found a positive association between both outdoor and indoor physical activities and 25OHD, suggesting that physical activity per se may also be a surrogate for better general health [50]. This may explain the findings for folate and vitamin B12. Prospective studies are needed to confirm a potential physiological link between physical activity and micronutrient concentrations.

Frailty

Pre-frail and frail individuals had a higher risk for subclinical 25OHD and iron deficiency. Prior cross-sectional and prospective studies among KORA-Age participants found low 25OHD levels to be associated with prevalent (pre-)frailty [33], incident pre-frailty and pre-frailty/frailty combined [51]. To our knowledge, the relationship between low serum iron levels and frailty occurrence has not been extensively investigated, yet Pires Corona et al. found that anemic older adults with low hemoglobin levels were more likely to be frail [52].
Although our findings suggest that (pre-)frailty may be a predictor of a subclinical micronutrient deficiency, it has also been suggested that poor nutrition itself can favor the development of frailty [53].

No/Irregular Use of Supplements

No/irregular use of supplements was a strong common predictor of subclinical 25OHD and folate and vitamin B12 deficiencies. Prior studies in older adults have found that supplement use is a major predictor of vitamin D status [14,17] and is linked to higher vitamin B12 and folate levels [54,55]. Although 44.7% of KORA-Age participants used supplements containing vitamins or minerals [36], only around 10% took supplements containing vitamin D, folate and vitamin B12, respectively. As shown previously [56,57], optimal serum micronutrient levels, such as vitamin D, folate and vitamin B12, can be maintained by supplementation. The possibility that regular supplementation with these specific micronutrients might help older adults in satisfying their requirements, and prevent chronic diseases via the correction of low levels, as found earlier [56], is of major interest and could stimulate research on biological pathways that link supplement intake, micronutrient status and disease state.
No/irregular use of iron-containing supplements was not significantly associated with a subclinical iron deficiency in our study. It is important to note that there are concerns about the adverse effects of iron-containing supplements [6], including nausea, epigastric discomfort and constipation, all of which are dose-related. In case of iron deficiency anemia, it is recommended to seek consultation from a physician, in order to use appropriately dosed iron-containing supplements.

4.2.2. Further Predictors of Subclinical Micronutrient Deficiency

Vitamin D (Springtime, Female Sex, Obesity, Former Smoking)

In line with previous studies among older adults, we found that springtime, female sex and obesity were significantly associated with low 25OHD levels [15,16,17]. Seasonal variations in 25OHD status are well known. During cold and dark months, older adults may spend more daylight hours indoors, resulting in less sun exposure. Furthermore, in Germany, from October to March, UVB radiation is too low to induce vitamin D synthesis by the skin [58]. Sex differences may be due to unaccounted confounders, such as clothing style, use of sun protection, and to dietary intake. Concerning the inverse association with obesity, it has been suggested that vitamin D is accumulated in adipose tissue, resulting in decreased bioavailability and lower circulating 25OHD levels in the blood of obese persons [59].
The investigation of smoking status yielded inconsistent results. In studies classifying former smoking as a separate category [15,60], former smoking was not found to be a significant predictor of low 25OHD levels. In our data, former smoking was associated with higher 25OHD levels than never smokers. Schwab et al. showed that former smokers, among KORA-Age individuals, were two times more likely to ingest vitamin and mineral-containing supplements compared to never smokers [36]. It is therefore conceivable that smoking cessation went along with improved diet and lifestyle habits that increased vitamin D intake. These unaccounted factors, such as improved intake of foods rich in micronutrients or longer times spent outdoors, may have confounded the observed association. Furthermore, there is always the possibility for a type I error due to multiple comparisons.

Vitamin B12 (No Polypharmacy)

Some drugs reduce absorption or affect the metabolism of vitamin B12 via known mechanisms (such as proton pump inhibitors or histamine receptor 2 antagonists) or unknown mechanisms (such as metformin) [23]. Conversely, we found that polypharmacy was associated with sufficient vitamin B12 levels. Differentiating between the different types of medications ingested was outside the scope of this analysis, but it would be interesting to find out which medication(s) may positively impact on vitamin B12 status.

Folate (Alcohol Consumption)

Contra-intuitively, drinkers of ≥20 g alcohol per day had higher folate levels than abstainers. The consumption of ≥20 g of alcohol is equivalent to ≥0.5 L beer, ≥0.2 L wine or ≥3 small spirits of 2 cL [61], and was more frequent in men (n = 246) than women (n = 61) (Table 1). Differentiating between alcohol levels revealed that the majority of these female (n = 54) and male drinkers (n = 163) used between ≥20 and <40 g/day, which is still considered as moderate drinking for men. A lower proportion of men were high (between ≥40 to <60 g/day, n = 60) to heavy drinkers (>60 g/day, n = 23), respectively. Our variable category thus mostly covered moderate to high drinkers, and only a few heavy drinkers.
In observational epidemiological studies in humans, folate deficiency has been shown to be common in excessive alcohol drinkers and alcoholics [62], suggesting that alcohol consumption may affect folate status preponderantly at higher alcohol doses. Also, light to moderate alcohol consumption is known to be associated with a reduction in all-cause mortality [61]. It is thus possible that the dose at which alcohol was consumed in our study—mostly moderate amounts—was not harmful, but had a positive effect on health in general, thereby possibly affecting folate status. Possible mechanisms involved need further investigation. Nonetheless, caution is warranted as the observed association with alcohol use might be confounded by other factors that influence both traits. Another possible explanation for this counter-intuitive finding is the selection bias associated with the follow-up design of the KORA-Age study, whereby more health-interested individuals involved in former KORA studies, and probably fewer sick individuals with reduced alcohol consumption levels, participated.

Iron (Male Sex, GNRI, Polypharmacy)

Participants with a moderate/major and even low risk for malnutrition (GNRI) were at higher risk for low iron levels. The GNRI is a nutrition-related risk index that can predict the risk for morbidity and mortality in hospitalized older adults, in relation to malnutrition-associated pathologies. Our finding suggests that the GNRI may be a marker for subclinical iron deficiency in older adults. However, as the GNRI has primarily been established for use in hospitalized older adults, it may not necessarily be appropriate among community-dwelling older adults. Further research is warranted in this regard [26].
Men were at higher odds of having low iron levels, despite having higher median iron concentrations than women (Table 2). Sex divergence may be due to the use of a higher cut-off for men, as recommended in the literature [24]. Moreover, serum iron may increase after the ingestion of iron-containing foods [6], suggesting that sex differences may also be due to unequal dietary intakes. Finally, polypharmacy was inversely associated with iron status. Iron status in older adults is known to be affected by a number of medications [6], including antacids and proton pump inhibitors. Knowing which medication type may reduce iron levels is of interest from a prevention point of view and needs further research.

4.3. Strengths and Weaknesses

The KORA-Age study is singular in the sense that it includes a large (>1000 participants) and socio-demographically representative sample of old, and even very old, adults in Germany. Caution is warranted when generalizing findings on a national level, as possible regional differences in eating habits and latitude may exist. The assessment of multiple predictors of subclinical micronutrient deficiency was rendered possible by the extensive health assessment of participants and the quality of the KORA-Age data, which has been collected by trained interviewers and systematically controlled before entry into the KORA-Age database.
The use of biomarkers of micronutrient status is both a strength and a limitation of our study. Nutritional biomarkers may not necessarily reflect the amount of micronutrient intake from foods, and may be affected by multi-morbidity, inflammation and nutrient-drug interactions, especially in older adults. Nevertheless, biomarkers relate to the nutritional status of micronutrients after absorption in the body, and can directly reflect subclinical deficiency at the blood level.
Certain laboratory procedures, used for the assessment of micronutrient status were not the ‘gold standard’, e.g., the immunoassay procedure used in this study versus the commonly used Lactobacillus rhamnosus microbiological assay for measuring serum folate levels [22]. Also, the use of serum iron levels for the evaluation of iron status may be misleading because they are subject to diurnal rhythms and increase after the ingestion of iron-containing foods. However, serum iron concentrations indicate the adequacy of the iron supply to developing red blood cells [6], and may be used as a screening tool for a subclinical deficiency, as opposed to an established clinical deficiency. To identify more advanced cases of iron deficiency or anemia, additional measurements that use functional nutritional biomarkers are essential, including serum/plasma soluble transferrin receptor, serum/plasma ferritin, or blood hemoglobin measurements [22].
Another limitation arises from the cross-sectional design of this analysis, which precludes any direct cause-effect relationships between subclinical micronutrient deficiency and predictors. Also, causality cannot be definitively proven, owing to the possible correlation with other unknown or unmeasured predictors. Yet, a causal effect in one or the other direction is possible and has to be further examined in prospective studies.

5. Conclusions

Using serum nutritional biomarkers, determination of the magnitude of subclinical vitamin D, folate, vitamin B12 and iron deficiencies, among KORA-Age older adults, revealed that more than half of individuals had low 25OHD levels and more than a quarter had low vitamin B12 levels. The prevalence of subclinical deficiencies for both folate and iron (~10%) were less of a concern. Very old age, physical inactivity, frailty and no/irregular use of micronutrient-containing supplements were identified as common predictors of subclinical micronutrient deficiencies in the studied older adults.
Our findings provide further rationale for screening subgroups at high-risk for subclinical micronutrient deficiencies. The possibility that regular and appropriately dosed micronutrient supplementation might help older adults otherwise unable to follow dietary guidelines in satisfying their requirements, and prevent chronic diseases via the correction of low micronutrient levels, is of major interest and could stimulate research on biological pathways that link supplement intake, micronutrient status and disease state.

Supplementary Materials

The following are available online at www.mdpi.com/2072-6643/9/12/1276/s1, Figure S1: Flowchart of the KORA-Age 2008/2009 recruitment and retention profile, Table S1: Description of data collection and categorization methods for the investigated predictors in KORA-Age 2008/2009, Table S2: Unadjusted ORs with 95% CIs for subclinical micronutrient deficiencies by categories of potential predictors: Results from binary logistic regression analyses in KORA-Age 2008/2009, Table S3: Predictors with p < 0.25 in binary logistic regression which were entered into each multiple logistic regression model.

Acknowledgments

The KORA-Age study was conducted with financial support from the German Federal Ministry of Education and Research (BMBF FKZ 01ET0713) as part of the ‘Health in old age’ program. Romy Conzade has received a PhD scholarship from the ‘Studienstiftung des deutschen Volkes’. We thank Heike A. Bischoff-Ferrari, as member of the PhD Thesis Committee of Romy Conzade, for sharing her expertise and for helping in interpreting the results.

Author Contributions

R.C. and B.T. conceived and designed the present study; B.T., W.K., A.P., M.H. and A.S. were involved in data collection and quality control; R.C. analyzed the data and wrote the first draft of the paper; all authors contributed to the critical revision of the paper and approved the final version.

Conflicts of Interest

The authors declare no conflict of interest. The funding sponsors had no role in the design of the study, in the collection, analyses, or interpretation of data, in the writing of the manuscript, and in the decision to publish the results.

Abbreviations

25OHD25-hydroxyvitamin D
BMIBody Mass Index
CIConfidence interval
CVDCardiovascular disease
DEGS1German Health Interview and Examination Survey for Adults
DGEGerman Nutrition Society
eGFREstimated Glomerular Filtration Rate
GNRIGeriatric Nutritional Risk Index
IDOMInstrument for Databased Assessment Of Medication
IQRInterquartile range
KORACooperative Health Research in the Region of Augsburg
MONICAMonitoring of Trends and Determinants in Cardiovascular Disease
NNRNordic Nutrition Recommendations
NVS IISecond German National Nutrition Survey
OROdds ratio
Q1First quartile or 25th percentile
Q3Third quartile or 75th percentile
SCREEN IISeniors in the Community Risk Evaluation for Eating and Nutrition, version II
WHOWorld Health Organization

References

  1. Bailey, R.L.; West, K.P., Jr.; Black, R.E. The epidemiology of global micronutrient deficiencies. Ann. Nutr. Metab. 2015, 66 (Suppl. 2), 22–33. [Google Scholar] [CrossRef] [PubMed]
  2. Wacker, M.; Holick, M.F. Vitamin D—Effects on skeletal and extraskeletal health and the need for supplementation. Nutrients 2013, 5, 111–148. [Google Scholar] [CrossRef] [PubMed]
  3. Trombetti, A.; Reid, K.F.; Hars, M.; Herrmann, F.R.; Pasha, E.; Phillips, E.M.; Fielding, R.A. Age-associated declines in muscle mass, strength, power, and physical performance: Impact on fear of falling and quality of life. Osteoporos. Int. 2016, 27, 463–471. [Google Scholar] [CrossRef] [PubMed]
  4. Visser, M.; Deeg, D.J.; Lips, P. Low vitamin D and high parathyroid hormone levels as determinants of loss of muscle strength and muscle mass (sarcopenia): The Longitudinal Aging Study Amsterdam. J. Clin. Endocrinol. Metab. 2003, 88, 5766–5772. [Google Scholar] [CrossRef] [PubMed]
  5. Porter, K.; Hoey, L.; Hughes, C.F.; Ward, M.; McNulty, H. Causes, Consequences and Public Health Implications of Low B-Vitamin Status in Ageing. Nutrients 2016, 8, 725. [Google Scholar] [CrossRef] [PubMed]
  6. Fairweather-Tait, S.J.; Wawer, A.A.; Gillings, R.; Jennings, A.; Myint, P.K. Iron status in the elderly. Mech. Ageing Dev. 2014, 136–137, 22–28. [Google Scholar] [CrossRef] [PubMed]
  7. Hong, C.H.; Falvey, C.; Harris, T.B.; Simonsick, E.M.; Satterfield, S.; Ferrucci, L.; Metti, A.L.; Patel, K.V.; Yaffe, K. Anemia and risk of dementia in older adults: Findings from the Health ABC study. Neurology 2013, 81, 528–533. [Google Scholar] [CrossRef] [PubMed]
  8. Gallagher, J.C. Vitamin D and Aging. Endocrinol. Metab. Clin. N. Am. 2013, 42, 319–332. [Google Scholar] [CrossRef] [PubMed]
  9. Chernoff, R. Micronutrient requirements in older women. Am. J. Clin. Nutr. 2005, 81, 1240s–1245s. [Google Scholar] [PubMed]
  10. Ter Borg, S.; Verlaan, S.; Hemsworth, J.; Mijnarends, D.M.; Schols, J.M.; Luiking, Y.C.; de Groot, L.C. Micronutrient intakes and potential inadequacies of community-dwelling older adults: A systematic review. Br. J. Nutr. 2015, 113, 1195–1206. [Google Scholar] [CrossRef] [PubMed]
  11. Rubner-Institut, M. Nationale Verzehrsstudie II, Ergebnisbericht Teil 2. Die Bundesweite Befragung zur Ernährung von Jugendlichen und Erwachsenen. 2008. Available online: https://www.mri.bund.de/fileadmin/MRI/Institute/EV/NVSII_Abschlussbericht_Teil_2.pdf (accessed on 14 November 2017).
  12. Rabenberg, M.; Scheidt-Nave, C.; Busch, M.A.; Rieckmann, N.; Hintzpeter, B.; Mensink, G.B. Vitamin D status among adults in Germany—Results from the German Health Interview and Examination Survey for Adults (DEGS1). BMC Public Health 2015, 15, 641. [Google Scholar] [CrossRef] [PubMed]
  13. McNeill, G.; Vyvyan, J.; Peace, H.; McKie, L.; Seymour, G.; Hendry, J.; MacPherson, I. Predictors of micronutrient status in men and women over 75 years old living in the community. Br. J. Nutr. 2002, 88, 555–561. [Google Scholar] [CrossRef] [PubMed]
  14. Hill, T.R.; Granic, A.; Davies, K.; Collerton, J.; Martin-Ruiz, C.; Siervo, M.; Mathers, J.C.; Adamson, A.J.; Francis, R.M.; Pearce, S.H.; et al. Serum 25-hydroxyvitamin D concentration and its determinants in the very old: The Newcastle 85+ Study. Osteoporos. Int. 2016, 27, 1199–1208. [Google Scholar] [CrossRef] [PubMed]
  15. Hirani, V.; Tull, K.; Ali, A.; Mindell, J. Urgent action needed to improve vitamin D status among older people in England! Age Ageing 2010, 39, 62–68. [Google Scholar] [CrossRef] [PubMed]
  16. Van Dam, R.M.; Snijder, M.B.; Dekker, J.M.; Stehouwer, C.D.; Bouter, L.M.; Heine, R.J.; Lips, P. Potentially modifiable determinants of vitamin D status in an older population in the Netherlands: The hoorn study. Am. J. Clin. Nutr. 2007, 85, 755–761. [Google Scholar] [PubMed]
  17. McCarroll, K.; Beirne, A.; Casey, M.; McNulty, H.; Ward, M.; Hoey, L.; Molloy, A.; Laird, E.; Healy, M.; Strain, J.J.; et al. Determinants of 25-hydroxyvitamin D in older Irish adults. Age Ageing 2015, 44, 847–853. [Google Scholar] [CrossRef] [PubMed]
  18. Jungert, A.; Neuhauser-Berthold, M. Sex-specific determinants of serum 25-hydroxyvitamin D3 concentrations in an elderly German cohort: A cross-sectional study. Nutr. Metab. Lond. 2015, 12, 2. [Google Scholar] [CrossRef] [PubMed]
  19. Peters, A.; Doring, A.; Ladwig, K.H.; Meisinger, C.; Linkohr, B.; Autenrieth, C.; Baumeister, S.E.; Behr, J.; Bergner, A.; Bickel, H.; et al. Multimorbidity and successful aging: The population-based KORA-Age study. Z. Gerontol. Geriatr. 2011, 44 (Suppl. 2), 41–54. [Google Scholar] [CrossRef] [PubMed]
  20. German Nutrition Society. New reference values for vitamin D. Ann. Nutr. Metab. 2012, 60, 241–246. [Google Scholar] [CrossRef]
  21. Lamberg-Allardt, C.; Brustad, M.; Meyer, H.E.; Steingrimsdottir, L. Vitamin D—A systematic literature review for the 5th edition of the Nordic Nutrition Recommendations. Food Nutr. Res. 2013, 57. [Google Scholar] [CrossRef] [PubMed] [Green Version]
  22. Sauberlich, H. Laboratory Tests for the Assessment of Nutritional Status, 2nd ed.; CRC Press: Boca Raton, FL, USA, 1999; p. 512. [Google Scholar]
  23. Green, R.; Allen, L.H.; Bjorke-Monsen, A.L.; Brito, A.; Gueant, J.L.; Miller, J.W.; Molloy, A.M.; Nexo, E.; Stabler, S.; Toh, B.H.; et al. Vitamin B12 deficiency. Nat. Rev. Dis. Prim. 2017, 3, 17040. [Google Scholar] [CrossRef] [PubMed]
  24. Kaplan, L.; Pesce, A. Clinical Chemistry: Theory, Analysis, and Correlation, 3rd ed.; Mosby, Inc.: St. Louis, MO, USA, 1996; p. 699. [Google Scholar]
  25. Ahrens, W.; Bellach, B.M.; Jöckel, K.H. Measurement and Quantification of Sociodemographic Characteristics in Epidemiological Studies. German Society for Medical Informatics, Biometry and Epidemiology (GMDS), 1998. Available online: https://dgepi.de/fileadmin/pdf/leitlinien/11_MessungUndQuantifizierungSoziodemographischerMerkmale_pdf2.pdf (accessed on 14 November 2017).
  26. Bouillanne, O.; Morineau, G.; Dupont, C.; Coulombel, I.; Vincent, J.P.; Nicolis, I.; Benazeth, S.; Cynober, L.; Aussel, C. Geriatric nutritional risk index: A new index for evaluating at-risk elderly medical patients. Am. J. Clin. Nutr. 2005, 82, 777–783. [Google Scholar] [PubMed]
  27. Keller, H.H.; Goy, R.; Kane, S.L. Validity and reliability of SCREEN II (Seniors in the community: Risk evaluation for eating and nutrition, Version II). Eur. J. Clin. Nutr. 2005, 59, 1149–1157. [Google Scholar] [CrossRef] [PubMed]
  28. Meisinger, C.; Lowel, H.; Thorand, B.; Doring, A. Leisure time physical activity and the risk of type 2 diabetes in men and women from the general population. The MONICA/KORA Augsburg Cohort Study. Diabetologia 2005, 48, 27–34. [Google Scholar] [CrossRef] [PubMed]
  29. Doring, A.; Filipiak, B.; Stieber, J.; Keil, U. Trends in alcohol intake in a southern German population from 1984–1985 to 1989–1990: Results of the MONICA project augsburg. J. Stud. Alcohol 1993, 54, 745–749. [Google Scholar] [CrossRef] [PubMed]
  30. Kirchberger, I.; Meisinger, C.; Heier, M.; Zimmermann, A.K.; Thorand, B.; Autenrieth, C.S.; Peters, A.; Ladwig, K.H.; Doring, A. Patterns of multimorbidity in the aged population. Results from the KORA-Age study. PLoS ONE 2012, 7, e30556. [Google Scholar] [CrossRef] [PubMed]
  31. Strobl, R.; Muller, M.; Emeny, R.; Peters, A.; Grill, E. Distribution and determinants of functioning and disability in aged adults–results from the German KORA-Age study. BMC Public Health 2013, 13, 137. [Google Scholar] [CrossRef] [PubMed]
  32. Fried, L.P.; Tangen, C.M.; Walston, J.; Newman, A.B.; Hirsch, C.; Gottdiener, J.; Seeman, T.; Tracy, R.; Kop, W.J.; Burke, G.; et al. Frailty in older adults: Evidence for a phenotype. J. Gerontol. A Biol. Sci. Med. Sci. 2001, 56, M146–M156. [Google Scholar] [CrossRef] [PubMed]
  33. Pabst, G.; Zimmermann, A.K.; Huth, C.; Koenig, W.; Ludwig, T.; Zierer, A.; Peters, A.; Thorand, B. Association of low 25-hydroxyvitamin D levels with the frailty syndrome in an aged population: Results from the KORA-age Augsburg study. J. Nutr. Health Aging 2015, 19, 258–264. [Google Scholar] [CrossRef] [PubMed]
  34. Inker, L.A.; Schmid, C.H.; Tighiouart, H.; Eckfeldt, J.H.; Feldman, H.I.; Greene, T.; Kusek, J.W.; Manzi, J.; Van Lente, F.; Zhang, Y.L.; et al. Estimating glomerular filtration rate from serum creatinine and cystatin C. N. Engl. J. Med. 2012, 367, 20–29. [Google Scholar] [CrossRef] [PubMed]
  35. Mühlberger, N.; Behrend, C.; Stark, R.; Holle, R. Database-supported identification and entry of drug data in health studies–experience with the IDOM software. Inform. Biom. Epidemiol. Med. Biol. 2003, 34, 601–611. [Google Scholar]
  36. Schwab, S.; Heier, M.; Schneider, A.; Fischer, B.; Huth, C.; Peters, A.; Thorand, B. The use of dietary supplements among older persons in southern Germany–results from the KORA-age study. J. Nutr. Health Aging 2014, 18, 510–519. [Google Scholar] [CrossRef] [PubMed]
  37. Mithal, A.; Wahl, D.A.; Bonjour, J.P.; Burckhardt, P.; Dawson-Hughes, B.; Eisman, J.A.; El-Hajj Fuleihan, G.; Josse, R.G.; Lips, P.; Morales-Torres, J. Global vitamin D status and determinants of hypovitaminosis D. Osteoporos. Int. 2009, 20, 1807–1820. [Google Scholar] [CrossRef] [PubMed]
  38. Austrian Nutrition Report. Österreichischer Ernährungsbericht 2012. Bundesministerium für Gesundheit, Wien. 2012. Available online: https://www.bmgf.gv.at/cms/home/attachments/4/5/3/CH1048/CMS1348749794860/oeb12.pdf (accessed on 14 November 2017).
  39. Unité de Surveillance et D’Epidémiologie Nutritionnelle (Usen). Étude Nationale Nutrition Santé (ENNS, 2006)–Situation Nutritionnelle en France en 2006 Selon les Indicateurs D’Objectif et les Repères du Programme National Nutrition Santé (PNNS). Institut de Veille Sanitaire, Université de Paris 13, Conservatoire National des Arts et Métiers. 2007. Available online: http://opac.invs.sante.fr/doc_num.php?explnum_id=3481 (accessed on 14 November 2017).
  40. Bailey, R.L.; Carmel, R.; Green, R.; Pfeiffer, C.M.; Cogswell, M.E.; Osterloh, J.D.; Sempos, C.T.; Yetley, E.A. Monitoring of vitamin B-12 nutritional status in the United States by using plasma methylmalonic acid and serum vitamin B-12. Am. J. Clin. Nutr. 2011, 94, 552–561. [Google Scholar] [CrossRef] [PubMed]
  41. Carmel, R.; Sarrai, M. Diagnosis and management of clinical and subclinical cobalamin deficiency: Advances and controversies. Curr. Hematol. Rep. 2006, 5, 23–33. [Google Scholar] [PubMed]
  42. Johnson, M.A.; Hausman, D.B.; Davey, A.; Poon, L.W.; Allen, R.H.; Stabler, S.P. Vitamin B12 deficiency in African American and white octogenarians and centenarians in Georgia. J. Nutr. Health Aging 2010, 14, 339–345. [Google Scholar] [CrossRef] [PubMed]
  43. Pfeiffer, C.M.; Sternberg, M.R.; Hamner, H.C.; Crider, K.S.; Lacher, D.A.; Rogers, L.M.; Bailey, R.L.; Yetley, E.A. Applying inappropriate cutoffs leads to misinterpretation of folate status in the US population. Am. J. Clin. Nutr. 2016, 104, 1607–1615. [Google Scholar] [CrossRef] [PubMed]
  44. Steluti, J.; Selhub, J.; Paul, L.; Reginaldo, C.; Fisberg, R.M.; Marchioni, D.M.L. An overview of folate status in a population-based study from Sao Paulo, Brazil and the potential impact of 10 years of national folic acid fortification policy. Eur. J. Clin. Nutr. 2017, 71. [Google Scholar] [CrossRef] [PubMed]
  45. Corona, L.P.; Duarte, Y.A.; Lebrao, M.L. Prevalence of anemia and associated factors in older adults: Evidence from the SABE Study. Rev. Saude Publica 2014, 48, 723–731. [Google Scholar] [CrossRef] [PubMed]
  46. Hinds, H.E.; Johnson, A.A.; Webb, M.C.; Graham, A.P. Iron, folate, and vitamin B12 status in the elderly by gender and ethnicity. J. Natl. Med. Assoc. 2011, 103, 870–877. [Google Scholar] [CrossRef]
  47. Milman, N.; Pedersen, A.N.; Ovesen, L.; Schroll, M. Iron status in 358 apparently healthy 80-year-old Danish men and women: Relation to food composition and dietary and supplemental iron intake. Ann. Hematol. 2004, 83, 423–429. [Google Scholar] [CrossRef] [PubMed]
  48. Allen, L.H. How common is vitamin B-12 deficiency? Am. J. Clin. Nutr. 2009, 89, 693s–696s. [Google Scholar] [CrossRef] [PubMed]
  49. Wolters, M.; Strohle, A.; Hahn, A. Age-associated changes in the metabolism of vitamin B(12) and folic acid: Prevalence, aetiopathogenesis and pathophysiological consequences. Z. Gerontol. Geriatr. 2004, 37, 109–135. [Google Scholar] [CrossRef] [PubMed]
  50. Brock, K.; Cant, R.; Clemson, L.; Mason, R.S.; Fraser, D.R. Effects of diet and exercise on plasma vitamin D (25(OH)D) levels in Vietnamese immigrant elderly in Sydney, Australia. J. Steroid Biochem. Mol. Biol. 2007, 103, 786–792. [Google Scholar] [CrossRef] [PubMed]
  51. Vogt, S.; Decke, S.; de Las Heras Gala, T.; Linkohr, B.; Koenig, W.; Ladwig, K.H.; Peters, A.; Thorand, B. Prospective association of vitamin D with frailty status and all-cause mortality in older adults: Results from the KORA-Age Study. Prev. Med. 2015, 73, 40–46. [Google Scholar] [CrossRef] [PubMed]
  52. Pires Corona, L.; Drumond Andrade, F.C.; de Oliveira Duarte, Y.A.; Lebrao, M.L. The Relationship between Anemia, Hemoglobin Concentration and Frailty in Brazilian Older Adults. J. Nutr. Health Aging 2015, 19, 935–940. [Google Scholar] [CrossRef] [PubMed]
  53. Yannakoulia, M.; Ntanasi, E.; Anastasiou, C.A.; Scarmeas, N. Frailty and nutrition: From epidemiological and clinical evidence to potential mechanisms. Metabolism 2017, 68, 64–76. [Google Scholar] [CrossRef] [PubMed]
  54. Fabian, E.; Bogner, M.; Kickinger, A.; Wagner, K.H.; Elmadfa, I. Vitamin status in elderly people in relation to the use of nutritional supplements. J. Nutr. Health Aging 2012, 16, 206–212. [Google Scholar] [CrossRef] [PubMed]
  55. Bor, M.V.; Lydeking-Olsen, E.; Moller, J.; Nexo, E. A daily intake of approximately 6 microg vitamin B-12 appears to saturate all the vitamin B-12-related variables in Danish postmenopausal women. Am. J. Clin. Nutr. 2006, 83, 52–58. [Google Scholar] [PubMed]
  56. Whiting, S.J.; Bonjour, J.P.; Payen, F.D.; Rousseau, B. Moderate amounts of vitamin D3 in supplements are effective in raising serum 25-hydroxyvitamin D from low baseline levels in adults: A systematic review. Nutrients 2015, 7, 2311–2323. [Google Scholar] [CrossRef] [PubMed]
  57. Eussen, S.J.; de Groot, L.C.; Clarke, R.; Schneede, J.; Ueland, P.M.; Hoefnagels, W.H.; van Staveren, W.A. Oral cyanocobalamin supplementation in older people with vitamin B12 deficiency: A dose-finding trial. Arch. Intern. Med. 2005, 165, 1167–1172. [Google Scholar] [CrossRef] [PubMed]
  58. O’Neill, C.M.; Kazantzidis, A.; Ryan, M.J.; Barber, N.; Sempos, C.T.; Durazo-Arvizu, R.A.; Jorde, R.; Grimnes, G.; Eiriksdottir, G.; Gudnason, V.; et al. Seasonal Changes in Vitamin D-Effective UVB Availability in Europe and Associations with Population Serum 25-Hydroxyvitamin D. Nutrients 2016, 8, 533. [Google Scholar] [CrossRef] [PubMed]
  59. Wortsman, J.; Matsuoka, L.Y.; Chen, T.C.; Lu, Z.; Holick, M.F. Decreased bioavailability of vitamin D in obesity. Am. J. Clin. Nutr. 2000, 72, 690–693. [Google Scholar] [PubMed]
  60. Shirazi, L.; Almquist, M.; Malm, J.; Wirfalt, E.; Manjer, J. Determinants of serum levels of vitamin D: A study of life-style, menopausal status, dietary intake, serum calcium, and PTH. BMC Womens Health 2013, 13, 33. [Google Scholar] [CrossRef] [PubMed]
  61. Keil, U.; Chambless, L.E.; Doring, A.; Filipiak, B.; Stieber, J. The relation of alcohol intake to coronary heart disease and all-cause mortality in a beer-drinking population. Epidemiology 1997, 8, 150–156. [Google Scholar] [CrossRef] [PubMed]
  62. Halsted, C.H.; Villanueva, J.A.; Devlin, A.M.; Chandler, C.J. Metabolic interactions of alcohol and folate. J. Nutr. 2002, 132, 2367s–2372s. [Google Scholar] [PubMed]
Figure 1. Prevalence of subclinical micronutrient deficiencies by age groups, based on serum biomarkers in KORA-Age 2008/2009 (25OHD = 25-hydroxyvitamin D; CI = confidence interval).
Nutrients 09 01276 g001
Table 1. Baseline characteristics of older adults in KORA-Age 2008/2009, stratified by sex.
Baseline CharacteristicsAll (n = 1079)Men (n = 537)Women (n = 542)
n%n%n%
Season of blood collection
Months of blood collection a
February–May44042.324246.219838.4
June–August36034.61733318736.2
September–November24023.110920.813125.4
Socio-demographic factors
Age groups (years)
65–7445742.423343.422441.3
75–844864524345.324344.8
85–9313612.66111.47513.8
Family status b
Living with a partner66362.142479.323944.9
Living alone, divorced or widowed40437.911120.829355.1
Educational level (years)
Medium to high (10 to 17)85479.249091.336467.2
Low (8 to 9)22520.9478.817832.8
Lifestyle factors
Nutritional status
Geriatric Nutritional Risk Index (GNRI) c
 No risk (>98)96092.348292.347892.3
 Low risk (92 to 98)595.7295.6305.8
 Moderate or major risk (<92)212112.1101.9
Nutrition Score (SCREEN II) d
 Low risk (41 to 48)40838.323944.816931.7
 Medium risk (36 to <41)37735.41813419636.8
 High risk (<36)28126.411321.216831.5
Physical activity e
Very active or moderately active56452.330456.626048.1
Less active or inactive51447.723343.428151.9
Alcohol consumption (g/day) f
039336.612623.526749.7
>0 to <2037334.816430.620938.9
≥2030728.624645.96111.4
Smoking status
Never smoker61757.22043841376.2
Former smoker41338.330356.411020.3
Current smoker494.5305.6193.5
Health factors
Body mass index (BMI) (kg/m2)
Normal (18.5 to <25)22821.19918.412923.8
Overweight (25 to <30)52548.728152.324445
Obese (≥30)32630.215729.216931.2
Frailty g
Non-frail57257.529057.428257.6
Pre-frail37737.919438.418337.4
Frail464.6214.2255.1
Polypharmacy (≥5 medications)
No7126635666.335665.7
Yes3673418133.718634.3
eGFR (mL/min/1.73 m2)
Normal (≥60)70965.736668.234363.3
Low (<60)37034.317131.819936.7
Multi-morbidity h
No disease918.55610.5356.6
One disease26324.713825.912523.4
Two or more diseases71266.833863.537470
Use of supplements
Vitamin D
 Regular intake14013366.710419.2
 No/irregular intake9398750193.343880.8
Folic acid
 Regular intake11610.8519.56512
 No/irregular intake96389.348690.547788
Vitamin B12
 Regular intake11410.6488.96612.2
 No/irregular intake96589.448991.147687.8
Iron
 Regular intake363.3152.8213.9
 No/irregular intake104396.752297.252196.1
SCREEN II: Seniors in the Community Risk Evaluation for Eating and Nutrition, version II; eGFR: estimated glomerular filtration rate; number of missing values: a 39, b 12, c 39, d 13, e 1, f 6, g 84, h 13.
Table 2. Biomarker concentrations and prevalence of subclinical micronutrient deficiencies by sex in KORA-Age 2008/2009.
Nutritional Biomarkers Biomarker Concentrations (Percentile Scale)Prevalence of Subclinical Deficiency
nMin1st10thQ1MedianQ390th99thMax%% (Standardized *)95% CI
All
25OHD [nmol/L]10403.77.721.331.448.369.693.1136.3174.752.552.049.0–55.0
Folate [nmol/L]10435.89.014.018.224.533.345.345.390.68.78.77.0–10.4
Vitamin B12 [pmol/L]1044661041732142773765231476147627.527.324.6–30.0
Iron [μmol/L]10503.45.210.013.116.120.022.832.940.511.111.09.1–12.9
Men
25OHD [nmol/L]5243.73.722.536.251.875.096.8145.0174.746.444.440.2–48.6
Folate [nmol/L]5245.810.214.417.923.831.345.345.363.98.28.05.7–10.3
Vitamin B12 [pmol/L]525681041702102633554941441147629.328.524.6–32.4
Iron [μmol/L]5273.45.710.713.616.819.924.233.740.514.213.510.6–16.4
Women
25OHD [nmol/L]5163.78.720.627.745.365.986.4119.8156.358.759.054.8–63.2
Folate [nmol/L]5197.38.913.818.425.235.445.345.390.69.29.46.9–12.0
Vitamin B12 [pmol/L]519661081752182923925421476147625.626.022.3–29.3
Iron [μmol/L]5233.65.09.312.415.618.822.028.638.08.08.46.0–10.8
25OHD = 25-hydroxyvitamin D; Q1: first quartile or 25th percentile; Q3: third quartile or 75th percentile; CI: confidence interval; * Ten-year-age-group and sex-standardized prevalence using the Bavarian population per 31/12/2015; cut-offs for subclinical micronutrient deficiency: <50 nmol/L (25OHD); <13.6 nmol/L (folate); <221 pmol/L (vitamin B12); men: <11.6 µmol/L, women: <9.0 µmol/L (iron).
Table 3. Fully adjusted ORs with 95% CIs for subclinical micronutrient deficiencies by categories of identified predictors: Final results from multiple logistic regression analyses in KORA-Age 2008/2009.
PredictorPredictor CategoriesLow 25OHD (n = 525)Low Folate (n = 86)Low Vitamin B12 (n = 283)Low Iron (n = 106)
OR95% CIpOR95% CIpOR95% CIpOR95% CIp
Season of blood collection
Months of blood collectionFebruary–May vs. June–August2.11.5–2.8<0.001.........
Months of blood collectionSeptember–November vs. June–August0.80.5–1.10.135.........
Socio-demographic factors
SexWomen vs. men1.91.4–2.5<0.0010.80.5–1.40.4590.80.6–1.10.2310.40.3–0.7<0.001
Age groups (years)75–84 vs. 65–741.31.0–1.80.0580.90.6–1.60.8181.30.9–1.80.1101.00.6–1.70.911
Age groups (years)85–93 vs. 65–742.21.3–3.80.0032.31.2–4.30.0112.01.2–3.20.0041.20.6–2.30.564
Lifestyle factors
Nutritional statusGNRI: Low (92 to 98) vs. no risk (>98)---------2.71.3–5.40.005
Nutritional statusGNRI: Moderate/major (<92) vs. no risk (>98)---------4.01.2–12.00.015
Physical activityLess active or inactive vs. very active or moderately active1.61.2–2.20.0012.01.2–3.40.0061.41.0–1.80.042---
Alcohol consumption (g/day)>0 to <20 vs. 0---1.00.6–1.60.876------
Alcohol consumption (g/day)≥20 vs. 0---0.40.2–0.80.017------
Smoking statusCurrent smoker vs. never smoker0.80.4–1.50.516---------
Smoking statusFormer smoker vs. never smoker0.60.4–0.80.002---------
Health factors
BMI (kg/m2)Overweight (25 to <30) vs. normal (18.5 to <25)0.90.7–1.40.763---------
BMI (kg/m2)Obese (≥30) vs. normal (18.5 to <25)1.81.2–2.60.005---------
FrailtyMissing value vs. non-frail1.10.6–2.20.736------3.41.3–8.00.008
FrailtyPre-frail vs. non-frail1.81.3–2.5<0.001------2.71.7–4.5<0.001
FrailtyFrail vs. non-frail2.51.2–5.40.022------4.21.6–10.20.002
PolypharmacyYes vs. no------0.50.4–0.7<0.0011.61.0–2.40.045
Use of supplementsVitamin D: No/irregular intake vs. regular intake4.83.1–7.6<0.001.........
Use of supplementsFolic acid: No/irregular intake vs. regular intake...3.91.4–16.10.024......
Use of supplementsVitamin B12: No/irregular intake vs. regular intake......4.72.5–10.2<0.001...
25OHD = 25-hydroxyvitamin D; GNRI: Geriatric Nutritional Risk Index; BMI: body mass index; OR: odds ratio; CI: confidence interval; p: p-value; -: variable not significant at p < 0.05; .: not investigated (see Methods); cut-offs for subclinical micronutrient deficiency: <50 nmol/L (25OHD); <13.6 nmol/L (folate); <221 pmol/L (vitamin B12); men: <11.6 µmol/L, women: <9.0 µmol/L (iron).

