Adult Nutrient Intakes from Current National Dietary Surveys of European Populations


1
Nutritional Epidemiology Group (NEG), School of Food Science and Nutrition, University of Leeds, Leeds LS2 9JT, UK
2
Division of Noncommunicable Diseases and Promoting Health through the Life-Course, World Health Organization Regional Office for Europe, UN City, Marmorvej 51, DK-2100 Copenhagen, Denmark
*
Author to whom correspondence should be addressed.
Nutrients 2017, 9(12), 1288; https://doi.org/10.3390/nu9121288
Submission received: 13 October 2017
/
Revised: 16 November 2017
/
Accepted: 22 November 2017
/
Published: 27 November 2017
Abstract
:The World Health Organization (WHO) encourages countries to undertake national dietary survey (NDS) but implementation and reporting is inconsistent. This paper provides an up-to-date review of adult macro and micronutrient intakes in European populations as reported by NDS. It uses WHO Recommended Nutrient Intakes (RNIs) to assess intake adequacy and highlight areas of concern. NDS information was gathered primarily by internet searches and contacting survey authors and nutrition experts. Survey characteristics and adult intakes by gender/age group were extracted for selected nutrients and weighted means calculated by region. Of the 53 WHO Europe countries, over a third (n = 19), mainly Central & Eastern European countries (CEEC), had no identifiable NDS. Energy and nutrient intakes were extracted for 21 (40%) countries but differences in age group, methodology, under-reporting and nutrient composition databases hindered inter-country comparisons. No country met more than 39% WHO RNIs in all age/gender groups; macronutrient RNI achievement was poorer than micronutrient. Overall RNI attainment was slightly worse in CEEC and lower in women and female elderly. Only 40% countries provided adult energy and nutrient intakes. The main gaps lie in CEEC, where unknown nutrient deficiencies may occur. WHO RNI attainment was universally poor for macronutrients, especially for women, the female elderly and CEEC. All countries could be encouraged to report a uniform nutrient set and sub-analyses of nationally representative nutrient intakes.
1. Introduction
The burden of malnutrition in the form of overweight and obesity, nutrient deficiency and preventable diet-related non-communicable diseases (NCDs) is significant and worsening [1]. An unhealthy diet is one of the four major behavioral risk factors for NCDs in all WHO regions [2], with the European region proportionately suffering the greatest burden. Here, the four most common NCDs account for 77% of disease and almost 86% premature mortality [1]. The World Health Organization (WHO) European Food and Nutrition Action Plan aims to ‘significantly reduce’ the human, economic and social costs of all forms of malnutrition in the WHO European region [1].
National diet surveys (NDS) have an important role to play in assessing dietary patterns and intakes in populations and informing policy decisions; the WHO European Food & Nutrition Action Plan [1] explicitly encourages member states to ‘strengthen and expand nationally representative diet and nutrition surveys.’ Nutrition and health surveys formed the main source of information for dietary risk factors and physical inactivity in a systematic analysis of disease risk in 21 regions worldwide between 1990–2010 [3]. NDS can help monitor NCDs and malnutrition, identify specific areas of concern, highlight inequalities, guide interventions and evaluate policy impact, thereby ultimately contributing to the promotion of best practice across the region [1]. Imamura et al. [4] evaluated change in global diet patterns over time through either greater consumption of healthy or lesser consumption of unhealthy items and assessed heterogeneity by age, gender, national income and dietary pattern. Higher national income was associated with better diet quality via greater consumption of healthier items but also with higher intake of unhealthy items, demonstrating that socio-economic inequalities persist.
NDS provision across Europe is inconsistent. A recent review found that less than two thirds of countries in WHO Europe have nationally representative NDS and that the majority of gaps lie in Central & Eastern European countries (CEEC) [5]. This is concerning, as nutrition policies in these countries may therefore lack an appropriate evidence base. Novakovic et al. [6] examined selected micronutrient intakes in CEEC compared to other European countries and found that CEEC lacked intake data across all ages. Only 40% of countries in the WHO Europe remit reported adult energy and nutrient intakes from NDS conducted post-2000 and in these, macronutrients were more widely reported than micronutrients [5]. The Global Dietary Database (GDD) houses information on food and nutrient intakes in countries across the world but only includes broad food categories with limited nutrient data and is limited by the inclusion of some regional rather than national data [7].
A comprehensive, updated review of total nutrient intakes across different European populations and subgroups is therefore needed, the results of which could identify where in Europe there is a need to improve diets and whether inequalities exist. This review aims to examine macro and selected micronutrient adult intakes in countries across WHO Europe via the latest NDS for which nutrient intake data is available.
2. Materials and Methods
2.1. Identifying National Diet Surveys (NDS)
The methods for identifying and accessing NDS have been reported [5]. Briefly, authors of national surveys within WHO Europe were identified using listed contact names and other information from two main reports of NDS [8,9]. Where no response was obtained from authors, further general internet searches were performed on organizations specializing in nutrition to find other potentially useful contact details. Additionally, country responses to WHO questionnaires were mined to obtain relevant references to NDS. Contacts identified were asked to complete a questionnaire to provide information on nationally representative dietary surveys conducted at an individual level since 1990, including links or references to relevant reports. For countries without usable contact details, a systematic database search was performed across Web of Science, Medline and Scopus for nationally representative dietary surveys of adults and children that collected data at an individual level from 1990 to June 2016.
Papers returned were screened for relevance according to the criteria in Table 1. We found 109 nationally representative surveys that collected data on whole diets at an individual level since 1990 across 34 of the 53 countries in the WHO office region; 86 of these included adults. Of these, 78 were conducted since 2000, 60 of which included adults. Further details of all the surveys found are presented in Rippin et al. (in submission) [5].
2.2. Data Extracted
Where available, estimated energy and nutrient intake (excluding supplements) by age group and gender was extracted and graphically presented from the latest NDS collected after 2000; for adults, this included surveys from 21 countries. These countries were grouped into regions—Western, Northern and Central & Eastern Europe. For some countries, more recent surveys have been conducted but intake data was not yet available. For example, the Spanish ANIBES survey (2013) did not include micronutrients, so the ENIDE (2011) survey was used instead. Mean intake values were reported by the majority of the 21 countries but where medians were the sole measure of central tendency, these were extracted and used instead. Where energy intakes were given in kcal, these were converted to MJ for consistency across studies.
All macronutrients reported by the 21 countries were included in the data extraction but micronutrients extracted (see Table 2) were limited to those explicitly mentioned in the WHO European Food and Nutrition Action Plan [1] as being currently important to population health in the region. Where possible, WHO nutrient-based guidelines—hereby referred to as Recommended Nutrient Intakes (RNIs)—were used to assess intake adequacy and to highlight areas of concern [10,11,12,13,14], although WHO RNIs for iron are given for different bioavailabilities, so UK Reference Nutrient Intakes (RNIs) were used instead [15]. The RNI for monounsaturated fats (MUFAs) is calculated by the difference between total fat and the sum of saturates (SFA), polyunsaturated fats (PUFA) and trans fats (TFAs), so has not been included. The WHO RNI for free sugars [14] has been adopted as the RNI for added sugars, as no WHO RNI exists for added sugars, yet all surveys that reported sugar in this way used the added rather than free sugar definition. The definition for added sugars is similar but more restrictive to that of free sugars, meaning that free sugar intake would not be overestimated. Depending on the nutrient, the RNIs were variously maximum, minimum or target amounts.
To harmonize data where possible, units of measurement were converted to a common standard unit. Energy intakes and selected nutrients by age group and gender as reported in these latest surveys collected after 2000 were graphed. Omega-3 and omega-6 fatty acids were reported in surveys in various ways, including omega-3, omega-6, linoleic acid and α-linolenic acid in g/day and percentage energy (%E) and eicosapentaenoic acid + docosahexaenoic acid (EPA + DHA) in mg/day. These were converted to grams and %E and grouped into omega-3 and omega-6 fatty acids for clarity. Additionally, mean intakes by age group and gender were weighted by number of individuals surveyed in each group to produce weighted means by country. Regional and overall European weighted means were calculated by multiplying the male/female mean for each country by the latest total national population numbers from 2016 [16], adding this figure for each country and dividing by the total sum of the national populations in each region.
Characteristics of the surveys from the 21 countries were also extracted and reported: these were country name, survey name, year of survey (data collection), dietary methodology, age range and sample size. The percentage WHO RNIs not met by all gender/age groups was recorded. Where reported, surveys presenting nutrient intakes by socio-economic group (SEG) based on social class, income (continuous or grouped) and education level were also noted.
3. Results
3.1. Data Extracted
Results of NDS coverage across Europe have previously been documented [5]. Adult energy and nutrient intakes (excluding supplements) were extracted from 21 surveys across 21 countries from three regions: five (100%) of Northern European countries (Denmark, Finland, Iceland, Norway, Sweden); 11 (65%) of Western European countries (Andorra, Austria, Belgium, France, Germany, Ireland, Italy, The Netherlands, Portugal, Spain, UK) and five (16%) of CEEC (Estonia, Hungary, Latvia, Lithuania, Turkey). Table 3 shows the characteristics of these surveys. Adult energy and nutrient intakes could not be extracted for 60% (32) of European countries; 19 of these, mainly CEEC, had no identifiable nationally representative survey, making up over a third of WHO Europe countries.
All 21 surveys that reported nutrient information included energy and also carbohydrate, fiber, fat and protein intakes (see Table 4). Most surveys (n = 20) included intake data on saturates, MUFAs and PUFAs (Germany did not); however, less than half (n = 9) surveys included TFA intakes. The majority of surveys (n = 17) included intake levels of sugars, either as total sugars or as added sugars/sucrose; however, Germany, Latvia, Spain and Turkey included neither. Few surveys (n = 5) included starch intake data. Half the countries included either omega-3 (n = 10) or omega-6 (n = 9) fatty acid intakes in some form; eight surveys included both.
All surveys included some micronutrients of interest (see Table 5). Vitamin B12, vitamin D, calcium and iron intakes were reported by all surveys; potassium (not Belgium), folate and sodium (not Italy) were each reported by all but one survey and zinc by all but two (not Belgium and Norway). Iodine was the least reported micronutrient extracted (n = 14), though it was still reported by more than half the surveys. Considering all macro and micronutrients investigated, no country met more than 39% WHO RNIs in all age/gender groups.
Of the 21 countries for which nutrient intakes were extracted, seven reported intakes by SEG in addition to age and gender (Estonia, Finland, France, Ireland, The Netherlands, Norway, UK). Whilst this comprises a third of countries listed in Table 3, only 13% of the 53 countries in the WHO remit represented nutrient intakes by SEG.
3.2. Energy and Nutrient Intakes
3.2.1. Energy
Energy intakes reported from the NDS have previously been documented [5]. Briefly, daily mean/median energy intakes were higher in adult males and decreased with age for all age groups in all 21 countries; however, age groupings reported were not consistent across countries (see Figure 1, Figure 2 and Figure 3).
3.2.2. Macronutrients
For all macronutrients, with the exception of sugars and fibre in older age groups, males tended to have a higher intake than females in all countries across all age groups. In this section means reported are estimated weighted European means (see Table 4 and Table 5 for total weighted means by nutrient and broken down by country) and those in brackets are the ranges of gender and age group means provided in the country reports.
Attainment of the WHO macronutrient RNIs [10] was generally poor across all regions and marginally worse in CEEC. All age groups in all countries were comfortably over the lower 10%E protein RNI in men and women. Just over half of countries met or exceeded the upper RNI of 15%E, though there was no regional pattern. No country met the lower carbohydrate RNI of 55%E in any age group (Figure 4). The mean carbohydrate intake was 209 g, (range 156–265 g) for women and 264 g (range 173–342 g) for men. Most countries fell short of the fibre RNI in all ages; only Norway (all ages), Germany (women aged 51–64 and men across the lifespan) and Hungary (non-elderly men) met the 25 g target (Figure 5). Mean fibre intakes were 19 g (range 13–26 g) for women and 21 g (range 15–29 g) in men. All countries that reported added sugars (n = 7) were over the 5% recommended RNI, although only Estonian and Finnish women were above the 10% maximum (Figure 6). Mean added sugar intakes were 41 g (range 30–49 g) for women and 48 g (38–69 g) in men.
All countries exceeded the WHO upper fat limit of 30%E except Portuguese elderly men (Figure 7). The mean total fat intake was 73 g (51–95 g) in women and 94 g (61–127 g) in men. The majority of countries were also above the 10%E RNI for saturates; only Portuguese elderly men were below (Figure 8). The mean saturates intake was 25 g (16–33 g) for women and 32 g (20–45 g) for men. Only Lithuanian men exceeded the upper PUFA RNI of 10%E and just under half the countries were below the lower RNI of 6%E, leaving around half of countries with optimum intakes between the two RNIs; there was no regional pattern. The greatest WHO RNI compliance was in TFAs, where only Icelandic elderly men exceeded the <1%E limit with intakes at 1%E. However, only nine countries reported TFAs; the CEEC region had fewest countries reporting intakes.
Omega fats RNI attainment was mixed; 60% of countries that reported n-3 intakes were between the 1%–2%E RNI bands, mostly in Northern Europe, whilst 4 countries did not meet the lower RNI. Turkey and Hungary exceeded the upper n-6 limit of 8%E but fewer countries achieved intakes within the lower and upper RNI bands in the majority of age/gender groups than for n-3. There was no age or gender pattern but Northern European countries had higher n-3 and lower n-6 intakes.
3.2.3. Micronutrients
Micronutrient RNI [11,12,13] attainment was slightly better than macronutrient, though the variation in male/female intake patterns was higher and there were no clear age patterns.
All countries comfortably met the 4.9 mg female and 7 mg male RNI for zinc. The majority of countries met the 2.4 μg RNI for vitamin B12; only Lithuanian and Turkish older and elderly women and elderly men fell short. Fulfilment of iron, iodine and potassium RNIs was mixed and women generally had poorer attainment—particularly younger women (Figure 9, Figure 10 and Figure 11 respectively). For iron, only younger Irish women met the 14.8 mg UK RNI [15] for women aged 19–50, though all countries met the 8.7 mg RNI for women aged 51–65 y and 65+ y except elderly Turkish women. All countries met the 8.7 mg male RNI for iron. Mean intakes were 10.9 mg (8.1–15.1 mg) in women and 13.4 mg (9.9–18.1 mg) in men.
Just under half of countries that reported iodine met the 150 μg RNI; more men and younger age groups exceeded the RNI but there were no regional patterns. The mean iodine intake was 127 μg (28–227 μg) in women and 156 μg (33–268 μg) in men. No countries met the 3510 mg RNI for potassium in women; half of countries met the RNI in at least some male age groups, though there was no regional pattern between countries. Mean intakes were 2771 mg (1855–3500 mg) in women and 3245 mg (2192–4300 mg) in men.
Few countries and no women of any nationality met the 400 μg RNI for folic acid; only young and elderly Irish men and middle-aged Lithuanian and Turkish men had adequate intakes (Figure 12). The mean folic acid intake was 268 μg (129–399 μg) in women and 318 μg (142–643 μg) in men. The majority of countries over-consumed sodium; all male age groups exceeded the 3000 mg RNI and in women only the UK and younger Estonian and Latvian women did not (Figure 13). Mean sodium intakes were 2341 mg (1426–5200 mg) in women and 3163 mg (1811–7400 mg) in men.
Assessing RNI attainment in vitamin D and calcium (Figure 14 and Figure 15) is made more difficult by different ages having different RNIs—where age groupings span RNI categories it cannot be specified whether or not the RNI is met. Where this could be assessed, few countries met the RNI for the age range in question, particularly in women and the elderly, where no countries met the RNI. Mean vitamin D intakes were 2.7 μg (0.5–9.1 μg) in women and 3.3 μg (0.6–13.4 μg) in men. Mean calcium intakes were 799 mg (457–1206 mg) for women and 908 mg (555–1424 mg) in men.
4. Discussion
4.1. Data Extracted
This review details the provision of energy and nutrient intake data in nationally representative surveys across the 53 countries of the WHO Europe region for nutrients of particular concern to the WHO European Region [1]. Only 40% (n = 21) of countries provided intake data by gender and age group for adults; the majority of these were Western and Northern European countries. This implies that nutrition policies in the remaining 60% of countries without intake data may be based on limited evidence, particularly in CEEC. This is a concern, as overweight and obesity have tripled in some of these countries since 1980 and NCD prevalence rates are reaching those of Western Europe [1]. Additionally, unknown pockets of micronutrient deficiencies may exist in some countries.
Although the surveys used different dietary methodologies, we felt it important to report intakes in their publicly available format. Of the 21 surveys for which intakes were extracted, energy, macro and micronutrients were generally well represented and there were no apparent regional patterns in nutrient intake gaps. This provides a good basis for assessing population status and identifying vulnerable gender/age groups in these countries (see Appendices A & B). The biggest gaps in macronutrient provision were TFA, omega fatty acids and sugar, the latter particularly in CEEC, which have been identified as nutrients of concern [1,49]. These are therefore important knowledge gaps, as without intake data, population and subgroup status cannot be known or appropriate policies devised. Iodine was reported by the least surveys; deficiencies remain frequent in WHO Europe [1] and even mild-moderate maternal deficiency is associated with decreased cognitive function in children [50]. This gap therefore limits effective policy formation to address population groups most in need.
A third of countries, or just 13% of the 53 WHO Europe countries, reported energy and nutrient intakes by SEG (Table 3). This is concerning, as whilst NDS could be used to identify subgroups lacking nutrients based on gender and age, few can gauge the potential for NDS to capture socio-economic inequalities. In addition, different, often multiple variables were used to represent SEG, making inter-country comparisons difficult. Consequently, vulnerable groups across Europe may be at risk of malnutrition through under or over-nutrition and related NCDs, with limited means for governments and health bodies to measure, monitor or address in policy.
4.2. Energy Intakes
Energy intakes did not vary substantially by European region, although the different dietary assessment methodologies employed by surveys may make inter-country comparisons unreliable. In addition, under-reporting is associated with all dietary assessment methods, including the 24 h recall and food diaries used by the surveys in question [51], which could impact on the validity of intake data and the conclusions derived from it. Most surveys either included under-reporters or did not specify—only Belgium explicitly excluded under-reporters, which may elevate Belgian intakes compared to the other countries.
4.3. Nutrient Intakes and WHO RNI Status
WHO RNI attainment was low across all regions—only Finland and The Netherlands met more than a third of WHO RNIs in all gender/age groups, suggesting that nutritional concerns exist across WHO Europe and that population groups within countries are not impacted equally. Turkey had the lowest intakes in most nutrients, potentially because it reported the oldest age grouping (75+ y) who may be likely to consume less than younger adults. However, the Turkish 65–74 y group also had low intakes for multiple nutrients compared to equivalent age groups in other countries.
4.4. Carbohydrates and Fats
The majority of countries did not meet the carbohydrate, sugar or fiber guidelines. This suggests a potential under-consumption of complex carbohydrates, going against established dietary advice [10], particularly The Netherlands, which had a lower fiber but high sugar intake.
Most countries exceeded fat and saturates guidelines. Andorra and Lithuania had modest absolute but high %E intakes, suggesting a diet with an unfavorable fatty acid composition, particularly in Andorra, which does not have the high %E in PUFA evident in Lithuania. This could lead to increased susceptibility to NCDs like coronary heart disease (CHD) [52]. Similarly, Denmark, Norway and Iceland had a high saturates intakes without correspondingly high unsaturated fat intakes. This suggests that Northern European countries may have higher saturated fat intakes as a proportion of total fat, possibly reflecting unfavorable national dietary patterns, though diet is one of many contributors to disease susceptibility.
Spain, Italy and Andorra had high MUFA intakes, which could indicate a Mediterranean diet pattern, linked to reduced all-cause mortality and NCD risk [53,54]. Hungary, Lithuania and Turkey had high PUFA intakes, which could indicate a regional influence based on CEEC diet patterns, particularly in Turkey, which had low intakes for most macronutrients other than PUFA. This pattern is also evident in n-6 intakes—both Turkey and Hungary exceeded the upper WHO RNI. TFAs had the greatest RNI compliance, possibly due to a combination of health bodies like WHO calling for a wholesale TFA reduction [1] and widespread TFA-reduction policies across Europe, including bans, labelling initiatives and voluntary product reformulation [55,56,57,58].
Of those reporting omega fats, Northern European countries had higher n-3 but lower n-6 intakes. This could potentially be a function of national diet patterns such as high oily fish consumption in Scandinavia; of the five European countries participating in the European Food Consumption Validation Project (EFCOVAL), Norway had the highest fish consumption [59]. Although some countries reported different n-3 and n-6 variants, the highest intakes were not necessarily those that included multiple variants. Therefore, although amalgamated n-3 and n-6 levels may not represent the full population omega intake, this does not necessarily invalidate inferences made. It does, however, highlight the need for a common methodological approach to conducting dietary surveys and gathering nutrient intake data.
4.5. Micronutrients
The percentage of CEEC that surveyed micronutrients generally had lower micronutrient intakes than the other regions, particularly Lithuania and Turkey—exceptions were relatively high Lithuanian folate and Hungarian, particularly male, sodium intakes. This suggests the potential for population groups to have suboptimum diets with excessive or inadequate intakes of particular nutrients. More research is necessary to determine whether this is a function of typical regional diet patterns and to inform debate on potential solutions such as food-based compared to fortification and/or supplementation for specific at-risk groups.
The majority of countries not meeting the iodine RNI were CEEC (Figure 10); this could be attributed to regional differences in salt iodization practices. However, patterns are difficult to elucidate, as salt-iodization programs are not uniform within or between countries and even where countries have policies, household coverage may be low [60]. For sodium only the UK and CEEC females did not exceed the RNI, although sodium intakes from dietary records may be unreliable. This could reflect generally low CEEC intakes and also the UK being an early adopter of a comprehensive voluntary salt reduction program since 2008 [61,62], which is credited with facilitating a reduction in salt intakes [63]. However, care must be taken when considering salt reduction, as salt iodization is a primary means of improving iodine intakes [64]. European iodine status is concerning; of the WHO regions Europe has the highest deficiency level. Potential solutions for compatibility, such as increasing the concentration of iodine in salt or using alternative vehicles, may need to be considered in countries where iodine status is poor.
Nordic countries had higher mineral intakes, whilst different national fortification practices may explain some variations in vitamin intake. Scandinavian vitamin D intakes were relatively high, with the exception of Denmark and Swedish vitamin D fortification is more extensive than Danish [65]. Northern European countries have less sunlight, meaning populations are likely to need more vitamin D from food, so where fortification is low, intakes are likely to be lower. This review includes fortification in base diet, as most countries’ food composition databases do not separate this out [66].
Our findings support the identification of iodine, iron and vitamin D by WHO as nutrients of concern [1], particularly in CEEC, women and the female elderly respectively. Women and the female elderly appear to be the most vulnerable groups across the countries, with additional risk of potassium, calcium and folate deficiency. The latter is of particular concern in women of reproduction age as it can prevent neural tube defects in offspring [67]. Nutrients of universal concern were carbohydrates, fats and sodium. In addition to improving micronutrient intakes, increasing complex carbohydrate and fiber consumption and reduction of sodium, fat and saturates should be a priority across the majority of European population groups.
4.6. Strengths and Limitations
The strengths of this review are that it provides a unique, current account of reported energy and nutrient intakes for adults across whole populations and subgroups in Europe, with reference to WHO RNI attainment. The review will help identify where there is a need to improve diets and could enable governments and health bodies to better use NDS to reduce NCDs and related conditions across Europe. It also details where surveys report nutrient intakes by SEG—future work could present and assess intakes by SEG in more detail.
A limitation is that inconsistent age groupings across countries made inter-country comparisons difficult. In Andorra, the youngest age group spanned both adults and children, invalidating conclusions regarding adults aged 18–24. Further investigations using raw data could obtain more reliable conclusions via consistent age groups. Differences in dietary assessment methodologies present further limiting factors when making inter-country comparisons. For example, mean energy intakes in young Norwegian men were 3.4MJ higher than in the same age group in Sweden, despite being neighboring countries whose NDS were conducted in the same years. These differences could therefore be either due to the different methodological approaches employed, or a genuine intake disparity. In addition, collection over more days better reflects usual intake due to greater control over day-to-day variation [68]. However, most countries did not employ usual intake procedures such as the Statistical Programme to Assess Dietary Exposure (SPADE) [68]. This could affect intakes, although the impact would be greater on the distribution rather than the mean values. Some countries did not report overall country means for nutrients by gender, so a consistent weighting method was used for all countries. However, the overall country means we tabled are approximations based on the assumption that the numbers in each age group are proportionate to those in the total population. Due to availability, we used total national population numbers, which included adults and children, to calculate weighted regional and overall European means; therefore, means of countries with larger proportions of children in their populations may be given more weighting than required in these approximations.
Lack of alignment and completeness of national food composition databases and classification systems represents a further limitation. Sweden used sucrose as a proxy for added sugar [45], whilst others did not specify, so the number of mono and disaccharides included may differ and intake levels be incomparable. In this review, sucrose was equated with added sugars. If differences like these exist in other countries, estimated intake levels may vary as a result. Different composition databases may represent nutrients to different degrees; of the 14 countries reporting iodine, for example, not all may have iodine values for all foods. Consequently, intake values for particular nutrient in certain countries may be less accurate. In addition, the nutrient values underpinning food composition databases may be derived from different analytical methods, as with folate, preventing true data harmonization and potentially skewing intakes. This could explain the particularly low UK fiber intakes; the UK survey used the Englyst method, whereas other countries may have used AOAC or other methods. Whilst there is good agreement between methods in most foods, the Englyst method produces lower results in certain cereals, fruits, white beans and peanuts, which may affect fiber intake levels [69]. Additionally, food composition databases may not accurately reflect fortification—not all countries’ food composition databases account for iodine fortification, potentially depressing intake estimates [70]. Some food composition databases may not be updated to account for reformulated products; for instance, TFA values reported may be higher than those found in purchased products [71].
Future research could investigate how methodological differences impact on intake estimates in European populations—low Turkish intakes may have been due to either socioeconomic or methodological factors, using only a single 24 h recall [70]. Ireland had high vitamin intakes and was the only country that used weighed intake; the majority of countries used 24 h recall [5], which Holmes & Nelson [72] rank as less likely than weighed intakes to generate accurate portion size data.
5. Conclusions
This review has found that adult energy and nutrient intakes could only be extracted from 21 (40%) of the 53 WHO Europe countries and that methodological and other differences make inter-country comparisons difficult. The main gaps lie in CEEC, where nutrition policies may therefore be based on limited evidence, with a lack of data meaning potential unknown nutrient deficiencies may exist. Macro and micronutrients of interest were reported by most countries with intake data, though TFAs, omega fats, sugars and iodine had the least coverage. WHO RNI attainment was generally poor, particularly for macronutrients and was most notably lacking in women. Concerning micronutrients, the same was seen and was most prominent amongst the elderly female population and CEEC. Only 13% of WHO Europe countries reported intakes by SEG and by different methods. Consequently, the majority of WHO Europe countries are unable to adequately assess and address nutrient deficiencies in vulnerable SEGs. Future efforts should encourage WHO Europe countries to report a full range of nutrient intakes, including by SEG, in a uniform way.
Acknowledgments
This research was funded by the WHO Regional Office for Europe.
Author Contributions
All authors have contributed to the concept and design of the research and to the writing and/or revision of the manuscript and have approved the manuscript for submission.
Conflicts of Interest
The authors declare no conflict of interest. The co-authors Joao Breda and Jo Jewell are staff members of the World Health Organization Regional Office for Europe; however, the authors are responsible for the views expressed in this publication and they do not necessarily represent the decisions or stated policy of WHO.
Appendix A. Mean Macronutrient Intakes across Dietary Surveys
| COUNTRY | SURVEY | YEAR | Energy (MJ) | Energy (Kcal) | Protein (g) | CHO (g) | Sugars (g) | Sucrose (g) | Starch (g) | Fiber (g) | Total Fat (g) | Saturates (g) | MUFA (g) | PUFA (g) | TFAs (g) | n-3 (g) | n-6 (g) |
| Andorra | Evaluation of the nutritional status of the Andorran population | 2004–2005 | |||||||||||||||
| female: 25–44 y | 6.9 | 1650 | 83 | 165 | 75 | 15.8 | 73 | 23.4 | 32.5 | 10.2 | |||||||
| female: 45–64 y | 6.8 | 1628 | 81 | 162 | 77 | 17.6 | 73 | 22.3 | 32.8 | 10.6 | |||||||
| female: 65–75 y | 6.4 | 1518 | 71 | 165 | 83 | 21.3 | 65 | 18.3 | 31.2 | 8.6 | |||||||
| male: 25–44 y | 8.8 | 2093 | 100 | 205 | 88 | 16.8 | 85 | 30.7 | 42.7 | 13.8 | |||||||
| male: 45–64 y | 8.0 | 1919 | 90 | 188 | 84 | 17.1 | 86 | 26.5 | 39.3 | 12.1 | |||||||
| male: 65–75 y | 7.0 | 1679 | 83 | 173 | 80 | 18.3 | 74 | 20.8 | 34.9 | 12.0 | |||||||
| Austria | Austrian nutrition report | 2010–2012 | |||||||||||||||
| female: 18–24 y | 8.0 | 1917 | 72 | 225 | 43 | 22.0 | 77 | 32.0 | 25.6 | 14.9 | 1.5 | 12.6 | |||||
| female: 25–50 y | 7.8 | 1854 | 70 | 218 | 46 | 22.0 | 74 | 30.9 | 24.7 | 12.4 | 1.5 | 12.2 | |||||
| female: 51–64 y | 7.7 | 1826 | 64 | 219 | 46 | 22.0 | 73 | 30.4 | 22.3 | 14.2 | 1.5 | 12.0 | |||||
| female: 65–80 y | 7.0 | 1675 | 63 | 188 | 38 | 19.0 | 69 | 29.8 | 22.3 | 13.0 | 1.4 | 10.4 | |||||
| male: 18–24 y | 10.1 | 2403 | 90 | 282 | 60 | 24.0 | 91 | 37.4 | 29.4 | 16.0 | 1.6 | 13.9 | |||||
| male: 25–50 y | 9.1 | 2172 | 81 | 239 | 54 | 20.0 | 89 | 38.6 | 29.0 | 14.5 | 1.5 | 12.5 | |||||
| male: 51–64 y | 9.4 | 2245 | 84 | 236 | 45 | 22.0 | 92 | 39.9 | 29.9 | 15.0 | 1.5 | 13.0 | |||||
| male: 65–80 y | 8.0 | 1920 | 67 | 216 | 38 | 20.0 | 75 | 32.0 | 23.5 | 12.8 | 1.4 | 11.1 | |||||
| Belgium | The Belgian food consumption survey 2014–2015 | 2014–2015 | |||||||||||||||
| female: 18–39 y | 8.2 | 1955 | 71 | 214 | 99 | 116 | 17.3 | 79 | 29.0 | 29.0 | 14.0 | 0.8 | |||||
| female: 40–64 y | 7.6 | 1826 | 71 | 190 | 89 | 100 | 18.8 | 75 | 27.0 | 26.0 | 14.0 | 0.8 | |||||
| male: 18–39 y | 11.1 | 2652 | 95 | 291 | 131 | 155 | 19.3 | 100 | 36.0 | 38.0 | 18.0 | 1.0 | |||||
| male: 40–64 y | 10.7 | 2547 | 96 | 253 | 115 | 137 | 20.1 | 104 | 37.0 | 36.0 | 19.0 | 1.1 | |||||
| Denmark | Danish Dietary habits 2011–2013 | 2011–2013 | |||||||||||||||
| female: 18–75 y | 8.4 | 2008 | 76 | 211 | 43 | 21.0 | 83 | 33.0 | 31.0 | 13.0 | 1.3 | ||||||
| male: 18–75 y | 11.2 | 2677 | 101 | 269 | 56 | 24.0 | 111 | 45.0 | 41.0 | 17.0 | 1.7 | ||||||
| Estonia | National Dietary Survey | 2014–2015 | |||||||||||||||
| female: 18–24 y | 6.8 | 1625 | 64 | 200 | 48 | 15.1 | 64 | 25.5 | 22.8 | 10.9 | 0.5 | 1.6 | 8.6 | ||||
| female: 25–29 y | 7.6 | 1818 | 71 | 217 | 54 | 17.1 | 76 | 30.5 | 27.2 | 12.1 | 0.6 | 1.9 | 9.2 | ||||
| female: 30–34 y | 7.3 | 1762 | 71 | 210 | 49 | 18.1 | 73 | 29.6 | 26.4 | 11.6 | 0.6 | 1.8 | 8.9 | ||||
| female: 35–39 y | 7.2 | 1730 | 68 | 205 | 48 | 17.8 | 72 | 29.1 | 26.4 | 11.9 | 0.6 | 2.2 | 9.1 | ||||
| female: 40–44 y | 6.4 | 1529 | 60 | 188 | 41 | 17.3 | 61 | 24.4 | 21.8 | 10.4 | 0.5 | 1.8 | 7.7 | ||||
| female: 45–49 y | 6.2 | 1488 | 59 | 177 | 38 | 16.6 | 60 | 23.6 | 21.9 | 10.3 | 0.5 | 1.8 | 7.7 | ||||
| female: 50–54 y | 6.3 | 1505 | 60 | 183 | 42 | 17.6 | 61 | 23.3 | 22.3 | 10.8 | 0.5 | 1.8 | 7.8 | ||||
| female: 55–59 y | 6.4 | 1537 | 64 | 185 | 38 | 18.1 | 62 | 24.6 | 22.6 | 10.7 | 0.5 | 1.5 | 8.0 | ||||
| female: 60–64 y | 6.2 | 1474 | 61 | 179 | 39 | 17.0 | 59 | 22.5 | 22 | 10.2 | 0.5 | 1.7 | 7.6 | ||||
| female: 65–69 y | 6.3 | 1509 | 62 | 186 | 36 | 17.8 | 59 | 23.3 | 21.4 | 10.3 | 0.5 | 1.9 | 7.5 | ||||
| female: 70–74 y | 5.5 | 1330 | 55 | 168 | 32 | 16.6 | 51 | 20.3 | 18.3 | 8.9 | 0.4 | 1.5 | 6.7 | ||||
| male: 18–24 y | 9.7 | 2326 | 102 | 266 | 58 | 18.1 | 92 | 35.8 | 34.4 | 16.4 | 0.6 | 2.8 | 13.2 | ||||
| male: 25–29 y | 9.5 | 2277 | 94 | 239 | 55 | 16.8 | 93 | 36.9 | 35.2 | 14.7 | 0.8 | 3.5 | 11.4 | ||||
| male: 30–34 y | 8.6 | 2058 | 85 | 234 | 52 | 17.7 | 84 | 33 | 31.3 | 14.4 | 0.7 | 2.6 | 11.2 | ||||
| male: 35–39 y | 9.5 | 2279 | 94 | 252 | 55 | 19.7 | 94 | 36.9 | 34.7 | 16.8 | 0.6 | 4.4 | 12.3 | ||||
| male: 40–44 y | 8.7 | 2085 | 89 | 229 | 45 | 19.3 | 81 | 31.8 | 30.9 | 13.4 | 0.6 | 3.0 | 10.0 | ||||
| male: 45–49 y | 8.6 | 2068 | 79 | 242 | 47 | 20.1 | 80 | 29.7 | 31.3 | 14 | 0.6 | 3.6 | 10.5 | ||||
| male: 50–54 y | 8.9 | 2125 | 89 | 233 | 46 | 20.4 | 89 | 33.9 | 33.8 | 14.9 | 0.6 | 4.6 | 11.1 | ||||
| male: 55–59 y | 8.2 | 1965 | 75 | 221 | 44 | 19.2 | 76 | 27.6 | 29 | 14 | 0.5 | 3.5 | 10.5 | ||||
| male: 60–64 y | 8.1 | 1941 | 81 | 226 | 40 | 20.6 | 75 | 29.6 | 28.1 | 12.6 | 0.6 | 2.9 | 9.3 | ||||
| male: 65–69 y | 7.8 | 1865 | 78 | 213 | 34 | 19.5 | 74 | 29.8 | 27.4 | 12.4 | 0.6 | 2.6 | 9.0 | ||||
| male: 70–74 y | 7.6 | 1814 | 75 | 213 | 36 | 19.6 | 73 | 29.1 | 27.5 | 12.7 | 0.5 | 2.4 | 9.4 | ||||
| Finland | The national FINDIET 2012 survey | 2012 | |||||||||||||||
| female: 25–34 y | 7.8 | 1864 | 76 | 199 | 49 | 19.0 | 78 | 31.0 | 27.0 | 13.4 | 1.0 | 3.0 | 9.8 | ||||
| female: 35–44 y | 7.7 | 1840 | 77 | 195 | 46 | 20.0 | 75 | 29.0 | 27.0 | 13.0 | 0.9 | 2.9 | 9.6 | ||||
| female: 45–54 y | 7.0 | 1673 | 68 | 180 | 44 | 21.0 | 67 | 26.0 | 24.0 | 11.6 | 0.8 | 2.7 | 8.4 | ||||
| female: 55–64 y | 6.6 | 1577 | 67 | 171 | 36 | 22.0 | 63 | 24.0 | 22.0 | 11.6 | 0.7 | 2.8 | 8.5 | ||||
| female: 65–74 y | 6.2 | 1482 | 62 | 166 | 35 | 21.0 | 57 | 22.0 | 20.0 | 10.6 | 0.7 | 2.5 | 7.6 | ||||
| male: 25–34 y | 10.2 | 2449 | 106 | 249 | 55 | 19.0 | 102 | 40.0 | 37.0 | 16.9 | 1.3 | 3.7 | 12.5 | ||||
| male: 35–44 y | 9.5 | 2275 | 96 | 237 | 54 | 21.0 | 93 | 36.0 | 34.0 | 15.6 | 1.1 | 3.5 | 11.4 | ||||
| male: 45–54 y | 9.5 | 2282 | 96 | 237 | 52 | 23.0 | 93 | 36.0 | 34.0 | 16.2 | 1.1 | 3.6 | 11.8 | ||||
| male: 55–64 y | 8.6 | 2053 | 85 | 207 | 45 | 23.0 | 86 | 33.0 | 30.0 | 14.9 | 1.0 | 3.5 | 10.8 | ||||
| male: 65–74 y | 8.2 | 1954 | 80 | 212 | 43 | 24.0 | 77 | 29.0 | 28.0 | 13.7 | 0.9 | 3.4 | 9.7 | ||||
| France | INCA2 | 2006–2007 | |||||||||||||||
| female: 18–79 y | 7.6 | 1809 | 74 | 199 | 89 | 105 | 16.0 | 80 | 32.1 | 28.6 | 12.3 | ||||||
| male: 18–79 y | 9.8 | 2348 | 100 | 262 | 101 | 153 | 19.2 | 100 | 41.2 | 35.7 | 14.5 | ||||||
| Germany | German National Nutrition Survey II | 2005–2007 | |||||||||||||||
| female: 19–24 y | 8.4 | 1996 | 65 | 252 | 21.7 | 74 | |||||||||||
| female: 25–34 y | 8.5 | 2031 | 70 | 251 | 24.0 | 77 | |||||||||||
| female: 35–50 y | 8.2 | 1948 | 69 | 231 | 24.7 | 76 | |||||||||||
| female: 51–64 y | 7.8 | 1856 | 67 | 217 | 26.1 | 72 | |||||||||||
| female: 65–80 y | 7.3 | 1753 | 62 | 209 | 24.9 | 69 | |||||||||||
| male: 19–24 y | 12.0 | 2872 | 102 | 331 | 24.6 | 110 | |||||||||||
| male: 325–34 y | 11.6 | 2783 | 99 | 318 | 25.8 | 110 | |||||||||||
| male: 35–50 y | 11.0 | 2640 | 94 | 294 | 27.3 | 106 | |||||||||||
| male: 51–64 y | 10.0 | 2400 | 86 | 262 | 27.4 | 96 | |||||||||||
| male: 65–80 y | 9.2 | 2191 | 78 | 241 | 27.3 | 88 | |||||||||||
| Hungary | Hungarian Dietary Survey 2009 | 2009 | |||||||||||||||
| female: 19–30 y | 9.1 | 2175 | 81 | 265 | 49 | 20.7 | 88 | 26.2 | 26.8 | 22.8 | 0.9 | 22.1 | |||||
| female: 31–60 y | 9.0 | 2151 | 81 | 254 | 44 | 21.0 | 88 | 25.9 | 27.1 | 22.7 | 0.9 | 22.0 | |||||
| female: 60+ | 8.6 | 2055 | 75 | 245 | 41 | 20.6 | 84 | 25.0 | 26.3 | 21.2 | 0.9 | 20.4 | |||||
| male: 19–30 y | 12.5 | 2988 | 112 | 334 | 64 | 25.5 | 124 | 37.5 | 39.8 | 30.0 | 1.2 | 29.1 | |||||
| male: 31–60 y | 12.3 | 2940 | 109 | 322 | 49 | 25.4 | 127 | 37.6 | 41.4 | 30.4 | 1.2 | 29.5 | |||||
| male: 60+ | 10.5 | 2510 | 92 | 277 | 40 | 23.1 | 107 | 31.7 | 35.1 | 25.5 | 1.0 | 24.6 | |||||
| Iceland | The Diet of Icelanders—a national dietary survey 2010–2011 | 2010–2011 | |||||||||||||||
| female: 18–30 y | 8.0 | 1895 | 75 | 222 | 108 | 16.2 | 71 | 27.6 | 23.2 | 12.4 | 1.3 | 2.6 | 9.7 | ||||
| female: 31–60 y | 7.5 | 1795 | 76 | 190 | 86 | 16.5 | 74 | 29.7 | 23.4 | 12.5 | 1.6 | 3.0 | 9.4 | ||||
| female: 61–80 y | 6.7 | 1610 | 71 | 161 | 74 | 14.8 | 69 | 28.4 | 21.9 | 10.7 | 1.6 | 2.9 | 7.6 | ||||
| male: 18–30 y | 11.1 | 2635 | 116 | 288 | 129 | 19.1 | 101 | 38.9 | 32.5 | 17.1 | 2.1 | 3.5 | 13.6 | ||||
| male: 31–60 y | 10.1 | 2402 | 107 | 242 | 105 | 17.6 | 101 | 40.5 | 32.3 | 16.2 | 2.2 | 3.9 | 12.3 | ||||
| male: 61–80 y | 8.7 | 2081 | 97 | 192 | 80 | 16.7 | 94 | 39.1 | 30.1 | 13.7 | 2.3 | 4.0 | 9.5 | ||||
| Ireland | National adult nutrition survey | 2008–2010 | |||||||||||||||
| female: 18–64 y | 7.2 | 1721 | 70 | 200 | 81 | 115 | 17.3 | 68 | 28.9 | 27.4 | 13.9 | 1.1 | 1.6 | ||||
| female: 18–35 y | 7.5 | 1793 | 69 | 206 | 84 | 117 | 15.9 | 70 | 29.9 | 29.4 | 14.8 | 1.1 | 1.6 | ||||
| female: 36–50 y | 7.1 | 1697 | 71 | 197 | 77 | 115 | 17.5 | 67 | 28.6 | 26.4 | 13.2 | 1.0 | 1.6 | ||||
| female: 51–64 y | 7.0 | 1673 | 73 | 195 | 83 | 109 | 19.5 | 65 | 27.9 | 25.8 | 13.5 | 1.0 | 1.8 | ||||
| female: 65+ y | 6.5 | 1554 | 69 | 187 | 80 | 103 | 18.4 | 61 | 26.5 | 22.6 | 11.7 | 1.0 | 1.7 | ||||
| male: 18–64 y | 10.1 | 2414 | 100 | 266 | 102 | 160 | 21.1 | 92 | 38.7 | 36.4 | 16.9 | 1.6 | 2.0 | ||||
| male: 18–35 y | 10.7 | 2557 | 105 | 281 | 108 | 167 | 21.3 | 95 | 39.5 | 38.3 | 17.9 | 1.7 | 2.0 | ||||
| male: 36–50 y | 9.7 | 2318 | 99 | 259 | 98 | 157 | 21.0 | 92 | 38.6 | 35.6 | 16.2 | 1.5 | 1.9 | ||||
| male: 51–64 y | 9.3 | 2223 | 93 | 249 | 98 | 148 | 21.0 | 86 | 37.4 | 33.6 | 15.9 | 1.5 | 2.0 | ||||
| male: 65+ y | 8.3 | 1984 | 85 | 226 | 89 | 133 | 19.6 | 78 | 35.6 | 29.8 | 13.1 | 1.4 | 1.6 | ||||
| Italy | The third Italian National food consumption survey INRAN-SCAI | 2005–2006 | |||||||||||||||
| female: 18–64.9 | 8.1 | 1939 | 76 | 237 | 80 | 142 | 17.7 | 79 | 24.4 | 38.3 | 10.0 | ||||||
| female: 65+ | 7.7 | 1834 | 71 | 234 | 79 | 139 | 18.7 | 70 | 22.2 | 34.1 | 8.0 | ||||||
| male: 18–64.9 | 10.0 | 2390 | 93 | 283 | 86 | 179 | 19.6 | 95 | 29.7 | 45.9 | 12.2 | ||||||
| male: 65+ | 9.6 | 2296 | 88 | 275 | 82 | 174 | 21.6 | 87 | 26.8 | 43.5 | 10.4 | ||||||
| Latvia | Latvian National Food Consumption Survey 2007–2009 | 2007–2009 | |||||||||||||||
| female: ALL | 6.7 | 1613 | 55 | 190 | 15.8 | 68 | 28.1 | 24.0 | 10.8 | ||||||||
| male: ALL | 9.1 | 2171 | 79 | 246 | 20.2 | 93 | 38.1 | 33.4 | 14.8 | ||||||||
| female: 17–26 y | 7.1 | 1690 | |||||||||||||||
| female: 27–36 y | 6.4 | 1523 | |||||||||||||||
| female: 37–46 y | 6.5 | 1562 | |||||||||||||||
| female: 47–56 y | 6.7 | 1608 | |||||||||||||||
| female: 57–64 y | 6.4 | 1530 | |||||||||||||||
| male: 17–26 y | 10.0 | 2394 | |||||||||||||||
| male: 27–36 y | 10.0 | 2393 | |||||||||||||||
| male: 37–46 y | 9.7 | 2319 | |||||||||||||||
| male: 47–56 y | 9.3 | 2230 | |||||||||||||||
| male: 57–64 y | 8.9 | 2121 | |||||||||||||||
| Lithuania | Study and evaluation of actual nutrition and nutrition habits of Lithuanian adult population | 2013–2014 | |||||||||||||||
| female: 19–75 y | 6.5 | 1561 | 56 | 178 | 56 | 14.6 | 71 | 21.9 | 26.8 | 15.5 | |||||||
| male: 19–75 y | 9.2 | 2188 | 75 | 224 | 55 | 17.2 | 108 | 33.5 | 41.1 | 23.8 | |||||||
| all: 19–34 y | 8.1 | 1936 | 65 | 209 | 58 | 15.4 | 92 | 28.4 | 34.8 | 20.1 | |||||||
| all: 35–49 y | 7.8 | 1855 | 66 | 197 | 56 | 16.1 | 90 | 27.7 | 34.0 | 19.7 | |||||||
| all: 50–64 y | 7.4 | 1763 | 63 | 191 | 55 | 15.8 | 83 | 25.9 | 31.7 | 18.3 | |||||||
| all: 65–75 y | 6.7 | 1600 | 57 | 183 | 51 | 15.1 | 72 | 22.3 | 27.3 | 15.8 | |||||||
| The Netherlands | Dutch National Food Consumption Survey (DNFCS) 2007–2010 | 2007–2010 | |||||||||||||||
| female: 19–30 y | 8.5 | 2028 | 73 | 242 | 121 | 18.0 | 77 | 29.0 | 26.9 | 14.8 | 1.3 | 1.5 | 12.3 | ||||
| female: 31–50 y | 8.3 | 1983 | 75 | 222 | 104 | 18.9 | 77 | 29.6 | 26.6 | 14.6 | 1.3 | 1.7 | 11.9 | ||||
| female: 51–69 y | 7.9 | 1874 | 77 | 195 | 92 | 18.8 | 72 | 27.8 | 24.0 | 13.8 | 1.4 | 1.8 | 11.3 | ||||
| male: 19–30 y | 11.9 | 2847 | 98 | 342 | 152 | 22.4 | 109 | 39.3 | 39.1 | 21.7 | 1.7 | 2.3 | 18.1 | ||||
| male: 31–50 y | 11.1 | 2651 | 97 | 285 | 126 | 23.7 | 104 | 38.3 | 36.2 | 21.0 | 1.6 | 2.3 | 17.4 | ||||
| male: 51–69 y | 10.2 | 2425 | 97 | 246 | 107 | 21.6 | 94 | 35.4 | 32.2 | 18.6 | 1.6 | 2.2 | 15.4 | ||||
| Norway | Norkost3 | 2010–2011 | |||||||||||||||
| female: 18–70 y | 8.0 | 1912 | 81 | 205 | 36 | 22.0 | 75 | 29.0 | 25.0 | 13.0 | |||||||
| male: 18–70 y | 10.9 | 2605 | 112 | 278 | 48 | 26.0 | 102 | 39.0 | 34.0 | 18.0 | |||||||
| female: 18–29 y | 8.1 | 1936 | 80 | 221 | 46 | 21.0 | 73 | 28.0 | 25.0 | 13.0 | |||||||
| female: 30–39 y | 8.4 | 2008 | 83 | 232 | 42 | 24.0 | 75 | 29.0 | 25.0 | 14.0 | |||||||
| female: 40–49 y | 8.1 | 1936 | 83 | 202 | 32 | 22.0 | 77 | 30.0 | 26.0 | 14.0 | |||||||
| female: 50–59 y | 7.9 | 1888 | 81 | 194 | 33 | 22.0 | 75 | 28.0 | 26.0 | 14.0 | |||||||
| female: 60–70 y | 7.4 | 1769 | 77 | 182 | 30 | 22.0 | 72 | 28.0 | 24.0 | 13.0 | |||||||
| male: 18–29 y | 12.8 | 3059 | 130 | 339 | 69 | 29.0 | 114 | 44.0 | 38.0 | 21.0 | |||||||
| male: 30–39 y | 11.5 | 2749 | 118 | 298 | 49 | 26.0 | 108 | 42.0 | 37.0 | 19.0 | |||||||
| male: 40–49 y | 10.6 | 2533 | 107 | 275 | 51 | 25.0 | 100 | 38.0 | 34.0 | 19.0 | |||||||
| male: 50–59 y | 10.4 | 2486 | 109 | 259 | 41 | 26.0 | 99 | 37.0 | 33.0 | 18.0 | |||||||
| male: 60–70 y | 9.9 | 2366 | 102 | 247 | 39 | 27.0 | 94 | 36.0 | 31.0 | 17.0 | |||||||
| Portugal | National Food and Physical Activity Survey (IAN-AF) | 2015–2016 | |||||||||||||||
| female: 18–64 y | 7.3 | 1747 | 80 | 199 | 78 | 16.9 | 61 | 23.4 | 25.2 | 11.1 | 0.9 | 9.9 | |||||
| female: 65–84 y | 6.5 | 1555 | 70 | 180 | 73 | 18.1 | 53 | 17.3 | 21.7 | 9.1 | 0.6 | 7.9 | |||||
| male: 18–64 y | 10.1 | 2398 | 111 | 255 | 89 | 19.9 | 81 | 28.9 | 33.9 | 13.7 | 1.1 | 13.1 | |||||
| male: 65–84 y | 8.5 | 2030 | 91 | 212 | 71 | 20.6 | 63 | 20.9 | 26.4 | 10.8 | 0.7 | 9.6 | |||||
| Spain | ENIDE 2011 | 2009–2010 | |||||||||||||||
| female: 18–24 y | 9.2 | 2186 | 88 | 209 | 17.1 | 95 | 27.5 | 40.1 | 13.0 | ||||||||
| female: 25–44 y | 9.2 | 2187 | 88 | 202 | 18.9 | 94 | 26.2 | 38.9 | 12.4 | ||||||||
| female: 45–64 y | 9.1 | 2162 | 88 | 193 | 19.7 | 91 | 24.2 | 38.1 | 12.6 | ||||||||
| male: 18–24 y | 10.1 | 2402 | 117 | 275 | 20.5 | 127 | 39.6 | 53.3 | 17.1 | ||||||||
| male: 25–44 y | 9.8 | 2340 | 109 | 248 | 20.4 | 117 | 33.6 | 49.1 | 15.7 | ||||||||
| male: 45–64 y | 9.6 | 2281 | 106 | 222 | 21.7 | 108 | 29.0 | 45.1 | 14.5 | ||||||||
| Sweden | Riksmaten 2010–11 Swedish Adult Dietary Survey | 2010–2011 | |||||||||||||||
| female: 18–30 y | 7.6 | 1819 | 69 | 205 | 44 | 17.3 | 72 | 27.4 | 27.1 | 12.0 | 2.4 | 9.2 | |||||
| female: 31–44 y | 7.6 | 1820 | 73 | 199 | 38 | 18.5 | 72 | 27.8 | 26.9 | 11.6 | 2.4 | 8.7 | |||||
| female: 45–64 y | 7.3 | 1755 | 73 | 182 | 34 | 19.3 | 70 | 26.5 | 26.0 | 11.7 | 2.5 | 8.7 | |||||
| female: 65–80 y | 7.1 | 1703 | 70 | 186 | 34 | 20.0 | 65 | 24.9 | 23.9 | 10.6 | 2.6 | 7.6 | |||||
| male: 18–30 y | 9.4 | 2246 | 95 | 241 | 45 | 18.6 | 88 | 34.1 | 32.8 | 14.0 | 2.7 | 10.6 | |||||
| male: 31–44 y | 9.8 | 2343 | 95 | 250 | 43 | 21.3 | 92 | 35.0 | 34.9 | 14.9 | 2.9 | 11.4 | |||||
| male: 45–64 y | 9.4 | 2254 | 93 | 237 | 41 | 21.8 | 87 | 33.7 | 32.8 | 13.9 | 2.9 | 10.3 | |||||
| male: 65–80 y | 8.7 | 2083 | 84 | 223 | 38 | 22.5 | 80 | 30.5 | 29.6 | 13.4 | 3.1 | 9.7 | |||||
| Turkey | Turkey nutrition and health survey 2010 (TNHS) | 2010 | |||||||||||||||
| female: 19–30 y | 6.9 | 1649 | 52 | 204 | 19.0 | 67 | 21.7 | 23.1 | 17.4 | 1.2 | 16.1 | ||||||
| female: 31–50 y | 6.9 | 1638 | 52 | 205 | 20.3 | 65 | 21.1 | 22.4 | 17.3 | 1.2 | 16.0 | ||||||
| female: 51–64 y | 6.4 | 1533 | 49 | 195 | 21.0 | 59 | 19.5 | 21.5 | 14.2 | 1.1 | 13.1 | ||||||
| female: 65–74 y | 5.9 | 1409 | 46 | 183 | 19.3 | 53 | 16.8 | 19.0 | 13.4 | 0.9 | 12.4 | ||||||
| female: 75+ y | 5.1 | 1223 | 39 | 156 | 16.5 | 47 | 16.0 | 17.2 | 10.7 | 0.8 | 9.8 | ||||||
| male: 19–30 y | 9.4 | 2242 | 71 | 282 | 22.4 | 86 | 28.3 | 30.0 | 21.9 | 1.6 | 20.2 | ||||||
| male: 31–50 y | 9.2 | 2203 | 73 | 278 | 23.7 | 83 | 27.4 | 29.3 | 20.4 | 1.5 | 18.8 | ||||||
| male: 51–64 y | 8.0 | 1919 | 64 | 242 | 24.0 | 72 | 23.8 | 26.5 | 17.1 | 1.3 | 15.7 | ||||||
| male: 65–74 y | 7.1 | 1705 | 56 | 220 | 22.9 | 64 | 21.5 | 23.4 | 15.0 | 1.1 | 13.7 | ||||||
| male: 75+ y | 6.7 | 1606 | 52 | 207 | 21.4 | 61 | 20.1 | 24.0 | 13.0 | 1.1 | 11.9 | ||||||
| UK | National Diet and Nutrition Survey (NDNS) Years 1–4 | 2008–2012 | |||||||||||||||
| female: 19–64 | 6.8 | 1613 | 65 | 197 | 85 | 113 | 12.8 | 60 | 22.1 | 21.7 | 10.6 | 1.1 | 1.8 | 8.8 | |||
| female: 65+ y | 6.4 | 1510 | 64 | 187 | 88 | 98 | 13.1 | 58 | 23.0 | 19.6 | 9.5 | 1.2 | 1.8 | 7.7 | |||
| male: 19–64 | 8.9 | 2111 | 85 | 251 | 106 | 146 | 14.7 | 78 | 28.4 | 28.5 | 13.4 | 1.5 | 2.2 | 11.2 | |||
| male: 65+ y | 8.1 | 1935 | 78 | 231 | 102 | 129 | 14.9 | 74 | 28.7 | 25.8 | 12.4 | 1.5 | 2.3 | 10.1 | |||
| all: 19–64 | 7.8 | 1861 | 75 | 224 | 95 | 129 | 13.7 | 69 | 25.2 | 25.1 | 12.0 | 1.3 | 2.0 | 10.0 | |||
| all: 65+ y | 7.1 | 1697 | 70 | 206 | 95 | 112 | 13.9 | 65 | 25.5 | 22.3 | 10.7 | 1.3 | 2.0 | 8.7 |
Appendix B. Mean Micronutrient Intakes across Dietary Surveys
| COUNTRY | SURVEY | YEAR | Folic Acid (μg) | Vitamin B12 (μg) | Vitamin D (μg) | Calcium (mg) | Potassium (mg) | Sodium (mg) | Iron (mg) | Iodine (μg) | Zinc (mg) |
| Andorra | Evaluation of the nutritional status of the Andorran population | 2004–2005 | |||||||||
| female: 25–44 y | 227 | 5.3 | 3.4 | 793 | 2751 | 2662 | 10.8 | 8.4 | |||
| female: 45–64 y | 258 | 5.8 | 2.0 | 772 | 2912 | 2401 | 10.9 | 7.9 | |||
| female: 65–75 y | 254 | 4.6 | 0.7 | 834 | 3252 | 2030 | 10.5 | 7.4 | |||
| male: 25–44 y | 248 | 7.1 | 5.1 | 863 | 3124 | 3272 | 13.2 | 10.4 | |||
| male: 45–64 y | 248 | 8.1 | 2.9 | 797 | 3102 | 2835 | 13.4 | 9.7 | |||
| male: 65–75 y | 302 | 7.4 | 1.5 | 737 | 3179 | 2644 | 13.8 | 7.8 | |||
| Austria | Austrian nutrition report | 2010–2012 | |||||||||
| female: 18–24 y | 229 | 3.6 | 2.0 | 956 | 2562 | 3000 | 11.4 | 161 | 10.4 | ||
| female: 25–50 y | 216 | 4.0 | 2.8 | 838 | 2632 | 2800 | 10.9 | 130 | 9.7 | ||
| female: 51–64 y | 193 | 3.3 | 2.7 | 786 | 2623 | 2600 | 10.3 | 141 | 9.1 | ||
| female: 65–80 y | 194 | 4.8 | 3.2 | 632 | 2288 | 3480 | 10.2 | 124 | 8.6 | ||
| male: 18–24 y | 255 | 5.5 | 4.0 | 991 | 3329 | 3400 | 13.9 | 160 | 12.4 | ||
| male: 25–50 y | 197 | 5.3 | 3.6 | 881 | 2768 | 3240 | 11.8 | 143 | 11.4 | ||
| male: 51–64 y | 222 | 5.0 | 4.6 | 802 | 2820 | 3320 | 11.6 | 142 | 11.9 | ||
| male: 65–80 y | 203 | 4.0 | 3.9 | 692 | 2593 | 4200 | 9.9 | 142 | 9.2 | ||
| Belgium | The Belgian food consumption survey 2014–2015 | 2014–2015 | |||||||||
| female: 18–39 y | 189 | 3.6 | 3.4 | 704 | 2076 | 8.5 | 123 | ||||
| female: 40–64 y | 191 | 3.7 | 3.6 | 737 | 2047 | 8.8 | 132 | ||||
| male: 18–39 y | 228 | 5.0 | 4.0 | 842 | 2731 | 11.0 | 171 | ||||
| male: 40–64 y | 224 | 5.5 | 4.6 | 795 | 2748 | 11.4 | 177 | ||||
| Denmark | Danish Dietary habits 2011–2013 | 2011–2013 | |||||||||
| female: 18–75 y | 329 | 5.6 | 4.3 | 1038 | 3200 | 3200 | 10.0 | 227 | 10.5 | ||
| male: 18–75 y | 370 | 8.0 | 5.3 | 1188 | 3900 | 4400 | 13.0 | 268 | 14.1 | ||
| Estonia | National Dietary Survey | 2014–2015 | |||||||||
| female: 18–24 y | 159 | 4.4 | 3.1 | 671 | 2800 | 1737 | 9.6 | 112 | 7.8 | ||
| female: 25–29 y | 178 | 5.8 | 4.5 | 729 | 3200 | 1890 | 12.0 | 123 | 9.2 | ||
| female: 30–34 y | 174 | 5.6 | 4.6 | 730 | 3200 | 1820 | 11.9 | 119 | 9.3 | ||
| female: 35–39 y | 172 | 6.2 | 4.2 | 715 | 3200 | 1878 | 11.6 | 117 | 9.0 | ||
| female: 40–44 y | 167 | 5.5 | 3.7 | 620 | 3100 | 1847 | 10.3 | 107 | 8.0 | ||
| female: 45–49 y | 164 | 5.9 | 4.6 | 595 | 3000 | 1687 | 9.6 | 93 | 7.7 | ||
| female: 50–54 y | 175 | 7.4 | 5.3 | 591 | 3000 | 1657 | 10.2 | 96 | 7.9 | ||
| female: 55–59 y | 173 | 5.7 | 4.4 | 614 | 3100 | 1718 | 10.2 | 102 | 8.4 | ||
| female: 60–64 y | 152 | 5.5 | 4.3 | 566 | 2900 | 1827 | 10.0 | 102 | 8.0 | ||
| female: 65–69 y | 156 | 7.5 | 4.9 | 601 | 3000 | 1909 | 12.9 | 102 | 8.3 | ||
| female: 70–74 y | 143 | 5.0 | 3.8 | 545 | 2700 | 1700 | 9.1 | 85 | 7.4 | ||
| male: 18–24 y | 219 | 6.6 | 4.3 | 950 | 3900 | 2571 | 14.8 | 149 | 12.1 | ||
| male: 25–29 y | 210 | 7.6 | 5.0 | 833 | 3800 | 2798 | 13.5 | 134 | 11.7 | ||
| male: 30–34 y | 209 | 9.1 | 4.0 | 788 | 3800 | 2412 | 14.2 | 132 | 11.1 | ||
| male: 35–39 y | 203 | 7.8 | 4.7 | 894 | 3900 | 2608 | 14.3 | 151 | 12.4 | ||
| male: 40–44 y | 194 | 7.5 | 5.6 | 729 | 3800 | 2396 | 13.4 | 130 | 11.5 | ||
| male: 45–49 y | 196 | 5.9 | 5.7 | 685 | 3900 | 2416 | 13.1 | 125 | 11.2 | ||
| male: 50–54 y | 205 | 10.9 | 6.4 | 777 | 4000 | 3014 | 13.7 | 135 | 12.0 | ||
| male: 55–59 y | 186 | 7.0 | 7.6 | 621 | 3500 | 2607 | 12.9 | 120 | 10.4 | ||
| male: 60–64 y | 191 | 9.7 | 6.6 | 652 | 3700 | 2580 | 13.1 | 121 | 11.1 | ||
| male: 65–69 y | 173 | 7.9 | 7.9 | 720 | 3600 | 2396 | 12.2 | 134 | 10.4 | ||
| male: 70–74 y | 182 | 8.4 | 6.6 | 636 | 3400 | 2395 | 13.0 | 125 | 10.8 | ||
| Finland | The national FINDIET 2012 survey | 2012 | |||||||||
| female: 25–34 y | 243 | 5.3 | 8.2 | 1206 | 3500 | 2600 | 10.0 | 190 | 11.0 | ||
| female: 35–44 y | 233 | 5.1 | 9.0 | 1155 | 3400 | 2700 | 11.0 | 190 | 11.0 | ||
| female: 45–54 y | 230 | 4.9 | 8.2 | 952 | 3300 | 2500 | 10.0 | 190 | 10.0 | ||
| female: 55–64 y | 233 | 4.7 | 9.1 | 1002 | 3400 | 2500 | 10.0 | 190 | 10.0 | ||
| female: 65–74 y | 219 | 5.1 | 8.7 | 921 | 3200 | 2200 | 9.0 | 173 | 9.0 | ||
| male: 25–34 y | 277 | 6.9 | 10.7 | 1424 | 4200 | 3700 | 12.0 | 235 | 14.0 | ||
| male: 35–44 y | 272 | 7.3 | 11.5 | 1251 | 4100 | 3400 | 13.0 | 235 | 13.0 | ||
| male: 45–54 y | 277 | 8.0 | 11.2 | 1195 | 4200 | 3700 | 13.0 | 235 | 13.0 | ||
| male: 55–64 y | 257 | 6.4 | 11.9 | 1099 | 3900 | 3300 | 12.0 | 235 | 12.0 | ||
| male: 65–74 y | 255 | 6.7 | 12.8 | 1056 | 3900 | 3100 | 12.0 | 209 | 12.0 | ||
| France | INCA2 | 2006–2007 | |||||||||
| female: 18–79 y | 268 | 5.1 | 2.4 | 850 | 2681 | 2533 | 11.5 | 117 | 9.1 | ||
| male: 18–79 y | 307 | 6.5 | 2.7 | 984 | 3287 | 3447 | 14.9 | 136 | 12.4 | ||
| Germany | German National Nutrition Survey II | 2005–2007 | |||||||||
| female: 19–24 y | 318 | 4.0 | 2.0 | 1039 | 2997 | 2355 | 11.6 | 173 | 9.1 | ||
| female: 25–34 y | 311 | 4.4 | 2.6 | 1061 | 3260 | 2533 | 12.6 | 192 | 9.8 | ||
| female: 35–50 y | 285 | 4.4 | 2.7 | 1067 | 3331 | 2579 | 12.8 | 200 | 9.8 | ||
| female: 51–64 y | 281 | 4.6 | 3.4 | 1011 | 3391 | 2522 | 12.6 | 204 | 9.6 | ||
| female: 65–80 y | 264 | 4.3 | 3.4 | 918 | 3125 | 2376 | 11.4 | 190 | 8.8 | ||
| male: 19–24 y | 394 | 6.9 | 3.0 | 1281 | 3812 | 3739 | 15.6 | 257 | 13.2 | ||
| male: 325–34 y | 372 | 6.9 | 3.5 | 1252 | 3890 | 3620 | 15.9 | 255 | 13.2 | ||
| male: 35–50 y | 337 | 6.5 | 3.8 | 1167 | 3939 | 3582 | 15.7 | 256 | 12.7 | ||
| male: 51–64 y | 316 | 6.4 | 4.2 | 1071 | 3769 | 3346 | 14.7 | 246 | 11.7 | ||
| male: 65–80 y | 282 | 5.9 | 4.4 | 970 | 3498 | 3058 | 13.6 | 232 | 10.9 | ||
| Hungary | Hungarian Dietary Survey 2009 | 2009 | |||||||||
| female: 19–30 y | 130 | 3.1 | 2.0 | 691 | 2600 | 5000 | 9.6 | 7.9 | |||
| female: 31–60 y | 133 | 2.9 | 2.0 | 647 | 2600 | 5200 | 9.7 | 7.7 | |||
| female: 60+ | 129 | 2.6 | 1.9 | 636 | 2600 | 4900 | 9.2 | 7.0 | |||
| male: 19–30 y | 167 | 3.6 | 2.8 | 772 | 3200 | 7100 | 12.8 | 10.6 | |||
| male: 31–60 y | 166 | 3.9 | 2.7 | 698 | 3200 | 7400 | 12.9 | 10.5 | |||
| male: 60+ | 142 | 3.0 | 2.3 | 635 | 2900 | 6200 | 11.1 | 8.8 | |||
| Iceland | The Diet of Icelanders—a national dietary survey 2010–2011 | 2010–2011 | |||||||||
| female: 18–30 y | 270 | 4.6 | 4.6 | 930 | 2543 | 2677 | 10.3 | 116 | 9.4 | ||
| female: 31–60 y | 259 | 5.3 | 6.4 | 840 | 2708 | 2631 | 9.7 | 138 | 9.1 | ||
| female: 61–80 y | 209 | 6.6 | 8.6 | 694 | 2517 | 2474 | 8.2 | 168 | 7.8 | ||
| male: 18–30 y | 343 | 7.5 | 6.6 | 1215 | 3429 | 4057 | 13.3 | 169 | 13.9 | ||
| male: 31–60 y | 309 | 7.7 | 9.3 | 1047 | 3489 | 3775 | 12.9 | 200 | 12.4 | ||
| male: 61–80 y | 258 | 10.8 | 13.4 | 847 | 3308 | 3520 | 11.0 | 204 | 11.2 | ||
| Ireland | National adult nutrition survey | 2008–2010 | |||||||||
| female: 18–64 y | 339 | 8.0 | 3.9 | 824 | 2690 | 2268 | 13.7 | 9.0 | |||
| female: 18–35 y | 337 | 11.1 | 3.1 | 794 | 2507 | 2385 | 15.1 | 8.5 | |||
| female: 36–50 y | 301 | 5.4 | 3.5 | 824 | 2781 | 2220 | 12.8 | 8.7 | |||
| female: 51–64 y | 399 | 6.9 | 6.0 | 874 | 2855 | 2145 | 12.8 | 10.1 | |||
| female: 65+ y | 357 | 6.5 | 8.5 | 995 | 2721 | 2035 | 13.8 | 10.7 | |||
| male: 18–64 y | 407 | 7.3 | 4.6 | 1060 | 3491 | 3122 | 15.1 | 11.8 | |||
| male: 18–35 y | 426 | 7.4 | 3.9 | 1122 | 3568 | 3291 | 15.6 | 12.4 | |||
| male: 36–50 y | 383 | 7.4 | 4.7 | 1036 | 3463 | 3123 | 14.8 | 11.6 | |||
| male: 51–64 y | 404 | 7.2 | 5.7 | 981 | 3388 | 2817 | 14.3 | 11.2 | |||
| male: 65+ y | 427 | 6.4 | 5.2 | 908 | 3038 | 2689 | 18.1 | 10.2 | |||
| Italy | The third Italian National food consumption survey INRAN-SCAI | 2005–2006 | |||||||||
| female: 18–64.9 | 5.5 | 2.3 | 730 | 2861 | 10.4 | 10.6 | |||||
| female: 65+ | 4.4 | 1.8 | 754 | 2822 | 10.0 | 9.9 | |||||
| male: 18–64.9 | 6.6 | 2.6 | 799 | 3218 | 12.6 | 12.6 | |||||
| male: 65+ | 6.5 | 2.5 | 825 | 3300 | 13.2 | 12.2 | |||||
| Latvia | Latvian National Food Consumption Survey 2007–2009 | 2007–2009 | |||||||||
| female: ALL | 457 | 2250 | 9.1 | 53 | 7.2 | ||||||
| male: ALL | 555 | 2868 | 12.1 | 68 | 10.1 | ||||||
| female: 17–26 y | 218 | 3.3 | 1.4 | 2240 | |||||||
| female: 27–36 y | 214 | 3.6 | 1.6 | 1920 | |||||||
| female: 37–46 y | 213 | 3.9 | 1.9 | 2640 | |||||||
| female: 47–56 y | 212 | 3.7 | 2.5 | 2320 | |||||||
| female: 57–64 y | 208 | 4.5 | 2.2 | 2160 | |||||||
| male: 17–26 y | 218 | 3.3 | 1.4 | 3480 | |||||||
| male: 27–36 y | 214 | 3.6 | 1.6 | 3960 | |||||||
| male: 37–46 y | 213 | 3.9 | 1.9 | 3680 | |||||||
| male: 47–56 y | 212 | 3.7 | 2.5 | 3400 | |||||||
| male: 57–64 y | 208 | 4.5 | 2.2 | 3600 | |||||||
| Lithuania | Study and evaluation of actual nutrition and nutrition habits of Lithuanian adult population | 2013–2014 | |||||||||
| female: 19–75 y | 481 | 1.2 | 3.4 | 535 | 2556 | 2842 | 10.3 | 30 | 8.1 | ||
| male: 19–75 y | 366 | 1.0 | 3.1 | 506 | 2322 | 2348 | 8.9 | 28 | 7.0 | ||
| all: 19–34 y | 643 | 1.5 | 3.7 | 576 | 2887 | 2538 | 12.2 | 33 | 9.6 | ||
| all: 35–49 y | 350 | 1.4 | 3.2 | 575 | 2654 | 245 | 10.7 | 30 | 8.6 | ||
| all: 50–64 y | 459 | 1.0 | 1.5 | 531 | 2625 | 2935 | 10.7 | 32 | 8.3 | ||
| all: 65–75 y | 669 | 1.2 | 4.9 | 518 | 2519 | 2882 | 10.0 | 30 | 7.7 | ||
| The Netherlands | Dutch National Food Consumption Survey (DNFCS) 2007–2010 | 2007–2010 | |||||||||
| female: 19–30 y | 232 | 3.9 | 2.8 | 954 | 2847 | 2429 | 9.3 | 156 | 9.2 | ||
| female: 31–50 y | 243 | 4.3 | 3.1 | 993 | 3112 | 2428 | 10.1 | 158 | 9.5 | ||
| female: 51–69 y | 281 | 4.8 | 3.5 | 1031 | 3296 | 2301 | 10.4 | 160 | 9.9 | ||
| male: 19–30 y | 293 | 5.3 | 3.9 | 1133 | 3774 | 3394 | 11.6 | 210 | 12.0 | ||
| male: 31–50 y | 302 | 5.4 | 3.9 | 1171 | 4048 | 3177 | 12.4 | 202 | 12.5 | ||
| male: 51–69 y | 330 | 5.8 | 4.4 | 1149 | 3866 | 2920 | 11.8 | 192 | 12.3 | ||
| Norway | Norkost3 | 2010–2011 | |||||||||
| female: 18–70 y | 231 | 6.0 | 4.9 | 811 | 3400 | 2500 | 9.9 | ||||
| male: 18–70 y | 279 | 8.9 | 6.7 | 1038 | 4200 | 3600 | 13.0 | ||||
| female: 18–29 y | 219 | 5.7 | 3.9 | 834 | 3100 | 2500 | 9.4 | ||||
| female: 30–39 y | 247 | 5.3 | 4.3 | 836 | 3400 | 2600 | 11.0 | ||||
| female: 40–49 y | 231 | 6.1 | 5.0 | 828 | 3400 | 2600 | 10.0 | ||||
| female: 50–59 y | 233 | 6.4 | 5.2 | 784 | 3500 | 2500 | 10.0 | ||||
| female: 60–70 y | 224 | 6.4 | 5.8 | 768 | 3400 | 2300 | 9.3 | ||||
| male: 18–29 y | 314 | 8.9 | 5.5 | 1248 | 4300 | 4000 | 14.0 | ||||
| male: 30–39 y | 295 | 8.9 | 6.1 | 1202 | 4200 | 4000 | 13.0 | ||||
| male: 40–49 y | 257 | 8.4 | 6.0 | 1009 | 4200 | 3500 | 12.0 | ||||
| male: 50–59 y | 275 | 8.9 | 7.3 | 955 | 4300 | 3500 | 12.0 | ||||
| male: 60–70 y | 269 | 9.1 | 7.8 | 900 | 4300 | 3100 | 12.0 | ||||
| Portugal | National Food and Physical Activity Survey (IAN-AF) | 2015–2016 | |||||||||
| female: 18–64 y | 245.7 | 4.8 | 3.5 | 731 | 2990 | 2690 | 10.9 | 9.4 | |||
| female: 65–84 y | 260.1 | 4.2 | 3.5 | 724 | 3044 | 2449 | 10.3 | 8.3 | |||
| male: 18–64 y | 285.7 | 5.7 | 4.1 | 830 | 3901 | 3700 | 14.2 | 12.4 | |||
| male: 65–84 y | 264.6 | 4.8 | 3.8 | 764 | 3639 | 3260 | 13.4 | 10.2 | |||
| Spain | ENIDE 2011 | 2009–2010 | |||||||||
| female: 18–24 y | 234 | 5.2 | 3.2 | 789 | 2590 | 2328 | 12.5 | 75 | 8.6 | ||
| female: 25–44 y | 265 | 5.8 | 3.5 | 851 | 2838 | 2420 | 14.1 | 87 | 8.8 | ||
| female: 45–64 y | 281 | 6.7 | 4.0 | 839 | 3007 | 2283 | 13.8 | 87 | 8.7 | ||
| male: 18–24 y | 287 | 7.7 | 4.1 | 958 | 2905 | 2756 | 15.9 | 95 | 11.2 | ||
| male: 25–44 y | 288 | 7.9 | 4.3 | 898 | 2998 | 2730 | 16.1 | 100 | 10.4 | ||
| male: 45–64 y | 309 | 8.1 | 4.3 | 840 | 3160 | 2652 | 16.2 | 103 | 10.1 | ||
| Sweden | Riksmaten 2010–11 Swedish Adult Dietary Survey | 2010–2011 | |||||||||
| female: 18–30 y | 223 | 4.0 | 5.2 | 806 | 2659 | 2767 | 8.9 | 9.2 | |||
| female: 31–44 y | 247 | 4.8 | 6.2 | 849 | 2865 | 2876 | 9.7 | 9.9 | |||
| female: 45–64 y | 263 | 5.0 | 6.6 | 805 | 2971 | 2755 | 9.9 | 9.7 | |||
| female: 65–80 y | 275 | 6.4 | 7.6 | 826 | 3013 | 2546 | 9.4 | 9.1 | |||
| male: 18–30 y | 244 | 5.8 | 6.6 | 975 | 3139 | 3649 | 10.8 | 12.6 | |||
| male: 31–44 y | 263 | 5.5 | 6.9 | 991 | 3433 | 3819 | 11.7 | 13.0 | |||
| male: 45–64 y | 271 | 6.1 | 7.7 | 937 | 3523 | 3638 | 11.9 | 12.6 | |||
| male: 65–80 y | 279 | 6.6 | 9.1 | 885 | 3392 | 3214 | 11.0 | 10.9 | |||
| Turkey | Turkey nutrition and health survey 2010 (TNHS) | 2010 | |||||||||
| female: 19–30 y | 308 | 3.1 | 0.9 | 566 | 2211 | 1596 | 9.9 | 57 | 8.4 | ||
| female: 31–50 y | 334 | 2.7 | 0.9 | 605 | 2311 | 1686 | 10.4 | 60 | 8.6 | ||
| female: 51–64 y | 335 | 2.3 | 0.7 | 606 | 2357 | 1636 | 10.3 | 59 | 8.2 | ||
| female: 65–74 y | 296 | 2.0 | 0.5 | 547 | 2063 | 1572 | 9.5 | 53 | 7.6 | ||
| female: 75+ y | 271 | 2.0 | 1.0 | 495 | 1855 | 1426 | 8.1 | 49 | 6.3 | ||
| male: 19–30 y | 385 | 4.4 | 1.1 | 676 | 2511 | 2411 | 12.4 | 67 | 11.2 | ||
| male: 31–50 y | 410 | 4.7 | 1.3 | 744 | 2717 | 2353 | 13.0 | 74 | 11.5 | ||
| male: 51–64 y | 400 | 3.7 | 1.3 | 713 | 2687 | 2197 | 12.2 | 68 | 10.3 | ||
| male: 65–74 y | 375 | 2.8 | 1.2 | 677 | 2537 | 1938 | 11.1 | 64 | 9.2 | ||
| male: 75+ y | 329 | 2.3 | 0.6 | 593 | 2192 | 1811 | 10.2 | 55 | 8.4 | ||
| UK | National Diet and Nutrition Survey (NDNS) Years 1–4 | 2008–2012 | |||||||||
| female: 19–64 | 228 | 4.6 | 2.6 | 728 | 2532 | 1995 | 9.6 | 140 | 7.6 | ||
| female: 65+ y | 241 | 5.5 | 2.9 | 796 | 2649 | 2680 | 9.4 | 169 | 7.6 | ||
| male: 19–64 | 287 | 5.7 | 3.1 | 888 | 3039 | 2600 | 11.7 | 180 | 9.7 | ||
| male: 65+ y | 295 | 7.6 | 3.9 | 924 | 3063 | 3480 | 11.1 | 213 | 9.2 | ||
| all: 19–64 | 258 | 5.1 | 2.8 | 807 | 2785 | 2297 | 10.7 | 160 | 8.6 | ||
| all: 65+ y | 265 | 6.4 | 3.3 | 852 | 2831 | 3040 | 10.2 | 188 | 8.3 |
References
- WHO. European Food and Nutrition Action Plan 2015–2020; WHO Regional Office for Europe: Copenhagen, Denmark, 2014. [Google Scholar]
- Alwan, A. Global Status Report on Noncommunicable Diseases 2010; World Health Organization: Geneva, Switzerland, 2011. [Google Scholar]
- Lim, S.S.; Vos, T.; Flaxman, A.D.; Danaei, G.; Shibuya, K.; Adair-Rohani, H.; AlMazroa, M.A.; Amann, M.; Andersson, H.R.; Andrews, K.G.; et al. A comparative risk assessment of burden of disease and injury attributable to 67 risk factors and risk factor clusters in 21 regions, 1990–2010: A systematic analysis for the Global Burden of Disease Study 2010. Lancet 2013, 380, 2224–2260. [Google Scholar] [CrossRef]
- Imamura, F.; Micha, R.; Khatibzadeh, S.; Fahimi, S.; Shi, P.; Powles, J.; Mozaffarian, D.; Global Burden of Diseases Chronic Expert Group. Dietary quality among men and women in 187 countries in 1990 and 2010: A systematic assessment. Lancet Glob. Health 2015, 3, e132–e142. [Google Scholar] [CrossRef]
- Rippin, H.L.; Hutchinson, J.; Evans, C.E.; Jewell, J.; Breda, J.J.; Cade, J.E. How much do we know about dietary intake across Europe? A review and characterisation of national surveys. Food Nutr. Res. 2017. submitted. [Google Scholar]
- Novaković, R.; Cavelaars, A.E.J.M.; Bekkering, G.E.; Roman-Vinas, B.; Ngo, J.; Gurinovic, M.; Glibetic, M.; Nikolic, M.; Golesorkhi, M.; Medina, M.W. Micronutrient intake and status in Central and Eastern Europe compared with other European countries, results from the EURRECA network. Public Health Nutr. 2013, 16, 824–840. [Google Scholar]
- Del Gobbo, L.C.; Khatibzadeh, S.; Imamura, F.; Micha, R.; Shi, P.; Smith, M.; Myers, S.S.; Mozaffarian, D. Assessing global dietary habits: A comparison of national estimates from the FAO and the Global Dietary Database. Am. J. Clin. Nutr. 2015, 101, 1038–1046. [Google Scholar] [CrossRef] [PubMed]
- EFCOSUM. European Food Consumption Survey Method Final Report; TNO Nutrition and Food Research: Zeist, The Netherlands, 2001. [Google Scholar]
- Micha, R.; Khatibzadeh, S.; Shi, P.; Fahimi, S.; Lim, S.; Andrews, K.G.; Engell, R.E.; Powles, J.; Ezzati, M.; Mozaffarian, D. Global, regional, and national consumption levels of dietary fats and oils in 1990 and 2010: A systematic analysis including 266 country-specific nutrition surveys. BMJ 2014, 348, g2272. [Google Scholar] [CrossRef] [PubMed] [Green Version]
- FAO; WHO. Diet, Nutrition and the Prevention of Chronic Diseases; WHO Technical Report Series 916; WHO: Geneva, Switzerland, 2003. [Google Scholar]
- FAO; WHO. WHO Expert Consultation on Human Vitamin and Mineral Requirements. Vitamin and Mineral Requirements in Human Nutrition; World Health Organization: Geneva, Switzerland; Food and Agriculture Organization of the United Nations: Rome, Italy, 2004; pp. 45–58. [Google Scholar]
- WHO. Guideline: Potassium Intake for Adults and Children; World Health Organization: Geneva, Switzerland, 2012. [Google Scholar]
- WHO. Guideline: Sodium Intake for Adults and Children; World Health Organization: Geneva, Switzerland, 2012. [Google Scholar]
- WHO. Guideline: Sugars Intake for Adults and Children; World Health Organization: Geneva, Switzerland, 2015. [Google Scholar]
- Committee on Medical Aspects of Food Policy. Dietary Reference Values for Food Energy and Nutrients for the United Kingdom: Report of the Panel on Dietary Reference Values of the Committee on Medical Aspects of Food Policy; HM Stationery Office: London, UK, 1991.
- World Bank Group. Population, Total. Available online: http://data.worldbank.org/indicator/SP.POP.TOTL?page=2 (accessed on 14 July 2017).
- Ministeri de Salut, B.S.i.F. Evaluation of the Nutritional Status of the Andorran Population. Available online: http://www.salut.ad/images/microsites/AvaluacioNutricional_04-05/index.html (accessed on 28 February 2017).
- Elmadfa, I.; Hasenegger, V.; Wagner, K.; Putz, P.; Weidl, N.-M.; Wottawa, D.; Kuen, T.; Seiringer, G.; Meyer, A.L.; Sturtzel, B.; et al. Austrian Nutrition Report 2012; Institute of Nutrition: Vienna, Austria, 2012. [Google Scholar]
- Bel, S.; Van den Abeele, S.; Lebacq, T.; Ost, C.; Brocatus, L.; Stievenart, C.; Teppers, E.; Tafforeau, J.; Cuypers, K. Protocol of the Belgian food consumption survey 2014: Objectives, design and methods. Arch. Public Health 2016, 74, 20. [Google Scholar] [CrossRef] [PubMed]
- De Ridder, K. Food Consumption Survey 2014–2015: Food Consumption, in Report 4; WIV-ISP: Brussels, Belgium, 2016. [Google Scholar]
- Pedersen, A.; Christensen, T.; Matthiesen, J.; Knudsen, V.K.; Rosenlund-Sorensen, M.; Biltoft-Jensen, A.; Hinsch, H.J.; Ygil, K.H.; Korup, K.; Saxholt, E.; et al. Danskernes Kostvaner 2011–2013; DTU Fødevareinstitute: Søborg, Denmark, 2015. [Google Scholar]
- Helldán, A.; Raulio, S.; Kosola, M.; Tapanainen, H.; Ovaskainen, M.L.; Virtanen, S. Finravinto 2012—Tutkimus—The National FINDIET 2012 Survey; Raportti 2013_016; Suomen Yliopistopaino Oy: Tampere, Finland, 2013. [Google Scholar]
- Agence Française de Sécurité Sanitaire des Aliments (AFSSA). Étude Individuelle Nationale des Consommations Alimentaires 2 (INCA2) (2006–2007); AFSSA: Maisons-Alfort, France, 2009; pp. 1–28. [Google Scholar]
- Hartmann, B.M.; Heuer, T.; Hoffmann, I. The German Nutrient Database: Effect of different versions on the calculated energy and nutrient intake of the German population. J. Food Compos. Anal. 2015, 42, 26–29. [Google Scholar] [CrossRef]
- Nationale Verzehrsstudie II. Ergebnisbericht Teil 1; Max Rubner-Institut Karlsruhe: Karlsruhe, Germany, 2008. [Google Scholar]
- Bíró, L.; Szeitz-Szabo, M.; Biro, G.; Sali, J. Dietary survey in Hungary, 2009. Part II: Vitamins, macro- and microelements, food supplements and food allergy. Acta Aliment. 2011, 40, 301–312. [Google Scholar] [CrossRef]
- Szeitz-Szabó, M.; Biro, L.; Biro, G.; Sali, J. Dietary survey in Hungary, 2009. Part I. Macronutrients, alcohol, caffeine, fibre. Acta Aliment. 2011, 40, 142–152. [Google Scholar] [CrossRef]
- Steingrimsdottir, L.; Valgeirsdottir, H.; Halldorsson, P.I.; Gunnarsdottir, I.; Gisladottir, E.; Porgeirsdottir, H.; Prosdottir, I. National nutrition surveys and dietary changes in Iceland. Læknablaðið 2014, 100, 659–664. [Google Scholar]
- Þorgeirsdóttir, H.; Valgeirsdottir, H.; Gunnarsdottir, I.; Gisladottir, E.; Gunnarsdottir, B.E.; Porsdottir, I.; Stefansdottir, J.; Steingrimsdottir, L. Hvað Borða Íslendingar? Könnun á Mataræði Íslendinga 2010–2011 Helstu Niðurstöður; Embætti landlæknis, Matvælastofnun, Rannsóknastofa í næringarfræði við Háskóla Íslands, Landspítala-háskólasjúkrahús: Reykjavík, Iceland, 2011. [Google Scholar]
- Irish Universities Nutrition Alliance (IUNA). National Adult Nutrition Survey: Summary Report on Food and Nutrient Intakes, Physical Measurements, Physical Activity Patterns and Food Choice Motives; Irish Universities Nutrition Alliance: Dublin, Ireland, 2011. [Google Scholar]
- Li, K.; McNulty, B.A.; Tiernery, A.M.; Devlin, N.F.C.; Joyce, T.; Leite, J.C.; Flynn, A.; Walton, J.; Brennan, L.; Gibney, M.J. Dietary fat intakes in Irish adults in 2011: How much has changed in 10 years? Br. J. Nutr. 2016, 115, 1798–1809. [Google Scholar] [CrossRef] [PubMed]
- Sette, S.; Le Donne, C.; Piccinelli, R.; Arcella, D.; Turrini, A.; Leclercq, C. The third Italian National Food Consumption Survey, INRAN-SCAI 2005-06—Part 1: Nutrient intakes in Italy. Nutr. Metab. Cardiovasc. Dis. 2011, 21, 922–932. [Google Scholar] [CrossRef] [PubMed]
- Joffe, R.; Ozolins, G.; Santare, D.; Bartkevics, V.; Mike, L.; Briska, I. The National Food Consumption Survey of LATVIA, 2007–2009; National Diagnostic Centre, Food and Veterinary Service Food Centre, Eds.; Zemkopibas Ministrija: Riga, Latvia, 2009.
- Barzda, A.; Bartkeviciute, R.; Baltusyte, I.; Stukas, R.; Bartkeviciute, S. Suaugusių ir pagyvenusių Lietuvos gyventojų faktinės mitybos ir mitybos įpročių tyrimas. Visuom. Sveik. 2016, 72, 85–94. [Google Scholar]
- Van Rossum, C.; Fransen, H.P.; Verkaik-Kloosterman, J.; Buurma, E.M.; Ocke, M. Dutch National Food Consumption Survey 2007–2010: Part 6 Micronutrients; RIVM: Bilthoven, The Netherlands, 2011.
- Van Rossum, C.; Fransen, H.P.; Verkaik-Kloosterman, J.; Buurma, E.M.; Ocke, M. Dutch National Food Consumption Survey 2007–2010: Part 5 Macronutrients; RIVM: Bilthoven, The Netherlands, 2011.
- Van Rossum, C.; Fransen, H.P.; Verkaik-Kloosterman, J.; Buurma-Rethans, E.J.M.; Ocke, M.C. Dutch National Food Consumption Survey 2007–2010: Diet of Children and Adults Aged 7 to 69 Years; RIVM: Bilthoven, The Netherlands, 2011.
- Totland, T.; Melnaes, B.K.; Lundberg-Hallen, N.; Helland-Kigen, K.M.; Lund-Blix, N.A.; Myhre, J.B.; Johansen, A.M.W.; Loken, E.B.; Andersen, L.F. Norkost 3. En Landsomfattende Kostholdsundersøkelse Blant Menn og Kvinner i Norge i Aldermen; Helsedirektoratet: Oslo, Norway, 2012; pp. 18–70. [Google Scholar]
- Lopes, C.; Torres, D.; Oliveira, A.; Severo, M.; Alarcao, V.; Guiomar, S.; Mota, J.; Teixeira, P.; Ramos, E.; Rodrigues, S.; et al. Inquérito Alimentar Nacional e de Atividade Física (IAN-AF), 2015–2016 Part 1 Methodological Report; University of Porto: Porto, Portugal, 2017. [Google Scholar]
- Lopes, C.; Torres, D.; Oliveira, A.; Severo, M.; Alarcao, V.; Guiomar, S.; Mota, J.; Teixeira, P.; Rodrigues, S.; Lobato; et al. Inquérito Alimentar Nacional e de Atividade Física (IAN-AF), 2015–2016 Part 2 Report; University of Porto: Porto, Portugal, 2017. [Google Scholar]
- AESAN; ENIDE. Encuesta Nacional de Ingesta Dietética Española 2011; Ministerio de Sanidad, Politica Social e Igualdad: Madrid, Spain, 2011. [Google Scholar]
- AESAN. Evaluación Nutricional de la Dieta Española. i Energía y Macronutrientes Sobre Datos de la Encuesta Nacional de Ingesta Dietética (ENIDE); Ministerio de Sanidad, Servicios Sociales e Igualdad: Madrid, Spain, 2011.
- AESAN. Evaluación Nutricional de la Dieta Española. ii Micronutrientes Sobre Datos de la Encuesta Nacional de Ingesta Dietética (ENIDE); Ministerio de Sanidad, Servicios Sociales e Igualdad: Madrid, Spain, 2011.
- Estévez-Santiago, R.; Beltrán-de-Miguel, B.; Olmedilla-Alonso, B. Assessment of dietary lutein, zeaxanthin and lycopene intakes and sources in the spanish survey of dietary intake (2009–2010). Int. J. Food Sci. Nutr. 2016, 67, 305–313. [Google Scholar] [CrossRef] [PubMed]
- Amcoff, E. Riksmaten-Vuxna 2010–2011 Livsmedels-Och Näringsintag Bland Vuxna i Sverige; Livsmedelsverket: Stockholm, Sweden, 2012.
- Güler, S.; Budakoglu, I.; Besler, H.T.; Pekcan, A.G.; Turkyilmaz, A.S.; Cingi, H.; Buzgan, T.; Zengin, N.; Dilmen, U.; Tosun, N.; et al. Methodology of National Turkey Nutrition and Health survey (TNHS) 2010. Med. J. Islam. World Acad. Sci. 2014, 22, 7–29. [Google Scholar] [CrossRef]
- Turkey Ministry of Health. Türkiye Beslenme ve Sağlık Araştırması 2010: Beslenme Durumu ve Alışkanlıklarının Değerlendirilmesi Sonuç Raporu; Türkiye Cumhuriyeti Sağlık Bakanlığı Sağlık: Ankara, Turkey, 2014.
- Bates, B.; Lennox, A.; Prentice, A.; Bates, C.; Page, P.; Nicholson, S.; Swan, G. National Diet and Nutrition Survey: Results from Years 1, 2, 3 and 4 Combined of the Rolling Program (2008/9–2011/12); Public Health England: London, UK, 2014.
- Lavie, C.J.; Milani, R.V.; Mehra, M.R.; Ventura, H.O. Omega-3 polyunsaturated fatty acids and cardiovascular diseases. J. Am. Coll. Cardiol. 2009, 54, 585–594. [Google Scholar] [CrossRef] [PubMed]
- Bath, S.C.; Steer, C.D.; Golding, J.; Emmett, P.; Rayman, M.P. Effect of inadequate iodine status in UK pregnant women on cognitive outcomes in their children: Results from the Avon Longitudinal Study of Parents and Children (ALSPAC). Lancet 2013, 382, 331–337. [Google Scholar] [CrossRef]
- Poslusna, K.; Ruprich, J.; de Vries, J.H.M.; Jakubikova, M.; van’t Veer, P. Misreporting of energy and micronutrient intake estimated by food records and 24 hour recalls, control and adjustment methods in practice. Br. J. Nutr. 2009, 101, S73–S85. [Google Scholar] [CrossRef] [PubMed]
- Mozaffarian, D.; Wilson, P.W.; Kannel, W.B. Beyond established and novel risk factors lifestyle risk factors for cardiovascular disease. Circulation 2008, 117, 3031–3038. [Google Scholar] [CrossRef] [PubMed]
- Knoops, K.T.; de Groot, L.C.P.G.M.; Kromhout, D.; Perrin, A.-E.; Moreiras-Varela, O.; Menotti, A.; Van Staveren, W.A. Mediterranean diet, lifestyle factors, and 10-year mortality in elderly European men and women: The HALE project. JAMA 2004, 292, 1433–1439. [Google Scholar] [CrossRef] [PubMed]
- Sofi, F.; Cesari, F.; Abbate, R.; Gensini, G.F.; Casini, A. Adherence to Mediterranean diet and health status: Meta-analysis. BMJ 2008, 337, a1344. [Google Scholar] [CrossRef] [PubMed]
- Department of Health (DH). F3(a). Non use of artificial trans fat; Department of Health: London, UK, 2014.
- Restrepo, B.J.; Rieger, M. Denmark’s policy on artificial trans fat and cardiovascular disease. Am. J. Prev. Med. 2016, 50, 69–76. [Google Scholar] [CrossRef] [PubMed]
- Temme, E.H.; Millenaar, I.L.; Van Donkersgoed, G.; Westenbrink, S. Impact of fatty acid food reformulations on intake of Dutch young adults. Acta Cardiol. 2011, 66, 721. [Google Scholar] [CrossRef] [PubMed]
- WHO. Eliminating Trans Fats in Europe. A Policy Brief. WHO Regional Office for Europe: Copenhagen, Denmark. 2015. Available online: http://www.euro.who.int/__data/assets/pdf_file/0010/288442/Eliminating-trans-fats-in-Europe-A-policy-brief.pdf?ua=1 (accessed on 5 April 2016).
- Crispim, S.; de Vries, J.H.M.; Geelen, A.; Souverein, O.W.; Hulshof, P.J.M.; Lafay, L.; Rousseau, A.-S.; Lillegaard, I.T.L.; Andersen, L.F.; Huybrechts, I.; et al. Biomarker-based evaluation of two 24-h recalls for comparing usual fish, fruit and vegetable intakes across European centers in the EFCOVAL Study. Eur. J. Clin. Nutr. 2011, 65, S38. [Google Scholar] [CrossRef] [PubMed]
- WHO; UNICEF. Iodine Deficiency in Europe: A Continuing Public Health Problem; Anderson, M., de Benoist, B., Darnton-Hill, I., Delange, F., Eds.; World Health Organisation: Geneva, Switzerland, 2007. [Google Scholar]
- DH. F2. Salt Reduction Pledge. 2011. Available online: https://responsibilitydeal.dh.gov.uk/ledges/pledge/?pl=9 (accessed on 24 October 2016).
- WHO. Successful Nutrition Policies—Country Examples; WHO: Copenhagen, Denmark, 2014. [Google Scholar]
- He, F.; Brinsden, H.; MacGregor, G. Salt reduction in the United Kingdom: A successful experiment in public health. J. Hum. Hypertens. 2014, 28, 345–352. [Google Scholar] [CrossRef] [PubMed]
- Andersson, M.; Karumbunathan, V.; Zimmermann, M.B. Global iodine status in 2011 and trends over the past decade. J. Nutr. 2012, 142, 744–750. [Google Scholar] [CrossRef] [PubMed]
- Fagt, S. Nordic Dietary Surveys: Study Designs, Methods, Results and Use in Food-Based Risk Assessments; Nordic Council of Ministers: Copenhagen, Denmark, 2012. [Google Scholar]
- Mensink, G.; Fletcher, R.; Gurinovic, M.; Huybrechts, I.; Lafay, L.; Serra-Majem, L.; Szponar, L.; Tetens, I.; Verkaik-Kloosterman, J.; Baka, A. Mapping low intake of micronutrients across Europe. Br. J. Nutr. 2013, 110, 755–773. [Google Scholar] [CrossRef] [PubMed]
- Busby, A.; Abramsky, L.; Dolk, H.; Armstrong, B. Preventing neural tube defects in Europe: Population based study. BMJ 2005, 330, 574–575. [Google Scholar] [CrossRef] [PubMed]
- Dodd, K.W.; Guenther, P.M.; Freedman, L.S.; Subar, A.F.; Kipnis, V.; Midthune, D.; Tooze, J.A.; Krebs-Smith, S.M. Statistical methods for estimating usual intake of nutrients and foods: A review of the theory. J. Am. Diet. Assoc. 2006, 106, 1640–1650. [Google Scholar] [CrossRef] [PubMed]
- Mongeau, R.; Brassard, R. A comparison of three methods for analyzing dietary fiber in 38 foods. J. Food Compos. Anal. 1989, 2, 189–199. [Google Scholar] [CrossRef]
- Merten, C.; Ferrari, P.; Bakker, M.; Boss, A.; Hearty, A.; Leclercq, C.; Lindtner, O.; Tlustos, C.; Verger, P.; Volatier, J.-L. Methodological characteristics of the national dietary surveys carried out in the European Union as included in the European Food Safety Authority (EFSA) Comprehensive European Food Consumption Database. Food Addit. Contam. Part A 2011, 28, 975–995. [Google Scholar] [CrossRef] [PubMed]
- Hutchinson, J.; Rippin, H.; Jewell, J.; Breda, J.; Cade, J.E. Comparison of high and low trans fatty acid consumers: Analyses of UK National Diet and Nutrition Surveys before and after product reformulation. Public Health Nutr. 2017. [Google Scholar] [CrossRef] [PubMed]
- Holmes, B.; Nelson, M. The strengths and weaknesses of dietary survey methods in materially deprived households in England: A discussion paper. Public Health Nutr. 2009, 12, 1157–1164. [Google Scholar] [CrossRef] [PubMed]
Figure 1.
Mean/median* adult energy intake (MJ/day) for Western European countries (excluding supplements). * Figures for Spain are based on median rather than mean values.
Figure 1.
Mean/median* adult energy intake (MJ/day) for Western European countries (excluding supplements). * Figures for Spain are based on median rather than mean values.

Figure 2.
Mean/median adult energy intake (MJ/day) for Northern European countries (excluding supplements).
Figure 2.
Mean/median adult energy intake (MJ/day) for Northern European countries (excluding supplements).

Figure 3.
Mean/median adult energy intake (MJ/day) for Central & Eastern European countries (excluding supplements).
Figure 3.
Mean/median adult energy intake (MJ/day) for Central & Eastern European countries (excluding supplements).
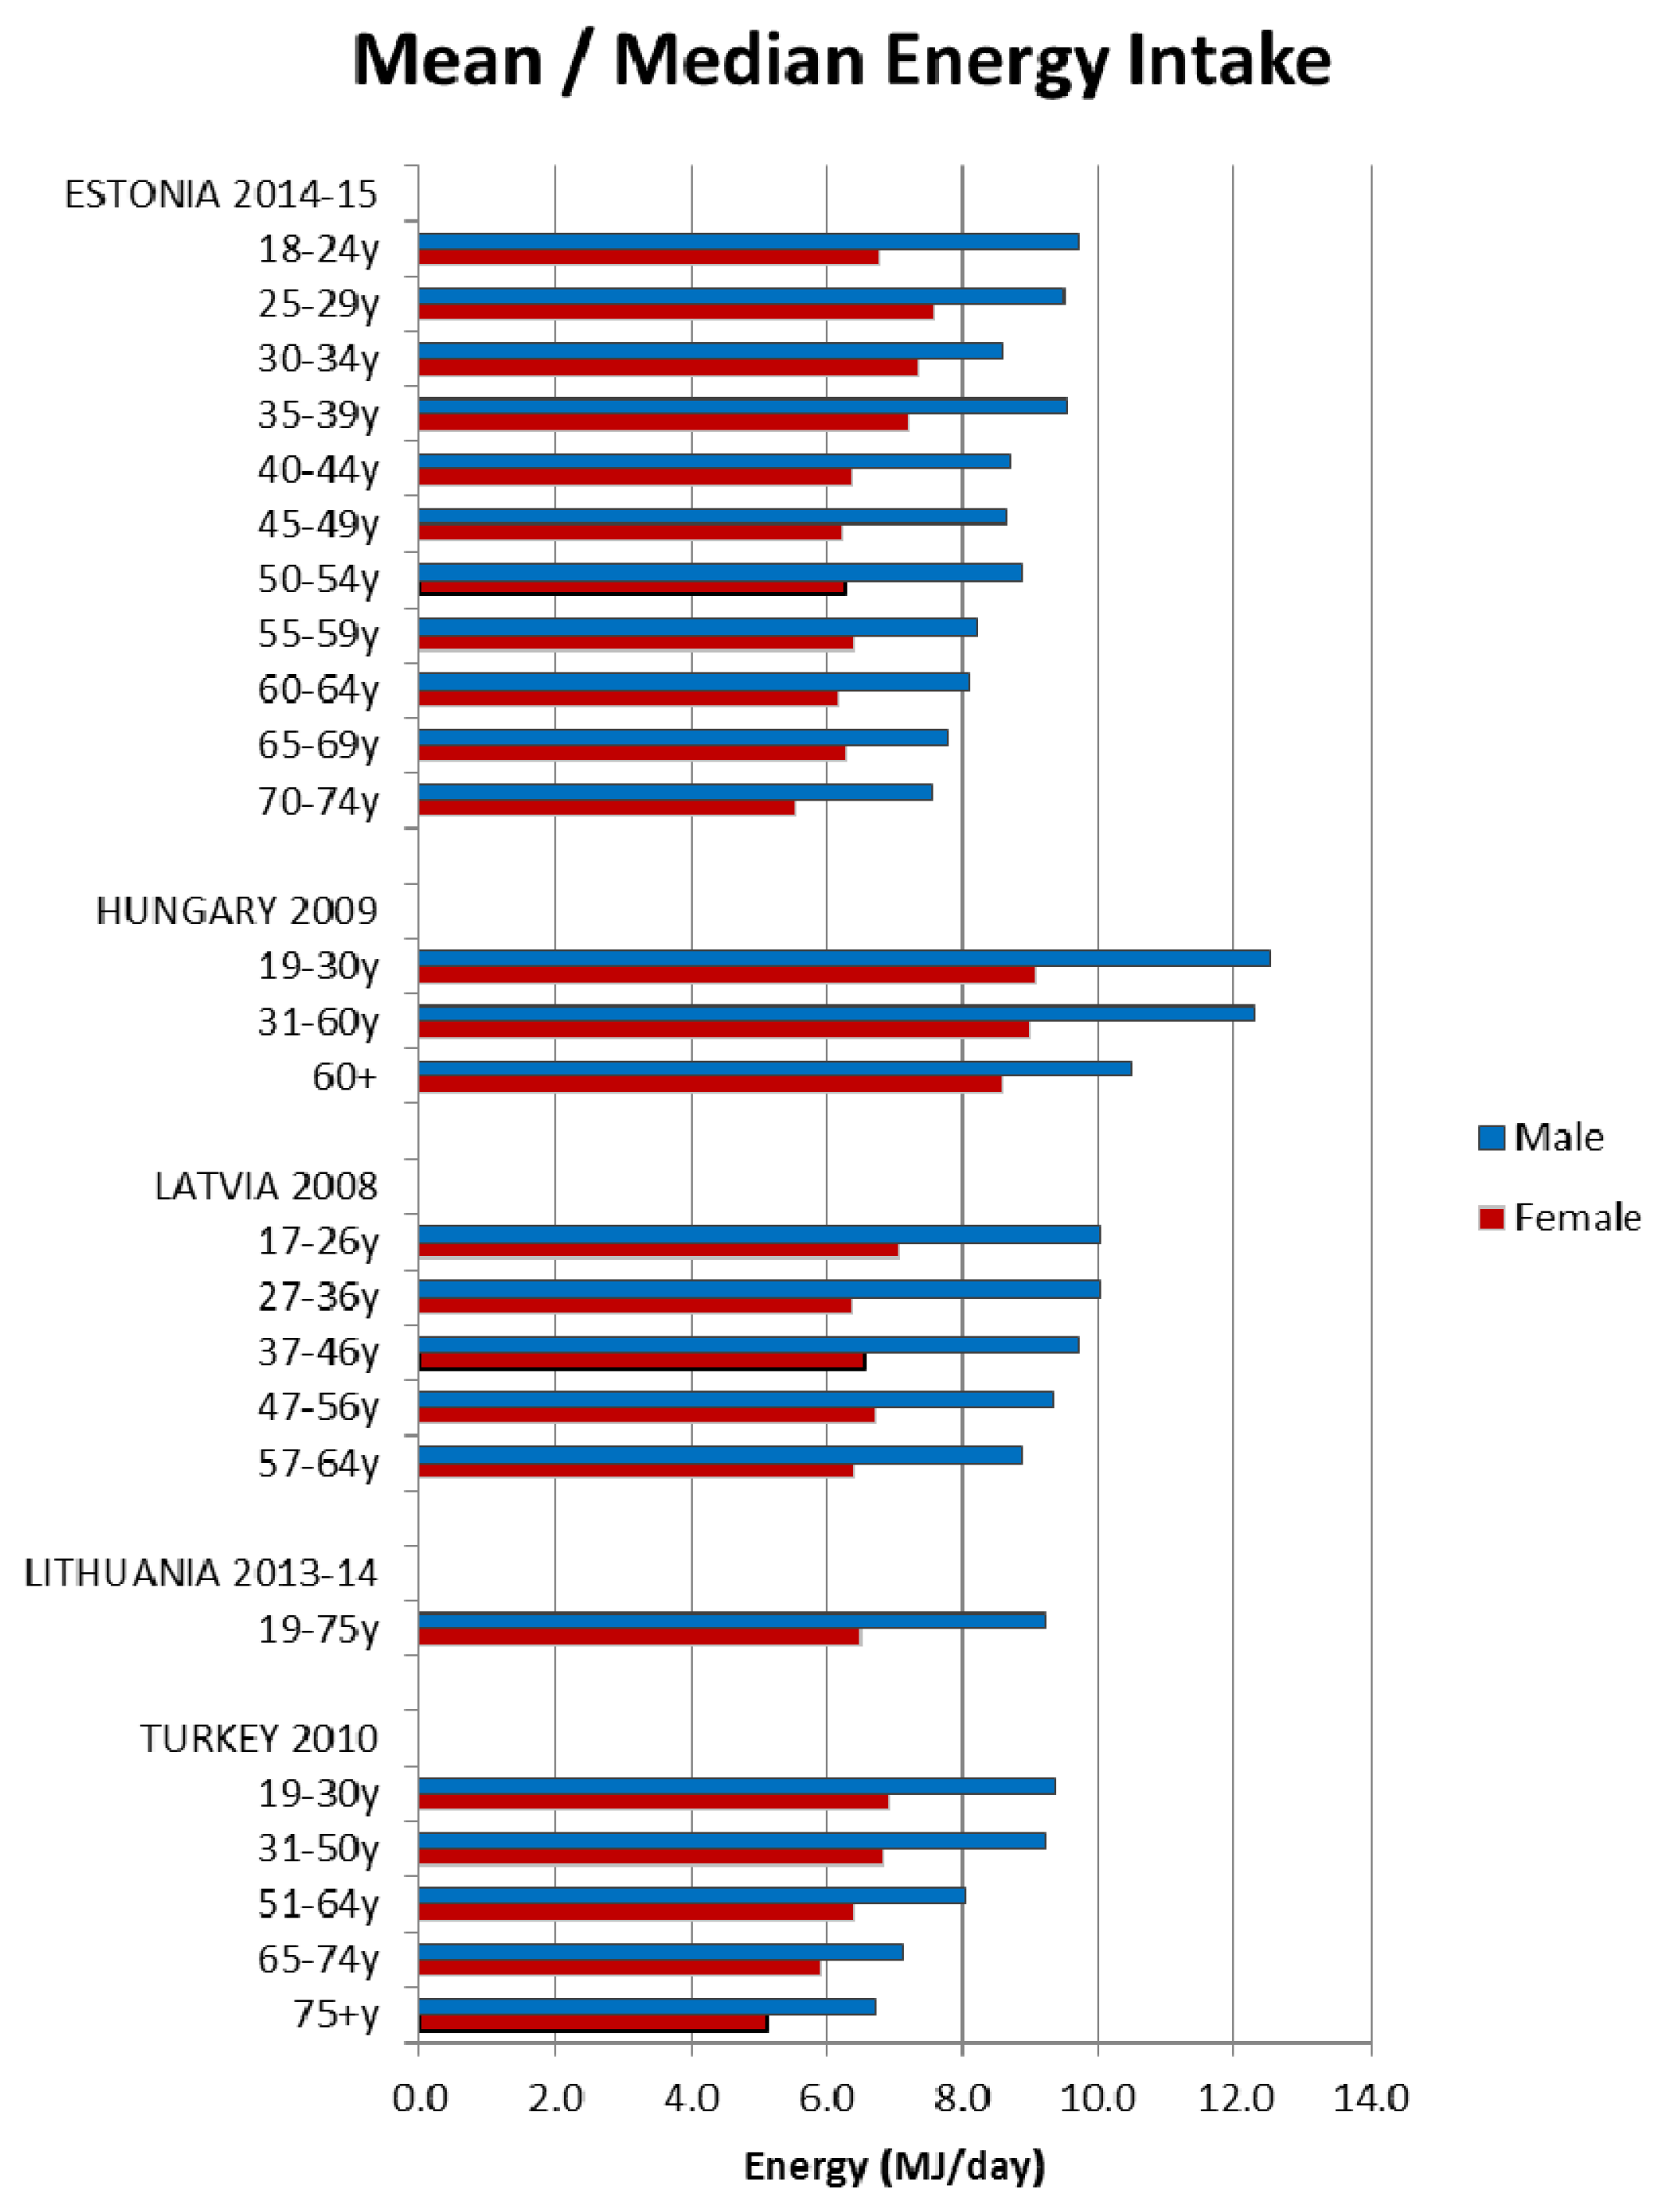
Figure 4.
Mean/median* adult carbohydrate intake (g/day) (excluding supplements). * Figures for Spain are based on median rather than mean values.
Figure 4.
Mean/median* adult carbohydrate intake (g/day) (excluding supplements). * Figures for Spain are based on median rather than mean values.
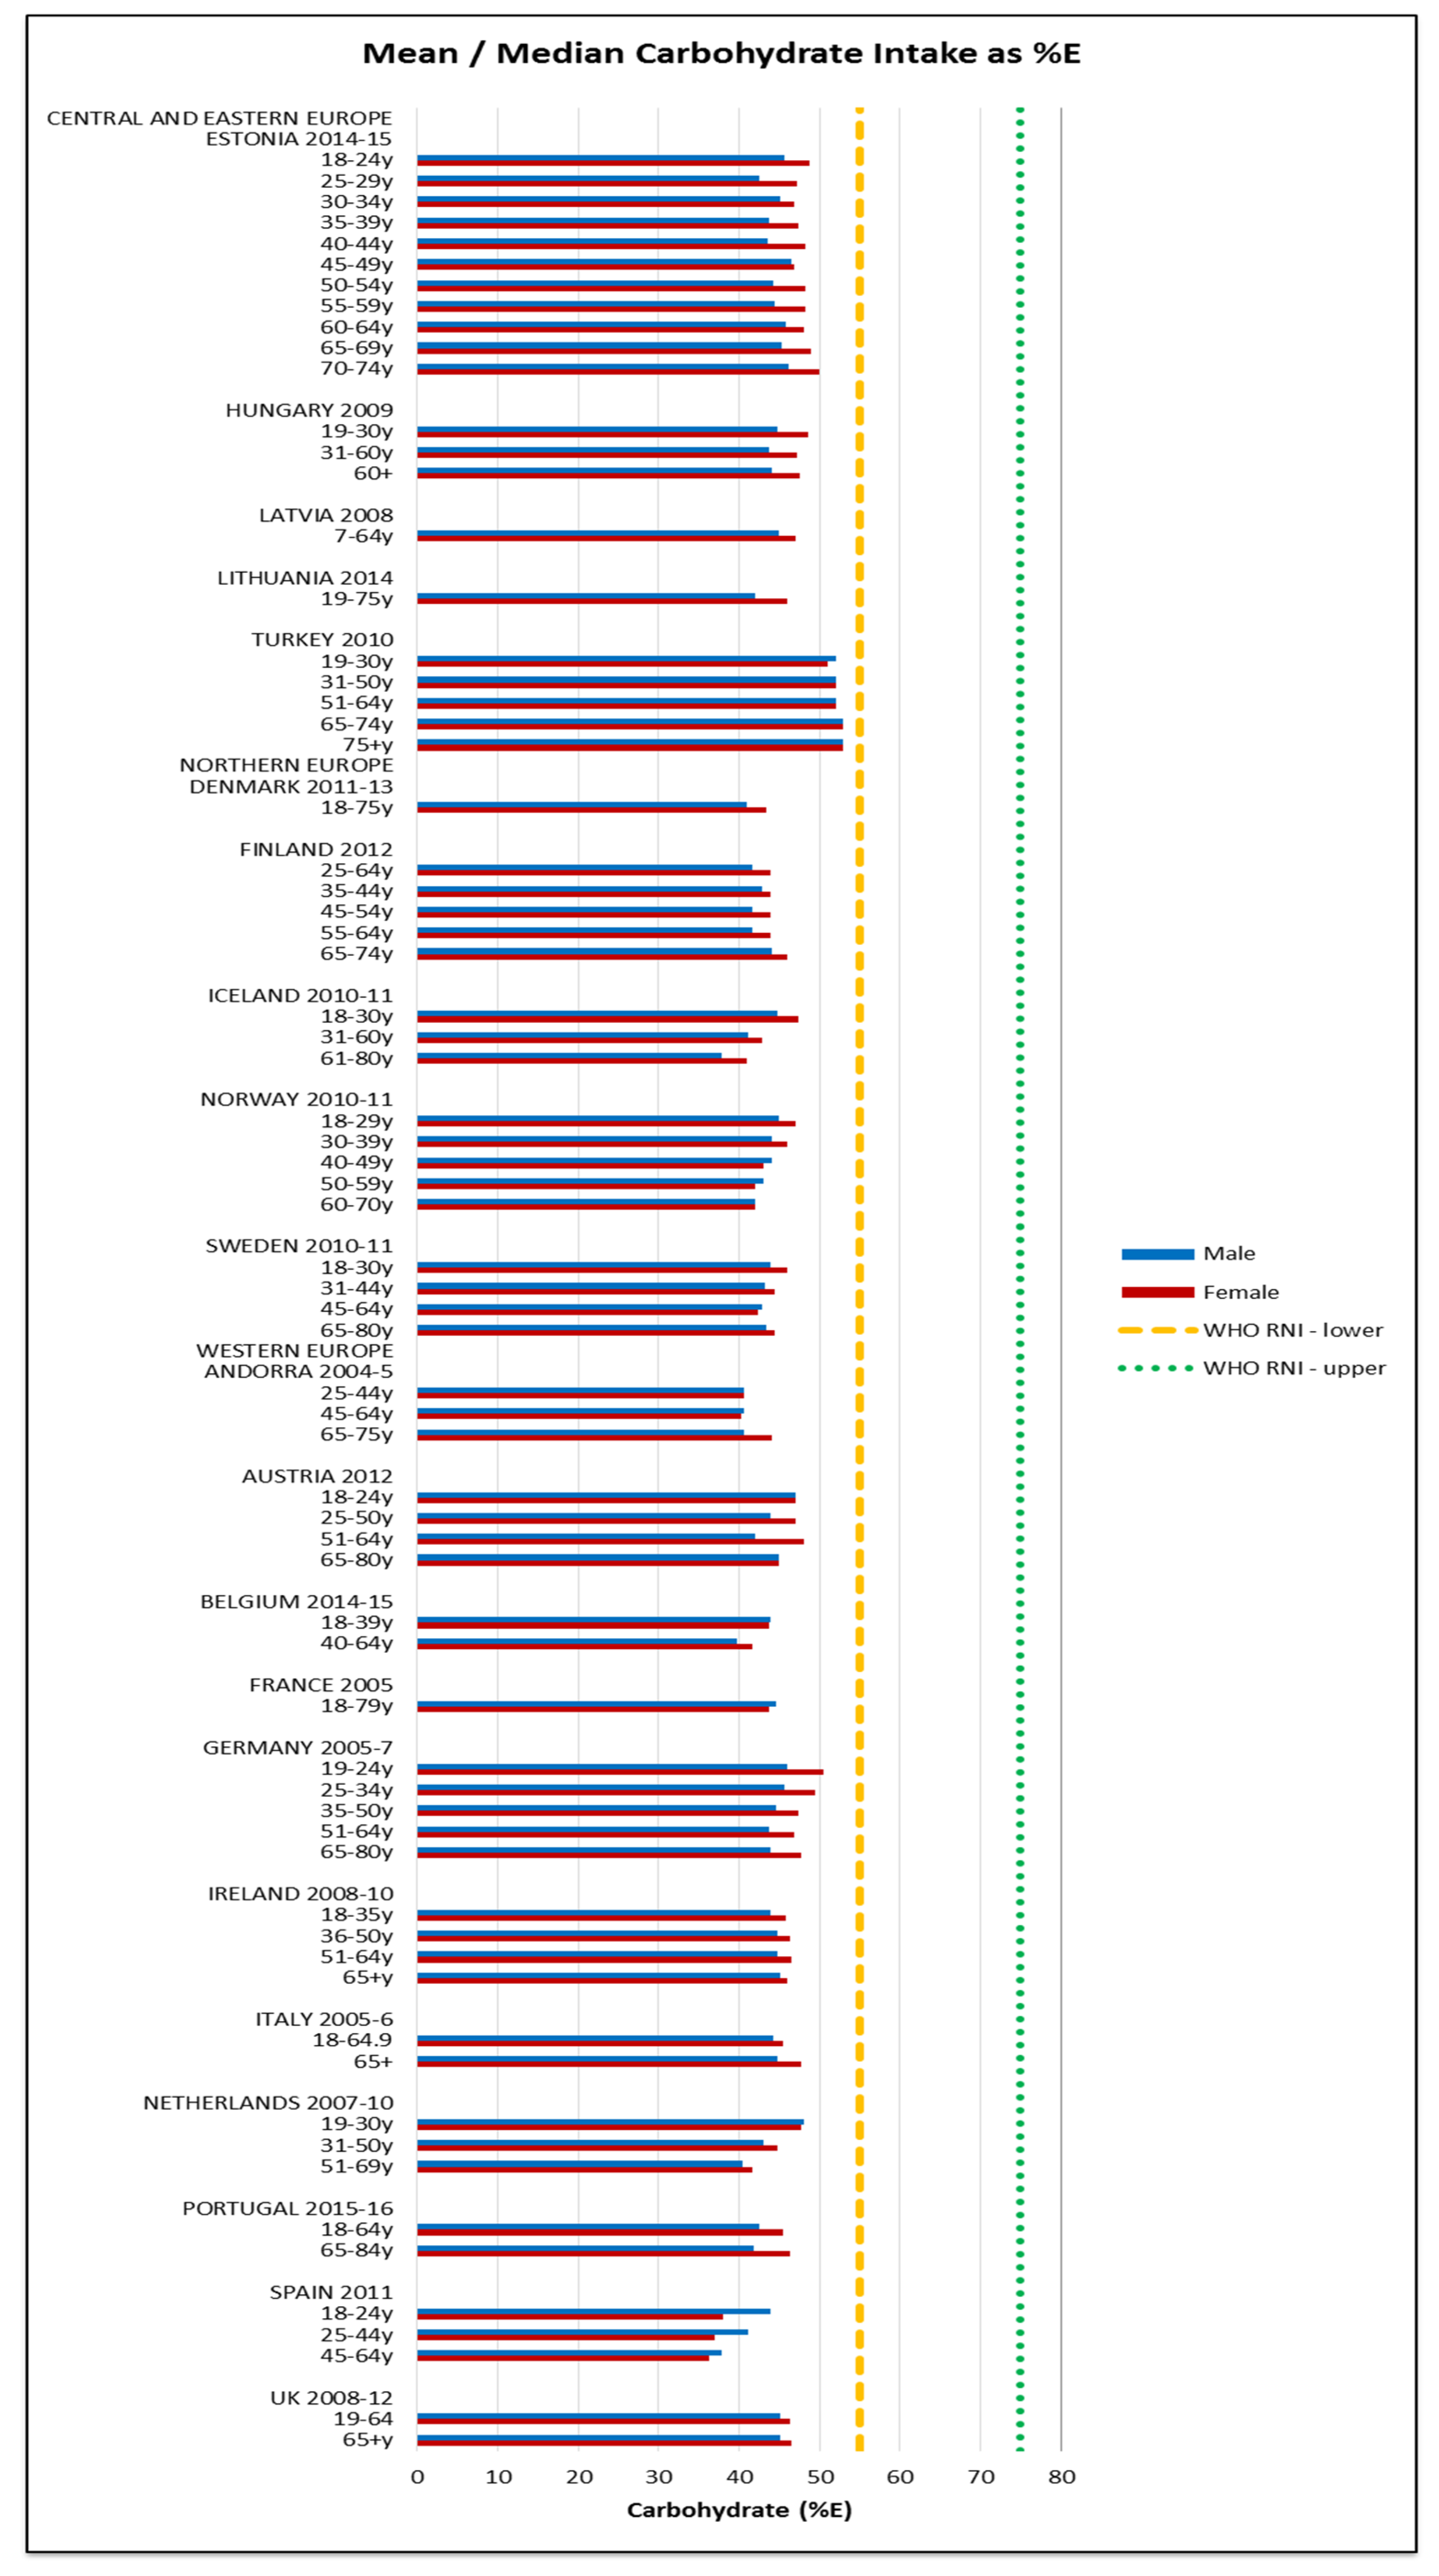
Figure 5.
Mean/median* adult fibre intake (g/day) (excluding supplements). * Figures for Spain are based on median rather than mean values.
Figure 5.
Mean/median* adult fibre intake (g/day) (excluding supplements). * Figures for Spain are based on median rather than mean values.

Figure 6.
Mean/median adult added sugars intake (g/day) (excluding supplements).
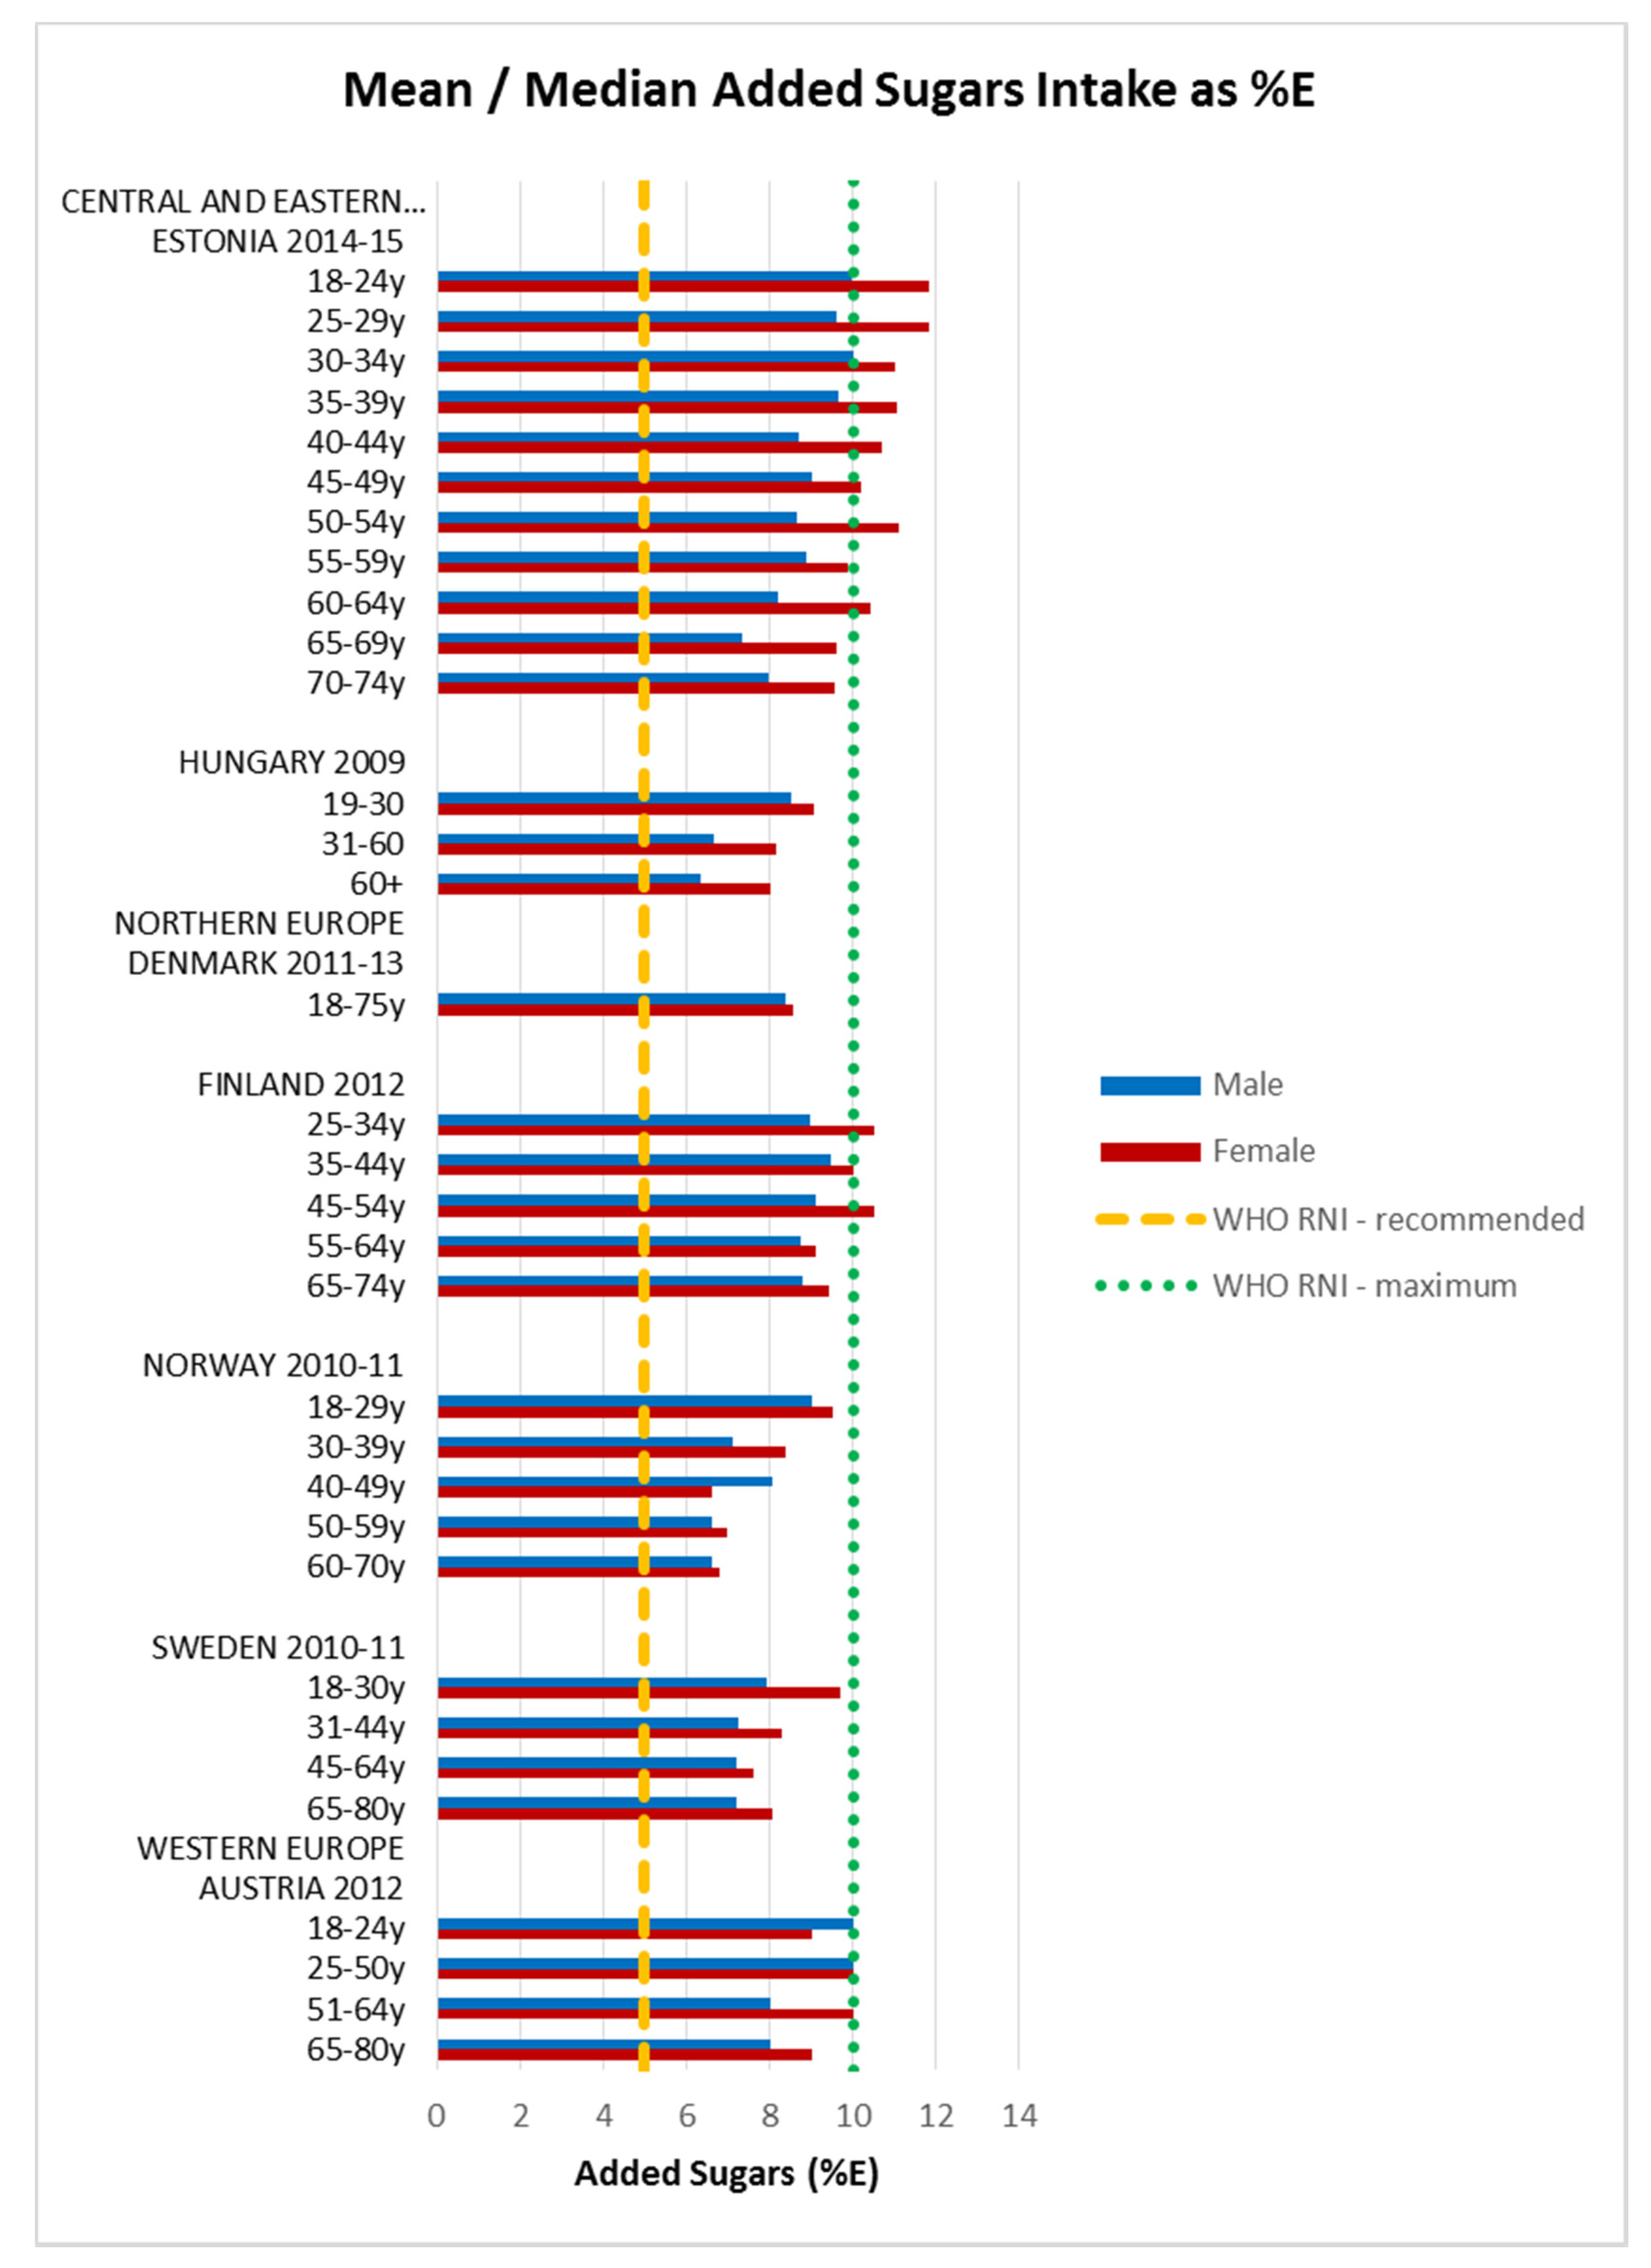
Figure 7.
Mean/median* adult fat intake (g/day) (excluding supplements). * Figures for Spain are based on median rather than mean values.
Figure 7.
Mean/median* adult fat intake (g/day) (excluding supplements). * Figures for Spain are based on median rather than mean values.
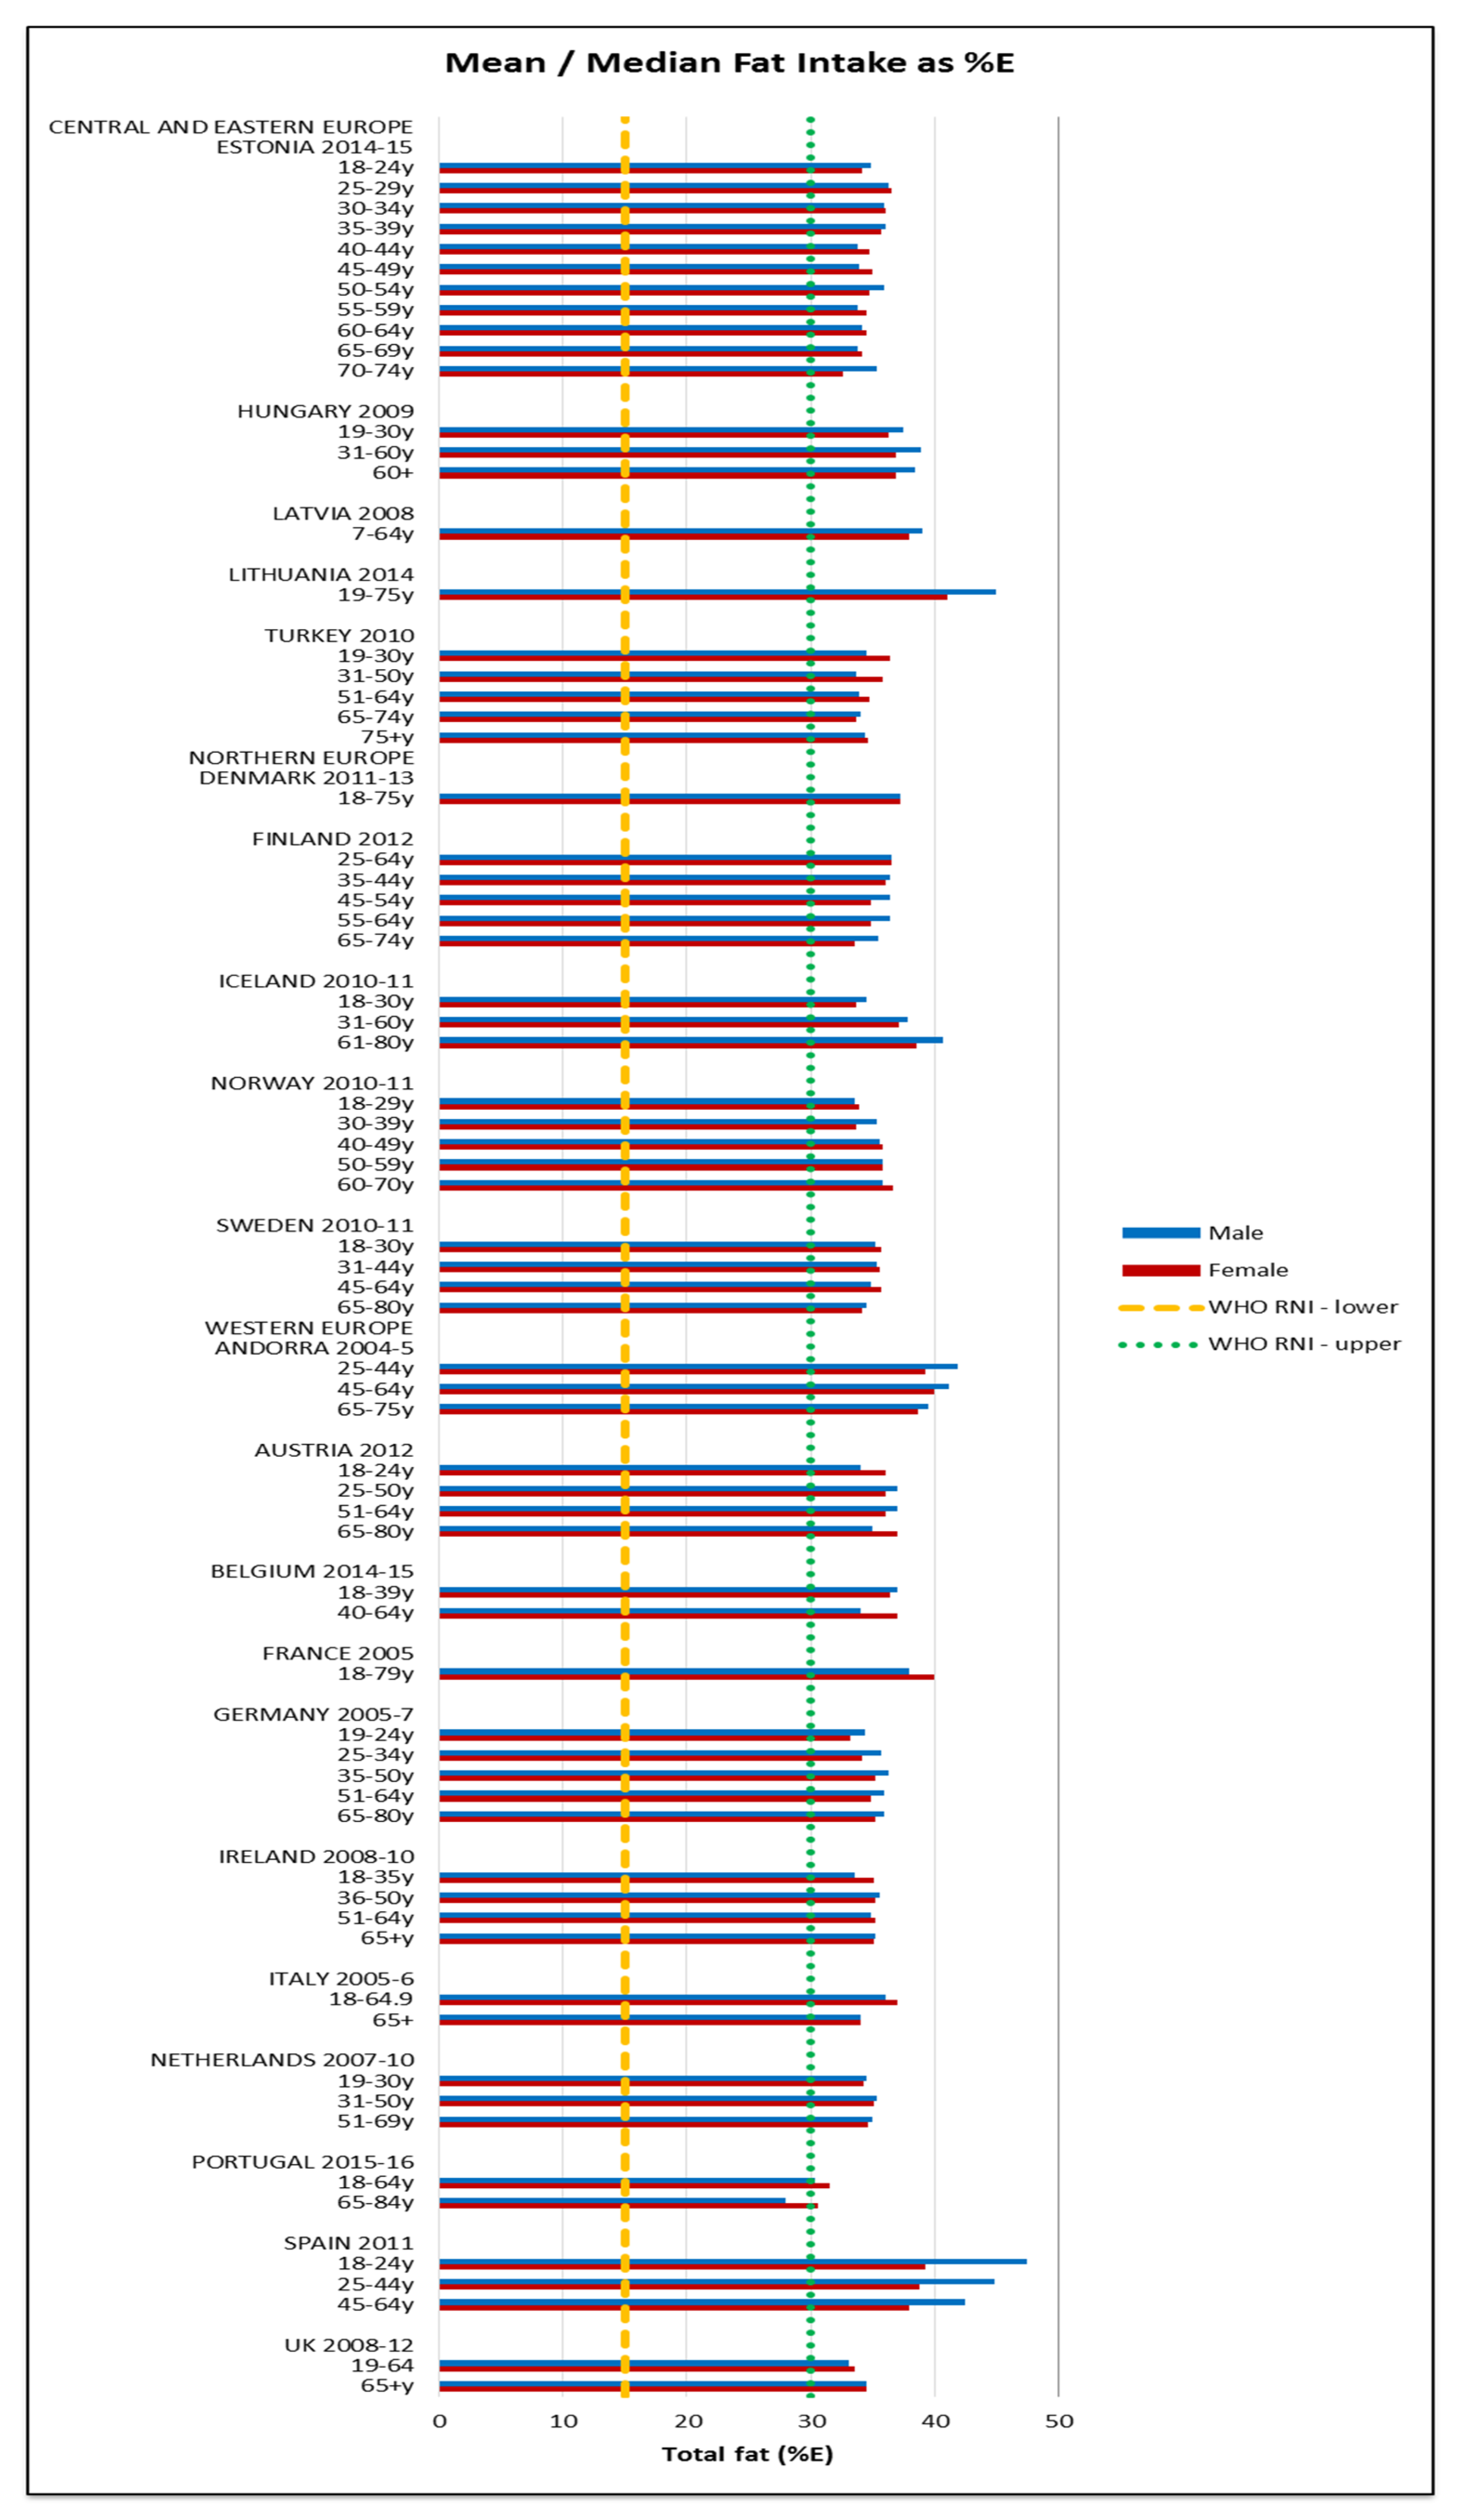
Figure 8.
Mean/median* adult saturates intake (g/day) (excluding supplements). * Figures for Spain are based on median rather than mean values.
Figure 8.
Mean/median* adult saturates intake (g/day) (excluding supplements). * Figures for Spain are based on median rather than mean values.

Figure 9.
Mean/median* adult iron intake (mg/day) (excluding supplements). * Figures for Spain are based on median rather than mean values.
Figure 9.
Mean/median* adult iron intake (mg/day) (excluding supplements). * Figures for Spain are based on median rather than mean values.
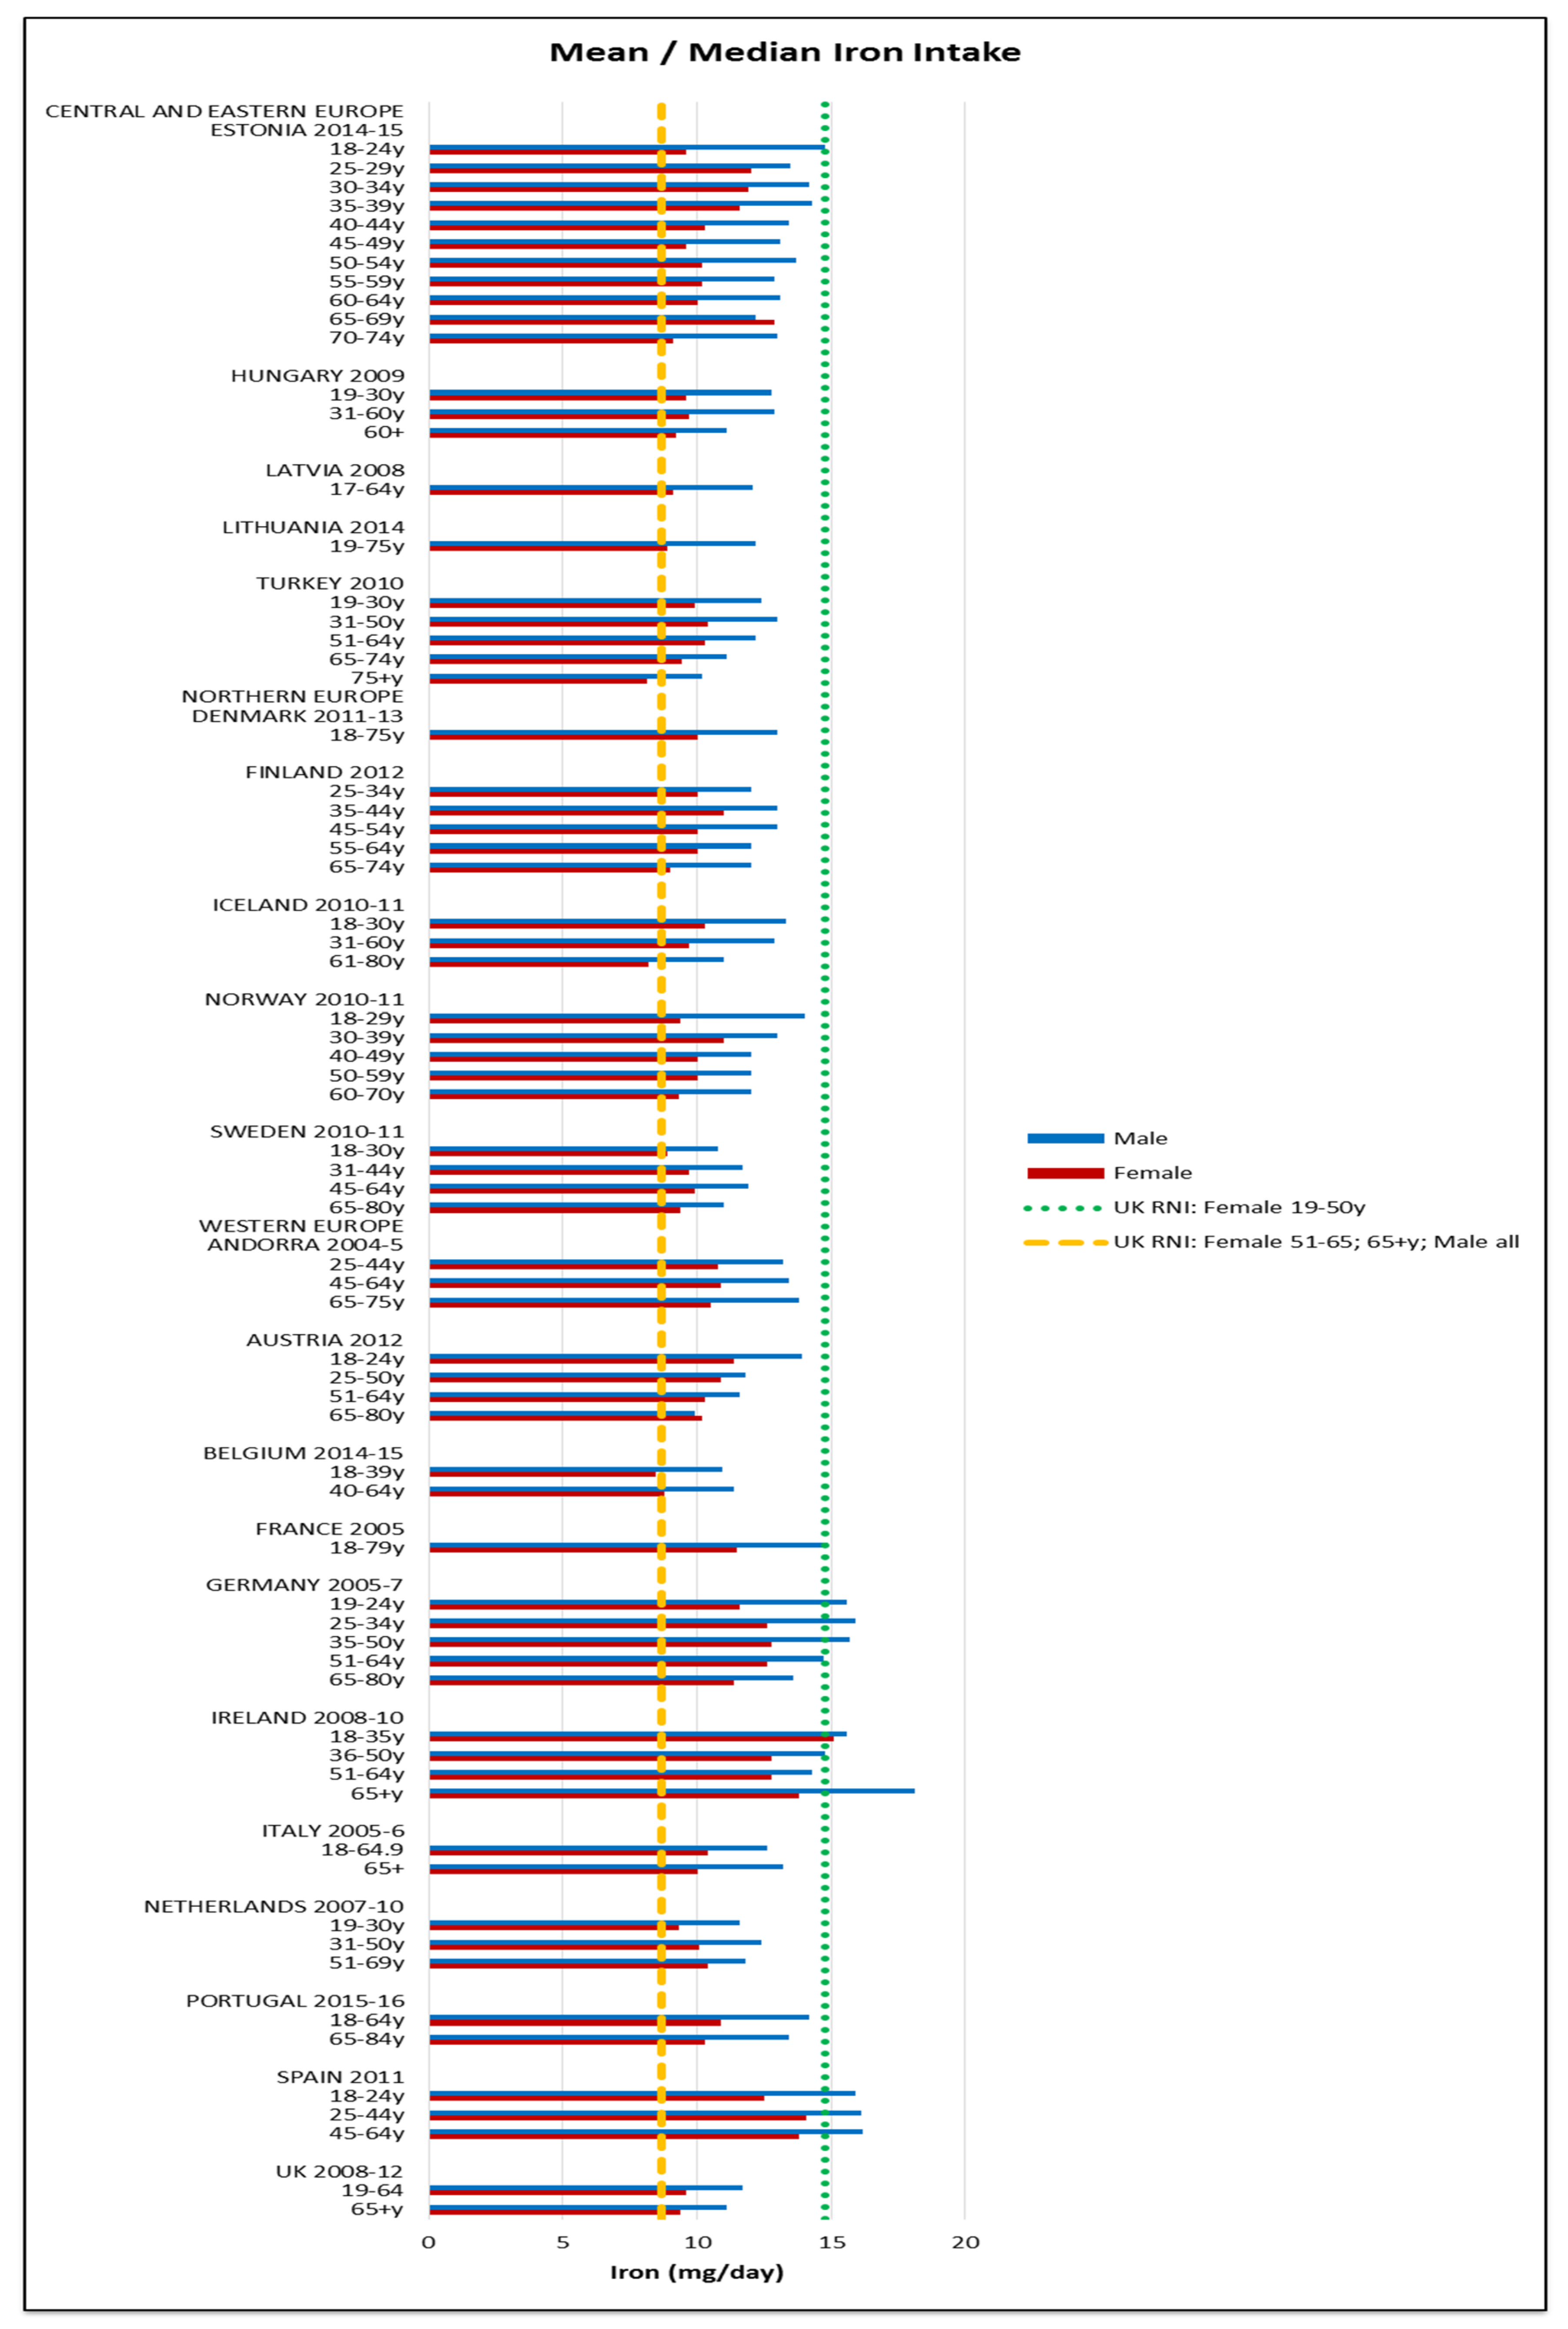
Figure 10.
Mean/median* adult iodine intake (μg/day) (excluding supplements). * Figures for Spain are based on median rather than mean values.
Figure 10.
Mean/median* adult iodine intake (μg/day) (excluding supplements). * Figures for Spain are based on median rather than mean values.

Figure 11.
Mean/median* adult potassium intake (mg/day) (excluding supplements). * Figures for Spain are based on median rather than mean values.
Figure 11.
Mean/median* adult potassium intake (mg/day) (excluding supplements). * Figures for Spain are based on median rather than mean values.

Figure 12.
Mean/median* adult folic acid intake (μg/day) (excluding supplements). * Figures for Spain are based on median rather than mean values.
Figure 12.
Mean/median* adult folic acid intake (μg/day) (excluding supplements). * Figures for Spain are based on median rather than mean values.

Figure 13.
Mean/median* adult sodium intake (mg/day) (excluding supplements). * Figures for Spain are based on median rather than mean values.
Figure 13.
Mean/median* adult sodium intake (mg/day) (excluding supplements). * Figures for Spain are based on median rather than mean values.

Figure 14.
Mean/median* adult vitamin D intake (μg/day) (excluding supplements). * Figures for Spain are based on median rather than mean values.
Figure 14.
Mean/median* adult vitamin D intake (μg/day) (excluding supplements). * Figures for Spain are based on median rather than mean values.
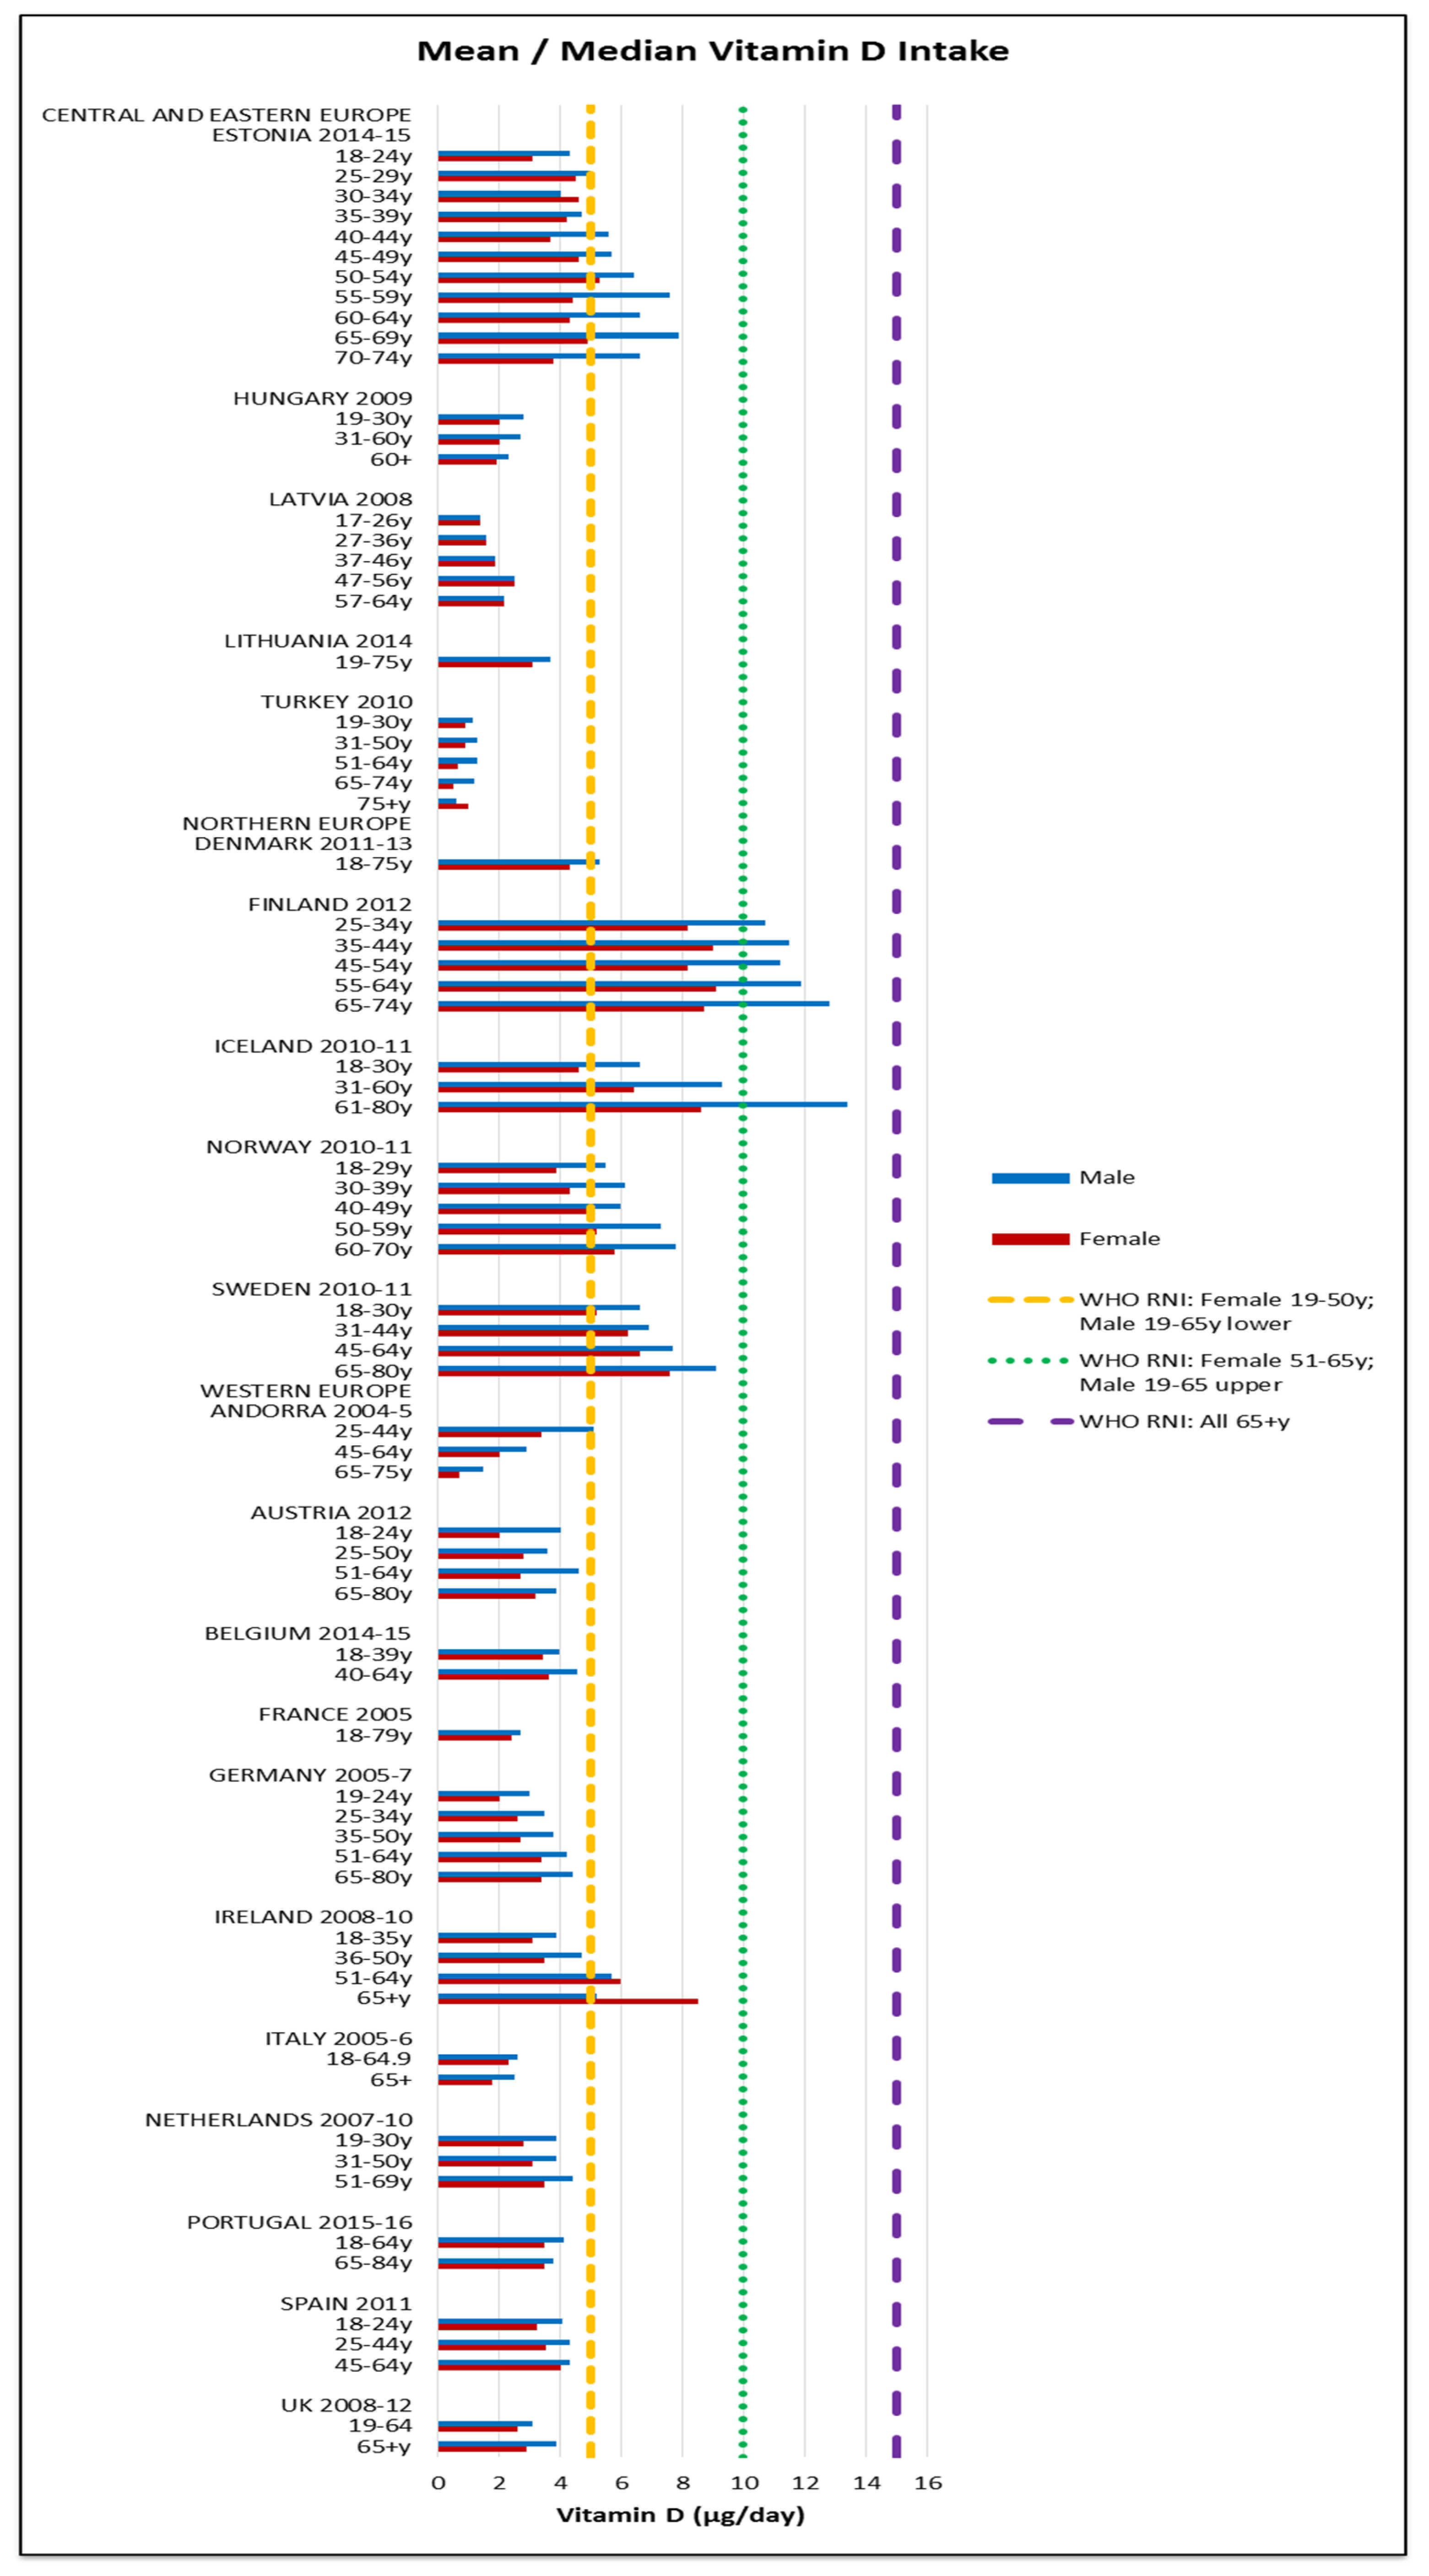
Figure 15.
Mean/median* adult calcium intake (mg/day) (excluding supplements). * Figures for Spain are based on median rather than mean values.
Figure 15.
Mean/median* adult calcium intake (mg/day) (excluding supplements). * Figures for Spain are based on median rather than mean values.
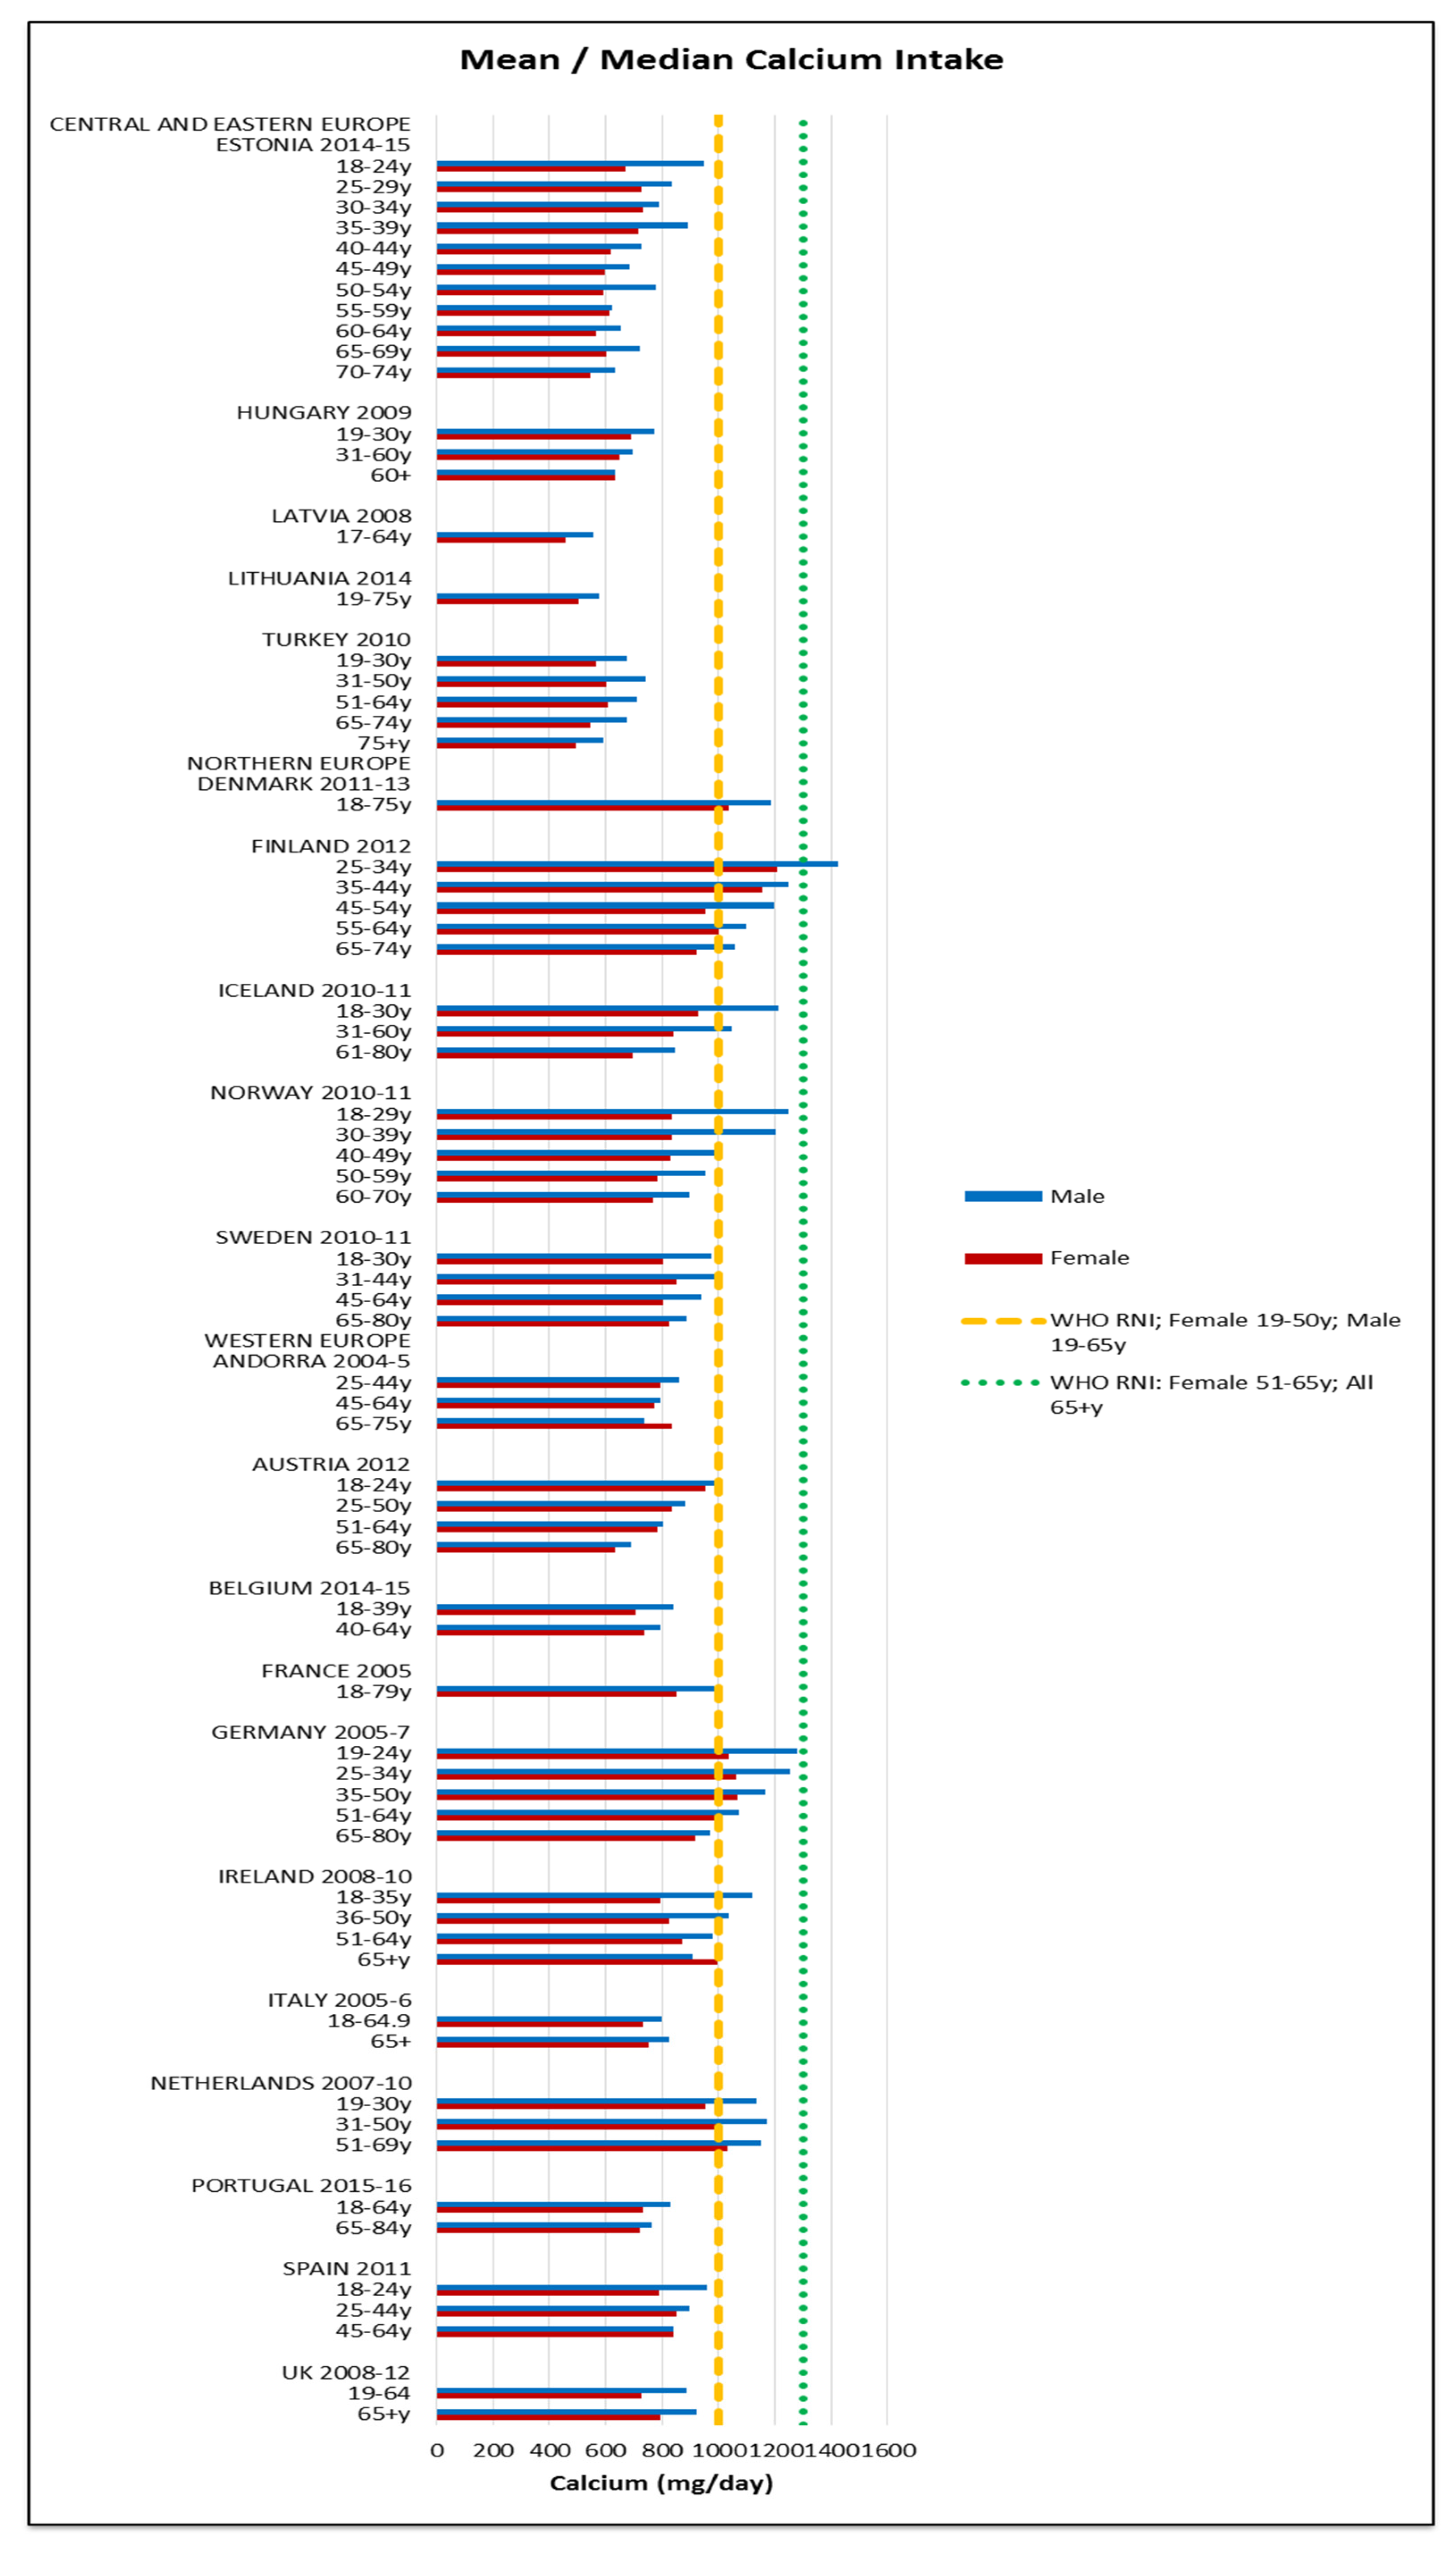

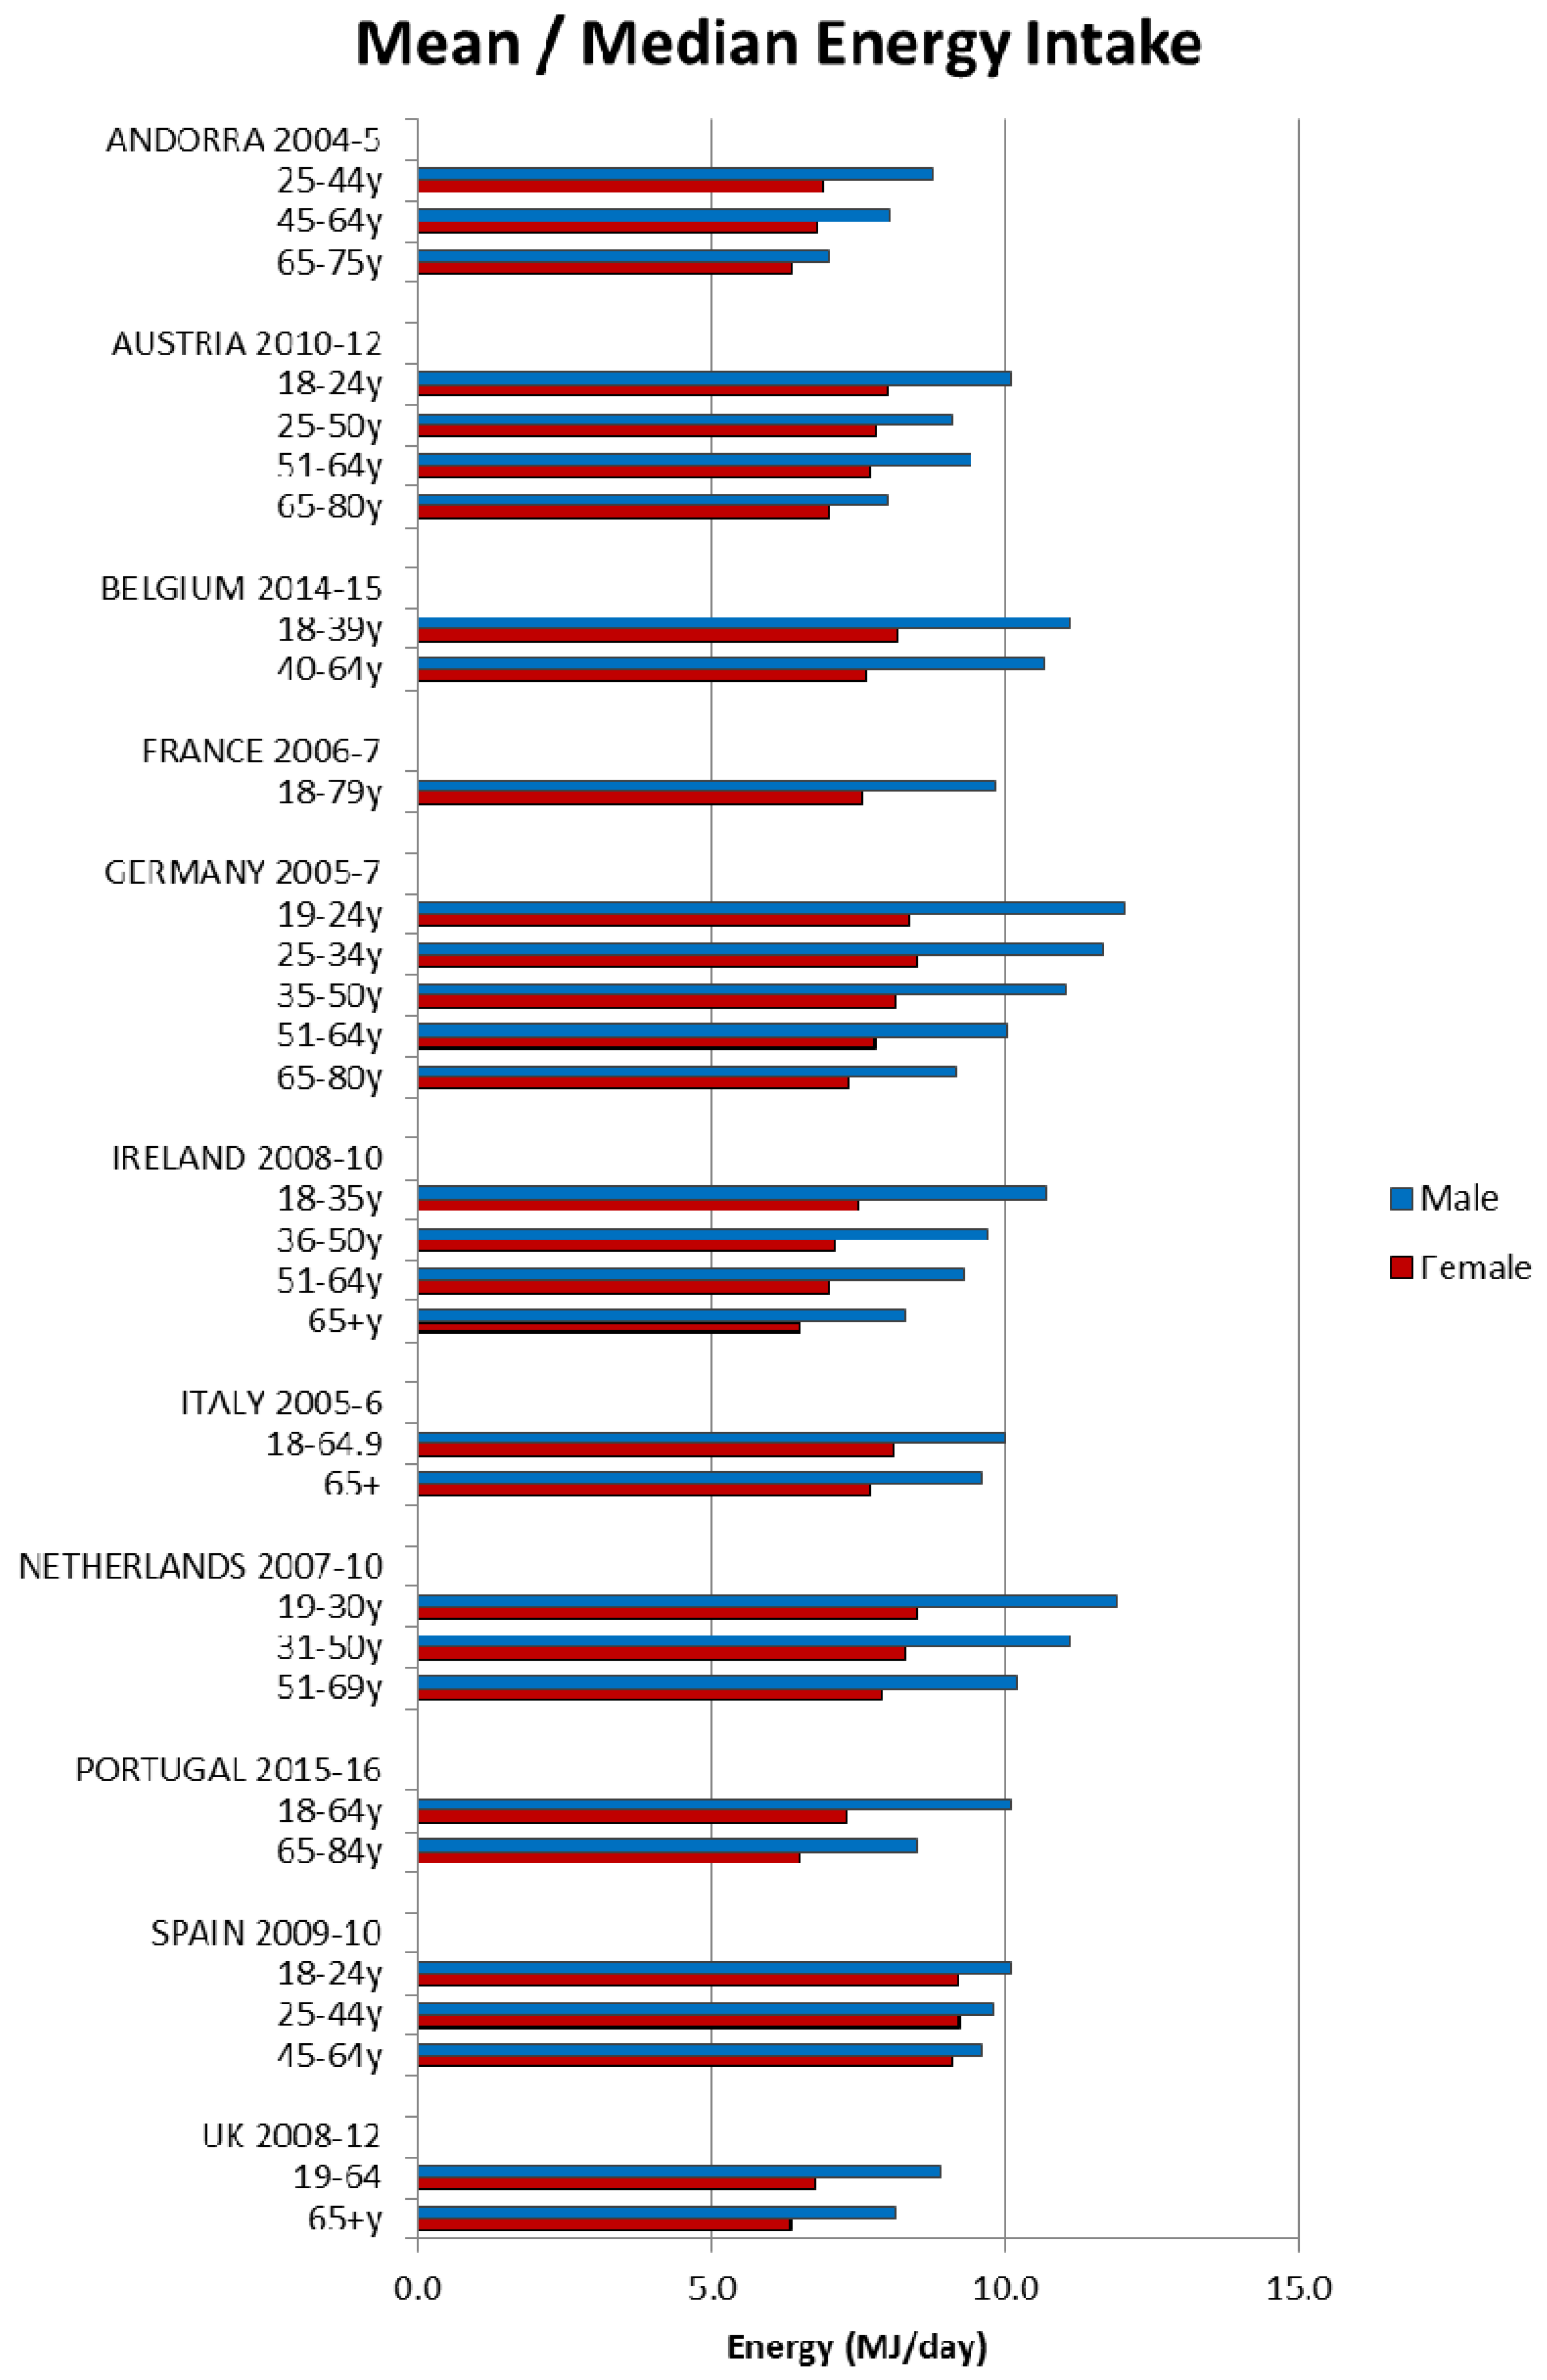
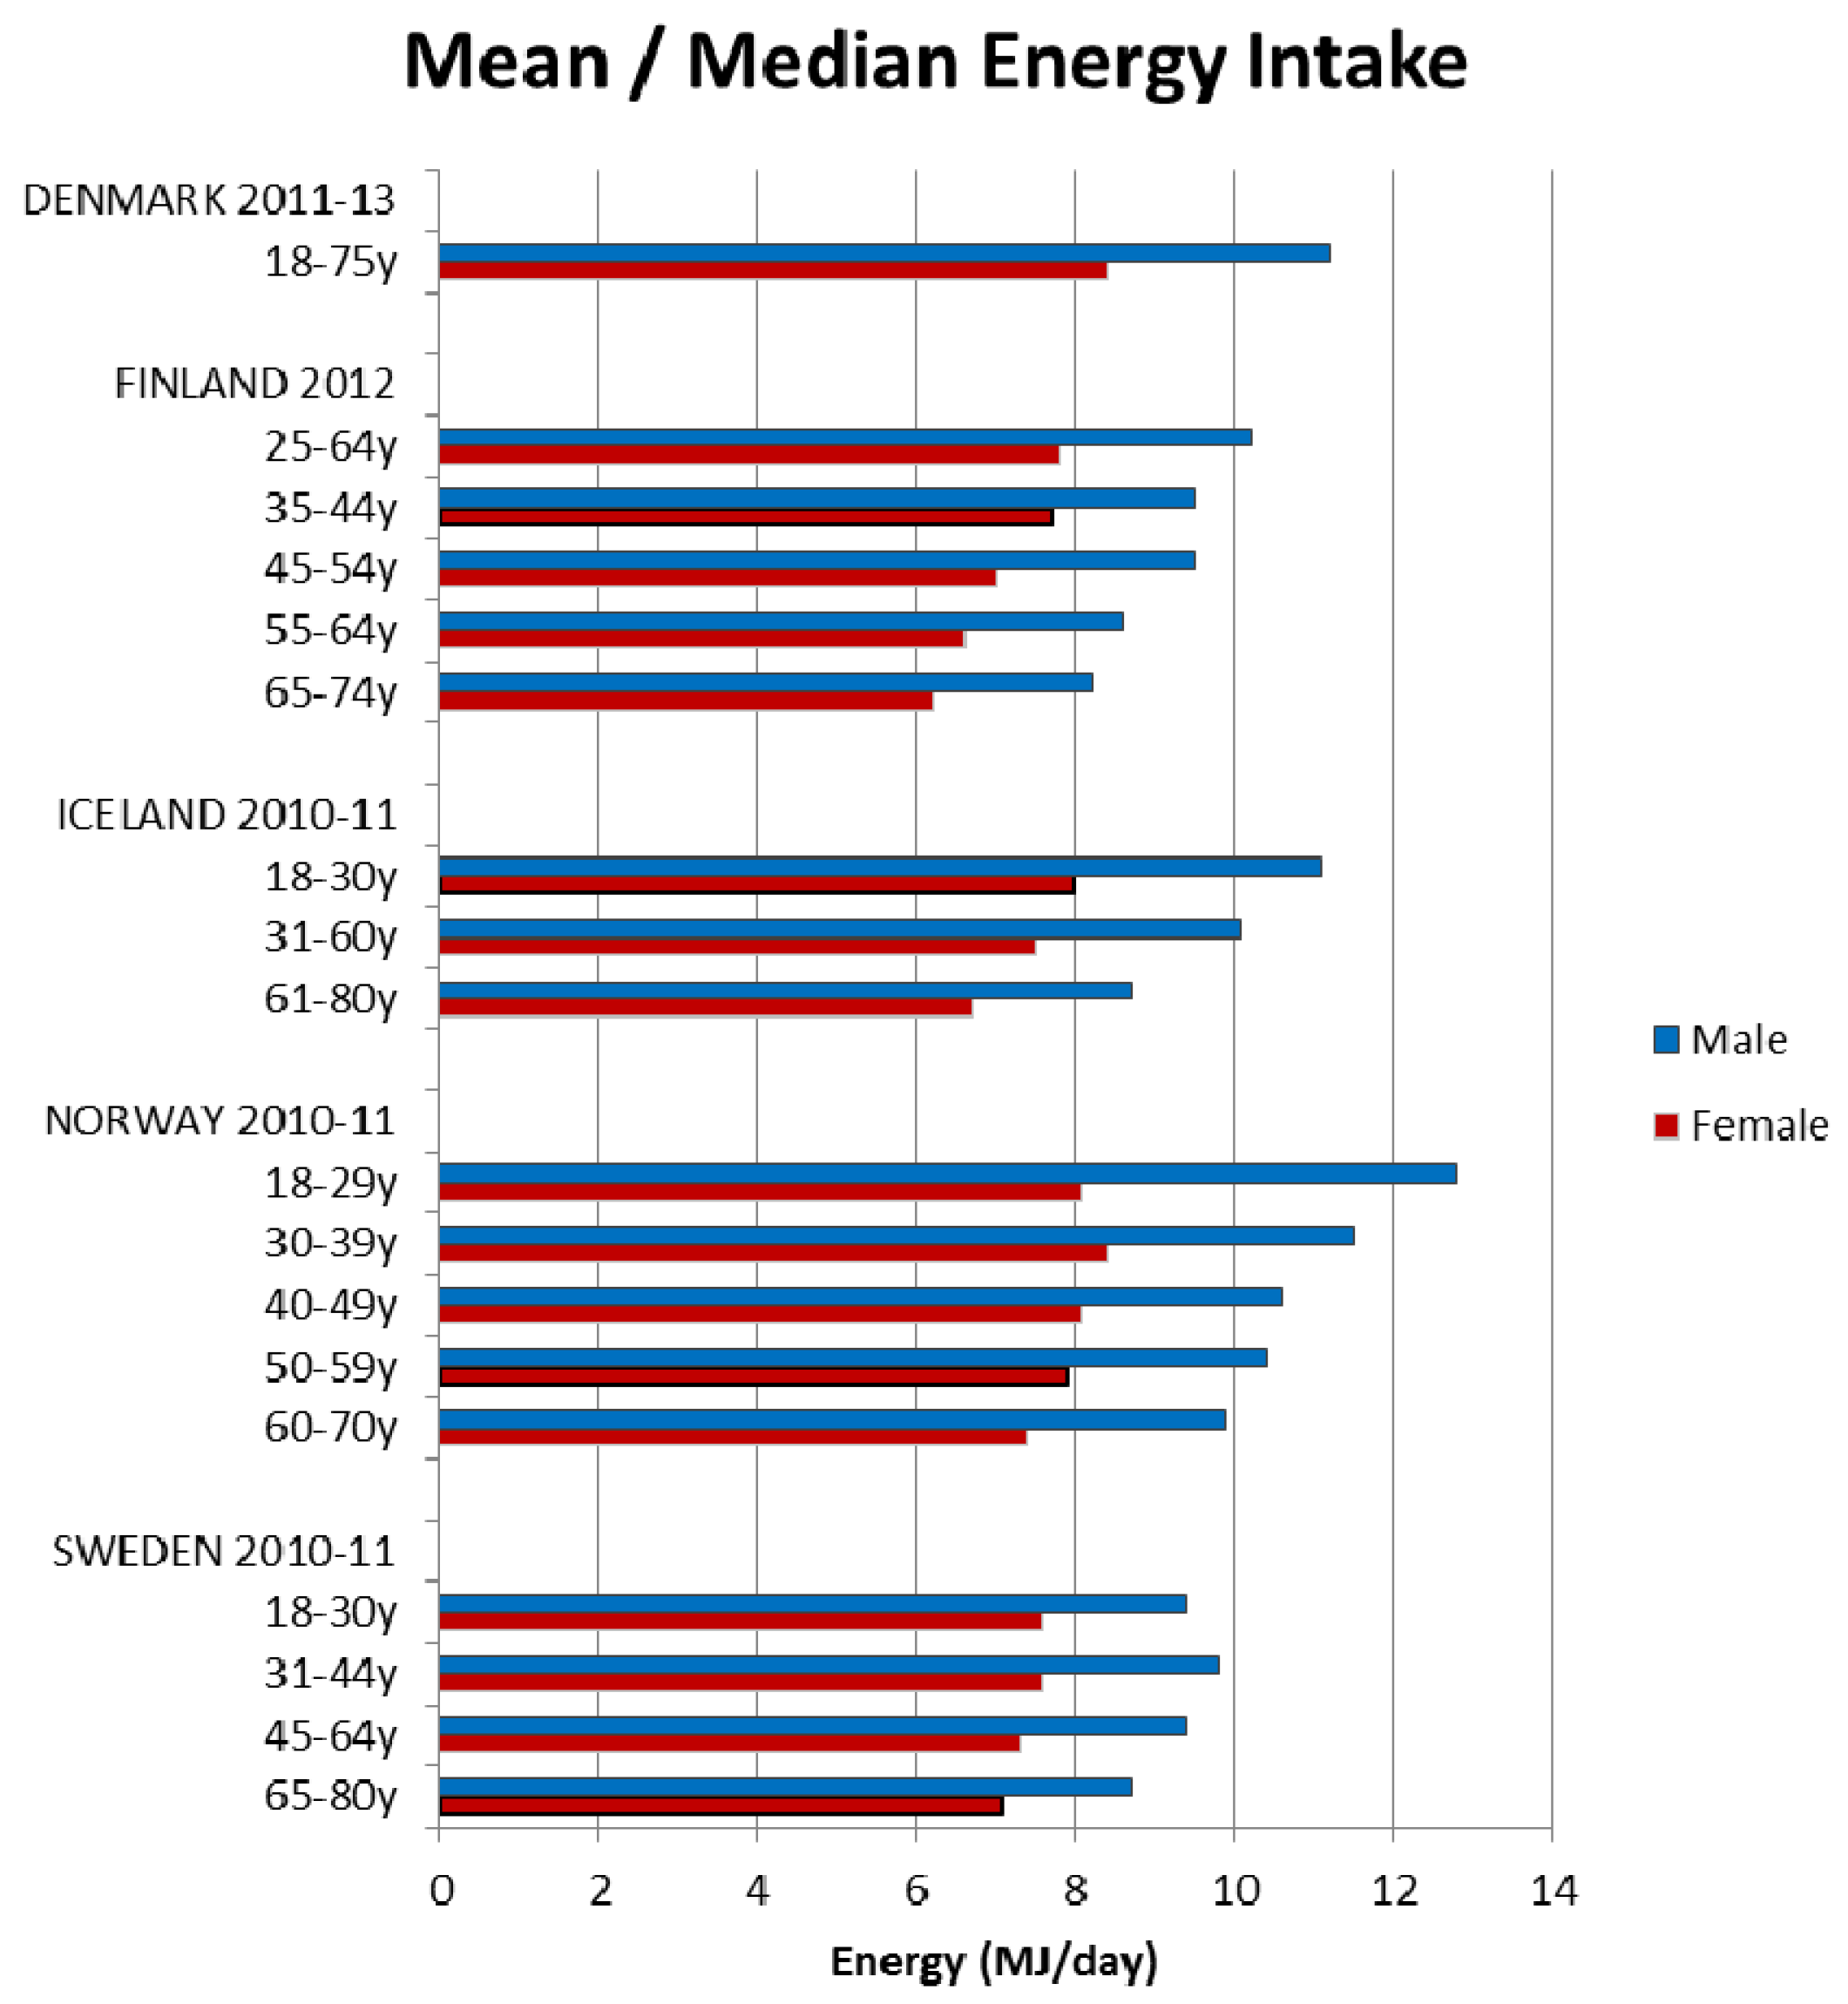
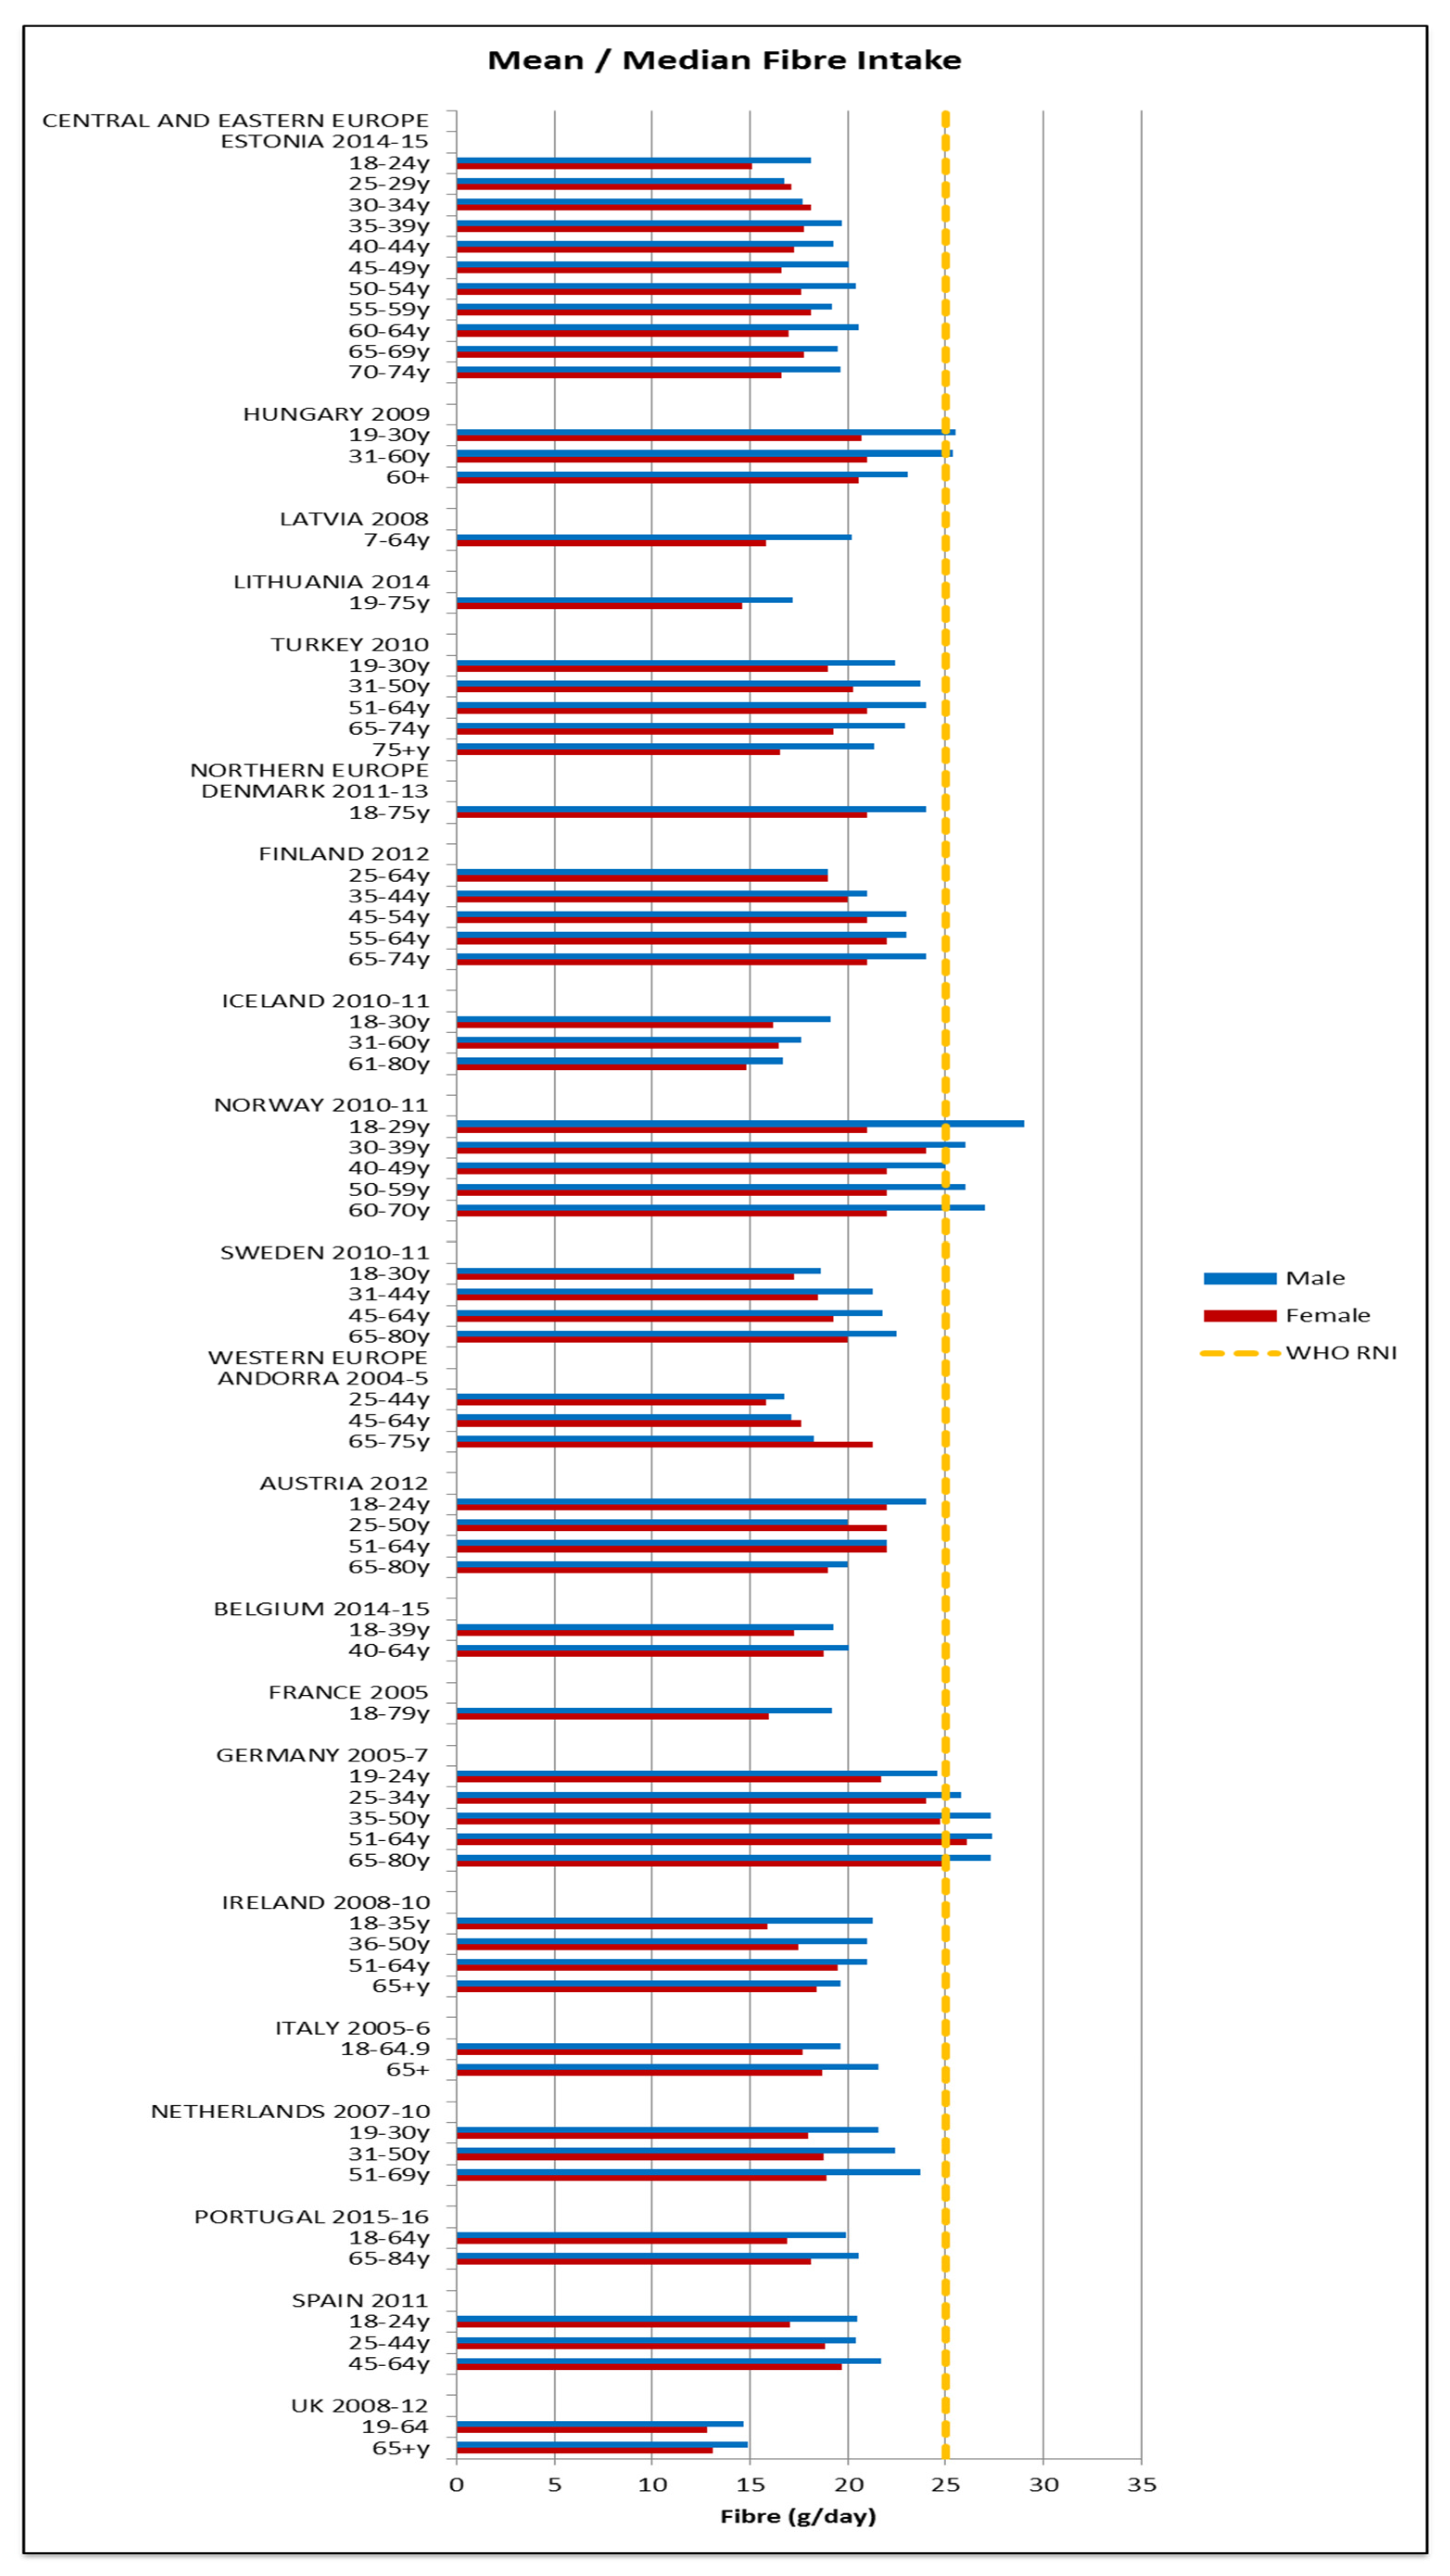
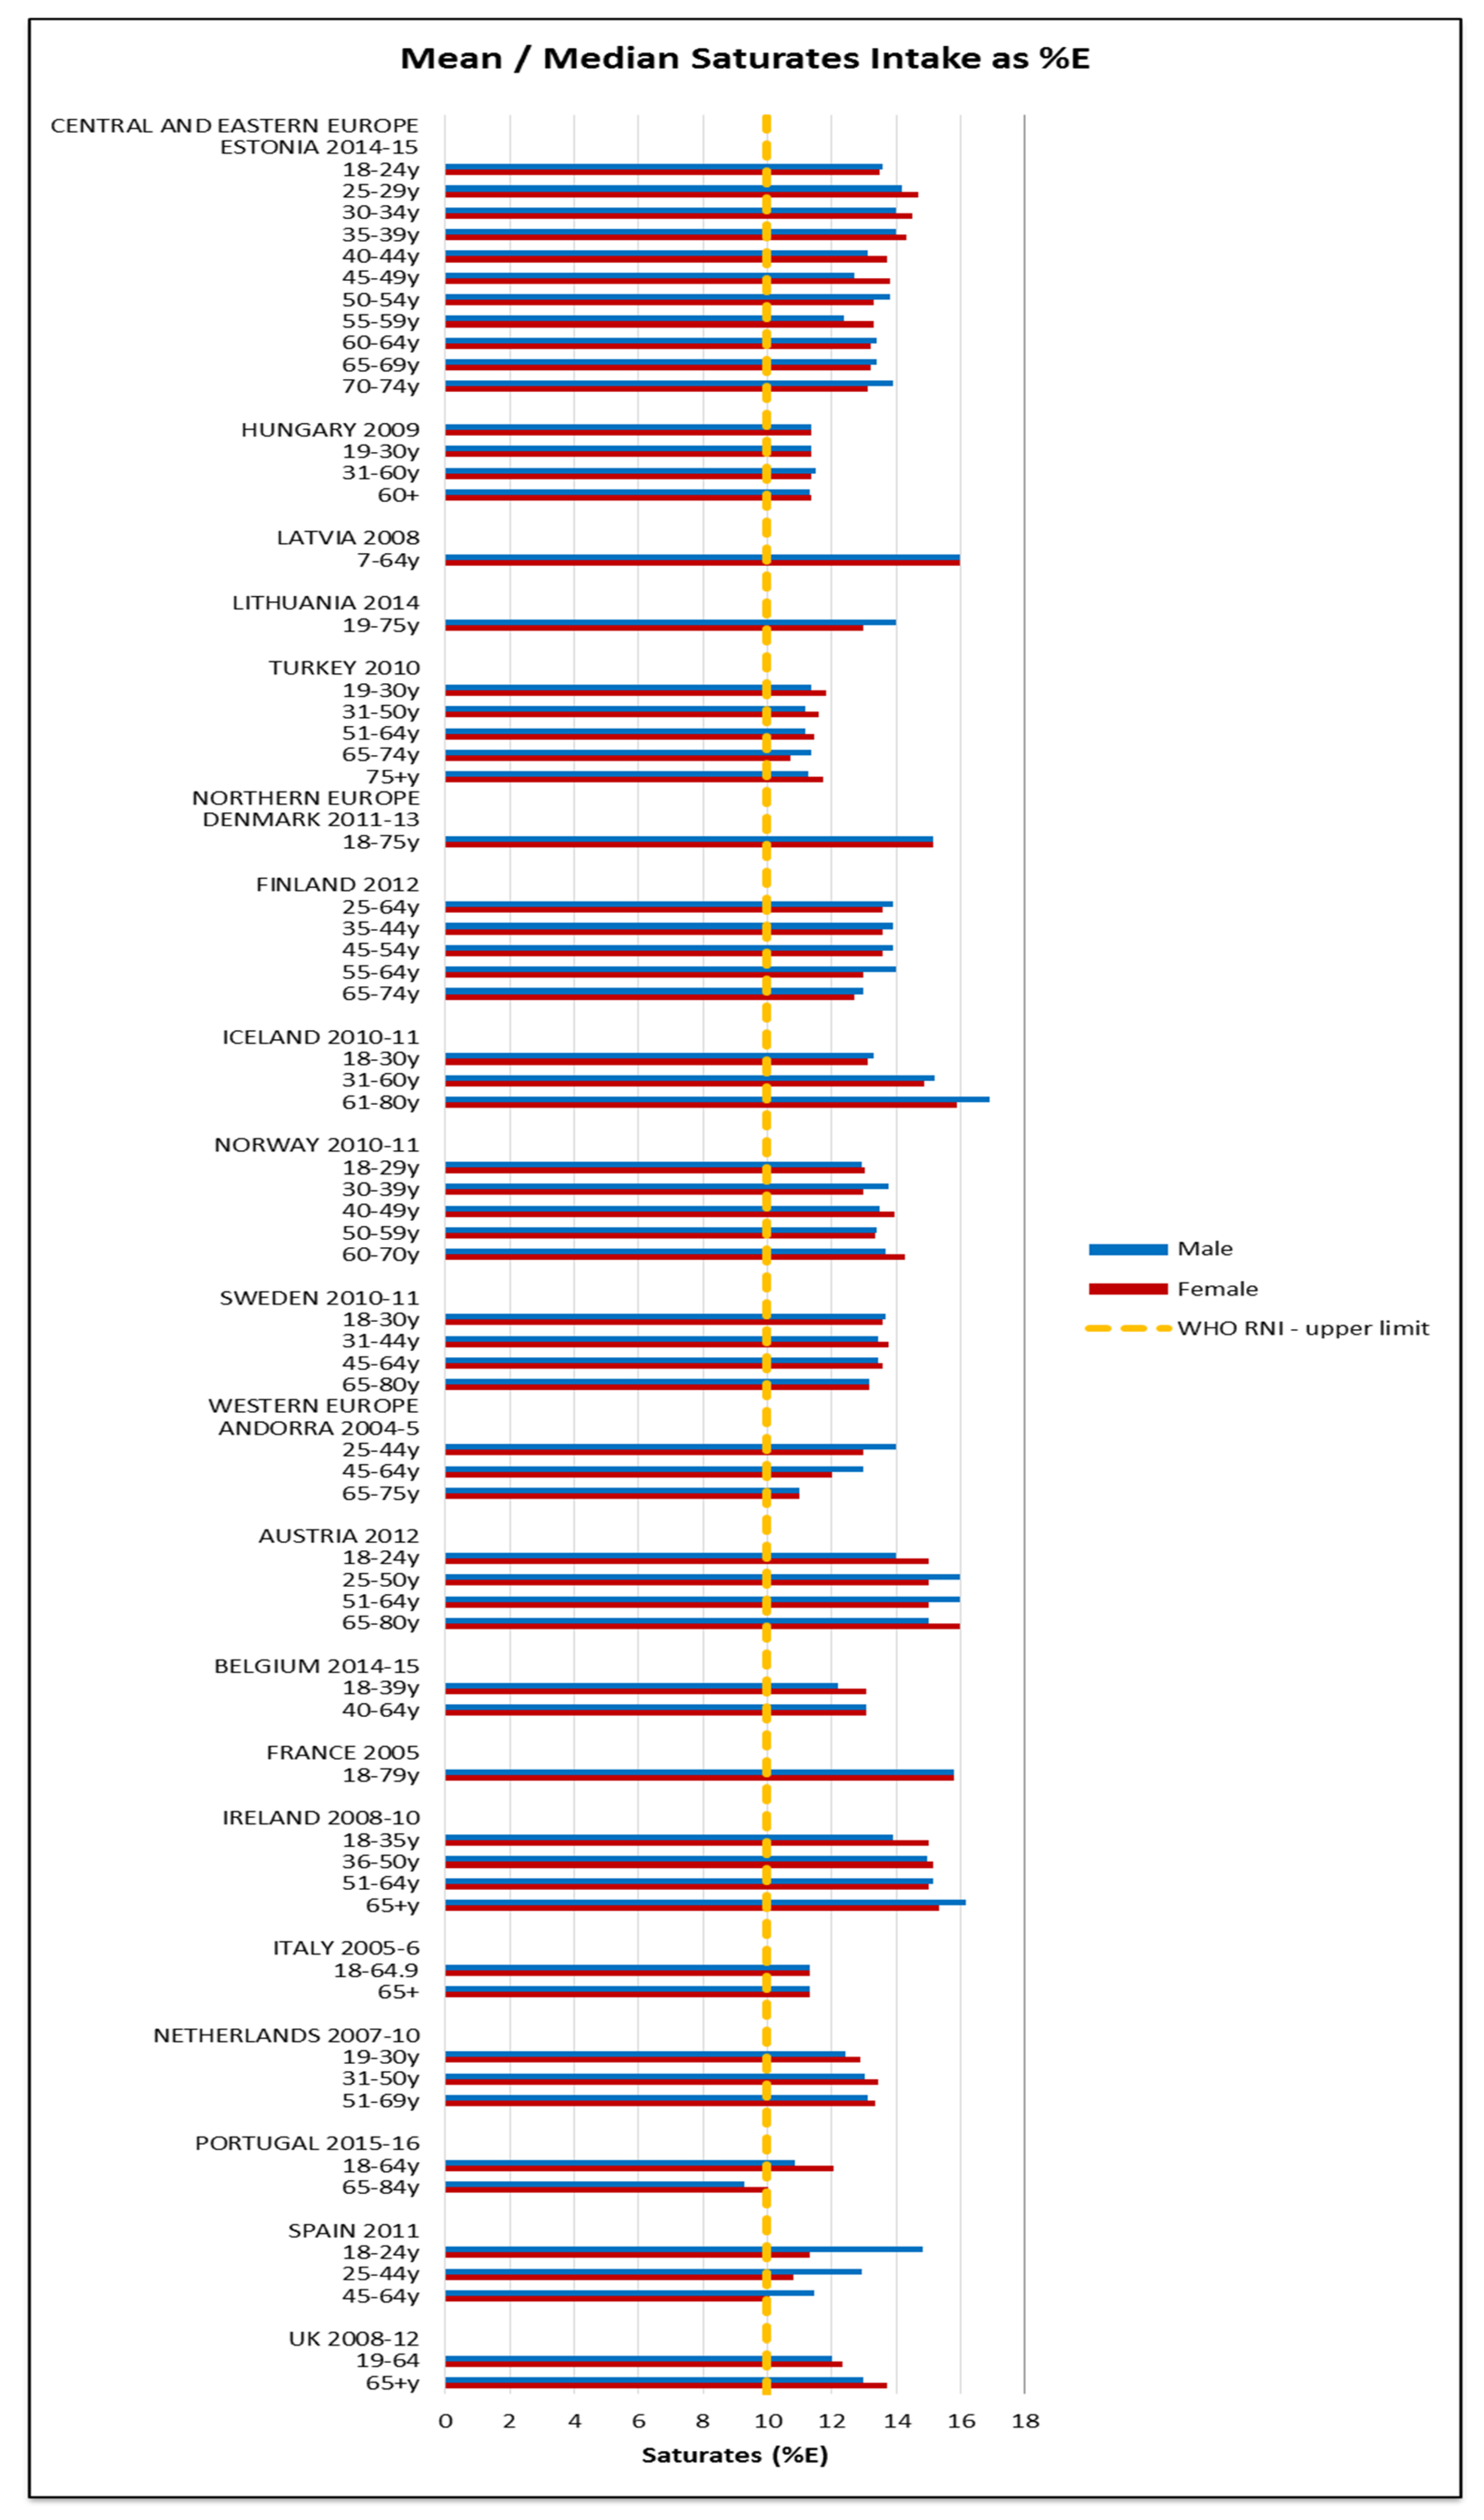
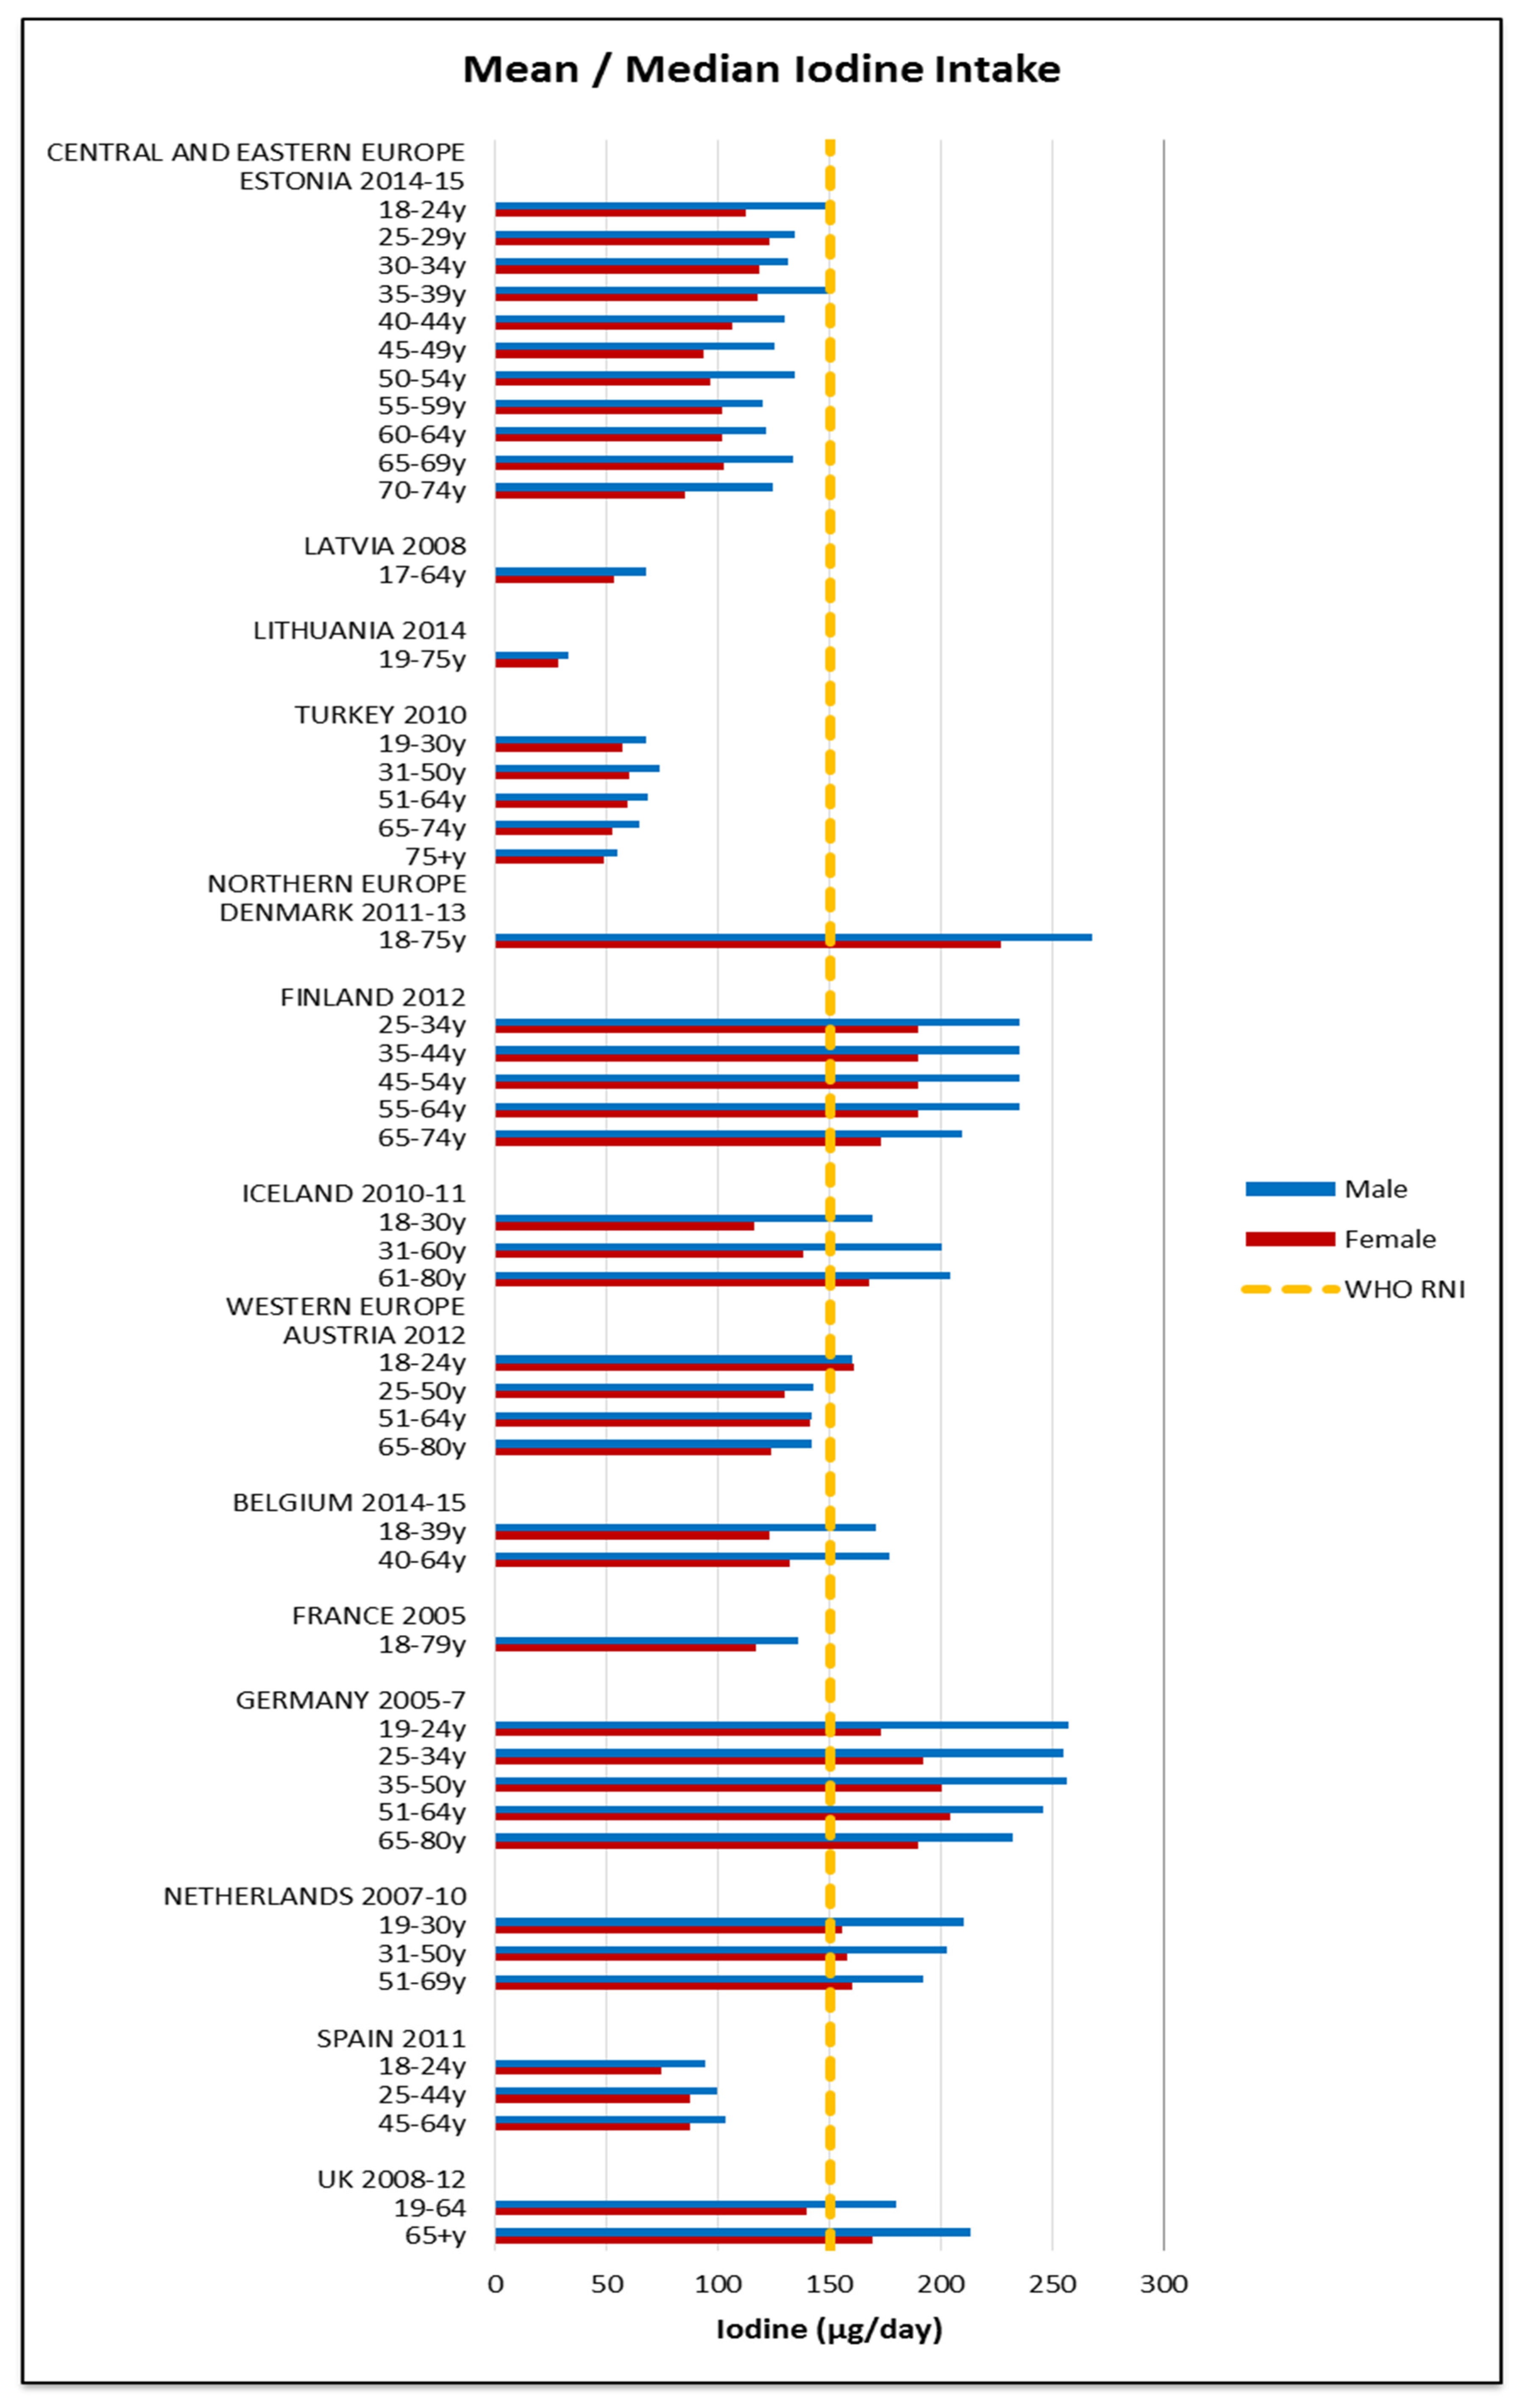
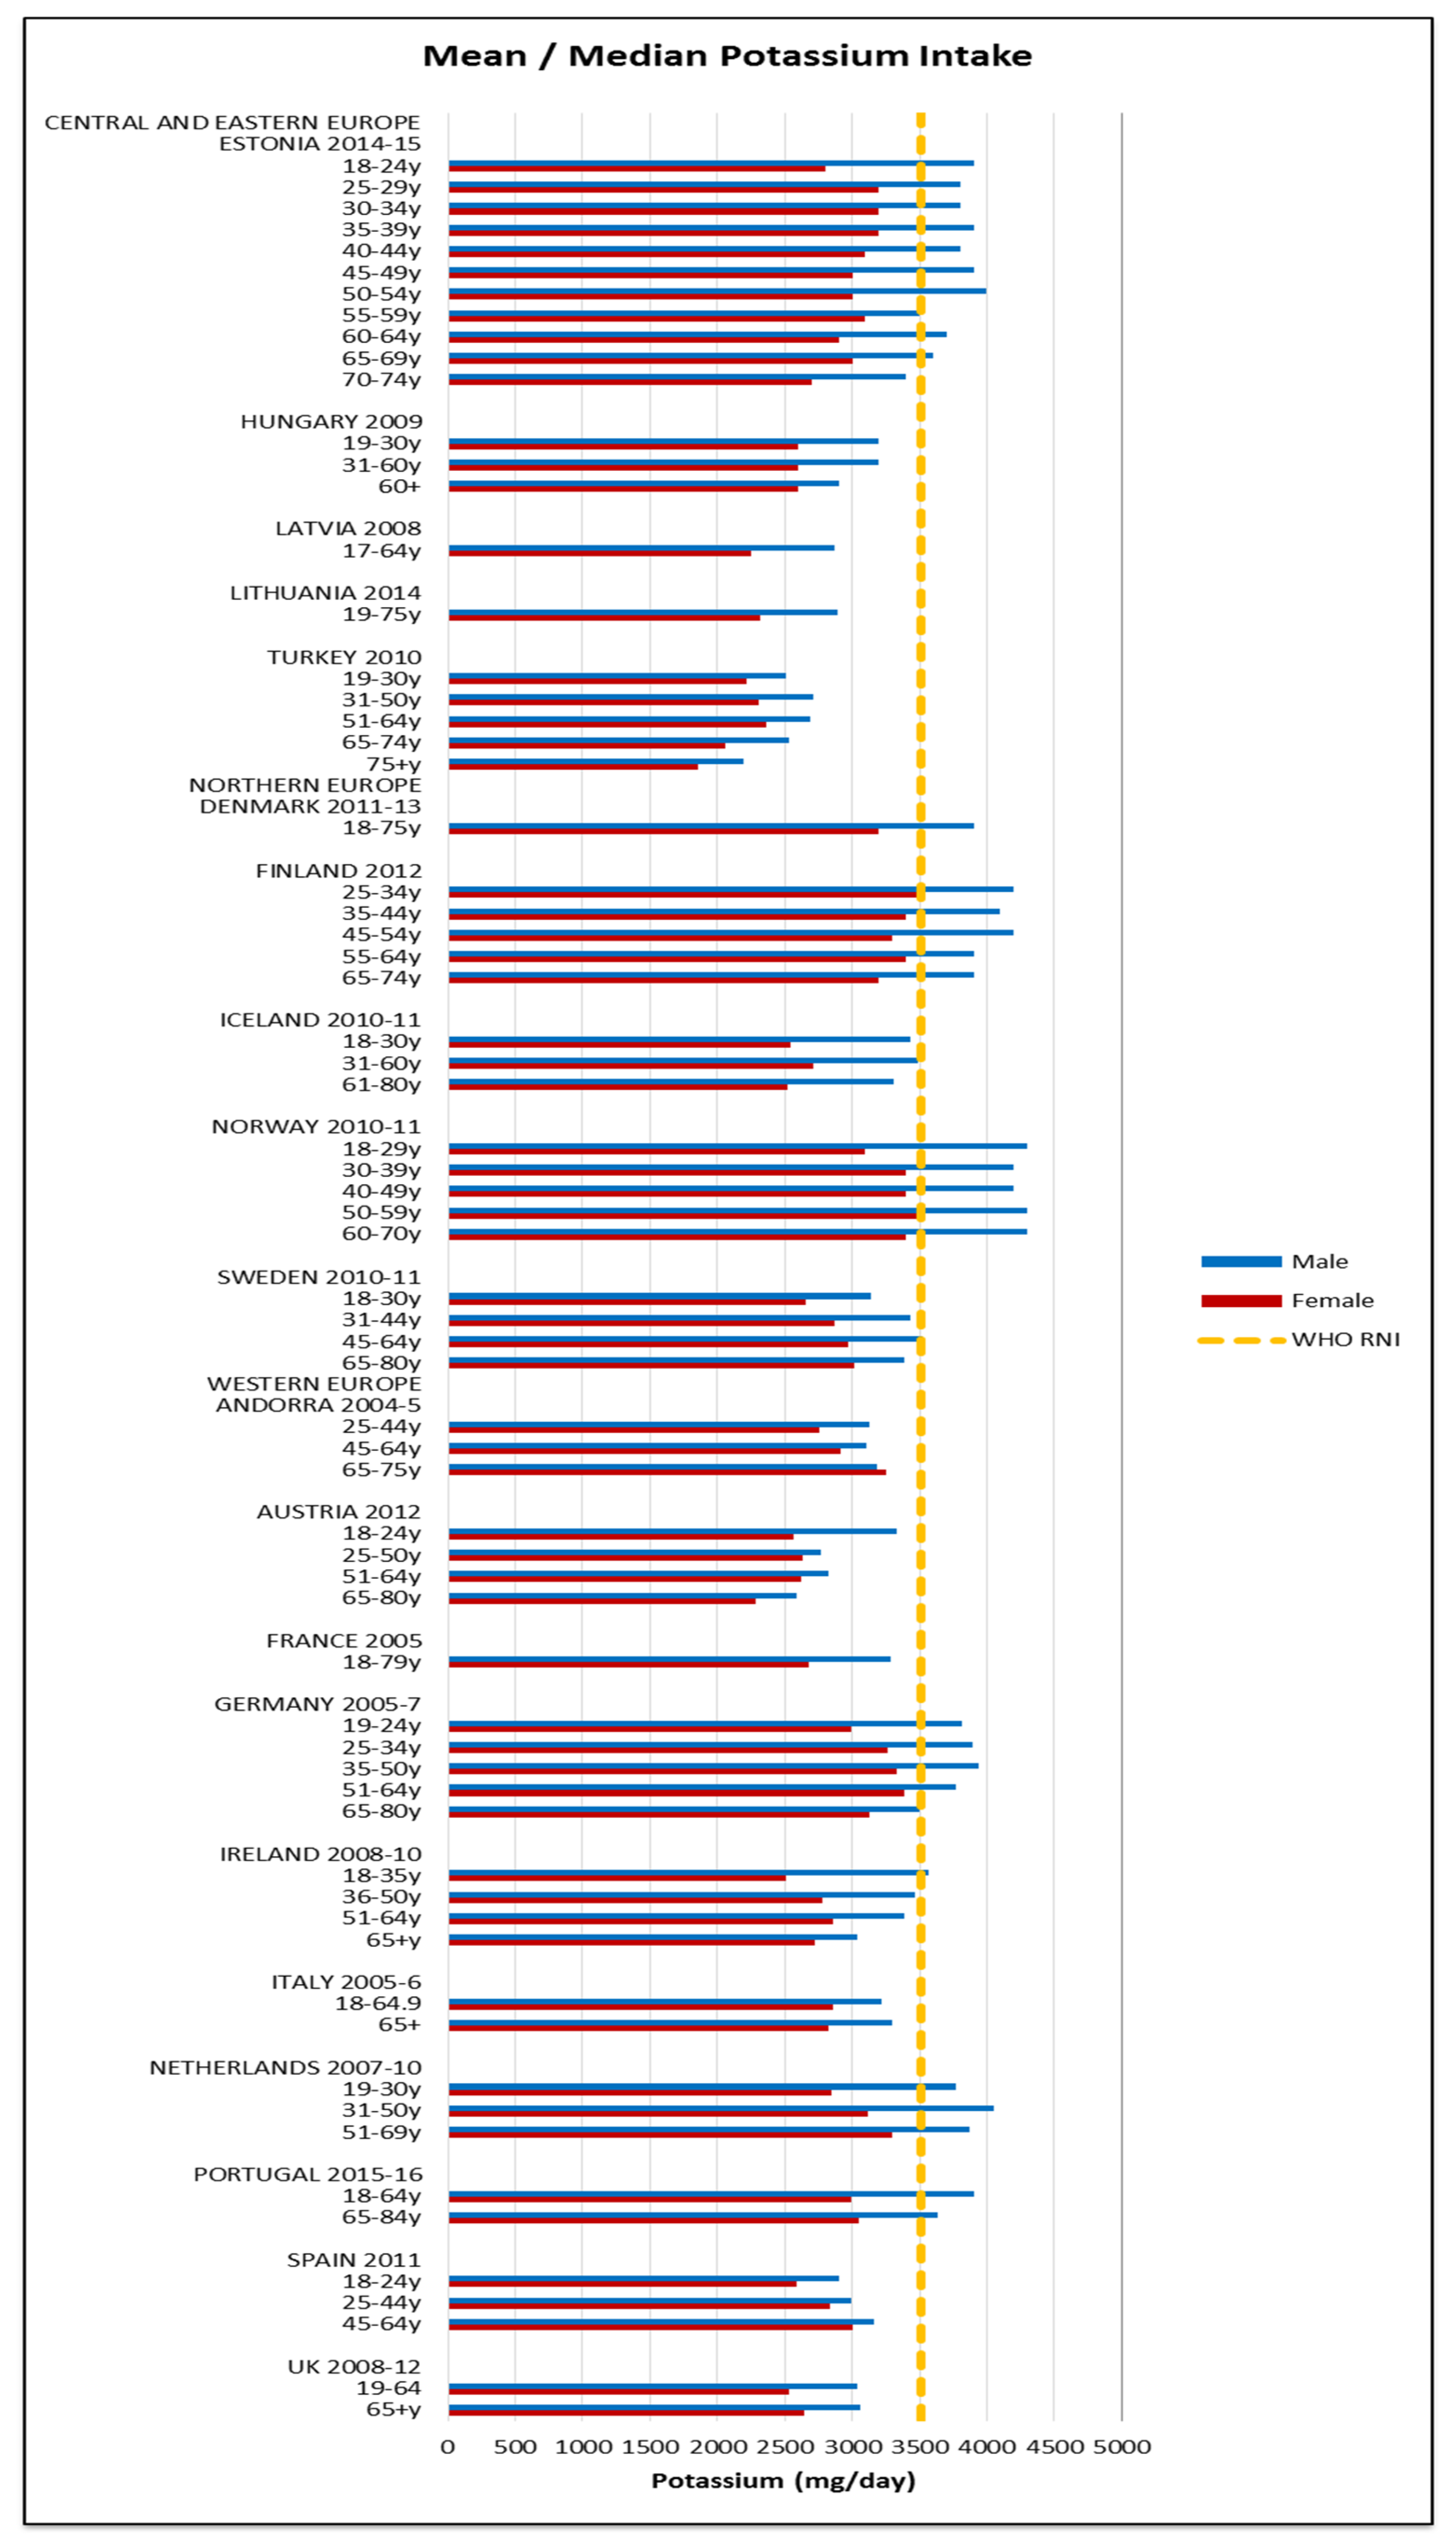
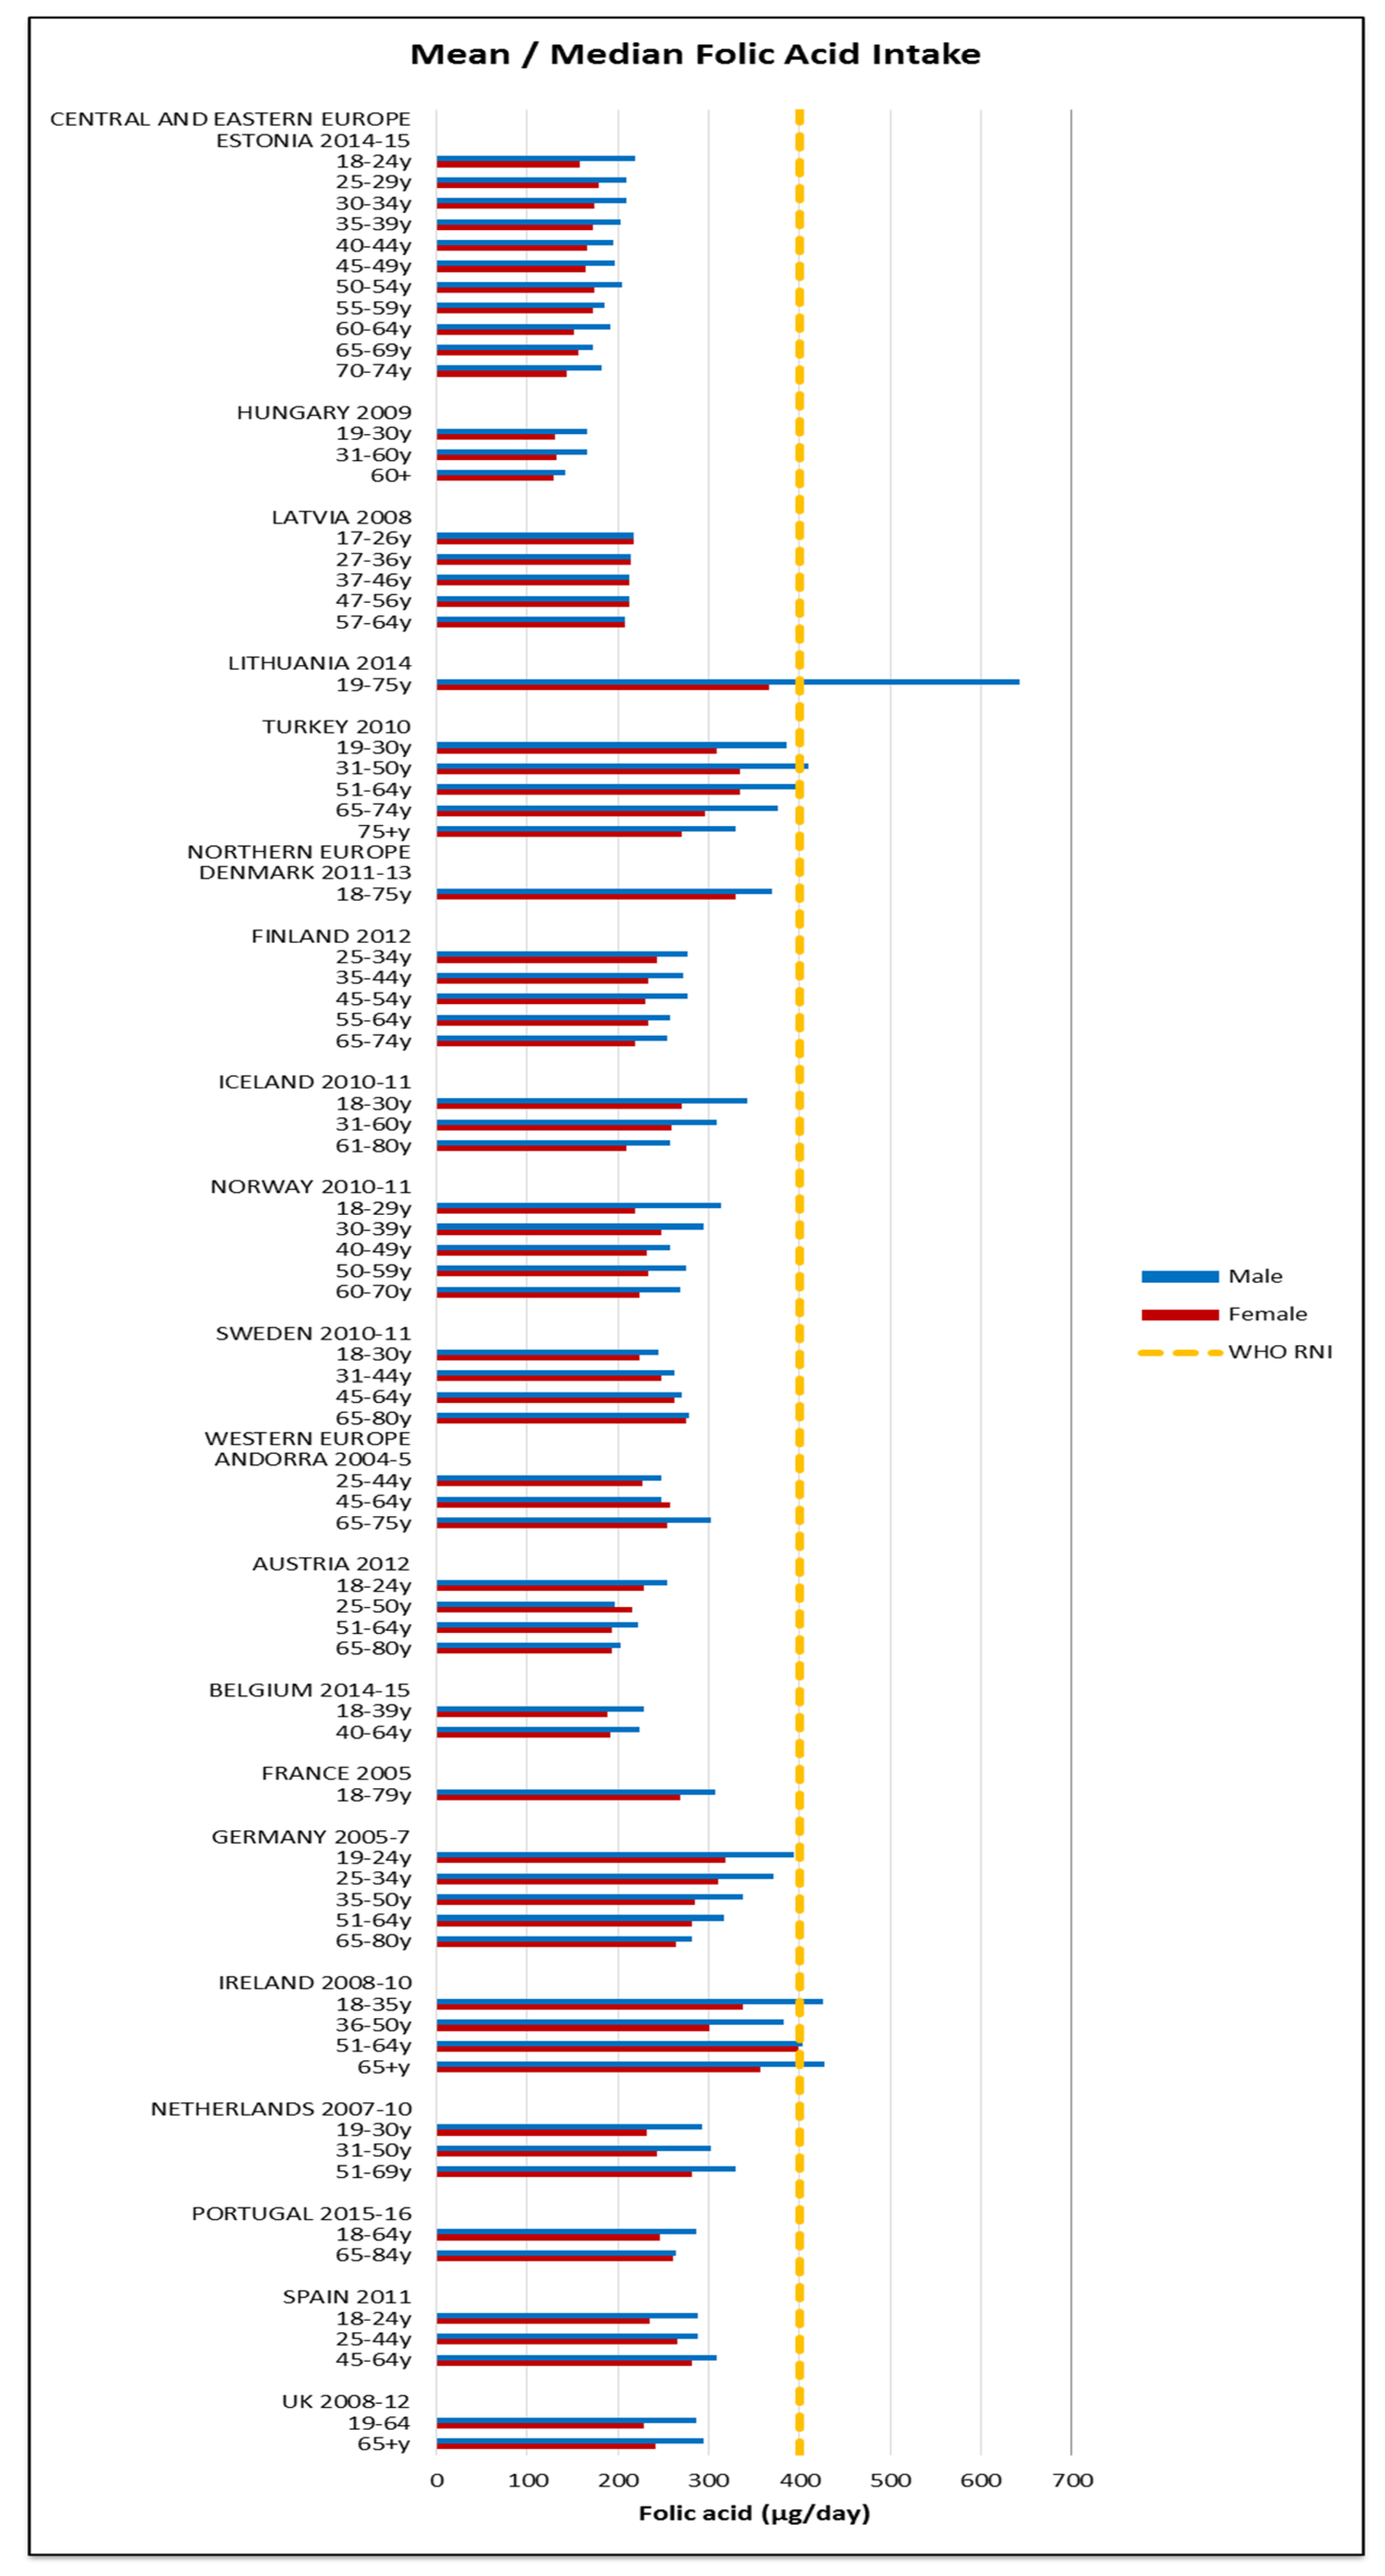
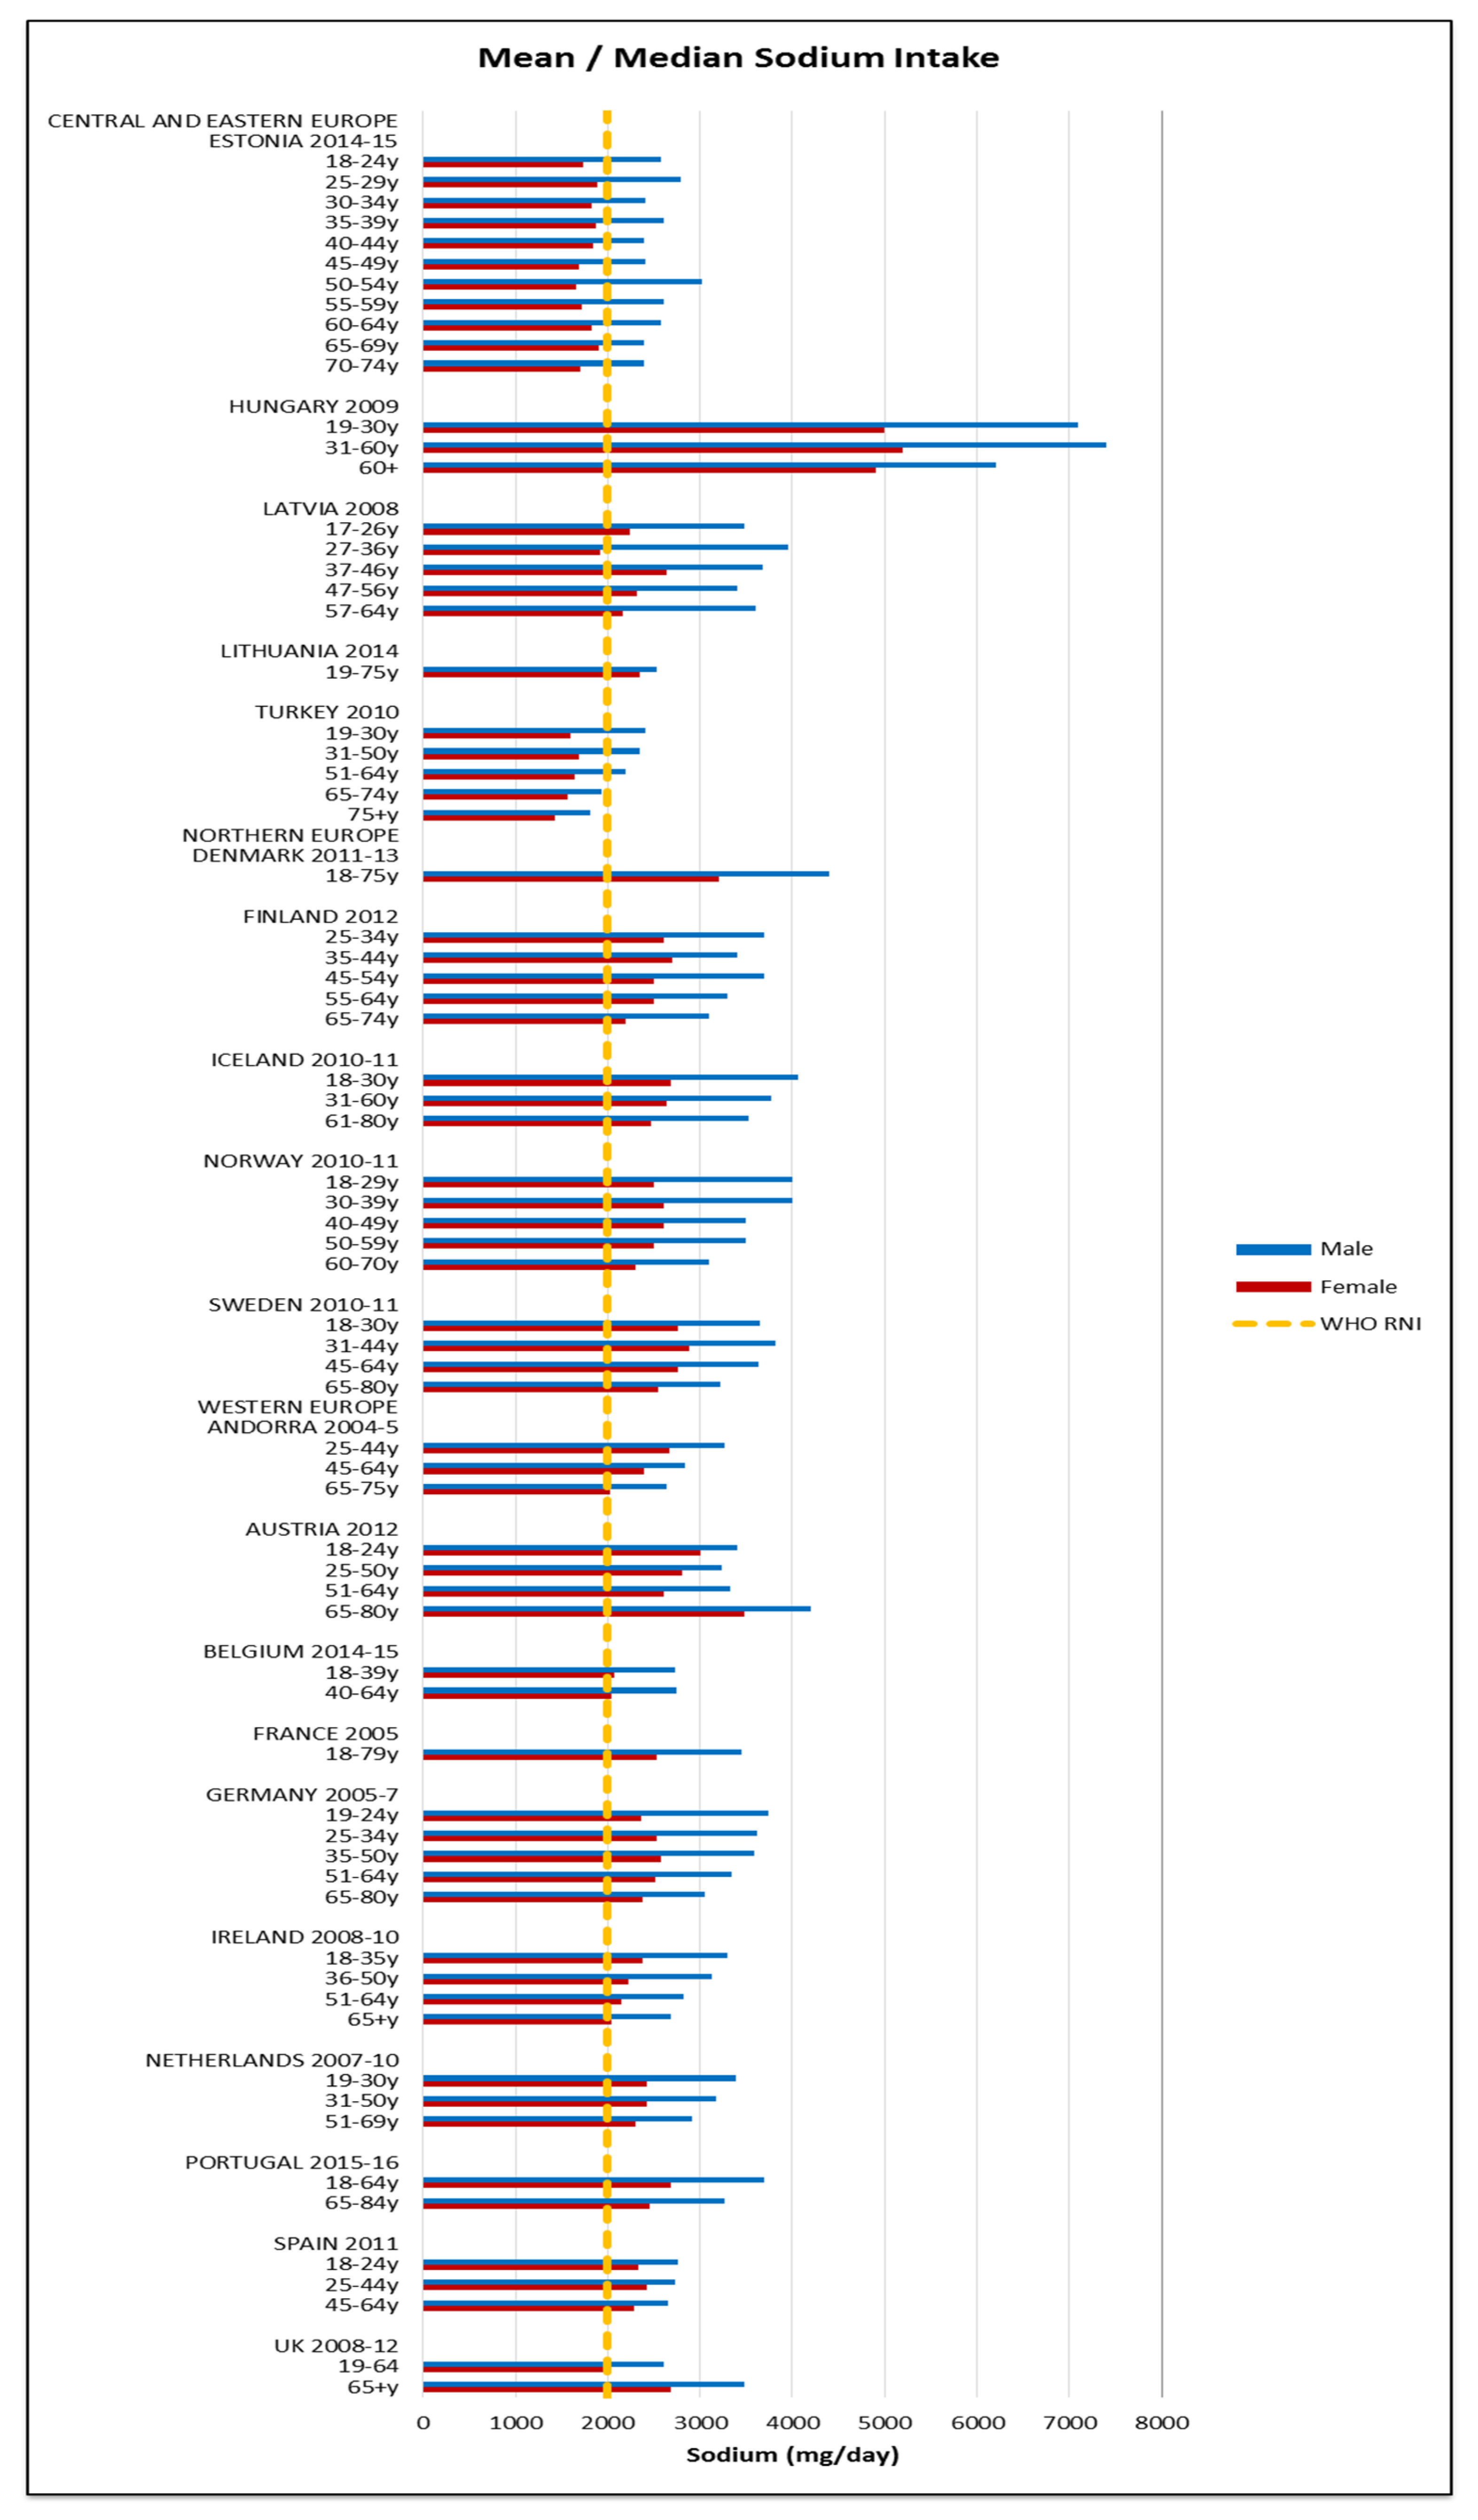
Table 1.
Survey inclusion and exclusion criteria.
| Included | Excluded |
|---|---|
| Surveys conducted at an individual level | Surveys collected at group i.e. household level |
| Nationally representative surveys | Non-nationally representative, regional only surveys |
| Results of surveys reported by published and unpublished reports, academic journals and websites | Surveys with data collected prior to 1990 |
| Surveys that included individuals >2 y | Surveys with samples exclusively <2 y |
| Surveys based on whole diet rather than specific food groups | Surveys with incomplete food group coverage |
| Surveys with small sample sizes (n < 200) |
Table 2.
Nutrients of interest in dietary surveys.
| Macronutrients | RNI | Micronutrients | RNI |
|---|---|---|---|
| Energy (MJ and kcal) | N/A | Folic acid (μg) | Minimum |
| Carbohydrates (g and %Energy (E)) | Target | Vitamin B12 (μg) | Minimum |
| Sugars (g) | Maximum | Vitamin D (μg) | Target |
| Sucrose (g) | Maximum | Calcium (mg) | Minimum |
| Starches (g) | N/A | Potassium (mg) | Minimum |
| Fiber (g) | Target | Sodium (mg) | Maximum |
| Total fat (g) | Maximum | Iron (mg) | Minimum |
| Saturates (g) | Maximum | Iodine (μg) | Minimum |
| Monounsaturated fatty acids (MUFA) (g) | N/A | Zinc (mg) | Minimum |
| Polyunsaturated fatty acids (PUFA) (g) | Target | ||
| Trans Fatty Acids (TFAs) (g) | Maximum | ||
| Protein (g) | Target | ||
| Omega fatty acids (g) | Target |
Table 3.
National diet surveys across countries in WHO Europe 1990–2016 with nutrient intakes reported.
Table 3.
National diet surveys across countries in WHO Europe 1990–2016 with nutrient intakes reported.
| Country | Survey Name | Survey Year | Source * | Sample Size | Sample Age | Dietary Methodology | Nutrient Reference Database | Nutrient Intakes by SEG Y/N ** | WHO RNIs Not Met by All Age Groups (%) Ϯ | Reference |
|---|---|---|---|---|---|---|---|---|---|---|
| Andorra | Evaluation of the Nutritional Status of the Andorran Population | 2004–2005 | 4 | 900 | 12–75 | 24 h recall (×2 for 35% sample), FFQ | CESNID. Tablas de composición de alimentos. Barcelona: Edicions Universitat de Barcelona-Centre d’Ensenyament Superior de Nutrició i Dietètica, 2002 | N | 83 | [17] |
| Austria | Austrian nutrition report 2012 (OSES) | 2010–2012 | 2 | 1002 | 7–14; 18–80 | 3-day diary (consecutive) (children); 2*24 h recall (adults). | Analysis run with software “(nut.s) science” based on Bundeslebensmittelschlüssel 3.01/Goldberg cut-offs for data cleaning | N | 72 | [18] |
| Belgium | Belgium National Food Consumption Survey (BNFCS) 2014 | 2014–2015 | 1/2 | 3146 | 3–64 | 2*24 h recall | The NIMS Belgian Table of Food Composition (Nubel); Dutch NEVO | N | 78 | [19,20] |
| Denmark | Danish National Survey of Diet and Physical Activity (DANSDA) 2011–2013 | 2011–2013 | 2 | 3946 | 4–75 | 7-day diary (consecutive) | Danish Food Composition Databank | N | 67 | [21] |
| Estonia | National Dietary Survey | 2014–2015 | 1 | 4906 | 4 m–74 y | 2*24 h recall (age > 10); 2*24 h food diary (age < 10); FFQ (age > 2) | Y—income, poverty threshold, education | 78 | ||
| Finland | The National FINDIET 2012 survey (FINRISK) | 2012 | 2 | 1708 | 25–74 | 48 h recall | Fineli 7 Food Composition Database | Y—education | 61 | [22] |
| France | Individual National Food Consumption Survey (INCA2) | 2006–2007 | 2 | 4079 | 3–79 | 7-day diary (consecutive) | Food Composition Database of CIQUAL of Afssa | Y—education | 83 | [23] |
| Germany | German National Nutrition Survey (Nationale Verzehrstudie) II (NVSII) | 2005–2007 | 1/3 | 15,371 | 14–80 | DISHES diet history interview, 24 h-recall, diet weighing diary (2*4 days) | Bundeslebensmittelschlüssel (BLS) | N | 78 | [24,25] |
| Hungary | Hungarian dietary survey 2009 | 2009 | 2 | 3077 | 19–30, 31–60, 60+ | 3-day diary, FFQ, | Új tápanyagtáblázat | N | 72 | [26,27] |
| Iceland | The Diet of Icelanders—a national dietary survey 2010–2011 | 2010–2011 | 1 | 1312 | 18–80 | 2*24 h recall + FFQ | Icelandic Database of Food Ingredients (ÍSGEM); Public Health Institute for Raw Materials in the Icelandic Market | N | 72 | [28,29] |
| Ireland | National adult nutrition survey 2011 (NANS) | 2008–2010 | 1 | 1500 | 18–90 | 4-day semi weighed food diary (consecutive) | McCance and Widdowson’s The Composition of Foods 5&6 editions | Y—social class and education | 72 | [30,31] |
| Italy | The third Italian National food consumption survey INRAN-SCAI 2005–2006 | 2005–2006 | 2 | 3323 | 0.1–97.7 | 3-day diary (consecutive) | Banca Dati di Composizione degli Alimenti | N | 83 | [32] |
| Latvia | Latvian National Food Consumption Survey 2007–2009 | 2008 | 1 | 1949 | 7–64 | 2*24 h recall, FFQ | Latvian National Food Composition Database 2009 | N | 78 | [33] |
| Lithuania | Study of actual nutrition and nutrition habits of Lithuanian adult population | 2013–2014 | 1 | 2513 | 19–75 | 24 h recall + questionnaire | EuroFIR Food Classification | N | 83 | [34] |
| The Netherlands | Dutch National Food Consumption Survey 2007–2010 (DNFCS 2007–2010) | 2007–2010 | 1/2 | 3819 | 7–69 | 2*24 h recalls | Dutch Food Composition Database (NEVO) | Y—education | 61 | [35,36,37] |
| Norway | Norwegian national diet survey NORKOST3 | 2010–2011 | 2 | 1787 | 18–70 | 2*24 h recall and FFQ | The Norwegian Food Composition Tables | Y—education | 83 | [38] |
| Portugal | National Food and Physical Activity Survey (IAN-AF) | 2015–2016 | 4 | 4221 | 3 m–84 y | 2*24 h recall (non-consecutive) and FPQ (electronic interview) 2-day food diary for children <10 y | Portuguese Food Composition Table (INSA) | N | 78 | [39,40] |
| Spain | ENIDE study (Sobre datos de la Encuesta Nacionalde Ingesta Dietética) | 2009–2010 | 2 | 3000 | 18–24; 25–44; 45–64 | 3-day diary + 24 h recall (consecutive) | Tablas de Composición de Alimentos, 15th ed | N | 83 | [41,42,43,44] |
| Sweden | Riksmaten 2010–2011 Swedish Adults Dietary Survey | 2010–2011 | 2 | 1797 | 18–80 | 4-day food diary (consecutive) | NFA Food Composition Database | N | 78 | [45] |
| Turkey | Turkey nutrition and health survey 2010 (TNHS) | 2010 | 2 | 14,248 | 0–100 | 24 h recall, FFQ | BEBS Nutritional Information System Software; Turkish Food Composition Database | N | 78 | [46,47] |
| UK | National Diet and Nutrition Survey Rolling Programme (NDNS RP 2008–2012) | 2008–2012 | 2 | 6828 | 1.5–94 | 4-day diary (consecutive) | McCance and Widdowson’s The Composition of Foods integrated dataset | Y—income | 72 | [48] |
* 1 = email contacts; 2 = general internet searches; 3 = Micha et al. [9]; 4 WHO Global Nutrition Policy Review 2017 extracted information. ** Countries that have reported nutrient intakes by socio-economic group (SEG) in addition to age and gender. Ϯ For those countries that do not report all nutrients, the RNIs for nutrients not reported are considered not met.
Table 4.
Weighted means * by country for macronutrient in 21 national dietary surveys in the WHO Europe region.
Table 4.
Weighted means * by country for macronutrient in 21 national dietary surveys in the WHO Europe region.
| COUNTRY | Energy (MJ) | Protein (g) | CHO (g) | Sugars (g) | Sucrose (g) | Starch (g) | Fibre (g) | Total Fat (g) | Saturates (g) | MUFA (g) | PUFA (g) | TFA (g) | n-3 (g) | n-6 (g) |
|---|---|---|---|---|---|---|---|---|---|---|---|---|---|---|
| Estonia | National Dietary Survey 2014–2015 | |||||||||||||
| Female | 6.7 | 64 | 194 | 17 | 65 | 26 | 24 | 11 | 0.5 | 1.8 | 8.2 | |||
| Male | 8.7 | 86 | 235 | 19 | 83 | 32 | 31 | 14 | 0.6 | 3.2 | 10.9 | |||
| Hungary | Hungarian Dietary Survey 2009 | |||||||||||||
| Female | 8.9 | 79 | 253 | 44 | 21 | 87 | 26 | 27 | 22 | 0.9 | 21.6 | |||
| Male | 12.0 | 106 | 315 | 50 | 25 | 122 | 36 | 40 | 29 | 1.2 | 28.4 | |||
| Latvia | Latvian National Food Consumption Survey 2007–2009 | |||||||||||||
| Female | 6.4 | 55 | 190 | 16 | 68 | 28 | 24 | 11 | ||||||
| Male | 8.9 | 79 | 246 | 20 | 93 | 38 | 33 | 15 | ||||||
| Lithuania | Study and evaluation of actual nutrition and nutrition habits of Lithuanian adult population 2013–2014 | |||||||||||||
| Female | 6.5 | 56 | 178 | 56 | 15 | 71 | 22 | 27 | 16 | |||||
| Male | 9.2 | 75 | 224 | 55 | 17 | 108 | 34 | 41 | 24 | |||||
| Turkey | Turkey nutrition and health survey 2010 (TNHS) | |||||||||||||
| Female | 6.5 | 50 | 197 | 20 | 61 | 20 | 22 | 16 | 1.1 | 14.5 | ||||
| Male | 8.6 | 67 | 260 | 23 | 78 | 26 | 28 | 19 | 1.4 | 17.4 | ||||
| CEEC TOTAL Female | 6.7 | 53 | 202 | 56 | 44 | 20 | 64 | 21 | 23 | 16 | 0.5 | 1.1 | 15.2 | |
| CEEC TOTAL Male | 9.0 | 72 | 264 | 55 | 50 | 23 | 84 | 28 | 30 | 20 | 0.6 | 1.4 | 18.5 | |
| Denmark | Danish Dietary habits 2011–2013 | |||||||||||||
| Female | 8.4 | 76 | 211 | 43 | 21 | 83 | 33 | 31 | 13 | 1.3 | ||||
| Male | 11.2 | 101 | 269 | 56 | 24 | 111 | 45 | 41 | 17 | 1.7 | ||||
| Finland | The national FINDIET 2012 survey | |||||||||||||
| Female | 7.0 | 70 | 181 | 42 | 21 | 67 | 26 | 24 | 12 | 0.8 | 2.8 | 8.7 | ||
| Male | 9.1 | 91 | 225 | 49 | 22 | 88 | 34 | 32 | 15 | 1.1 | 3.5 | 11.0 | ||
| Iceland | The Diet of Icelanders—a national dietary survey 2010–2011 | |||||||||||||
| Female | 7.4 | 76 | 188 | 87 | 16 | 72 | 29 | 23 | 12 | 1.5 | 2.9 | 9.0 | ||
| Male | 10.0 | 106 | 240 | 104 | 18 | 99 | 40 | 32 | 16 | 2.2 | 3.8 | 11.9 | ||
| Norway | Norkost3 2010–2011 | |||||||||||||
| Female | 8.0 | 81 | 205 | 36 | 22 | 75 | 29 | 25 | 14 | |||||
| Male | 10.9 | 112 | 278 | 48 | 27 | 102 | 39 | 34 | 19 | |||||
| Sweden | Riksmaten 2010–2011 Swedish Adult Dietary Survey | |||||||||||||
| Female | 7.4 | 72 | 193 | 37 | 19 | 70 | 27 | 26 | 12 | 2.5 | 8.6 | |||
| Male | 9.3 | 92 | 238 | 41 | 21 | 87 | 33 | 33 | 14 | 2.9 | 10.5 | |||
| NORTH TOTAL Female | 7.6 | 74 | 197 | 87 | 39 | 20 | 73 | 28 | 26 | 13 | 1.1 | 2.6 | 8.6 | |
| NORTH TOTAL Male | 10.0 | 98 | 250 | 104 | 47 | 23 | 95 | 37 | 35 | 16 | 1.4 | 3.1 | 10.7 | |
| Andorra | Evaluation of the nutritional status of the Andorran population 2004–2005 | |||||||||||||
| Female | 6.8 | 81 | 164 | 77 | 17 | 75 | 22 | 32 | 10 | |||||
| Male | 8.4 | 95 | 197 | 86 | 17 | 84 | 28 | 41 | 13 | |||||
| Austria | Austrian nutrition report 2010–2012 | |||||||||||||
| Female | 7.5 | 67 | 209 | 43 | 21 | 72 | 31 | 24 | 13 | 1.4 | 11.6 | |||
| Male | 8.9 | 79 | 235 | 48 | 21 | 86 | 37 | 28 | 14 | 1.5 | 12.3 | |||
| Belgium | The Belgian food consumption survey 2014–2015 | |||||||||||||
| Female | 7.9 | 71 | 202 | 94 | 18 | 77 | 28 | 28 | 14 | 0.8 | ||||
| Male | 10.9 | 95 | 274 | 124 | 20 | 102 | 36 | 37 | 18 | 1.0 | ||||
| France | INCA2 2006–2007 | |||||||||||||
| Female | 7.6 | 74 | 199 | 89 | 16 | 80 | 32 | 29 | 12 | |||||
| Male | 9.8 | 100 | 262 | 101 | 19 | 100 | 41 | 36 | 15 | |||||
| Germany | German National Nutrition Survey II 2005–2007 | |||||||||||||
| Female | 7.9 | 67 | 227 | 25 | 74 | |||||||||
| Male | 10.5 | 89 | 279 | 27 | 100 | |||||||||
| Ireland | National adult nutrition survey 2008–2010 | |||||||||||||
| Female | 7.1 | 70 | 198 | 81 | 18 | 66 | 29 | 27 | 14 | 1.0 | 1.6 | |||
| Male | 9.8 | 98 | 260 | 100 | 21 | 90 | 38 | 35 | 16 | 1.6 | 1.9 | |||
| Italy | The third Italian National food consumption survey INRAN-SCAI 2005–2006 | |||||||||||||
| Female | 8.0 | 75 | 236 | 79 | 18 | 77 | 24 | 37 | 10 | |||||
| Male | 9.9 | 92 | 282 | 85 | 20 | 94 | 29 | 46 | 12 | |||||
| The Netherlands | Dutch National Food Consumption Survey (DNFCS) 2007–2010 | |||||||||||||
| Female | 8.2 | 75 | 220 | 106 | 19 | 76 | 29 | 26 | 14 | 1.3 | 1.7 | 11.8 | ||
| Male | 11.1 | 98 | 291 | 128 | 23 | 103 | 38 | 36 | 20 | 1.6 | 2.2 | 17.0 | ||
| Portugal | National Food and Physical Activity Survey (IAN-AF) 2015–2016 | |||||||||||||
| Female | 7.2 | 78 | 195 | 77 | 17 | 60 | 22 | 25 | 11 | 0.8 | 9.5 | |||
| Male | 9.8 | 106 | 246 | 85 | 20 | 77 | 27 | 32 | 13 | 1.0 | 12.3 | |||
| Spain ** | ENIDE 2011 | |||||||||||||
| Female | 9.2 | 88 | 199 | 72 | 19 | 93 | 26 | 39 | 13 | |||||
| Male | 9.8 | 109 | 242 | 76 | 21 | 115 | 33 | 48 | 15 | |||||
| UK | National Diet and Nutrition Survey (NDNS) Y1-4 2008–2012 | |||||||||||||
| Female | 6.7 | 65 | 195 | 85 | 13 | 60 | 22 | 21 | 10 | 1.1 | 1.8 | 8.6 | ||
| Male | 8.7 | 83 | 247 | 105 | 15 | 77 | 28 | 28 | 13 | 1.5 | 2.2 | 11.0 | ||
| WEST TOTAL Female | 7.8 | 73 | 212 | 84 | 43 | 19 | 75 | 26 | 30 | 12 | 1.1 | 1.7 | 9.5 | |
| WEST TOTAL Male | 9.8 | 94 | 264 | 96 | 48 | 21 | 96 | 33 | 38 | 14 | 1.4 | 2.1 | 12.2 | |
| EUROPE TOTAL Female | 7.6 | 69 | 209 | 84 | 41 | 19 | 73 | 25 | 28 | 13 | 1.1 | 1.5 | 11.9 | |
| EUROPE TOTAL Male | 9.7 | 90 | 264 | 96 | 48 | 21 | 94 | 32 | 36 | 16 | 1.4 | 1.9 | 14.9 | |
* For each country weighted means were calculated for each nutrient by multiplying the male/female mean for each age group by the number of men/women in that age group, then dividing the total by the total number of men/women in the country in question. For each nutrient regional weighted means were calculated by multiplying the male/female mean for each country by the total national population [16], adding this figure for each country and dividing by the total sum of the national populations in that region. For each nutrient total European weighted means were calculated by multiplying the male/female mean for each age country by the total national population [16], adding this figure for each country and dividing by the total sum of the national populations in all three European regions. ** Figures for Spain are based on median rather than mean values.
Table 5.
Weighted means* by country for micronutrient in 21 national dietary surveys in the WHO Europe region.
Table 5.
Weighted means* by country for micronutrient in 21 national dietary surveys in the WHO Europe region.
| SURVEY | Folic Acid (μg) | Vitamin B12 (μg) | Vitamin D (μg) | Calcium (mg) | Potassium (mg) | Sodium (mg) | Iron (mg) | Iodine (μg) | Zinc (mg) |
|---|---|---|---|---|---|---|---|---|---|
| Estonia | National Dietary Survey 2014–2015 | ||||||||
| Female | 166 | 5.8 | 4.3 | 648 | 3037 | 1801 | 10.8 | 108 | 8.4 |
| Male | 198 | 8.0 | 5.7 | 767 | 3761 | 2562 | 13.6 | 134 | 11.4 |
| Hungary | Hungarian Dietary Survey 2009 | ||||||||
| Female | 131 | 2.8 | 2.0 | 651 | 2600 | 5086 | 9.5 | 7.5 | |
| Male | 161 | 3.7 | 2.6 | 701 | 3140 | 7100 | 12.5 | 10.2 | |
| Latvia | Latvian National Food Consumption Survey 2007–2009 | ||||||||
| Female | 214 | 3.7 | 1.9 | 457 | 2250 | 2283 | 9.1 | 53 | 7.2 |
| Male | 214 | 3.7 | 1.9 | 555 | 2868 | 3598 | 12.1 | 68 | 10.1 |
| Lithuania | Study and Evaluation of Actual Nutrition and Nutrition Habits of Lithuanian Adult Population 2013–2014 | ||||||||
| Female | 366 | 1.0 | 3.1 | 506 | 2322 | 2348 | 8.9 | 28 | 7.0 |
| Male | 643 | 1.5 | 3.7 | 576 | 2887 | 2538 | 12.2 | 33 | 9.6 |
| Turkey | Turkey Nutrition and Health Survey 2010 (TNHS) | ||||||||
| Female | 320 | 2.5 | 0.8 | 583 | 2242 | 1625 | 10.0 | 58 | 8.2 |
| Male | 393 | 4.0 | 1.2 | 704 | 2608 | 2552 | 12.3 | 69 | 10.7 |
| CEEC TOTAL Female | 298 | 2.6 | 1.1 | 586 | 2292 | 2019 | 9.9 | 58 | 8.1 |
| CEEC TOTAL Male | 370 | 3.9 | 1.5 | 698 | 2692 | 3041 | 12.3 | 69 | 10.6 |
| Denmark | Danish Dietary Habits 2011–2013 | ||||||||
| Female | 329 | 5.6 | 4.3 | 1038 | 3200 | 3200 | 10.0 | 227 | 10.5 |
| Male | 370 | 8.0 | 5.3 | 1188 | 3900 | 4400 | 13.0 | 268 | 14.1 |
| Finland | The National FINDIET 2012 Survey | ||||||||
| Female | 231 | 5.0 | 8.7 | 1040 | 3352 | 2492 | 10.0 | 186 | 10.2 |
| Male | 266 | 7.0 | 11.8 | 1178 | 4037 | 3400 | 12.4 | 228 | 12.7 |
| Iceland | The Diet of Icelanders—a National Dietary Survey 2010–2011 | ||||||||
| Female | 249 | 5.5 | 6.6 | 820 | 2632 | 2600 | 9.4 | 142 | 8.8 |
| Male | 304 | 8.4 | 9.7 | 1034 | 3433 | 3773 | 12.5 | 195 | 12.4 |
| Norway | Norkost3 2010–2011 | ||||||||
| Female | 231 | 6.0 | 4.9 | 811 | 3374 | 2510 | 10.0 | ||
| Male | 279 | 8.8 | 6.7 | 1038 | 4263 | 3558 | 12.5 | ||
| Sweden | Riksmaten 2010–2011 Swedish Adult Dietary Survey | ||||||||
| Female | 252 | 5.0 | 6.4 | 825 | 2887 | 2766 | 9.6 | ||
| Male | 266 | 6.0 | 7.6 | 945 | 3410 | 3591 | 11.5 | ||
| NORTH TOTAL Female | 260 | 5.3 | 6.1 | 912 | 3142 | 2751 | 9.8 | 205 | 10.3 |
| NORTH TOTAL Male | 291 | 7.2 | 7.8 | 1064 | 3812 | 3721 | 12.2 | 247 | 13.4 |
| Andorra | Evaluation of the Nutritional Status of the Andorran Population 2004–2005 | ||||||||
| Female | 241 | 5.4 | 2.6 | 790 | 2867 | 2495 | 10.8 | 8.1 | |
| Male | 255 | 7.4 | 4.1 | 831 | 3126 | 3086 | 13.3 | 9.9 | |
| Austria | Austrian Nutrition Report 2010–2012 | ||||||||
| Female | 206 | 4.1 | 2.8 | 771 | 2504 | 3027 | 10.6 | 133 | 9.3 |
| Male | 209 | 4.9 | 3.9 | 821 | 2775 | 3532 | 11.4 | 144 | 11.0 |
| Belgium | The Belgian Food Consumption Survey 2014–2015 | ||||||||
| Female | 190 | 3.7 | 3.5 | 720 | 2062 | 8.6 | 127 | ||
| Male | 226 | 5.2 | 4.2 | 821 | 2739 | 11.1 | 174 | ||
| France | INCA2 2006–07 | ||||||||
| Female | 268 | 5.1 | 2.4 | 850 | 2681 | 2533 | 11.5 | 117 | 9.1 |
| Male | 307 | 6.5 | 2.7 | 984 | 3287 | 3447 | 14.9 | 136 | 12.4 |
| Germany | German National Nutrition Survey II 2005–2007 | ||||||||
| Female | 285 | 4.4 | 3.0 | 1020 | 3272 | 2502 | 12.4 | 196 | 9.5 |
| Male | 327 | 6.4 | 3.9 | 1115 | 3779 | 3418 | 15.0 | 248 | 12.1 |
| Ireland | National Adult Nutrition Survey 2008–2010 | ||||||||
| Female | 342 | 7.8 | 4.7 | 851 | 2694 | 2231 | 13.7 | 9.2 | |
| Male | 410 | 7.2 | 4.7 | 1038 | 3426 | 3060 | 15.5 | 11.6 | |
| Italy | The third Italian National Food Consumption Survey INRAN-SCAI 2005–2006 | ||||||||
| Female | 5.3 | 2.2 | 735 | 2853 | 10.3 | 10.5 | |||
| Male | 6.6 | 2.6 | 803 | 3231 | 12.7 | 12.5 | |||
| The Netherlands | Dutch National Food Consumption Survey (DNFCS) 2007–2010 | ||||||||
| Female | 252 | 4.3 | 3.1 | 993 | 3086 | 2386 | 9.9 | 158 | 9.5 |
| Male | 308 | 5.5 | 4.1 | 1151 | 3895 | 3165 | 11.9 | 201 | 12.3 |
| Portugal | National Food and Physical Activity Survey (IAN-AF) 2015–2016 | ||||||||
| Female | 248 | 4.7 | 3.5 | 730 | 2999 | 2647 | 10.8 | 9.2 | |
| Male | 281 | 5.5 | 4.0 | 816 | 3845 | 3605 | 14.0 | 11.9 | |
| Spain ** | ENIDE 2011 | ||||||||
| Female | 266 | 6.1 | 3.7 | 835 | 2865 | 2347 | 13.7 | 85 | 8.7 |
| Male | 296 | 7.9 | 4.3 | 884 | 3049 | 2702 | 16.1 | 100 | 10.4 |
| UK | National Diet and Nutrition Survey (NDNS) Y1-4 2008–2012 | ||||||||
| Female | 231 | 4.8 | 2.7 | 743 | 2558 | 2148 | 9.6 | 146 | 7.6 |
| Male | 289 | 6.1 | 3.3 | 896 | 3044 | 2793 | 11.6 | 187 | 9.6 |
| WEST TOTAL Female | 259 | 5.0 | 2.8 | 846 | 2869 | 2405 | 11.3 | 143 | 9.1 |
| WEST TOTAL Male | 302 | 6.5 | 3.5 | 951 | 3349 | 3153 | 13.8 | 178 | 11.5 |
| EUROPE TOTAL Female | 268 | 4.5 | 2.7 | 799 | 2771 | 2341 | 10.9 | 127 | 8.9 |
| EUROPE TOTAL Male | 316 | 6.0 | 3.3 | 908 | 3245 | 3163 | 13.4 | 156 | 11.4 |
* For each country, weighted means were calculated for each nutrient by multiplying the male/female mean for each age group by the number of men/women in that age group, then dividing the total by the total number of men/women in the country in question. For each nutrient regional weighted means were calculated by multiplying the male/female mean for each country by the total national population [16], adding this figure for each country and dividing by the total sum of the national populations in that region. For each nutrient total European weighted means were calculated by multiplying the male/female mean for each age country by the total national population [16], adding this figure for each country and dividing by the total sum of the national populations in all three European regions. ** Figures for Spain are based on median rather than mean values.
© 2017 by the authors. Licensee MDPI, Basel, Switzerland. This article is an open access article distributed under the terms and conditions of the Creative Commons Attribution (CC BY) license (http://creativecommons.org/licenses/by/4.0/).
Share and Cite
MDPI and ACS Style
Rippin, H.L.; Hutchinson, J.; Jewell, J.; Breda, J.J.; Cade, J.E. Adult Nutrient Intakes from Current National Dietary Surveys of European Populations. Nutrients 2017, 9, 1288. https://doi.org/10.3390/nu9121288
AMA Style
Rippin HL, Hutchinson J, Jewell J, Breda JJ, Cade JE. Adult Nutrient Intakes from Current National Dietary Surveys of European Populations. Nutrients. 2017; 9(12):1288. https://doi.org/10.3390/nu9121288
Chicago/Turabian StyleRippin, Holly L., Jayne Hutchinson, Jo Jewell, Joao J. Breda, and Janet E. Cade. 2017. "Adult Nutrient Intakes from Current National Dietary Surveys of European Populations" Nutrients 9, no. 12: 1288. https://doi.org/10.3390/nu9121288
Note that from the first issue of 2016, this journal uses article numbers instead of page numbers. See further details here.