Dietary Sources of Phosphorus among Adults in the United States: Results from NHANES 2001–2014

 ,
,
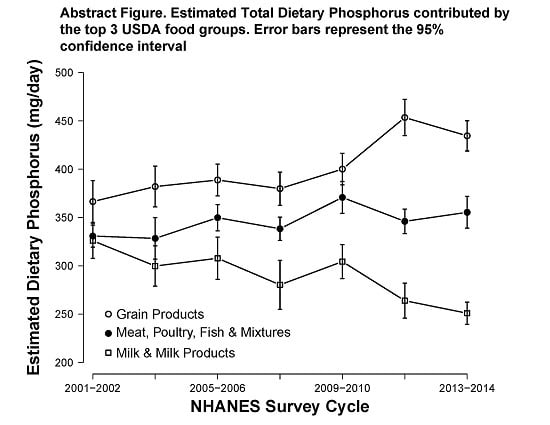
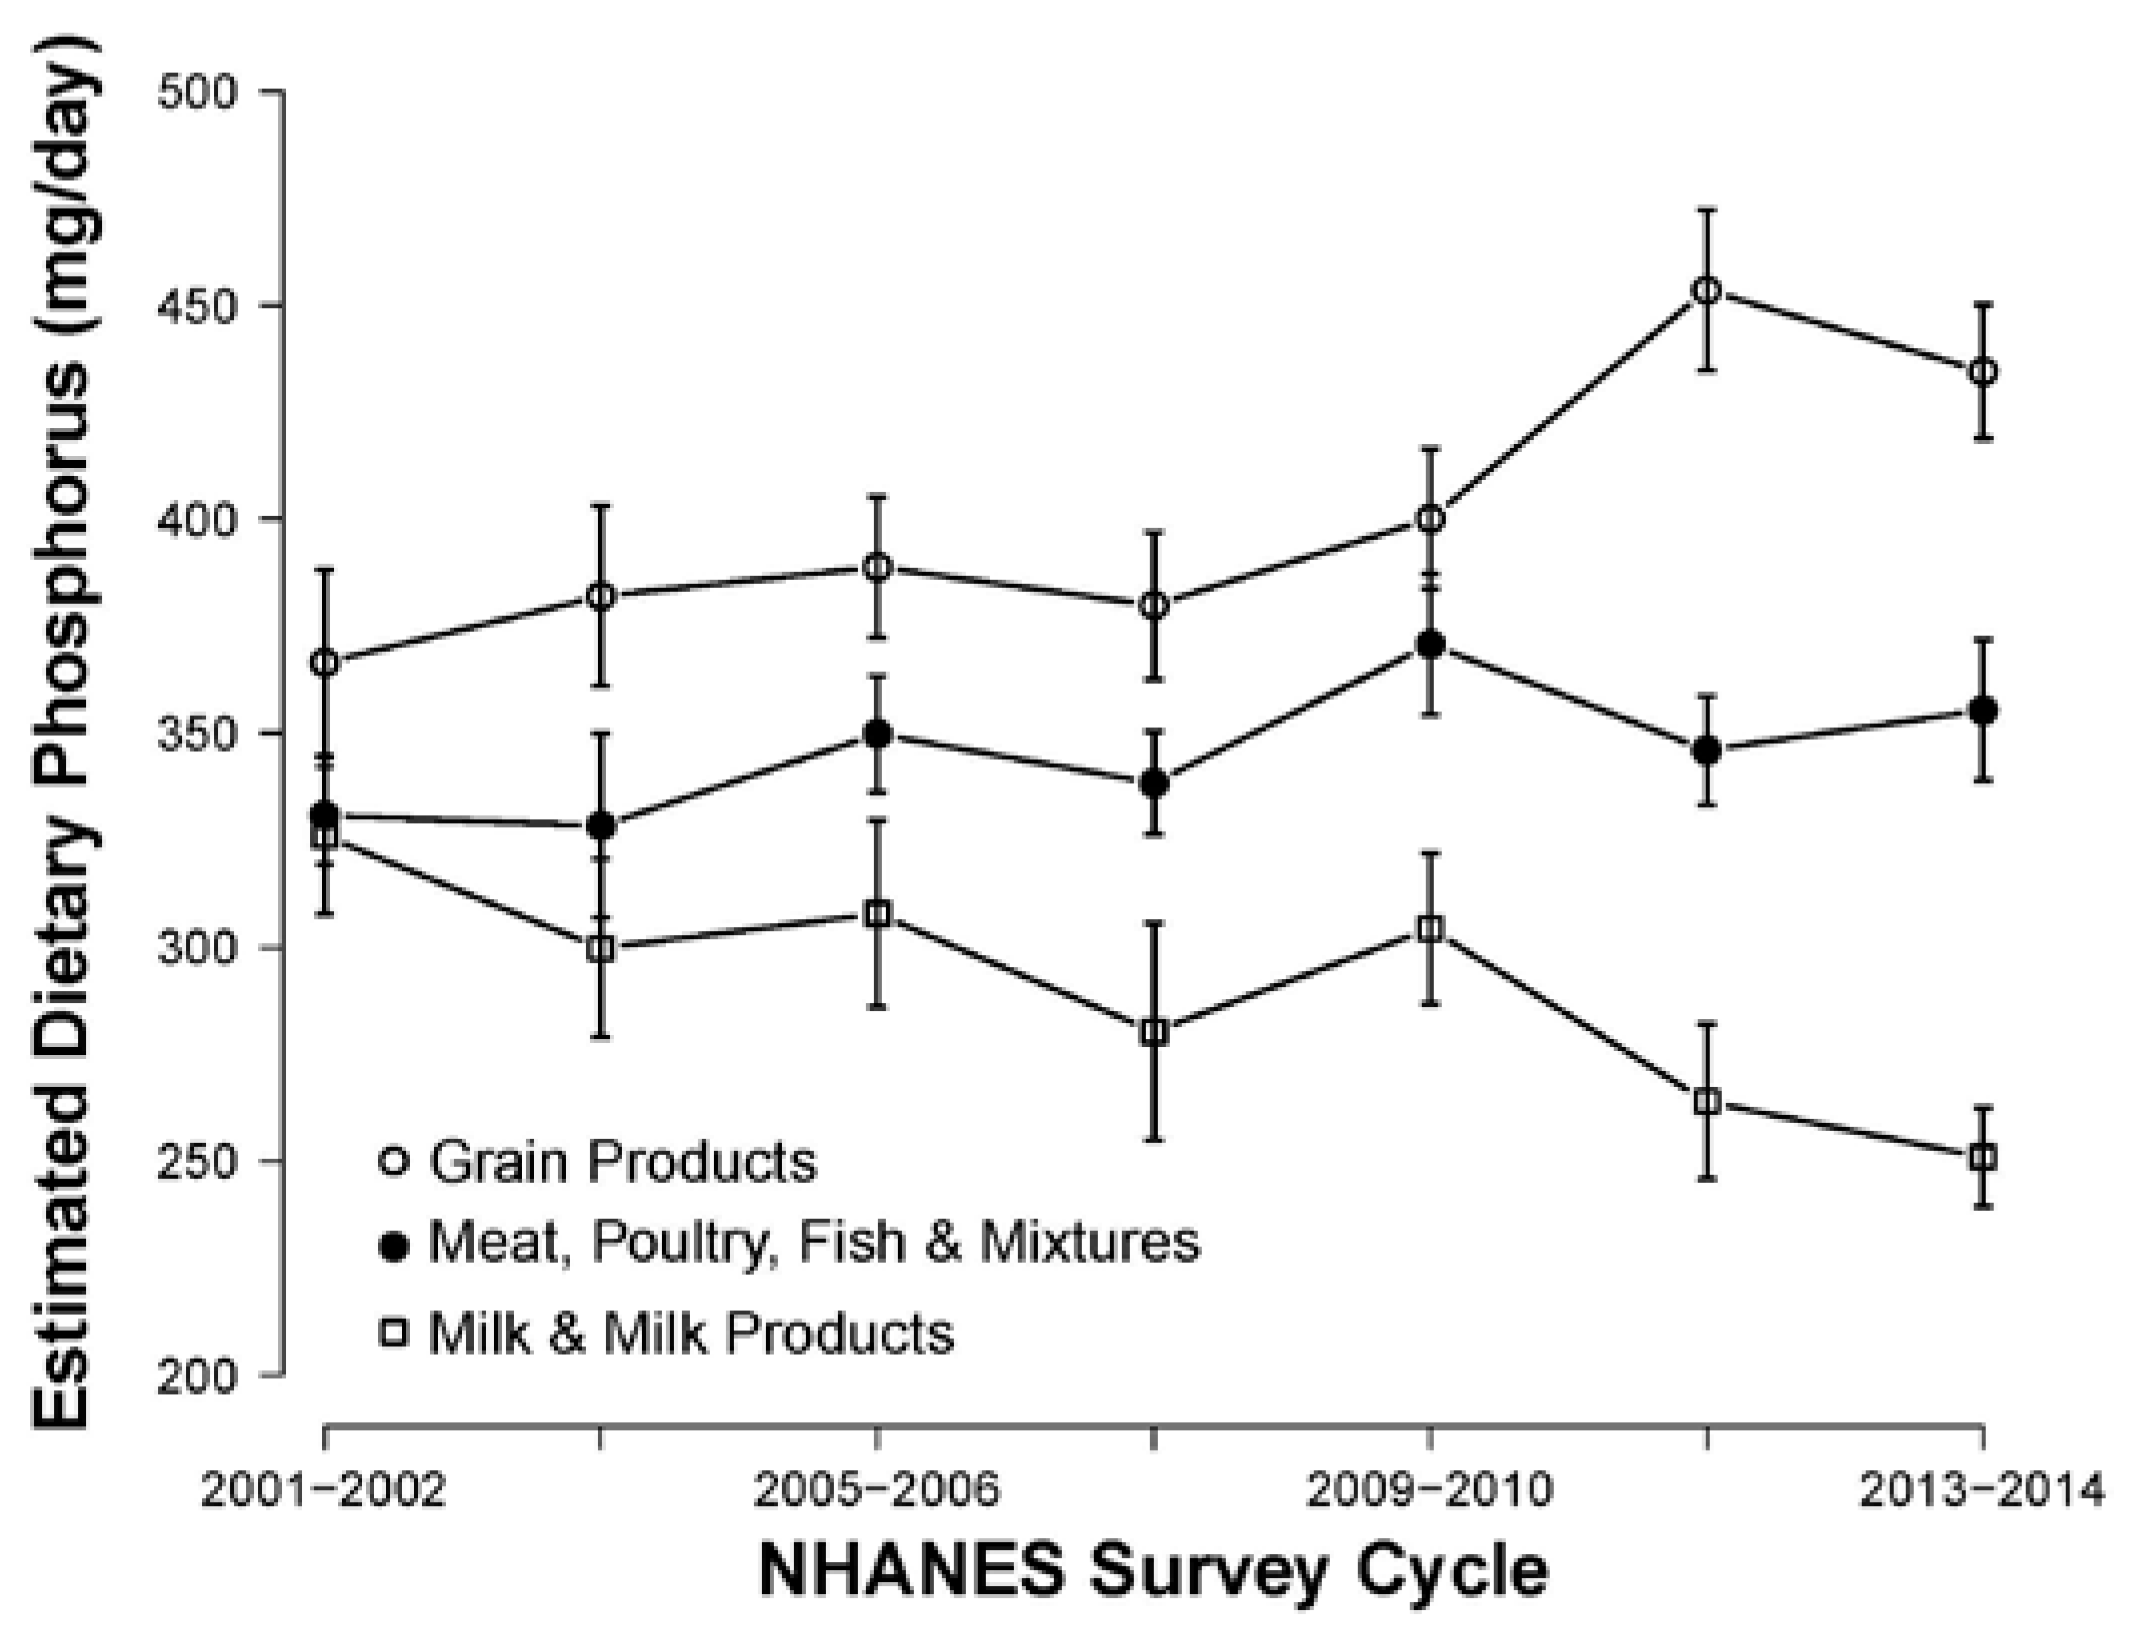
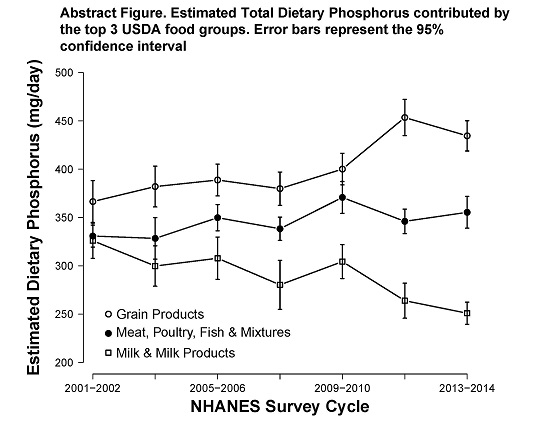
Abstract
:
1. Introduction
2. Materials and Methods
3. Results
4. Discussion
Supplementary Materials
Acknowledgments
Author Contributions
Conflicts of Interest
References
- Department of Health and Human Services and USDA. Scientific Report of the 2015 Dietary Guidelines Advisory Committee. Updated 2015. Available online: http://health.gov/dietaryguidelines/2015-scientific-report/PDFs/Scientific-Report-of-the-2015-Dietary-Guidelines-Advisory-Committee.pdf (accessed on 11 September 2016).
- Andrassy, K.M. Comments on ‘KDIGO 2012 clinical practice guideline for the evaluation and management of chronic kidney disease’. Kidney Int. 2013, 84, 622–623. [Google Scholar] [CrossRef] [PubMed]
- Palmer, S.C.; Hayen, A.; Macaskill, P.; Pellegrini, F.; Craig, J.C.; Elder, G.J.; Strippoli, G.F. Serum levels of phosphorus, parathyroid hormone, and calcium and risks of death and cardiovascular disease in individuals with chronic kidney disease: A systematic review and meta-analysis. JAMA 2011, 305, 1119–1127. [Google Scholar] [CrossRef] [PubMed]
- Tonelli, M.; Sacks, F.; Pfeffer, M.; Gao, Z.; Curhan, G.; Cholesterol and Recurrent Events Trial Investigators. Relation between serum phosphate level and cardiovascular event rate in people with coronary disease. Circulation 2005, 112, 2627–2633. [Google Scholar] [CrossRef] [PubMed]
- Schwarz, S.; Trivedi, B.K.; Kalantar-Zadeh, K.; Kovesdy, C.P. Association of disorders in mineral metabolism with progression of chronic kidney disease. Clin. J. Am. Soc. Nephrol. 2006, 1, 825–831. [Google Scholar] [CrossRef] [PubMed]
- Zoccali, C.; Ruggenenti, P.; Perna, A.; Leonardis, D.; Tripepi, R.; Tripepi, G.; Mallamaci, F.; Remuzzi, G.; REIN Study Group. Phosphate may promote CKD progression and attenuate renoprotective effect of ACE inhibition. J. Am. Soc. Nephrol. 2011, 22, 1923–1930. [Google Scholar] [CrossRef] [PubMed]
- O’Seaghdha, C.M.; Hwang, S.; Muntner, P.; Melamed, M.L.; Fox, C.S. Serum phosphorus predicts incident chronic kidney disease and end-stage renal disease. Nephrol. Dial. Transplant. 2011, 26, 2885–2890. [Google Scholar] [CrossRef] [PubMed]
- Da, J.; Xie, X.; Wolf, M.; Disthabanchong, S.; Wang, J.; Zha, Y.; Lv, J.; Zhang, L.; Wang, H. Serum phosphorus and progression of CKD and mortality: A meta-analysis of cohort studies. Am. J. Kidney Dis. 2015, 66, 258–265. [Google Scholar] [CrossRef] [PubMed]
- Uribarri, J. Phosphorus homeostasis in normal health and in chronic kidney disease patients with special emphasis on dietary phosphorus intake. Semin. Dial. 2007, 20, 295–301. [Google Scholar] [CrossRef] [PubMed]
- Fliser, D.; Kollerits, B.; Neyer, U.; Ankerst, D.P.; Lhotta, K.; Lingenhel, A.; Ritz, E.; Kronenberg, F.; MMKD Study Group; Kuen, E.; et al. Fibroblast growth factor 23 (FGF23) predicts progression of chronic kidney disease: The mild to moderate kidney disease (MMKD) study. J. Am. Soc. Nephrol. 2007, 18, 2600–2608. [Google Scholar] [CrossRef] [PubMed]
- Scialla, J.J.; Astor, B.C.; Isakova, T.; Xie, H.; Appel, L.J.; Wolf, M. Mineral metabolites and CKD progression in african americans. J. Am. Soc. Nephrol. 2013, 24, 125–135. [Google Scholar] [CrossRef] [PubMed]
- Moe, S.M.; Chertow, G.M.; Parfrey, P.S.; Kubo, Y.; Block, G.A.; Correa-Rotter, R.; Drüeke, T.B.; Herzog, C.A.; London, G.M.; Mahaffey, K.W.; et al. Cinacalcet, fibroblast growth factor-23, and cardiovascular disease in hemodialysis: The evaluation of cinacalcet HCl therapy to lower cardiovascular events (EVOLVE) trial. Circulation 2015, 132, 27–39. [Google Scholar] [CrossRef] [PubMed]
- Haut, L.L.; Alfrey, A.C.; Guggenheim, S.; Buddington, B.; Schrier, N. Renal toxicity of phosphate in rats. Kidney Int. 1980, 17, 722–731. [Google Scholar] [CrossRef] [PubMed]
- Ibels, L.S.; Alfrey, A.C.; Haut, L.; Huffer, W.E. Preservation of function in experimental renal disease by dietary restriction of phosphate. N. Engl. J. Med. 1978, 298, 122–126. [Google Scholar] [CrossRef] [PubMed]
- Finch, J.L.; Lee, D.H.; Liapis, H.; Ritter, C.; Zhang, S.; Suarez, E.; Ferder, L.; Slatopolsky, E. Phosphate restriction significantly reduces mortality in uremic rats with established vascular calcification. Kidney Int. 2013, 84, 1145–1153. [Google Scholar] [CrossRef] [PubMed]
- Itkonen, S.T.; Karp, H.J.; Kemi, V.E.; Kokkonen, E.M.; Saarnio, E.M.; Pekkinen, M.H.; Kärkkäinen, M.U.M.; Laitinen, E.K.A.; Turanlahti, M.I.; Lamberg-Allardt, C.J.E. Associations among total and food additive phosphorus intake and carotid intima-media thickness—A cross-sectional study in a middle-aged population in southern Finland. Nutr. J. 2013, 12, 94. [Google Scholar] [CrossRef] [PubMed]
- Yamamoto, K.T.; Robinson-Cohen, C.; de Oliveira, M.C.; Kostina, A.; Nettleton, J.A.; Ix, J.H.; Nguyen, H.; Eng, J.; Lima, J.C.; Siscovick, D.S.; et al. Dietary phosphorus is associated with greater left ventricular mass. Kidney Int. 2013, 83, 707–714. [Google Scholar] [CrossRef] [PubMed]
- Chang, A.R.; Lazo, M.; Appel, L.J.; Gutiérrez, O.M.; Grams, M.E. High dietary phosphorus intake is associated with all-cause mortality: Results from NHANES III. Am. J. Clin. Nutr. 2014, 99, 320–327. [Google Scholar] [CrossRef] [PubMed]
- Moore, L.W.; Nolte, J.V.; Gaber, A.O.; Suki, W.N. Association of dietary phosphate and serum phosphorus concentration by levels of kidney function. Am. J. Clin. Nutr. 2015, 102, 444–453. [Google Scholar] [CrossRef] [PubMed]
- Haraikawa, M.; Tanabe, R.; Sogabe, N.; Sugimoto, A.; Kawamura, Y.; Michigami, T.; Hosoi, T.; Goseki-Sone, M. A study of the association between serum bone-specific alkaline phosphatase and serum phosphorus concentration or dietary phosphorus intake. J. Nutr. Sci. Vitaminol. 2012, 58, 442–445. [Google Scholar] [CrossRef] [PubMed]
- Centers for Disease Control and Prevention. National Health and Nutrition Examination Survey (NHANES): MEC In-Person Dietary Interviewers Procedures Manual; CreateSpace Independent Publishing Platform: North Charleston, SC, USA, 2014.
- U.S. Department of Agriculture, Agricultural Research Service. What We Eat in America Food Categories 2013–2014. 2016. Available online: www.ars.usda.gov/nea/bhnrc/fsrg (accessed on 5 December 2016). [Google Scholar]
- NCHS/NHANES. NHANES Dietary Web Tutorial. Updated 2014. Available online: http://www.cdc.gov/nchs/tutorials/dietary/ (accessed on 19 August 2016).
- Council on Renal Nutrition. Phosphorus and Your CKD Diet. Updated 2016. Available online: https://www.kidney.org/atoz/content/phosphorus (accessed on 6 October 2016).
- National Institute of Diabetes and Digestive Kidney Diseases. Phosphorus: Tips for People with Chronic Kidney Disease. Updated 2013. Available online: https://www.niddk.nih.gov/health-information/health-communication-programs/nkdep/a-z/nutrition-phosphorus/Pages/nutrition-phosphorus.aspx (accessed on 6 October 2016).
- Lampila, L.E. Applications and functions of food-grade phosphates. Ann. N. Y. Acad. Sci. 2013, 1301, 37–44. [Google Scholar] [CrossRef] [PubMed]
- Food and Drugs, 21 C.F.R. § 137 (2016). Available online: http://www.ecfr.gov/ (accessed on 5 December 2016).
- Shutto, Y.; Shimada, M.; Kitajima, M.; Yamabe, H.; Razzaque, M.S. Lack of awareness among future medical professionals about the risk of consuming hidden phosphate-containing processed food and drinks. PLoS ONE 2011, 6, e29105. [Google Scholar] [CrossRef] [PubMed]
- Calò, L.A.; Savica, V.; Davis, P.A. Phosphate content of beverages in addition to food phosphate additives: Real and insidious danger for renal patients. J. Ren. Nutr. 2012, 22, 292–293. [Google Scholar] [CrossRef] [PubMed]
- Shutto, Y.; Shimada, M.; Kitajima, M.; Yamabe, H.; Saitoh, Y.; Saitoh, H.; Razzaque, M.S. Inadequate awareness among chronic kidney disease patients regarding food and drinks containing artificially added phosphate. PLoS ONE 2013, 8, e78660. [Google Scholar] [CrossRef] [PubMed]
- Moser, M.; White, K.; Henry, B.; Oh, S.; Miller, E.R.; Anderson, C.A.; Benjamin, J.; Charleston, J.; Appel, L.J.; Chang, A.R. Phosphorus content of popular beverages. Am. J. Kidney Dis. 2015, 65, 969–971. [Google Scholar] [CrossRef] [PubMed]
- D’Alessandro, C.; Piccoli, G.B.; Cupisti, A. The “phosphorus pyramid”: A visual tool for dietary phosphate management in dialysis and CKD patients. BMC Nephrol. 2015, 16, 9. [Google Scholar]
- Karp, H.; Ekholm, P.; Kemi, V.; Itkonen, S.; Hirvonen, T.; Närkki, S.; Lamberg-Allardt, C. Differences among total and in vitro digestible phosphorus content of plant foods and beverages. J. Ren. Nutr. 2012, 22, 416–422. [Google Scholar] [CrossRef] [PubMed]
- US Department of Agriculture, Agricultural Research Service, Nutrient Data Laboratory. USDA National Nutrient Database for Standard Reference, Release 28. Version Current: September 2015, Slightly Revised May 2016. Available online: http://Www.ars.usda.gov/nea/bhnrc/ndl (accessed on 5 December 2016).
- St-Jules, D.E.; Jagannathan, R.; Gutekunst, L.; Kalantar-Zadeh, K.; Sevick, M.A. Examining the proportion of dietary phosphorus from plants, animals, and food additives excreted in urine. J. Ren. Nutr. 2016, in press. [Google Scholar] [CrossRef] [PubMed]
- Conway, J.M.; Ingwersen, L.A.; Vinyard, B.T.; Moshfegh, A.J. Effectiveness of the US department of agriculture 5-step multiple-pass method in assessing food intake in obese and nonobese women. Am. J. Clin. Nutr. 2003, 77, 1171–1178. [Google Scholar] [PubMed]
- Raper, N.; Perloff, B.; Ingwersen, L.; Steinfeldt, L.; Anand, J. An overview of USDA’s dietary intake data system. J. Food Compos. Anal. 2004, 17, 545–555. [Google Scholar] [CrossRef]
- Zimmerman, T.P.; Hull, S.G.; McNutt, S.; Mittl, B.; Islam, N.; Guenther, P.M.; Thompson, F.E.; Potischman, N.A.; Subar, A.F. Challenges in converting an interviewer-administered food probe database to self-administration in the national cancer institute automated self-administered 24-hour recall (ASA24). J. Food Compos. Anal. 2009, 22 (Suppl. 1), S48–S51. [Google Scholar] [CrossRef] [PubMed]
- Rehm, C.D.; Peñalvo, J.L.; Afshin, A.; Mozaffarian, D. Dietary intake among US adults, 1999–2012. JAMA 2016, 315, 2542–2553. [Google Scholar] [CrossRef] [PubMed]

| NHANES WWEIA Survey Cycle | N (Unweighted) | Mean Phosphorus (95% CI) (mg/day) | Mean Calories (95% CI) (kcal/day) | Phosphorus Density (95% CI) (mg/kcal) |
|---|---|---|---|---|
| Overall | 34,741 | 1373 (1360–1386) | 2182 (2166–2198) | 0.633 (0.629–0.636) |
| 2001–2002 | 4744 | 1345 (1309–1382) | 2208 (2159–2257) | 0.609 (0.601–0.618) |
| 2003–2004 | 4448 | 1334 (1300–1368) | 2216 (2183–2249) | 0.602 (0.589–0.615) |
| 2005–2006 | 4520 | 1366 (1323–1409) | 2195 (2129–2260) | 0.622 (0.615–0.629) |
| 2007–2008 | 5419 | 1324 (1278–1371) | 2115 (2056–2174) | 0.626 (0.616–0.636) |
| 2009–2010 | 5762 | 1414 (1387–1441) | 2132 (2093–2171) | 0.663 (0.654–0.673) |
| 2011–2012 | 4801 | 1418 (1392–1444) | 2191 (2160–2222) | 0.647 (0.639–0.655) |
| 2013–2014 | 5047 | 1399 (1376–1423) | 2141 (2104–2178) | 0.654 (0.643–0.664) |
| Change | 4.01% | −3.03% | 7.39% | |
| p-Value for Trend * | 0.0151 | 0.139 | <0.01 |
| Population Subgroup | N (Unweighted) | Mean Total Dietary Phosphorus (mg/day) | Mean Phosphorus Density (mg/kcal) | ||
|---|---|---|---|---|---|
| Crude | Adjusted | Crude | Adjusted | ||
| All | 34,741 | 1373 (1360–1386) | 1379 (1366–1391) | 0.633 (0.629–0.636) | 0.635 (0.631–0.638) |
| Male (REF) | 16,806 | 1603 (1586–1621) | 1615 (1597–1633) | 0.627 (0.623–0.631) | 0.628 (0.624–0.632) |
| Female | 17,935 | 1159 (1146–1171) ** | 1159 (1147–1171) ** | 0.640 (0.635–0.645) ** | 0.641 (0.636–0.645) ** |
| NH White (REF) | 16,569 | 1403 (1387–1419) | 1419 (1404–1435) | 0.642 (0.637–0.647) | 0.643 (0.638–0.647) |
| NH Black | 7213 | 1211 (1186–1237) ** | 1214 (1190–1237) ** | 0.562 (0.556–0.568) ** | 0.567 (0.562–0.573) ** |
| Mexican American | 5914 | 1467 (1434–1500) n.s. | 1410 (1383–1438) n.s. | 0.656 (0.647–0.665) * | 0.666 (0.658–0.674) ** |
| Other | 5045 | 1273 (1248–1298) ** | 1263 (1241–1286) ** | 0.626 (0.619–0.633) ** | 0.632 (0.626–0.639) * |
| 20–29 (REF) | 6229 | 1452 (1423–1480) | 1456 (1428–1485) | 0.609 (0.603–0.616) | 0.609 (0.602–0.615) |
| 30–49 | 11,849 | 1456 (1437–1476) n.s. | 1460 (1441–1478) n.s. | 0.628 (0.623–0.633) ** | 0.629 (0.624–0.634) ** |
| 50–69 | 10,587 | 1312 (1292–1332) ** | 1312 (1292–1331) ** | 0.646 (0.639–0.652) ** | 0.648 (0.642–0.654) ** |
| 70+ | 6076 | 1132 (1115–1149) ** | 1124 (1108–1140) ** | 0.665 (0.659–0.671) ** | 0.665 (0.659–0.671) ** |
| Food Group | All | Male | Female | NH White | NH Black | Mexican American | Other | 20–29 | 30–49 | 50–69 | 70+ |
|---|---|---|---|---|---|---|---|---|---|---|---|
| Milk & Milk Products | 289 | 320 | 261 | 324 | 175 | 245 | 224 | 301 | 296 | 278 | 280 |
| (21.0%) | |||||||||||
| Meat, Poultry, Fish & Mixtures | 346 | 428 | 270 | 337 | 401 | 337 | 355 | 368 | 372 | 332 | 263 |
| (25.2%) | |||||||||||
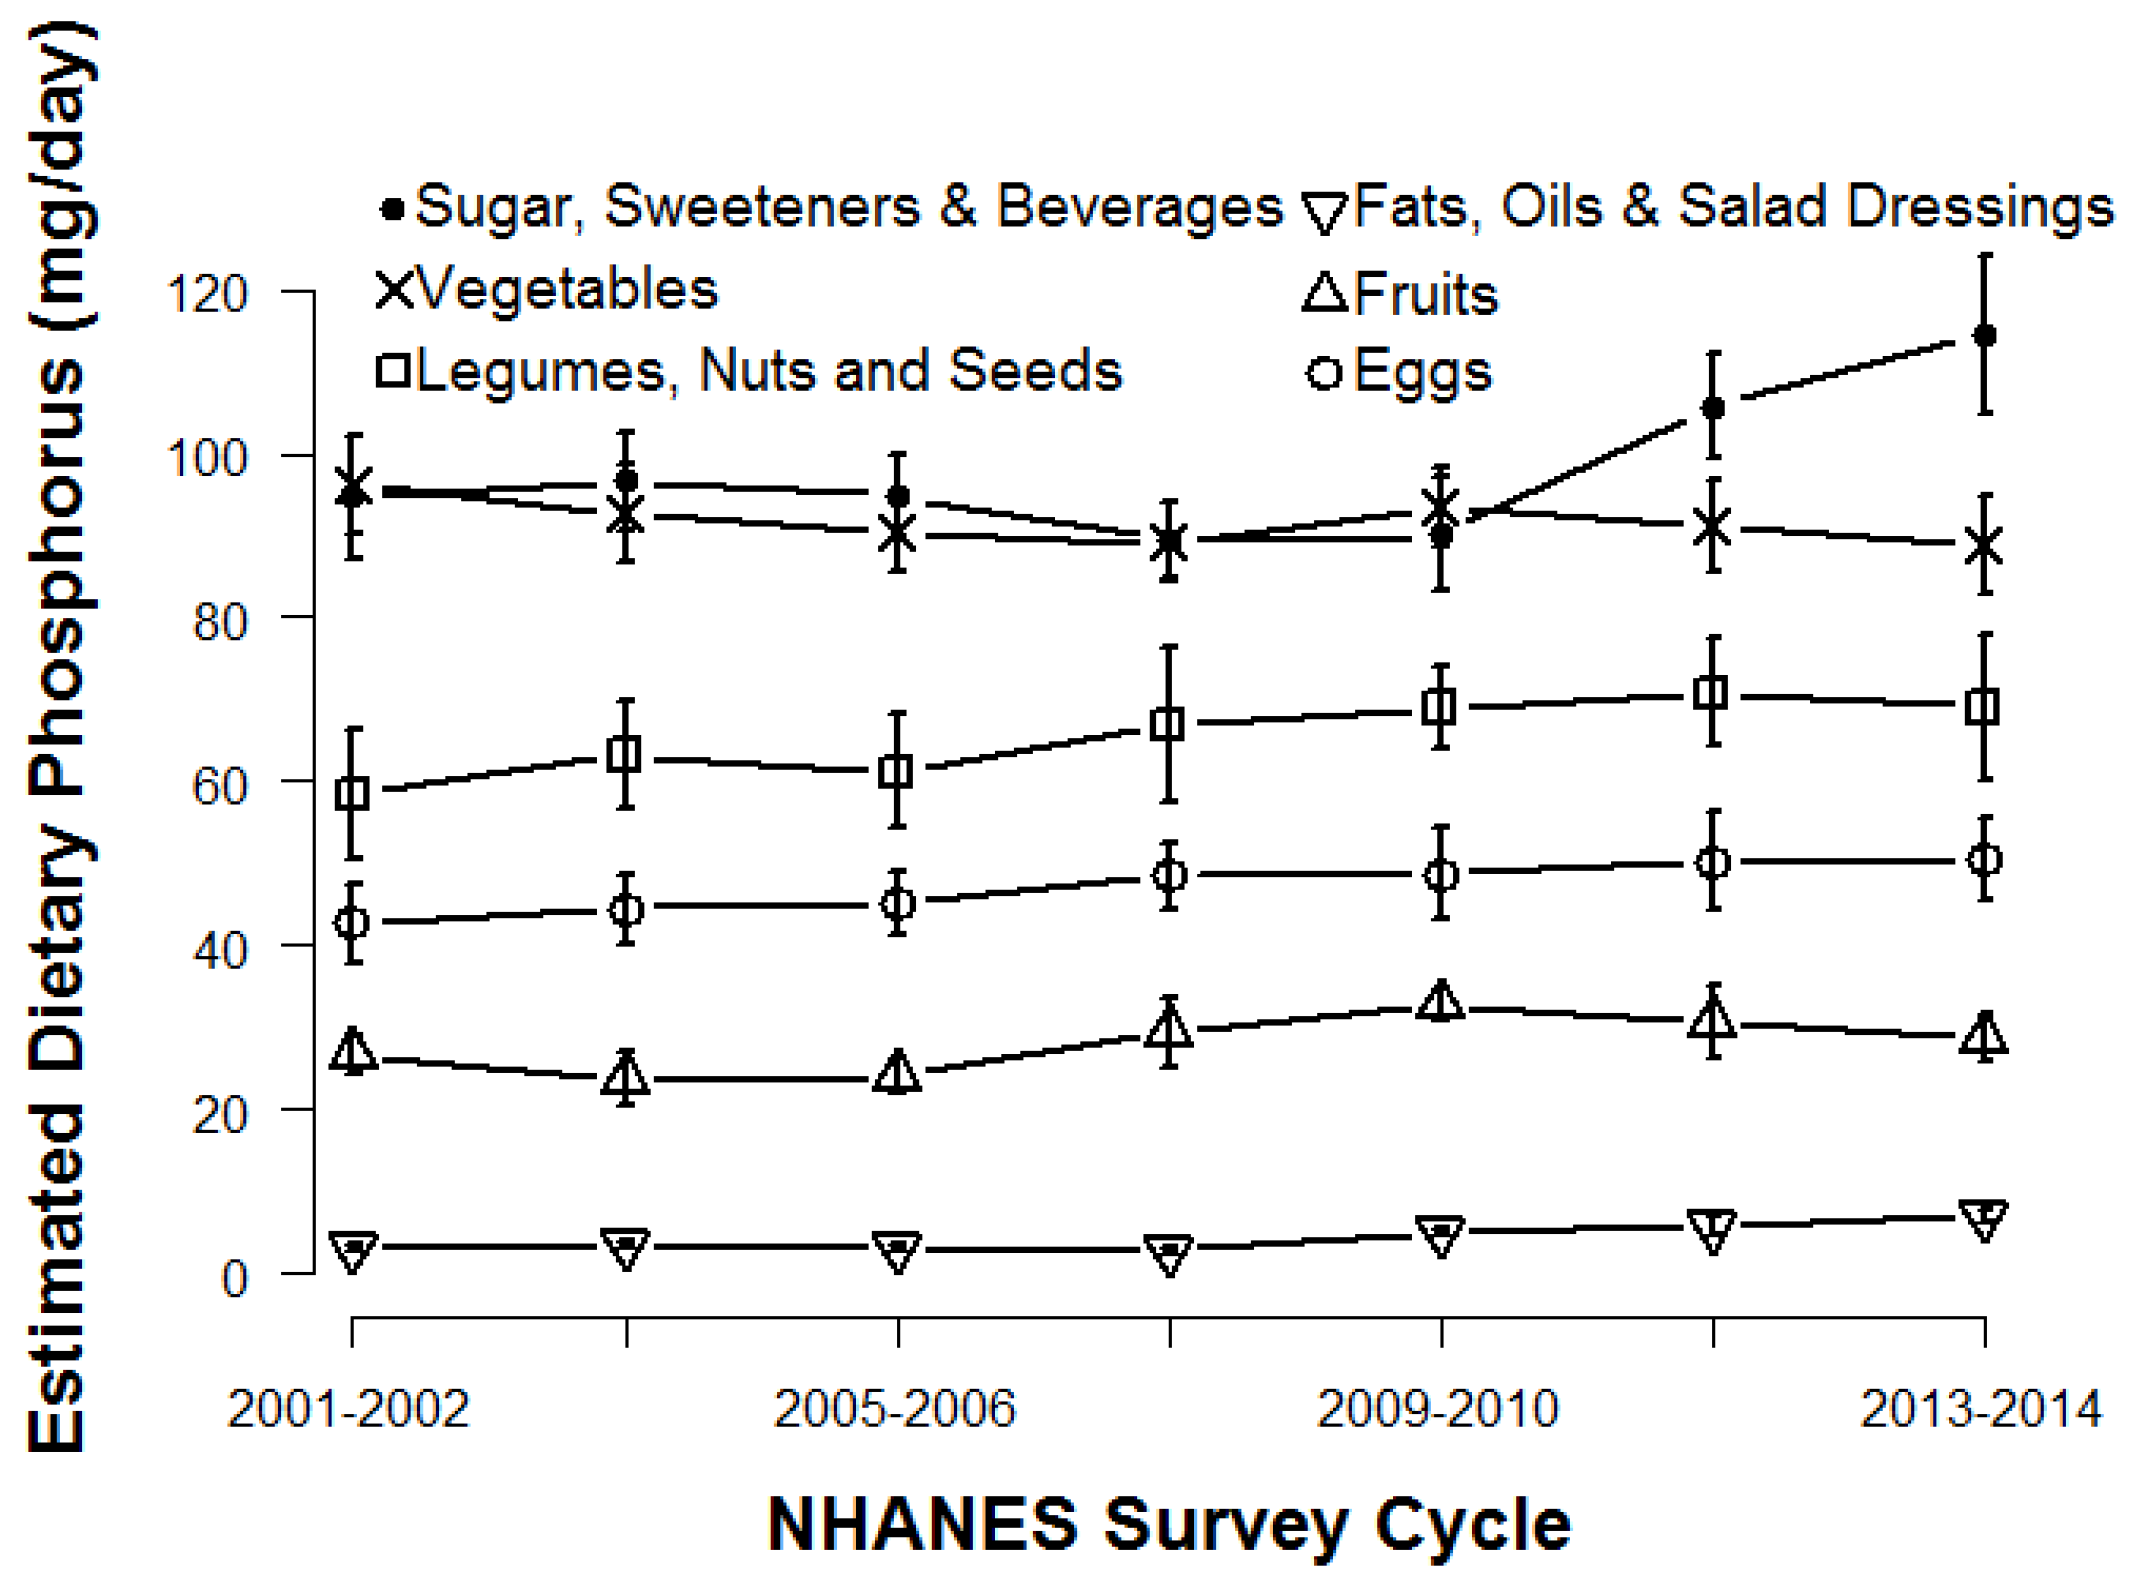
| Eggs | 47 | 58 | 38 | 45 | 52 | 69 | 44 | 45 | 49 | 49 | 39 |
| (3.4%) | |||||||||||
| Legumes, Nuts and Seeds | 66 | 76 | 56 | 66 | 50 | 82 | 69 | 57 | 69 | 71 | 56 |
| (4.8%) | |||||||||||
| Grain Products | 402 | 466 | 343 | 399 | 341 | 530 | 388 | 455 | 431 | 365 | 316 |
| (29.3%) | |||||||||||
| Fruits | 28 | 30 | 26 | 27 | 28 | 32 | 32 | 26 | 26 | 29 | 34 |
| (2.0%) | |||||||||||
| Vegetables | 92 | 100 | 84 | 97 | 85 | 71 | 81 | 87 | 92 | 95 | 88 |
| (6.7%) | |||||||||||
| Fats, Oils & Salad Dressings | 4 | 5 | 4 | 5 | 4 | 3 | 3 | 4 | 5 | 5 | 4 |
| (0.3%) | |||||||||||
| Sugar, Sweeteners & Beverages | 98 | 121 | 77 | 105 | 76 | 96 | 77 | 108 | 116 | 89 | 52 |
| (7.1%) | |||||||||||
| All Sources | 1373 | 1603 | 1159 | 1403 | 1211 | 1467 | 1273 | 1452 | 1456 | 1312 | 1132 |
| Food Group | All | Male | Female | NH White | NH Black | Mexican American | Other | 20–29 | 30–49 | 50–69 | 70+ |
|---|---|---|---|---|---|---|---|---|---|---|---|
| Milk & Milk Products | 1.308 | 1.322 | 1.292 | 1.322 | 1.188 | 1.310 | 1.283 | 1.344 | 1.296 | 1.292 | 1.330 |
| Meat, Poultry, Fish & Mixtures | 0.854 | 0.848 | 0.863 | 0.861 | 0.788 | 0.854 | 0.894 | 0.828 | 0.849 | 0.872 | 0.881 |
| Eggs | 1.048 | 1.048 | 1.048 | 1.055 | 1.054 | 1.005 | 1.045 | 1.045 | 1.046 | 1.046 | 1.068 |
| Legumes, Nuts and Seeds | 0.812 | 0.804 | 0.823 | 0.803 | 0.837 | 0.815 | 0.850 | 0.863 | 0.834 | 0.782 | 0.757 |
| Grain Products | 0.532 | 0.536 | 0.528 | 0.529 | 0.502 | 0.616 | 0.512 | 0.535 | 0.535 | 0.528 | 0.530 |
| Fruits | 0.304 | 0.305 | 0.303 | 0.305 | 0.300 | 0.303 | 0.301 | 0.303 | 0.305 | 0.304 | 0.303 |
| Vegetables | 0.563 | 0.537 | 0.595 | 0.575 | 0.498 | 0.563 | 0.555 | 0.533 | 0.550 | 0.583 | 0.609 |
| Fats, Oils & Salad Dressings | 0.076 | 0.072 | 0.080 | 0.072 | 0.091 | 0.098 | 0.088 | 0.090 | 0.080 | 0.069 | 0.062 |
| Sugar, Sweeteners & Beverages | 0.281 | 0.272 | 0.295 | 0.301 | 0.190 | 0.270 | 0.267 | 0.236 | 0.285 | 0.313 | 0.304 |
| All Sources | 0.633 | 0.627 | 0.640 | 0.642 | 0.562 | 0.656 | 0.626 | 0.609 | 0.628 | 0.646 | 0.665 |
| Food Category | All | Male | Female | NH White | NH Black | Mexican American | Other | 20–29 | 30–49 | 50–69 | 70+ |
|---|---|---|---|---|---|---|---|---|---|---|---|
| Beverages—Alcoholic | 28 | 43 | 13 | 30 | 29 | 29 | 17 | 34 | 32 | 27 | 10 |
| Beverages—All Other | 46 | 50 | 42 | 49 | 36 | 42 | 44 | 56 | 46 | 45 | 34 |
| Beverages—Coffee/Tea | 23 | 23 | 23 | 26 | 14 | 17 | 21 | 19 | 29 | 22 | 16 |
| Dairy—Milk | 110 | 135 | 86 | 125 | 61 | 93 | 90 | 130 | 99 | 100 | 135 |
| Dairy—Other | 111 | 118 | 104 | 127 | 77 | 84 | 76 | 110 | 108 | 118 | 97 |
| Fruits and Vegetables—Excluding Potatoes | 49 | 48 | 51 | 51 | 42 | 38 | 55 | 39 | 49 | 53 | 59 |
| Fruits and Vegetables—White Potatoes | 31 | 37 | 25 | 33 | 34 | 25 | 22 | 32 | 32 | 30 | 29 |
| Grains—Breads | 101 | 116 | 86 | 94 | 92 | 163 | 99 | 86 | 107 | 102 | 102 |
| Grains—Cooked Grains/Cereals | 27 | 28 | 27 | 22 | 30 | 20 | 55 | 19 | 30 | 27 | 36 |
| Grains—RTE Cereals | 28 | 33 | 24 | 34 | 16 | 18 | 16 | 22 | 20 | 32 | 50 |
| Mixed Dishes—Asian | 21 | 23 | 19 | 18 | 13 | 18 | 42 | 27 | 23 | 20 | 10 |
| Mixed Dishes—Grain-Based | 47 | 56 | 40 | 48 | 58 | 34 | 47 | 51 | 44 | 52 | 38 |
| Mixed Dishes—Meat, Poultry, Seafood | 55 | 62 | 48 | 58 | 54 | 42 | 46 | 40 | 51 | 65 | 59 |
| Mixed Dishes—Mexican | 70 | 84 | 56 | 57 | 27 | 228 | 62 | 101 | 88 | 49 | 24 |
| Mixed Dishes—Pizza | 63 | 75 | 51 | 64 | 61 | 55 | 65 | 120 | 73 | 37 | 16 |
| Mixed Dishes—Sandwiches | 55 | 64 | 47 | 50 | 84 | 83 | 39 | 73 | 65 | 44 | 32 |
| Mixed Dishes—Soups | 22 | 24 | 20 | 19 | 11 | 37 | 32 | 16 | 23 | 24 | 23 |
| Other—All Other | 16 | 24 | 10 | 14 | 5 | 50 | 14 | 34 | 18 | 9 | 5 |
| Other—Fats, Oils, Condiments, Sugars | 19 | 20 | 18 | 19 | 17 | 18 | 18 | 20 | 22 | 18 | 13 |
| Protein Foods—Cured Meat | 55 | 70 | 41 | 63 | 50 | 35 | 36 | 54 | 59 | 54 | 49 |
| Protein Foods—Eggs | 45 | 54 | 36 | 42 | 45 | 63 | 47 | 48 | 44 | 45 | 43 |
| Protein Foods—Meat/Poultry/Seafood | 184 | 225 | 145 | 169 | 257 | 158 | 212 | 207 | 200 | 170 | 136 |
| Protein Foods—Plant Based | 64 | 73 | 56 | 62 | 51 | 85 | 72 | 49 | 69 | 70 | 56 |
| Snacks and Sweets—Excluding Frozen Dairy | 98 | 103 | 93 | 102 | 108 | 81 | 80 | 102 | 99 | 100 | 83 |
| Snacks and Sweets—Frozen Dairy | 20 | 23 | 17 | 23 | 16 | 10 | 14 | 13 | 21 | 19 | 30 |
© 2017 by the authors. Licensee MDPI, Basel, Switzerland. This article is an open access article distributed under the terms and conditions of the Creative Commons Attribution (CC BY) license ( http://creativecommons.org/licenses/by/4.0/).
Share and Cite
McClure, S.T.; Chang, A.R.; Selvin, E.; Rebholz, C.M.; Appel, L.J. Dietary Sources of Phosphorus among Adults in the United States: Results from NHANES 2001–2014. Nutrients 2017, 9, 95. https://doi.org/10.3390/nu9020095
McClure ST, Chang AR, Selvin E, Rebholz CM, Appel LJ. Dietary Sources of Phosphorus among Adults in the United States: Results from NHANES 2001–2014. Nutrients. 2017; 9(2):95. https://doi.org/10.3390/nu9020095
Chicago/Turabian StyleMcClure, Scott T., Alex R. Chang, Elizabeth Selvin, Casey M. Rebholz, and Lawrence J. Appel. 2017. "Dietary Sources of Phosphorus among Adults in the United States: Results from NHANES 2001–2014" Nutrients 9, no. 2: 95. https://doi.org/10.3390/nu9020095