Endurance Training with or without Glucose-Fructose Ingestion: Effects on Lactate Metabolism Assessed in a Randomized Clinical Trial on Sedentary Men

 , ,
, ,
Abstract
:1. Introduction
2. Materials and Methods
2.1. Participants
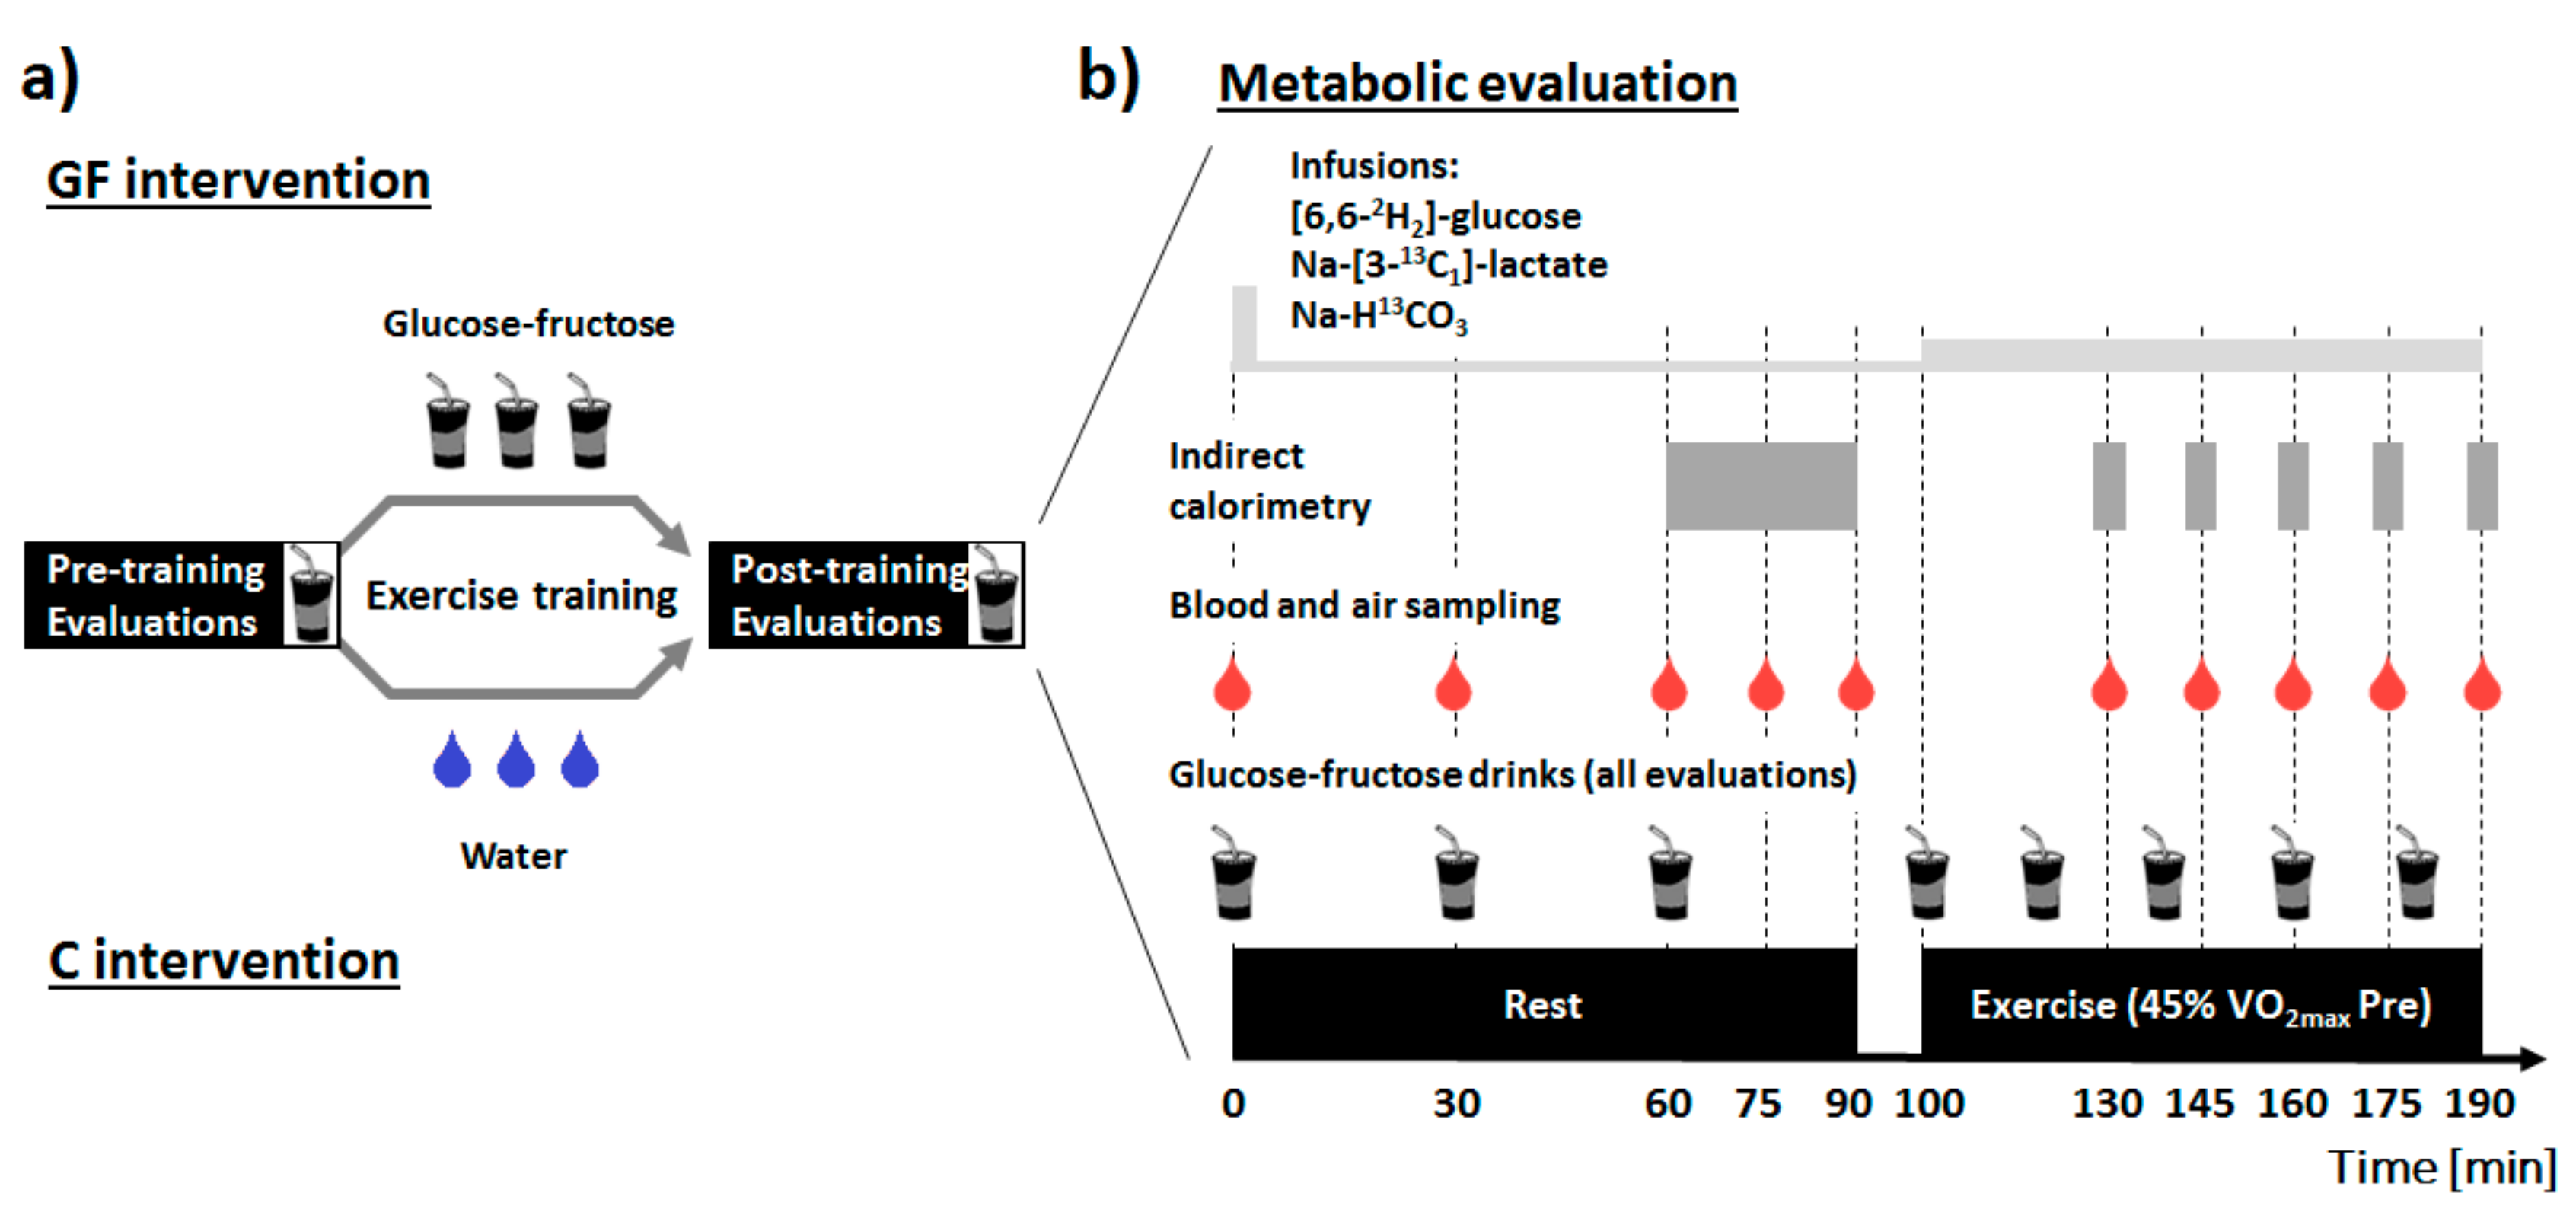
2.2. Study Design
2.3. Incremental Exercise-Testing
2.4. Metabolic Evaluations
2.5. Training Intervention
2.6. Analytical Procedures
2.7. Calculations
2.8. Statistics
3. Results
3.1. Participants Characteristics and Training Effectiveness
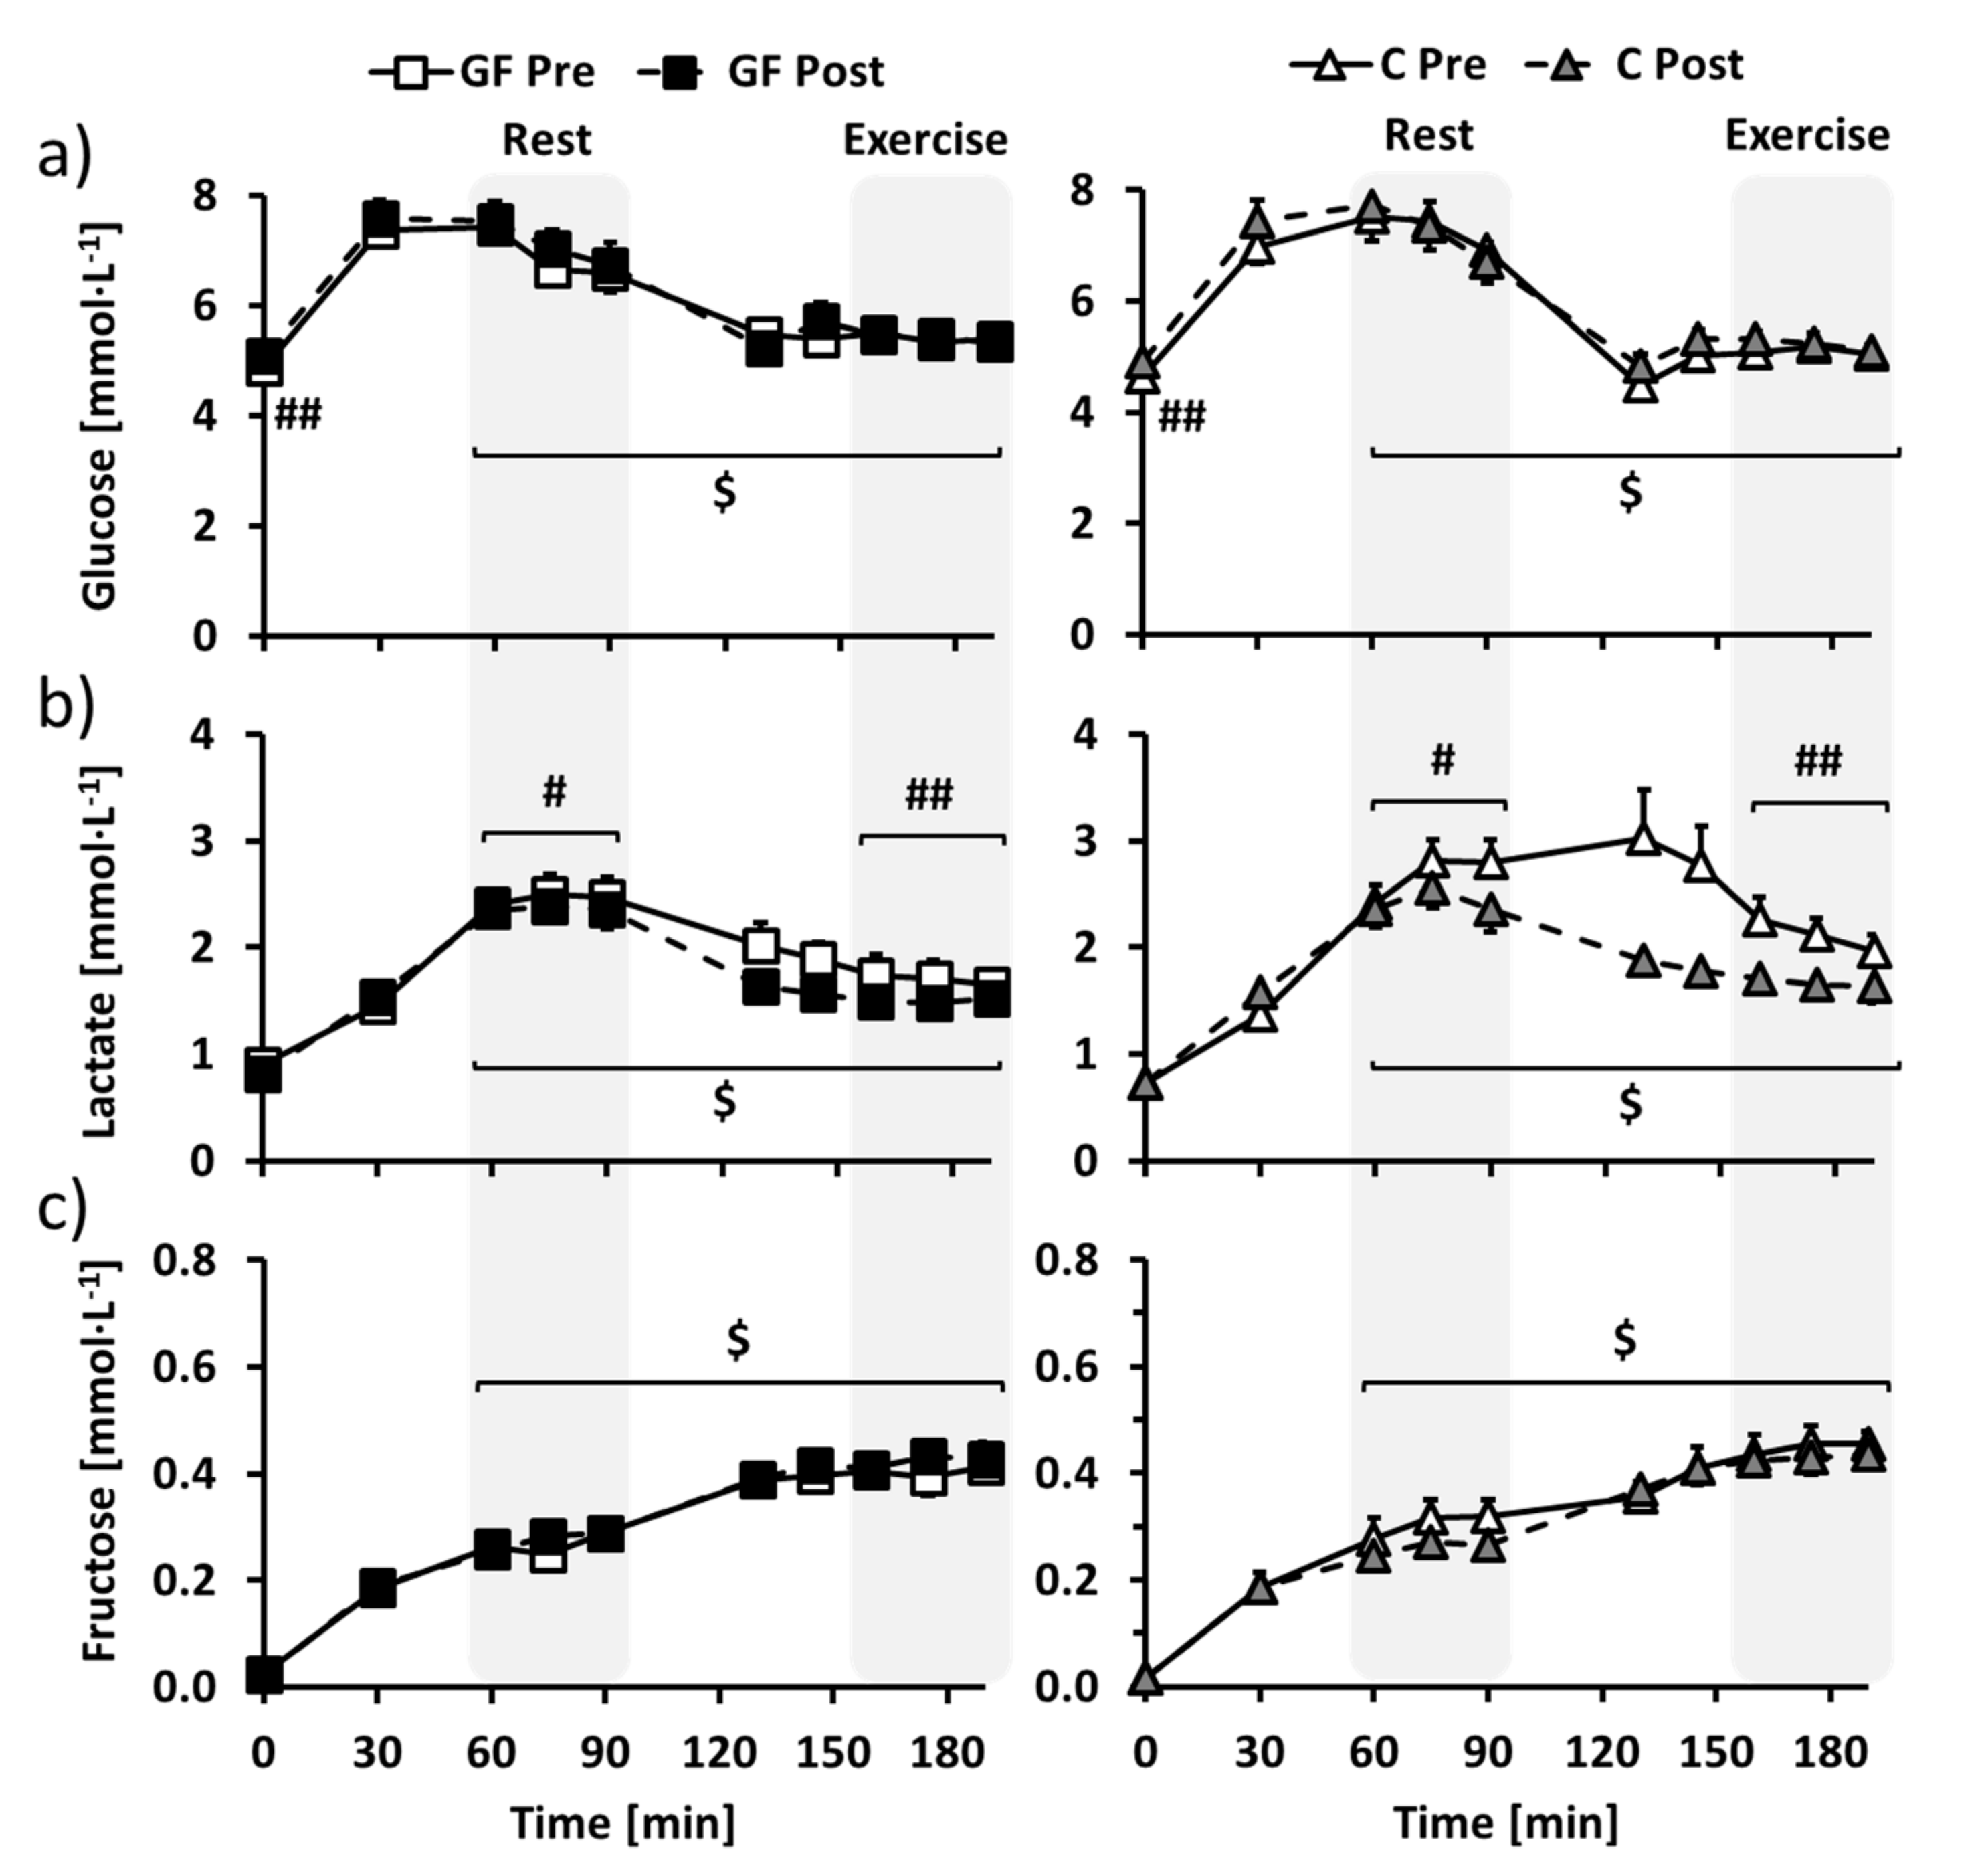
3.2. Metabolic Evaluation: Plasma Substrates and Hormones
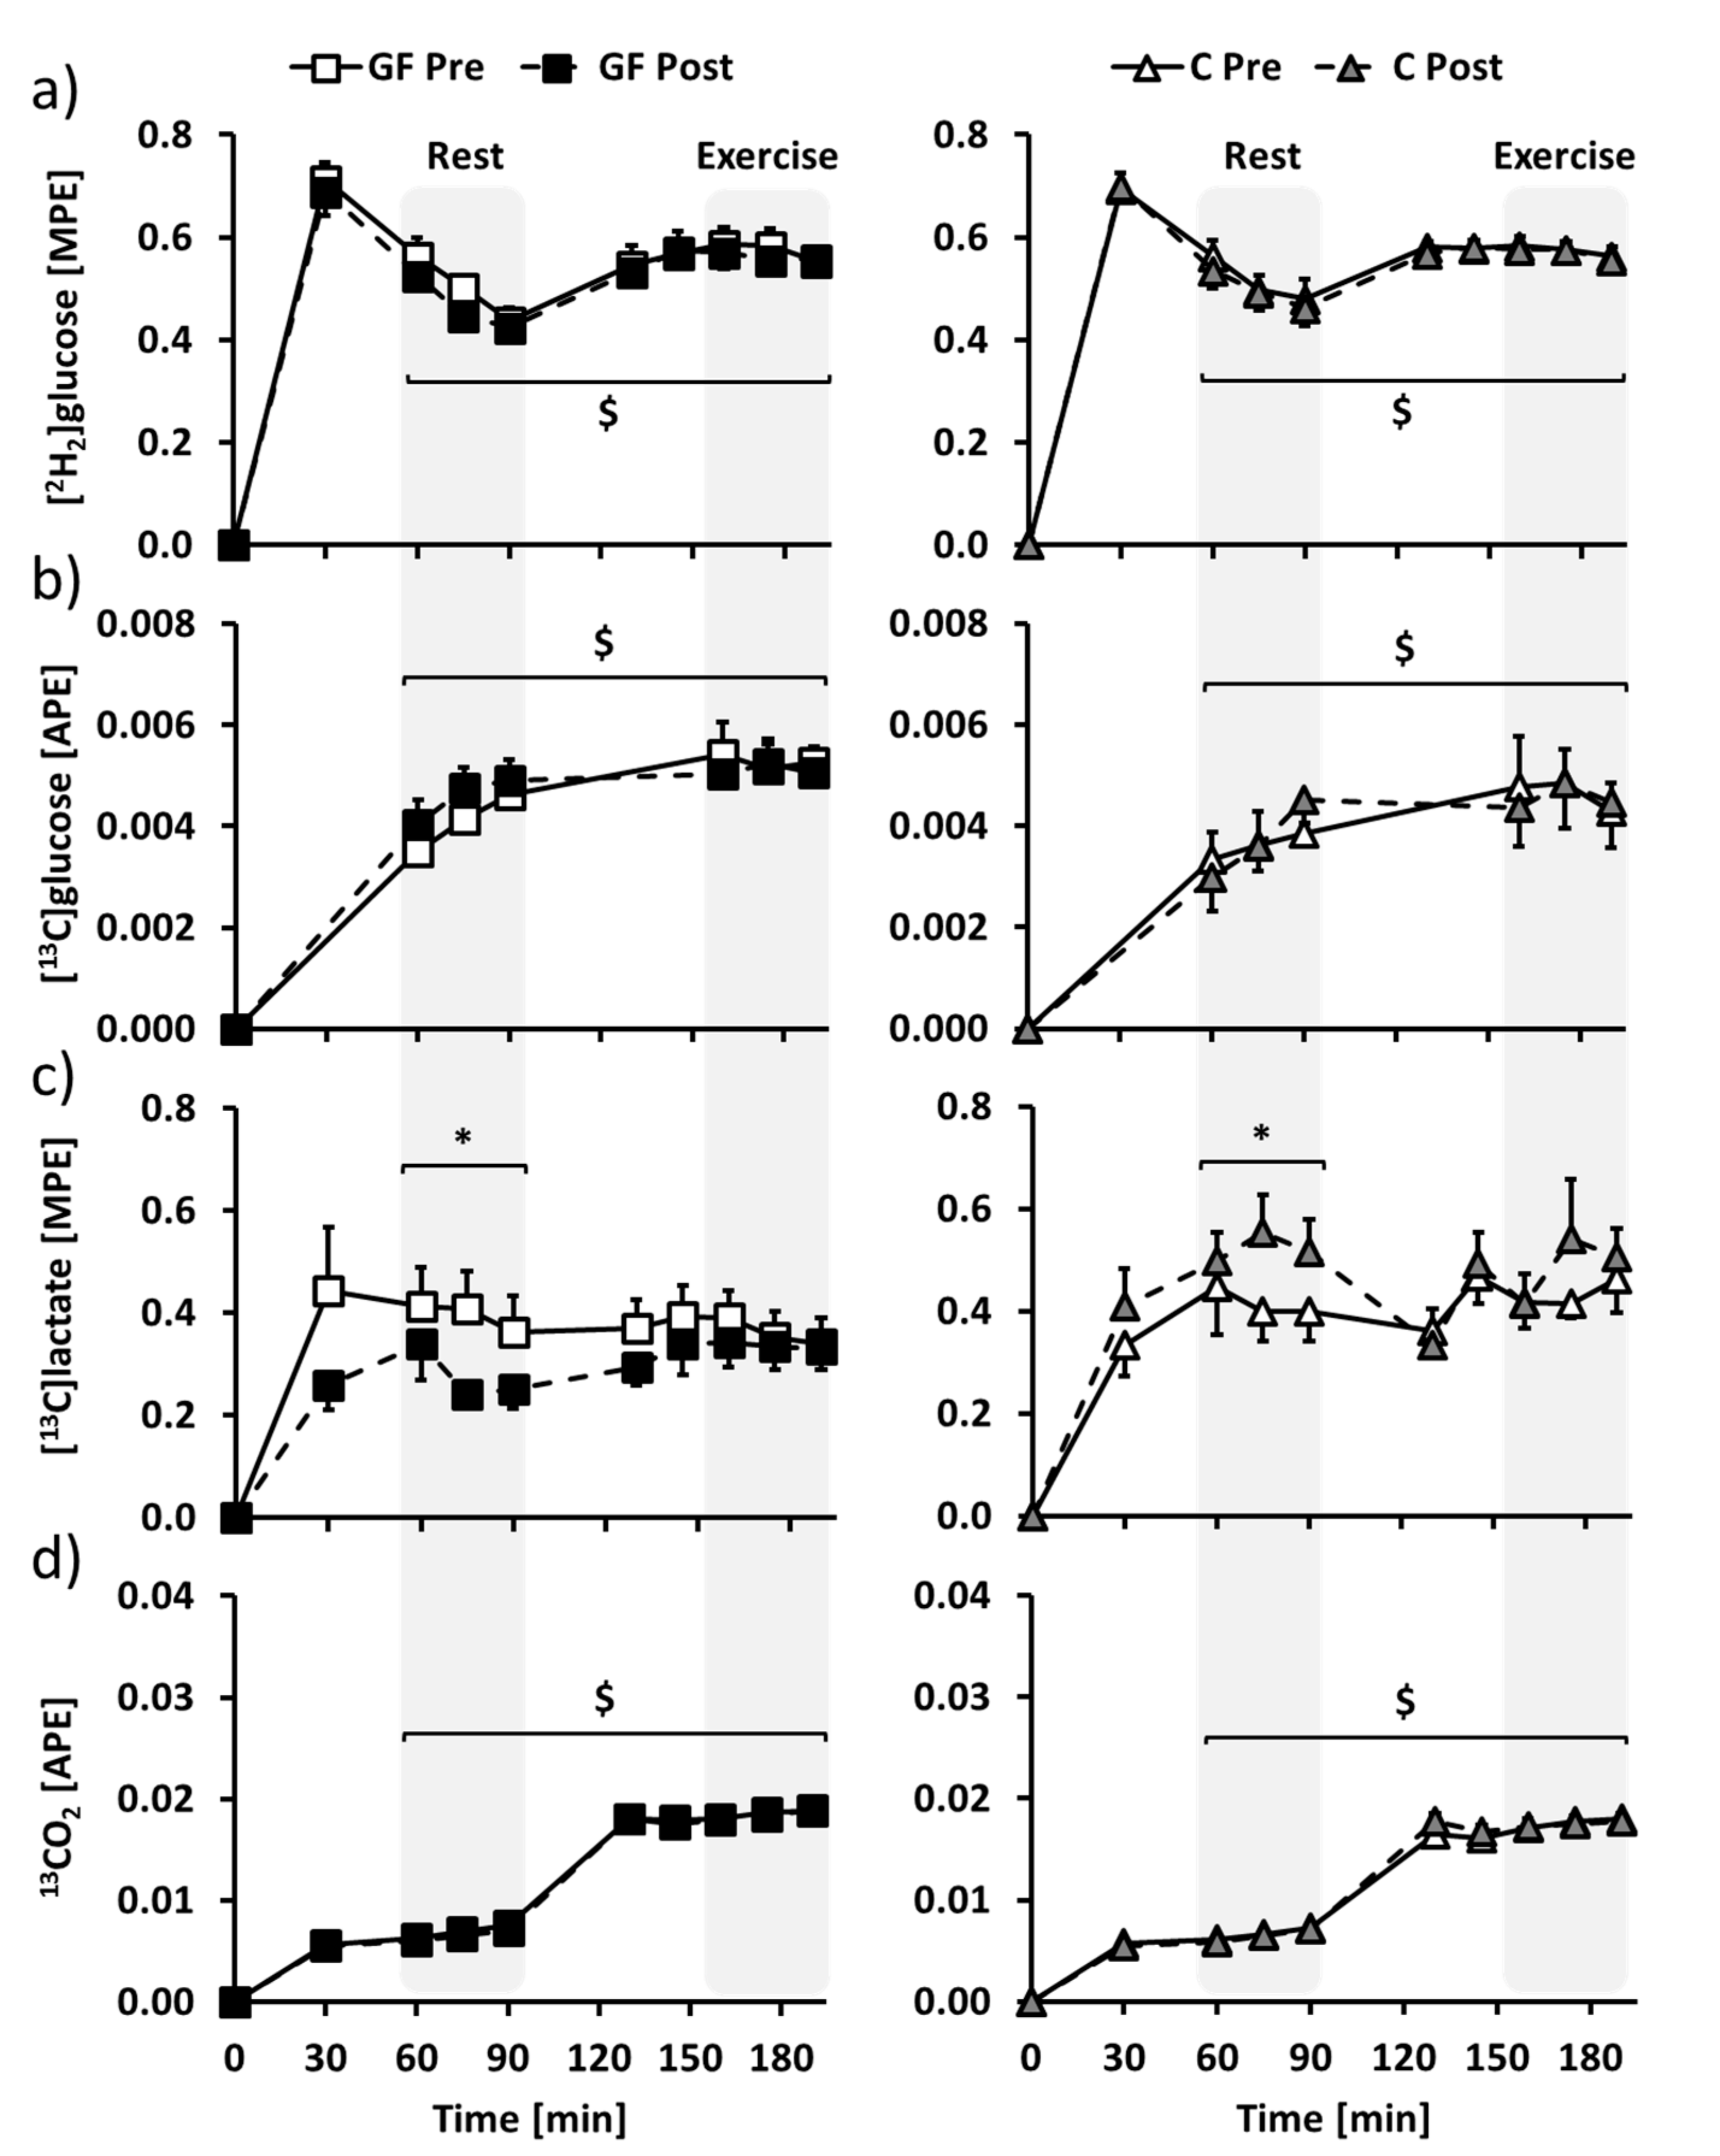
3.3. Metabolic Evaluation: Isotopic Enrichments
3.4. Metabolic Evaluation: Glucose Metabolism
3.5. Metabolic Evaluation: Lactate Metabolism
3.6. Metabolic Evaluation: Lactate Disposal
3.7. Metabolic Evaluation: Substrate Oxidation and Exercise Capacity
4. Discussion
4.1. Efficiency of the Training Programs
4.2. Lactate Appearance and Energy Metabolism before Training
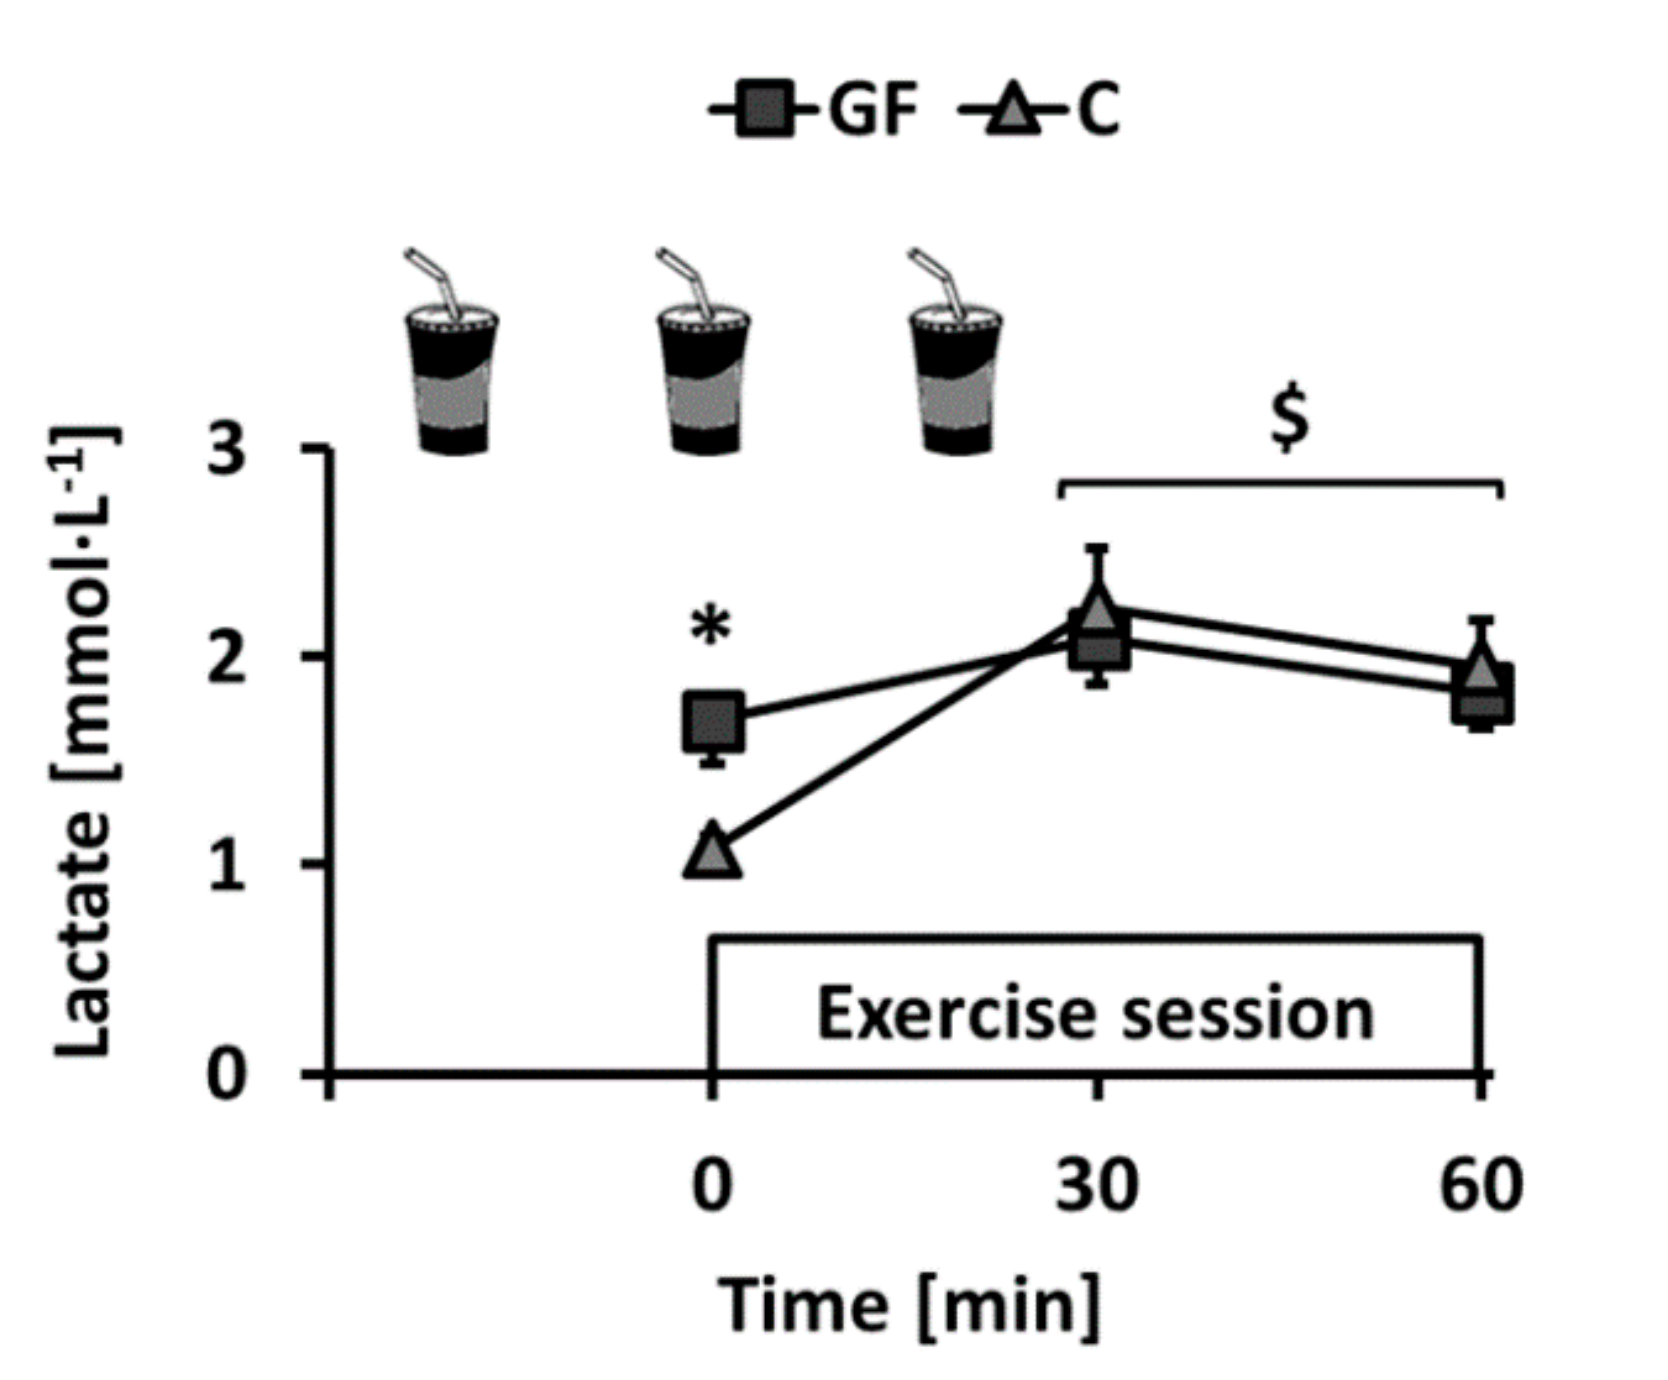
4.3. Evolution of Plasma Lactate Concentration during Training Sessions
4.4. Lactate Appearance and Disposal after Training
4.5. Limitations
5. Conclusions
Supplementary Materials
Acknowledgments
Author Contributions
Conflicts of Interest
Abbreviations
| C | Control intervention in which plain water was provided during training sessions |
| GF | Intervention in which glucose-fructose drinks were provided during training sessions |
| VO2max | Maximal oxygen consumption during incremental tests |
| Wmax | Maximal workload during incremental tests |
| WLT | Workload eliciting lactate turnpoint during incremental tests |
| VO2 | Oxygen consumption |
| VCO2 | Carbon dioxide production |
| Na-H13CO3 | Sodium bicarbonate with its carbon being a carbon-13 |
| NOLD | Non-oxidative lactate disposal |
| (6,6-2H2)-d-(+)-glucose | d-(+)-glucose deuterated twice on 6th carbon |
| (3-13C1)-l-(+)-lactate | l-(+)-lactate with its 3rd carbon being a carbon-13 |
| NaCl | Sodium chloride |
| EDTA | Ethylenediaminetetraacetic acid |
References
- Romijn, J.A.; Coyle, E.F.; Sidossis, L.S.; Gastaldelli, A.; Horowitz, J.F.; Endert, E.; Wolfe, R.R. Regulation of endogenous fat and carbohydrate metabolism in relation to exercise intensity and duration. Am. J. Physiol. 1993, 265, E380–E391. [Google Scholar] [PubMed]
- Coyle, E.F.; Coggan, A.R.; Hemmert, M.K.; Ivy, J.L. Muscle glycogen utilization during prolonged strenuous exercise when fed carbohydrate. J. Appl. Physiol. (1985) 1986, 61, 165–172. [Google Scholar]
- Cermak, N.M.; van Loon, L.J. The use of carbohydrates during exercise as an ergogenic aid. Sports Med. 2013, 43, 1139–1155. [Google Scholar] [CrossRef] [PubMed]
- Jeukendrup, A.E.; Jentjens, R. Oxidation of carbohydrate feedings during prolonged exercise: Current thoughts, guidelines and directions for future research. Sports Med. 2000, 29, 407–424. [Google Scholar] [CrossRef] [PubMed]
- Ploug, T.; van Deurs, B.; Ai, H.; Cushman, S.W.; Ralston, E. Analysis of glut4 distribution in whole skeletal muscle fibers: Identification of distinct storage compartments that are recruited by insulin and muscle contractions. J. Cell Biol. 1998, 142, 1429–1446. [Google Scholar] [CrossRef] [PubMed]
- Jeukendrup, A.E.; Raben, A.; Gijsen, A.; Stegen, J.H.; Brouns, F.; Saris, W.H.; Wagenmakers, A.J. Glucose kinetics during prolonged exercise in highly trained human subjects: Effect of glucose ingestion. J. Physiol. 1999, 515 Pt 2, 579–589. [Google Scholar] [CrossRef] [PubMed]
- Brooks, G.A. Cell-cell and intracellular lactate shuttles. J. Physiol. 2009, 587, 5591–5600. [Google Scholar] [CrossRef] [PubMed]
- Dubouchaud, H.; Butterfield, G.E.; Wolfel, E.E.; Bergman, B.C.; Brooks, G.A. Endurance training, expression, and physiology of ldh, mct1, and mct4 in human skeletal muscle. Am. J. Physiol. Endocrinol. Metab. 2000, 278, E571–E579. [Google Scholar] [PubMed]
- Thomas, C.; Bishop, D.J.; Lambert, K.; Mercier, J.; Brooks, G.A. Effects of acute and chronic exercise on sarcolemmal mct1 and mct4 contents in human skeletal muscles: Current status. Am. J. Physiol. Regul. Integr. Comp. Physiol. 2012, 302, R1–R14. [Google Scholar] [CrossRef] [PubMed]
- Emhoff, C.A.; Messonnier, L.A.; Horning, M.A.; Fattor, J.A.; Carlson, T.J.; Brooks, G.A. Gluconeogenesis and hepatic glycogenolysis during exercise at the lactate threshold. J. Appl. Physiol. (1985) 2013, 114, 297–306. [Google Scholar] [CrossRef] [PubMed]
- Emhoff, C.A.; Messonnier, L.A.; Horning, M.A.; Fattor, J.A.; Carlson, T.J.; Brooks, G.A. Direct and indirect lactate oxidation in trained and untrained men. J. Appl. Physiol. (1985) 2013, 115, 829–838. [Google Scholar] [CrossRef] [PubMed]
- Jentjens, R.L.; Jeukendrup, A.E. High rates of exogenous carbohydrate oxidation from a mixture of glucose and fructose ingested during prolonged cycling exercise. Br. J. Nutr. 2005, 93, 485–492. [Google Scholar] [CrossRef] [PubMed]
- Lecoultre, V.; Benoit, R.; Carrel, G.; Schutz, Y.; Millet, G.P.; Tappy, L.; Schneiter, P. Fructose and glucose co-ingestion during prolonged exercise increases lactate and glucose fluxes and oxidation compared with an equimolar intake of glucose. Am. J. Clin. Nutr. 2010, 92, 1071–1079. [Google Scholar] [CrossRef] [PubMed]
- Currell, K.; Jeukendrup, A.E. Superior endurance performance with ingestion of multiple transportable carbohydrates. Med. Sci. Sports Exerc. 2008, 40, 275–281. [Google Scholar] [CrossRef] [PubMed]
- Ahlborg, G.; Bjorkman, O. Splanchnic and muscle fructose metabolism during and after exercise. J. Appl. Physiol. (1985) 1990, 69, 1244–1251. [Google Scholar]
- Tappy, L.; Rosset, R. Fructose metabolism from a functional perspective: Implications for athletes. Sports Med. 2017, 47, 23–32. [Google Scholar] [CrossRef] [PubMed]
- Truswell, A.S.; Seach, J.M.; Thorburn, A.W. Incomplete absorption of pure fructose in healthy subjects and the facilitating effect of glucose. Am. J. Clin. Nutr. 1988, 48, 1424–1430. [Google Scholar] [PubMed]
- Goodwin, M.L.; Harris, J.E.; Hernandez, A.; Gladden, L.B. Blood lactate measurements and analysis during exercise: A guide for clinicians. J. Diabetes Sci. Technol. 2007, 1, 558–569. [Google Scholar] [CrossRef] [PubMed]
- MacRae, H.S.; Dennis, S.C.; Bosch, A.N.; Noakes, T.D. Effects of training on lactate production and removal during progressive exercise in humans. J. Appl. Physiol. (1985) 1992, 72, 1649–1656. [Google Scholar]
- Tounian, P.; Schneiter, P.; Henry, S.; Delarue, J.; Tappy, L. Effects of dexamethasone on hepatic glucose production and fructose metabolism in healthy humans. Am. J. Physiol. 1997, 273, E315–E320. [Google Scholar] [PubMed]
- Novel-Chate, V.; Rey, V.; Chiolero, R.; Schneiter, P.; Leverve, X.; Jequier, E.; Tappy, L. Role of Na+-K+-Atpase in insulin-induced lactate release by skeletal muscle. Am. J. Physiol. Endocrinol. Metab. 2001, 280, E296–E300. [Google Scholar] [PubMed]
- Sauvinet, V.; Gabert, L.; Qin, D.; Louche-Pelissier, C.; Laville, M.; Desage, M. Validation of pentaacetylaldononitrile derivative for dual 2H gas chromatography/mass spectrometry and 13C gas chromatography/combustion/isotope ratio mass spectrometry analysis of glucose. Rapid Commun. Mass Spectrom. 2009, 23, 3855–3867. [Google Scholar] [CrossRef] [PubMed]
- Frayn, K.N. Calculation of substrate oxidation rates in vivo from gaseous exchange. J. Appl. Physiol. Respir. Environ. Exerc. Physiol. 1983, 55, 628–634. [Google Scholar] [PubMed]
- Van Hall, G. Correction factors for 13C-labelled substrate oxidation at whole-body and muscle level. Proc. Nutr. Soc. 1999, 58, 979–986. [Google Scholar] [CrossRef] [PubMed]
- Steele, R.; Wall, J.S.; De Bodo, R.C.; Altszuler, N. Measurement of size and turnover rate of body glucose pool by the isotope dilution method. Am. J. Physiol. 1956, 187, 15–24. [Google Scholar] [PubMed]
- Schneider, J. Age dependency of oxygen uptake and related parameters in exercise testing: An expert opinion on reference values suitable for adults. Lung 2013, 191, 449–458. [Google Scholar] [CrossRef] [PubMed]
- Cox, G.R.; Clark, S.A.; Cox, A.J.; Halson, S.L.; Hargreaves, M.; Hawley, J.A.; Jeacocke, N.; Snow, R.J.; Yeo, W.K.; Burke, L.M. Daily training with high carbohydrate availability increases exogenous carbohydrate oxidation during endurance cycling. J. Appl. Physiol. (1985) 2010, 109, 126–134. [Google Scholar] [CrossRef] [PubMed]
- De Bock, K.; Derave, W.; Eijnde, B.O.; Hesselink, M.K.; Koninckx, E.; Rose, A.J.; Schrauwen, P.; Bonen, A.; Richter, E.A.; Hespel, P. Effect of training in the fasted state on metabolic responses during exercise with carbohydrate intake. J. Appl. Physiol. (1985) 2008, 104, 1045–1055. [Google Scholar] [CrossRef] [PubMed]
- Sun, S.Z.; Empie, M.W. Fructose metabolism in humans—What isotopic tracer studies tell us. Nutr. Metab. 2012, 9, 89. [Google Scholar] [CrossRef] [PubMed]
- Van Hall, G. Lactate kinetics in human tissues at rest and during exercise. Acta Physiol. 2010, 199, 499–508. [Google Scholar] [CrossRef] [PubMed]
- Bjorkman, O.; Gunnarsson, R.; Hagstrom, E.; Felig, P.; Wahren, J. Splanchnic and renal exchange of infused fructose in insulin-deficient type 1 diabetic patients and healthy controls. J. Clin. Investig. 1989, 83, 52–59. [Google Scholar] [CrossRef] [PubMed]
- Youn, J.H.; Bergman, R.N. Conversion of oral glucose to lactate in dogs. Primary site and relative contribution to blood lactate. Diabetes 1991, 40, 738–747. [Google Scholar] [CrossRef] [PubMed]
- Rosset, R.; Lecoultre, V.; Egli, L.; Cros, J.; Dokumaci, A.S.; Zwygart, K.; Boesch, C.; Kreis, R.; Schneiter, P.; Tappy, L. Postexercise repletion of muscle energy stores with fructose or glucose in mixed meals. Am. J. Clin. Nutr. 2017, 105, 609–617. [Google Scholar] [CrossRef] [PubMed]
- Bergman, B.C.; Wolfel, E.E.; Butterfield, G.E.; Lopaschuk, G.D.; Casazza, G.A.; Horning, M.A.; Brooks, G.A. Active muscle and whole body lactate kinetics after endurance training in men. J. Appl. Physiol. (1985) 1999, 87, 1684–1696. [Google Scholar]
- Mayes, P.A. Intermediary metabolism of fructose. Am. J. Clin. Nutr. 1993, 58, 754S–765S. [Google Scholar] [PubMed]
- Holloszy, J.O. Muscle metabolism during exercise. Arch. Phys. Med. Rehabil. 1982, 63, 231–234. [Google Scholar] [PubMed]
- Douard, V.; Ferraris, R.P. The role of fructose transporters in diseases linked to excessive fructose intake. J. Physiol. 2013, 591, 401–414. [Google Scholar] [CrossRef] [PubMed]
- Abdel-Sayed, A.; Binnert, C.; Le, K.A.; Bortolotti, M.; Schneiter, P.; Tappy, L. A high-fructose diet impairs basal and stress-mediated lipid metabolism in healthy male subjects. Br. J. Nutr. 2008, 100, 393–399. [Google Scholar] [CrossRef] [PubMed]


| GF Pre | GF Post | C Pre | C Post | |
|---|---|---|---|---|
| Body weight (kg) | 73.7 ± 3.0 | 73.6 ± 2.8 | 72.9 ± 2.9 | 73.1 ± 3.0 |
| VO2max (mL·kg−1·min−1) | 44.3 ± 2.3 | 48.4 ± 2.0 # | 46.4 ± 2.2 | 49.4 ± 2.1 # |
| Wmax (W) | 249 ± 20 | 281 ± 19 # | 249 ± 16 | 287 ± 21 # |
| WLT (W) | 156 ± 15 | 180 ± 15 # | 156 ± 12 | 181 ± 14 # |
| Endurance capacity (s) | 663 ± 110 | 1134 ± 163 # | 687 ± 177 | 1455 ± 293 # |
| GF Pre | GF Post | C Pre | C Post | ||
|---|---|---|---|---|---|
| Glucose appearance (mg·kg−1·min−1) | Rest | 5.6 ± 0.3 | 5.8 ± 0.2 | 5.1 ± 0.4 | 5.4 ± 0.4 |
| Exercise | 10.8 ± 0.6 $ | 10.9 ± 0.5 $ | 10.5 ± 0.3 $ | 10.7 ± 0.3 $ | |
| Lactate (mg·kg−1·min−1) | Rest | 0.5 ± 0.1 | 0.7 ± 0.1 * | 0.3 ± 0.0 | 0.3 ± 0.1 * |
| Exercise | 1.2 ± 0.2 $ | 1.1 ± 0.2 $ | 0.7 ± 0.1 $ | 0.7 ± 0.2 $ | |
| Other (mg·kg−1·min−1) | Rest | 5.1 ± 0.3 | 5.1 ± 0.2 | 4.8 ± 0.5 | 5.1 ± 0.4 |
| Exercise | 9.6 ± 0.6 $ | 9.8 ± 0.6 $ | 9.8 ± 0.3 $ | 9.9 ± 0.3 $ | |
| Glucose disposal (mg·kg−1·min−1) | Rest | 6.2 ± 0.5 | 6.4 ± 0.4 | 5.5 ± 0.6 | 6.0 ± 0.5 |
| Exercise | 10.8 ± 0.7 $ | 11.2 ± 0.5 $ | 10.5 ± 0.3 $ | 10.8 ± 0.3 $ | |
| Glucose clearance (mL·kg−1·min−1) | Rest | 5.0 ± 0.5 | 5.0 ± 0.4 | 4.4 ± 0.6 | 4.7 ± 0.4 |
| Exercise | 11.2 ± 0.9 $ | 11.5 ± 0.7 $ | 11.5 ± 0.6 $ | 11.5 ± 0.3 $ | |
| Lactate appearance (mg·kg−1·min−1) | Rest | 3.6 ± 0.5 | 5.2 ± 0.7 ** | 3.6 ± 0.4 | 2.6 ± 0.5 ** |
| Exercise | 11.2 ± 1.4 $ | 12.1 ± 1.5 $ | 8.8 ± 0.7 $ | 8.3 ± 0.9 $ | |
| Lactate disposal (mg·kg−1·min−1) | Rest | 3.4 ± 0.5 | 5.0 ± 0.7 ** | 3.2 ± 0.4 | 2.5 ± 0.4 ** |
| Exercise | 11.3 ± 1.4 $ | 12.1 ± 1.5 $ | 9.1 ± 0.7 $ | 8.4 ± 1.0 $ | |
| Oxidation (mg·kg−1·min−1) | Rest | 0.7 ± 0.1 | 0.9 ± 0.1 * | 0.6 ± 0.1 | 0.4 ± 0.1 * |
| Exercise | 9.7 ± 1.4 $ | 10.6 ± 1.7 $ | 7.9 ± 1.0 $ | 7.3 ± 1.1 $ | |
| NOLD (mg·kg−1·min−1) | Rest | 2.7 ± 0.4 | 4.1 ± 0.6 ** | 2.7 ± 0.4 | 2.0 ± 0.4 ** |
| Exercise | 1.5 ± 0.3 $ | 1.5 ± 0.4 $ | 1.2 ± 0.6 $ | 1.0 ± 0.5 $ | |
| Lactate clearance (mL·kg−1·min−1) | Rest | 17.8 ± 3.0 | 26.9 ± 4.9 * | 16.0 ± 2.6 | 13.1 ± 2.6 * |
| Exercise | 75.5 ± 8.7 $ | 91.0 ± 9.6 $# | 47.6 ± 4.7 $ | 57.6 ± 7.0 $# |
| GF Pre | GF Post | C Pre | C Post | ||
|---|---|---|---|---|---|
| Energy expenditure (kcal·min−1) | Rest | 1.5 ± 0.1 | 1.5 ± 0.0 | 1.4 ± 0.1 | 1.4 ± 0.1 |
| Exercise | 8.3 ± 0.5 $ | 8.4 ± 0.6 $ | 8.9 ± 0.5 $ | 9.0 ± 0.6 $ | |
| Protein (mg·kg−1·min−1) | Both | 0.8 ± 0.0 | 0.8 ± 0.1 | 0.8 ± 0.1 | 0.8 ± 0.1 |
| Lipid (mg·kg−1·min−1) | Rest | 0.8 ± 0.1 | 0.8 ± 0.1 | 0.6 ± 0.1 | 0.6 ± 0.2 |
| Exercise | 0.8 ± 0.3 | 0.5 ± 0.3 | 0.4 ± 0.2 | 0.8 ± 0.3 | |
| Carbohydrate (mg·kg−1·min−1) | Rest | 2.8 ± 0.4 | 2.8 ± 0.3 | 2.9 ± 0.4 | 2.8 ± 0.4 |
| Exercise | 27.6 ± 2.4 $ | 28.5 ± 2.6 $ | 30.6 ± 1.7 $ | 30.0 ± 1.7 $ | |
| Lactate (mg·kg−1·min−1) | Rest | 0.7 ± 0.1 | 0.9 ± 0.1 * | 0.6 ± 0.1 | 0.4 ± 0.1 * |
| Exercise | 9.7 ± 1.4 $ | 10.6 ± 1.7 $ | 7.9 ± 1.0 $ | 7.3 ± 1.1 $ | |
| Other (mg·kg−1·min−1) | Rest | 2.1 ± 0.4 | 1.8 ± 0.4 | 2.4 ± 0.5 | 2.3 ± 0.4 |
| Exercise | 17.8 ± 1.5 $ | 17.9 ± 1.4 $ | 22.7 ± 1.4 $ | 22.7 ± 1.8 $ |
© 2017 by the authors. Licensee MDPI, Basel, Switzerland. This article is an open access article distributed under the terms and conditions of the Creative Commons Attribution (CC BY) license (http://creativecommons.org/licenses/by/4.0/).
Share and Cite
Rosset, R.; Lecoultre, V.; Egli, L.; Cros, J.; Rey, V.; Stefanoni, N.; Sauvinet, V.; Laville, M.; Schneiter, P.; Tappy, L. Endurance Training with or without Glucose-Fructose Ingestion: Effects on Lactate Metabolism Assessed in a Randomized Clinical Trial on Sedentary Men. Nutrients 2017, 9, 411. https://doi.org/10.3390/nu9040411
Rosset R, Lecoultre V, Egli L, Cros J, Rey V, Stefanoni N, Sauvinet V, Laville M, Schneiter P, Tappy L. Endurance Training with or without Glucose-Fructose Ingestion: Effects on Lactate Metabolism Assessed in a Randomized Clinical Trial on Sedentary Men. Nutrients. 2017; 9(4):411. https://doi.org/10.3390/nu9040411
Chicago/Turabian StyleRosset, Robin, Virgile Lecoultre, Léonie Egli, Jérémy Cros, Valentine Rey, Nathalie Stefanoni, Valérie Sauvinet, Martine Laville, Philippe Schneiter, and Luc Tappy. 2017. "Endurance Training with or without Glucose-Fructose Ingestion: Effects on Lactate Metabolism Assessed in a Randomized Clinical Trial on Sedentary Men" Nutrients 9, no. 4: 411. https://doi.org/10.3390/nu9040411