Article

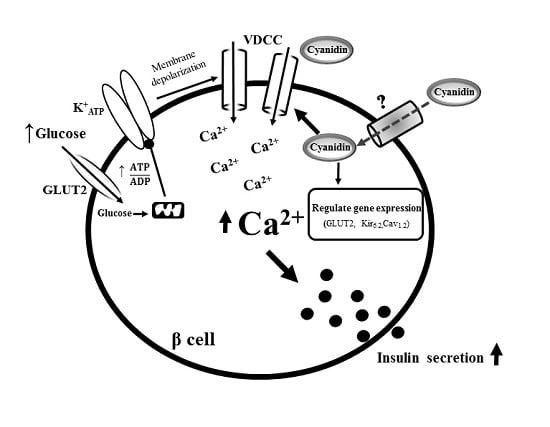
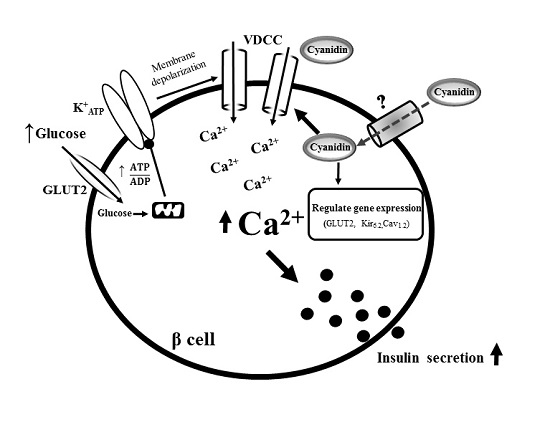
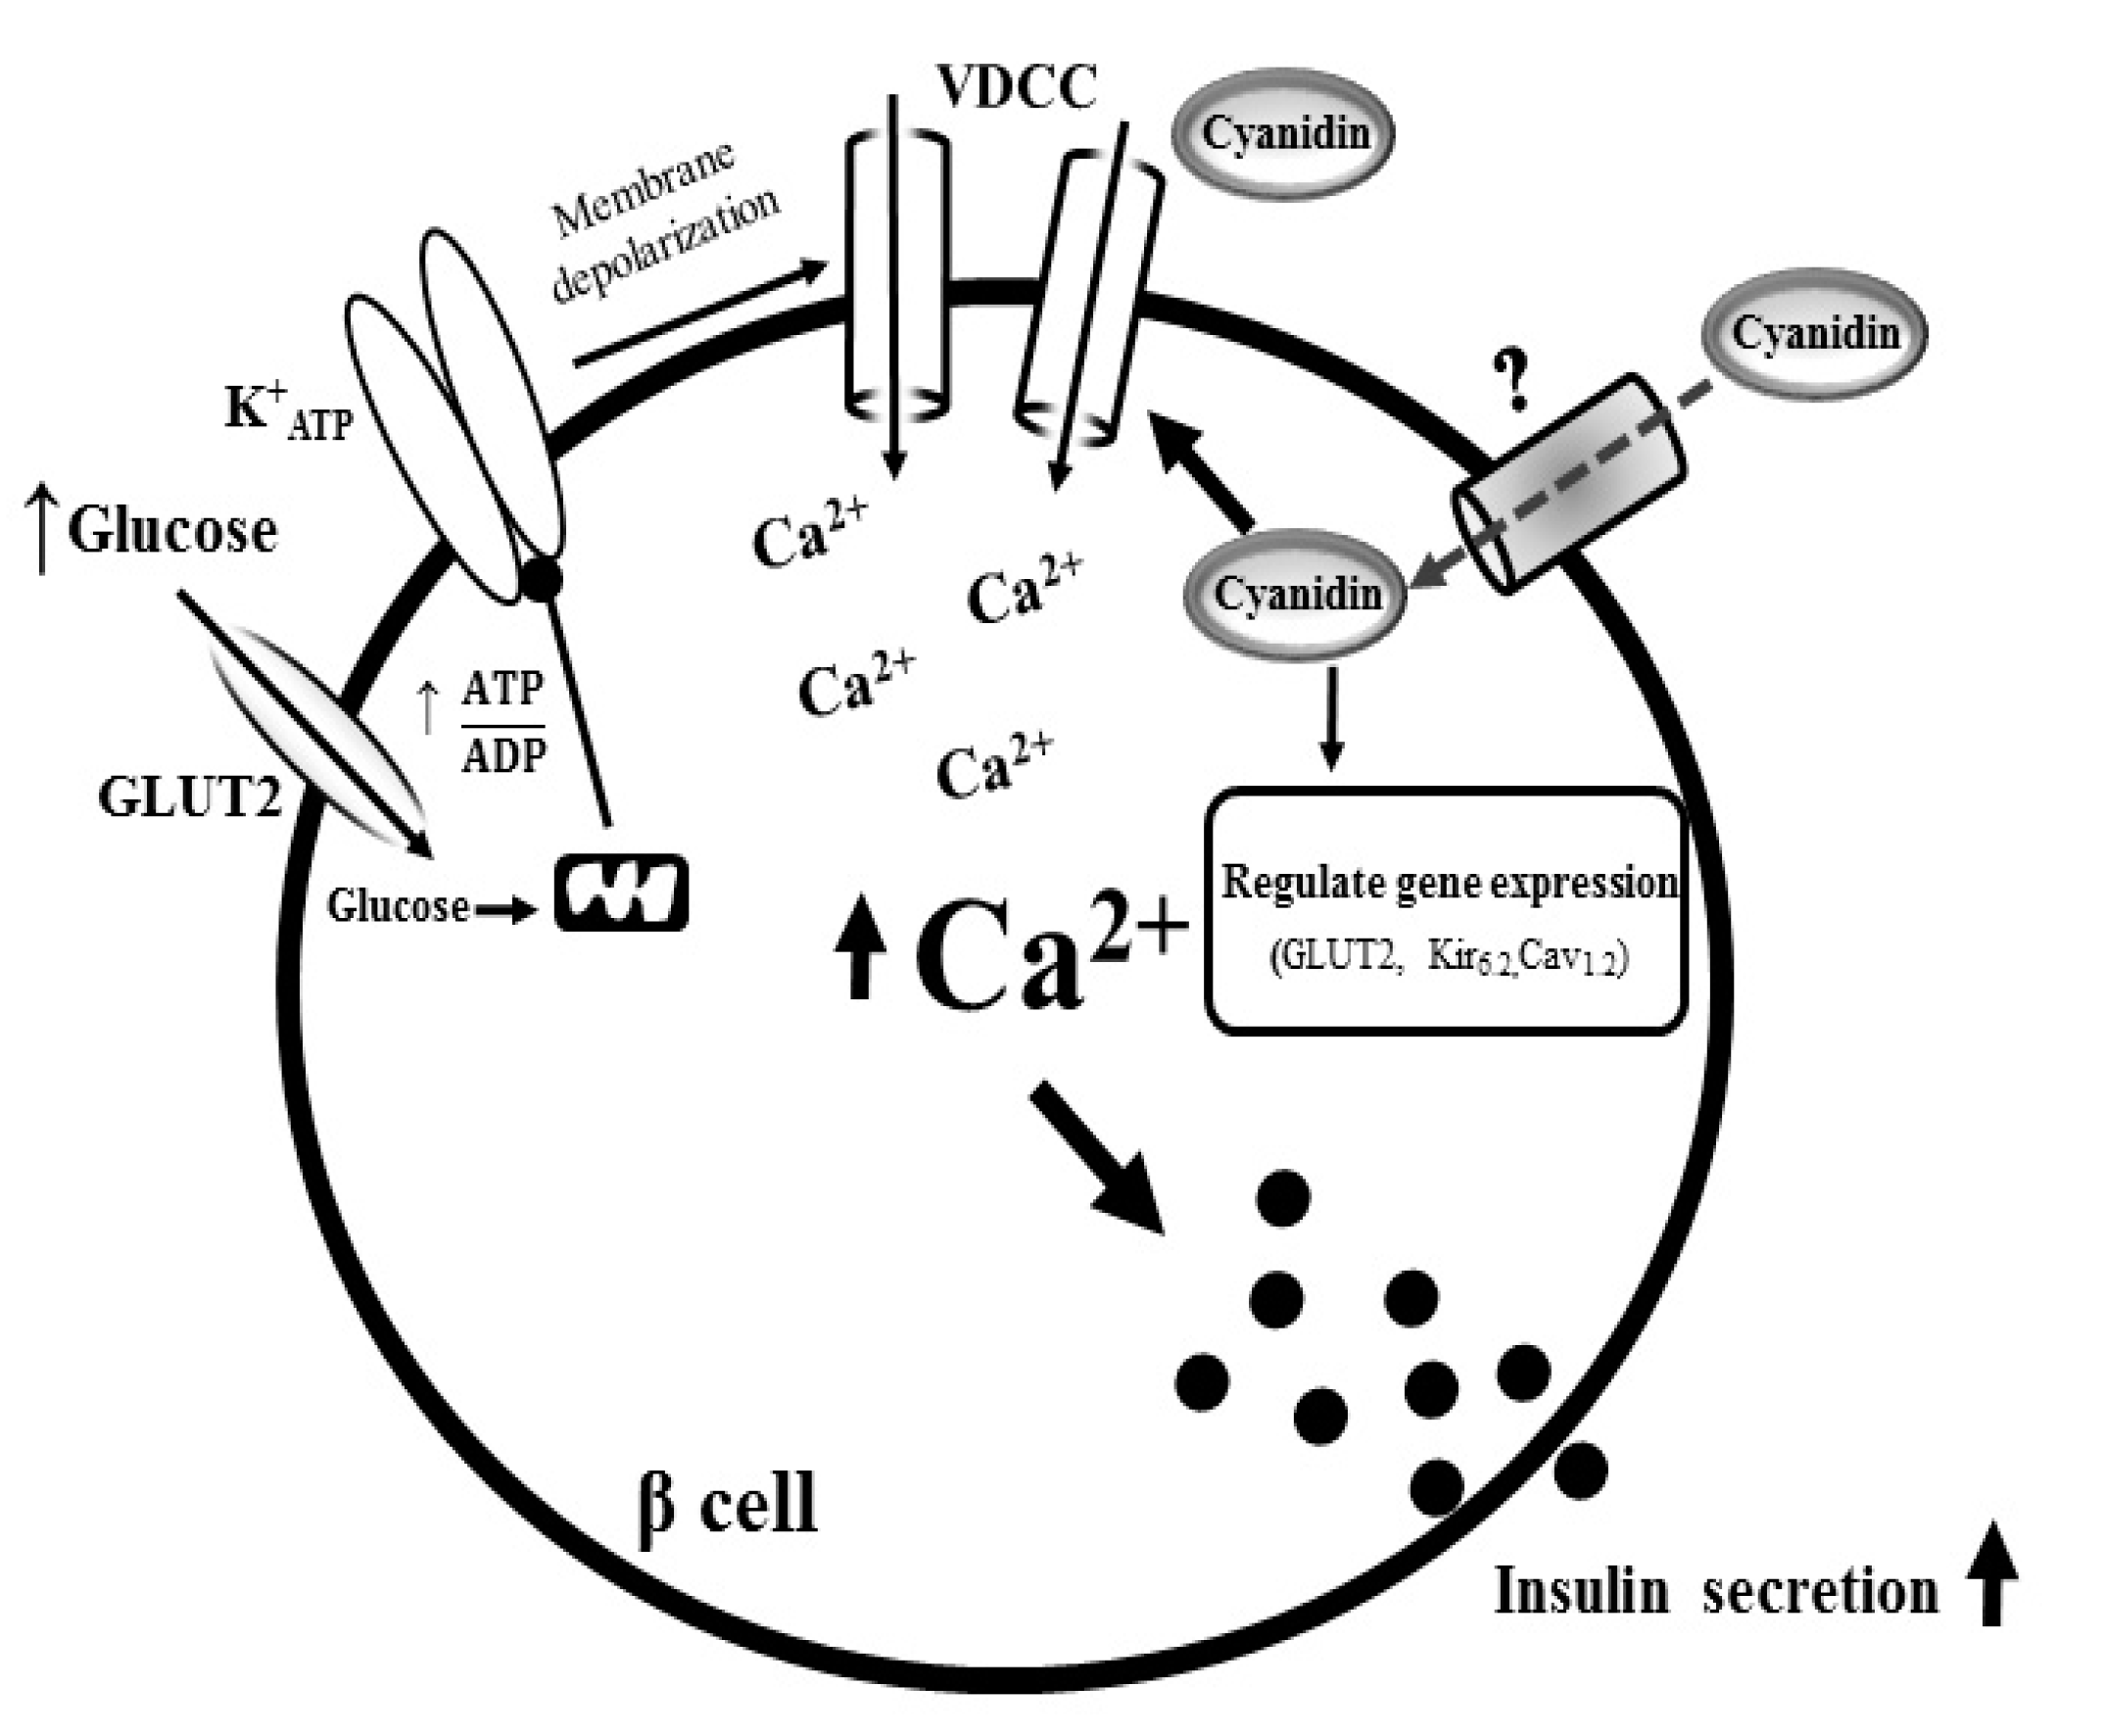
Cyanidin Stimulates Insulin Secretion and Pancreatic β-Cell Gene Expression through Activation of l-type Voltage-Dependent Ca2+ Channels

1
Program in Biomedical Sciences, Graduate School, Chulalongkorn University, Bangkok 10330, Thailand
2
Department of Pharmacology, Faculty of Veterinary Medicine, Mansoura University, Mansoura 35516, Egypt
3
Department of Biomedical Sciences, College of Veterinary Medicine, Iowa State University, Ames, IA 50011, USA
4
Department of Comparative Biomedical Sciences, School of Veterinary Medicine, Louisiana State University, Baton Rouge, LA 70803, USA
5
Department of Nutrition and Dietetics, Faculty of Allied Health Sciences, Chulalongkorn University, Bangkok 10330, Thailand
*
Author to whom correspondence should be addressed.
Nutrients 2017, 9(8), 814; https://doi.org/10.3390/nu9080814
Submission received: 23 June 2017 / Revised: 25 July 2017 / Accepted: 26 July 2017 / Published: 28 July 2017
(This article belongs to the Special Issue Nutrients, Bioactives and Insulin Resistance)

Abstract

:
Cyanidin is a natural anthocyanidin present in fruits and vegetables with anti-diabetic properties including stimulation of insulin secretion. However, its mechanism of action remains unknown. In this study, we elucidated the mechanisms of cyanidin for stimulatory insulin secretion from pancreatic β-cells. Rat pancreatic β-cells INS-1 were used to investigate the effects of cyanidin on insulin secretion, intracellular Ca2+ signaling, and gene expression. We detected the presence of cyanidin in the intracellular space of β-cells. Cyanidin stimulated insulin secretion and increased intracellular Ca2+ signals in a concentration-dependent manner. The Ca2+ signals were abolished by nimodipine, an l-type voltage-dependent Ca2+ channel (VDCC) blocker or under extracellular Ca2+ free conditions. Stimulation of cells with cyanidin activated currents typical for VDCCs and up-regulated the expression of glucose transporter 2 (GLUT2), Kir6.2, and Cav1.2 genes. Our findings indicate that cyanidin diffuses across the plasma membrane, leading to activation of l-type VDCCs. The increase in intracellular Ca2+ stimulated insulin secretion and the expression of genes involved in this process. These findings suggest that cyanidin could be used as a promising agent to stimulate insulin secretion.

Graphical Abstract

1. Introduction

Glucose is the main physiological stimulus for insulin secretion from pancreatic β-cells. When glucose enters cells through glucose transporter 2 (GLUT2), it is phosphorylated to glucose-6 phosphate by glucokinase and metabolized to generate ATP. The generation of ATP induces the closure of ATP-sensitive K+ channels (KATP), which evokes membrane depolarization and the opening of voltage-dependent Ca2+ channels (VDCCs). This increases intracellular Ca2+ concentration and stimulates insulin secretion [1,2]. In type 2 diabetes mellitus (T2DM), the failure of pancreatic β-cells results from chronic exposure to a high level of circulating glucose, which causes insufficient insulin secretion or loss of insulin action at target tissues [3]. Current treatments for hyperglycemia include oral hypoglycemic agents such as sulfonylureas and insulin secretagogues that stimulate insulin release from β-cells. However, these compounds can result in significant hypoglycemia and secondary insulin secretion failure [4]. To overcome this issue, several studies suggest the use of phytochemical compounds from fruits, vegetables, and herbal medicines to induce insulin secretion [5,6,7].
Cyanidin, a member of the anthocyanidin class, is one of the most abundant flavonoids found in red-purple diet sources such as fruits, vegetables, and red wine [8]. Cyanidin and its derivatives possess several pharmacological properties including antioxidant [9], anti-inflammatory [10], and antihyperglycemic activity [11,12]. For example, we demonstrated the ability of cyanidin and its derivatives to inhibit intestinal α-glucosidase and pancreatic α-amylase, which are key enzymes for carbohydrate digestion and absorption [11]. Furthermore, supplementation of cyanidin-derivative enriched extract prevents the progression of diabetes by preserving pancreatic islet architecture in streptozotocin (STZ)-induced diabetic rats [12]. Cyanidin and its derivatives also suppress hyperglycemia and improve glucose homeostasis and insulin sensitivity [13,14]. Our previous study indicates that cyanidin is an anti-glycating agent against glucose- and methylglyoxal (MG)-induced protein glycation/oxidation by MG trapping and free radical scavenging. Therefore, cyanidin could be used as a phytochemical compound to delay and prevent diabetic complications [15]. Cyanidin induces insulin secretion under low and high glucose conditions [16]. However, the mechanism by which cyanidin stimulates insulin secretion from pancreatic β-cells is unknown.
The purpose of this study was to elucidate the signaling pathway by which cyanidin induces insulin secretion from pancreatic β-cells. In the present study, cyanidin itself has ability to stimulate insulin secretion from pancreatic β-cells by increasing intracellular calcium through l-type Ca2+ channels. Following supplementation, cyanidin exhibits gene-regulatory activity by up-regulating expression of gene-associated insulin secretion. These findings indicate that cyanidin can be considered as a promising agent for stimulating insulin secretion and regulating gene transcriptions related to insulin secretory response.

2. Materials and Methods

2.1. Chemicals

All reagents were purchased from Sigma Chemical Co. (St. Louis, MO, USA), except Fura-2 acetoxymethyl ester (Fura-2AM) and Naturstoff reagent A, which were purchased from Cayman Chemical Co. (Ann Arbor, MI, USA) and Alfa Aesar (Ward Hill, MA, USA), respectively. Naturstoff reagent A was dissolved in ethanol at the concentration of 5% and then in phosphate buffered saline (PBS) at the concentration of 0.2%. Cyanidin chloride was synthesized from quercetin according previous method [17]. Cyanidin was dissolved in DMSO to obtain the desired concentrations.

2.2. Cell Culture

Pancreatic β-cells INS-1 were used in the study and cultured in RPMI-1640 medium containing 11 mM glucose supplemented with 10% fetal bovine serum (FBS), 2 mM l-glutamine, 1 mM sodium pyruvate, and 50 µM 2-mercaptoethanol. The cells were maintained in humidified atmosphere at 5% CO2 at 37 °C. All experiments were performed with cells between passages 70 and 85.

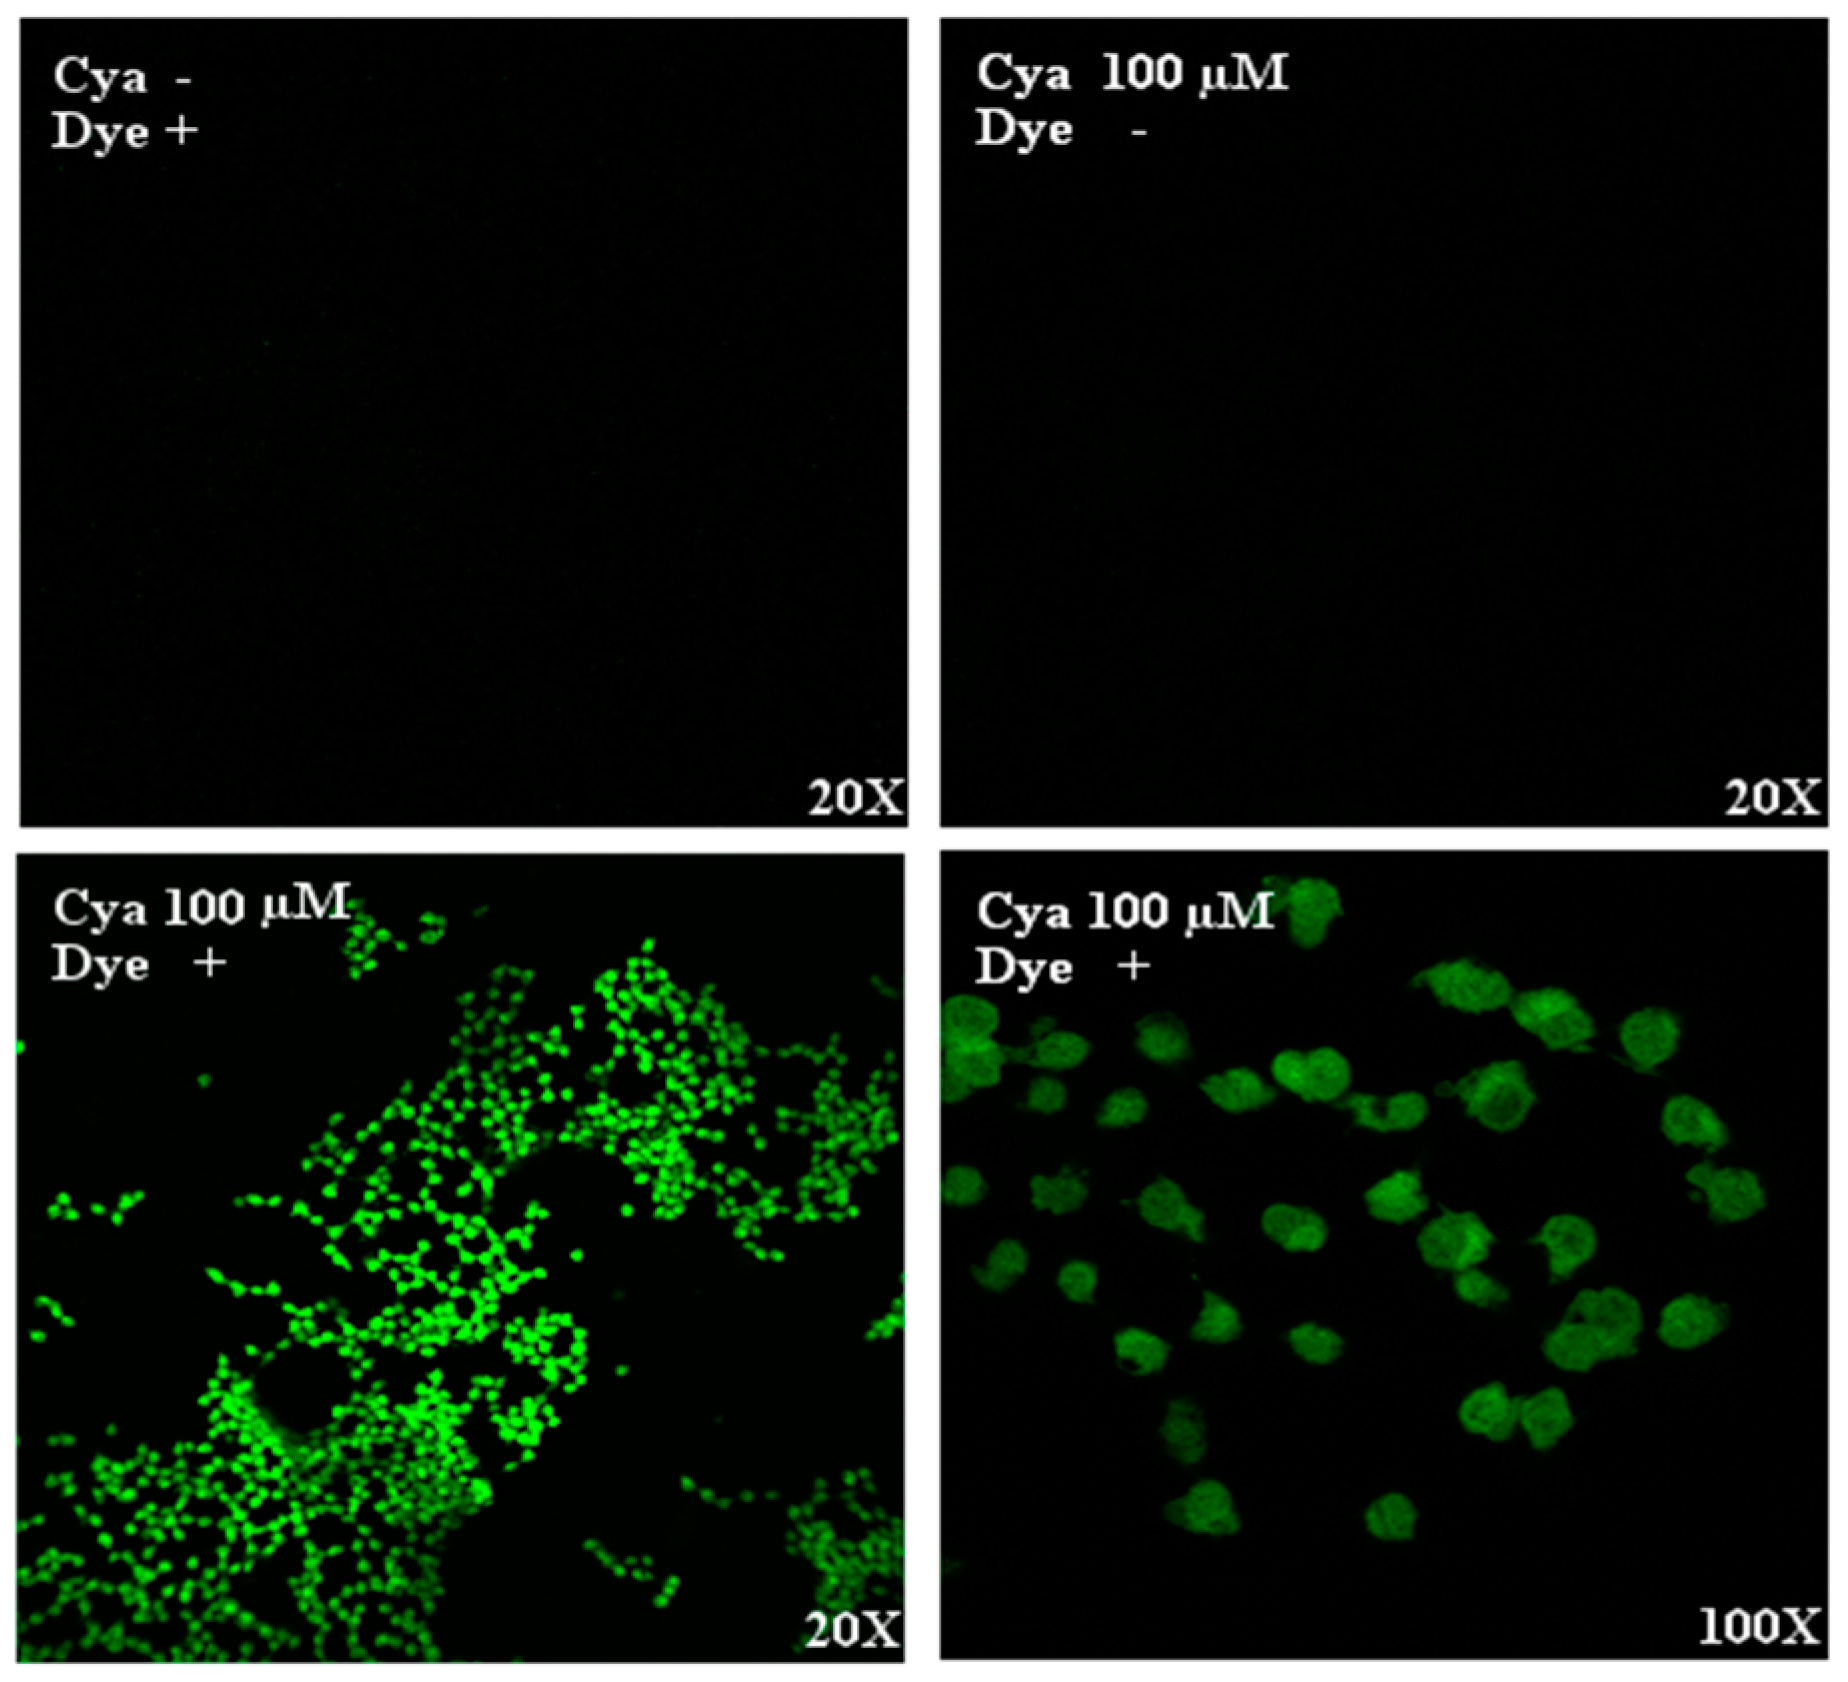
2.3. Cyanidin Localization

The visualization of cyanidin was determined using Naturstoff reagent A with minor modification [18]. Briefly, INS-1 cells were grown on 25 mm coverslips and treated with 100 µM cyanidin or DMSO (negative control). After 10 min of incubation, cells were washed with PBS and incubated with 0.2% Naturstoff reagent A for 5 min. Subsequently, cells were washed again with PBS and fixed in 4% paraformaldehyde for 10 min. Finally, the coverslips were placed on glass slides and examined by confocal laser scanning microscope. Fluorescent images were analyzed at an excitation wavelength of 488 nm and emission wavelengths of 620–705 nm.

2.4. Static Incubation for Insulin Determination

INS-1 cells were cultured on 24-well plates at a density of 5 × 10⁵ cells/well. Upon reaching confluency, the cells were incubated for 30 min in modified Krebs-Ringer bicarbonate buffer (KRB) containing 136 mM NaCl, 4.8 mM KCl, 2.5 mM CaCl2, 1.2 mM KH2PO4, 1.2 mM MgSO4, 5 mM NaHCO3, 10 mM HEPES, 4 mM glucose, and 0.1% bovine serum albumin (BSA), pH 7.4. The cells were then incubated for 30 min in KRB containing different cyanidin concentrations or KCl (positive control). After incubation, the supernatant was collected and stored frozen at −80 °C for insulin determination with radioimmunoassay (RIA). Finally, the number of cells/well was quantified to normalize the insulin concentrations. Each treatment was done in quadruplicates and repeated three times.

2.5. Real-Time Ca2+ Imaging Analysis

Cells were grown on round glass coverslip for 48 h until 80–90% confluent and loaded with 5 µM Fura-2AM for 30 min at 37 °C. A Ca2+ imaging buffer containing in mM: 136 NaCl, 4.8 KCl, 1.2 CaCl2, 1.2 MgSO4, 10 HEPES, 4 glucose, and 0.1% BSA at a pH of 7.4 was used for Fura-2AM loading and perfusion throughout the experiments, except in Ca2+ free experiments where CaCl2 was absent and 0.1 mM Ethylene glycol-bis(2-aminoethylether)-N,N,N′,N′-tetraacetic acid (EGTA) added. Intracellular Ca2+ signals were recorded using a dual excitation fluorometric imaging system (TILL-Photonics Gräfelfingen, Germany) controlled by TILLvisION software. Fura-2AM loaded cells were excited at wavelengths of 340 nm and 380 nm. Fluorescence emissions were sampled at 1 Hz and computed as F340/F380 ratio. The data were plotted as the averages from several cells from three independent experiments or the peak Ca2+ increases.

2.6. Electrophysiology

INS-1 cells were grown on round glass coverslips for 18 h and transferred to the patch clamp recording chamber. Cells were maintained in external solution containing in mM: 102 NaCl, 10 CaCl2, 5.4 CsCl, 1 MgCl2, 20 TEA-Cl, 5 HEPES, and 10 glucose (pH 7.4 with NaOH). The pipette solution contained in mM: 135 CsCl, 3 MgCl2, 3 Mg-ATP, 10 EGTA, and 5 HEPES (pH 7.4 with CsOH). VDCC currents were recorded in the tight-seal whole-cell configuration mode at 21–25 °C. High-resolution current recordings were acquired by a computer-based patch-clamp amplifier system (EPC-10, HEKA, Lambrecht, Germany). Patch pipettes had resistances of 3–5 MΩ. After break-in, 50 ms voltage ramps spanning from −100 mV to +100 mV were applied every 2 s from a holding potential (Vh) of −80 mV until the currents reached a steady amplitude. Then cells were clamped from Vh = −80 mV to membrane potentials of −80 mV to +80 mV in 10 mV steps of 400 ms each with 2 s between the voltage steps. Patch-clamp recordings were analyzed and plotted with Igor Pro 5 software program (Wavemetrics, Portland, OR, USA).

2.7. Real-Time PCR

INS-1 cells were treated with 100 µM cyanidin for 24 h and RNA extracted for real-time PCR analysis of rat Insulin (Ins), glucose transporter type 2 (GLUT2), glucokinase (GK), ATP-sensitive K+ channel (Kir6.2), and l-type Ca2+ channel (Cav1.2) genes. Total RNA was extracted using RNAqueous® Total RNA Isolation Kit (Ambion, Austin, TX, USA), based on the manufacturer’s instructions and purified with DNase 1 treatment. The cDNA was synthesized from 1 µg of total RNA using iScriptTM cDNA Synthesis Kit (Bio-Rad, Richmond, CA, USA). Real-time PCR was performed using SsoAdvancedTM Universal SYBR® Green Supermix (Bio-Rad, Richmond, CA, USA). Quantification was normalized to the β-actin gene. Experiments were repeated three times.
The primers (forward/reverse [5′–3′]) were: CACCCAAGTCCCGTCGTGAAGT/GATCCACAATGCCACGCTTCTG (Ins); GAAATTCAAGAAGCGAAAAG/CCTGCTGTCACTCTGGTAGTAG (Cav1.2); TAAGGGGCACTGAGGACATC/TGCCAGCTGTCTGAAAAATG (GLUT2); AAGGGAACAACATCGTAGGA/CATTGGCGGTCTTCATAGTA (GK); TCCACCAGGTAGACATCCC/TAGGAGCCAGGTCGTAGAG (Kir6.2); GCGTGACATCAAAGAGAAG/ACTGTGTTGGCATAGAGG (β-actin).

2.8. Data Analysis

The results of insulin secretion, intracellular Ca2+ signal, and real-time PCR were expressed as mean ± standard error of the mean (S.E.M.) from the three independent experiments (n = 3). Patch-clamp recordings were expressed as representative current–voltage relationship (I/V) for VDCC channels from 24 to 31 cells from each group. The average current amplitude for cyanidin and control and the average traces for cyanidin and diazoxide were compared using unpaired Student’s t-test. Multiple group comparisons for cyanidin and control experiments including insulin secretion, intracellular Ca2+ signal and real-time PCR were carried out using one-way analysis of variance (ANOVA), followed by Tukey’s post hoc test (SPSS, Chicago, IL, USA). p < 0.05 was considered to be statistically significant.

3. Results

3.1. Intracellular Detection of Cyanidin

To determine whether cyanidin could diffuse across the plasma membrane, Naturstoff reagent A was used. We detected the presence of cyanidin in the intracellular space 10 min after stimulation of cells and treatment with Naturstoff reagent A, but not after cyanidin or reagent alone (Figure 1). The presence of fluorescence in the cytoplasm indicates that cyanidin diffuses across the plasma membrane and promote its effect from the intracellular space.

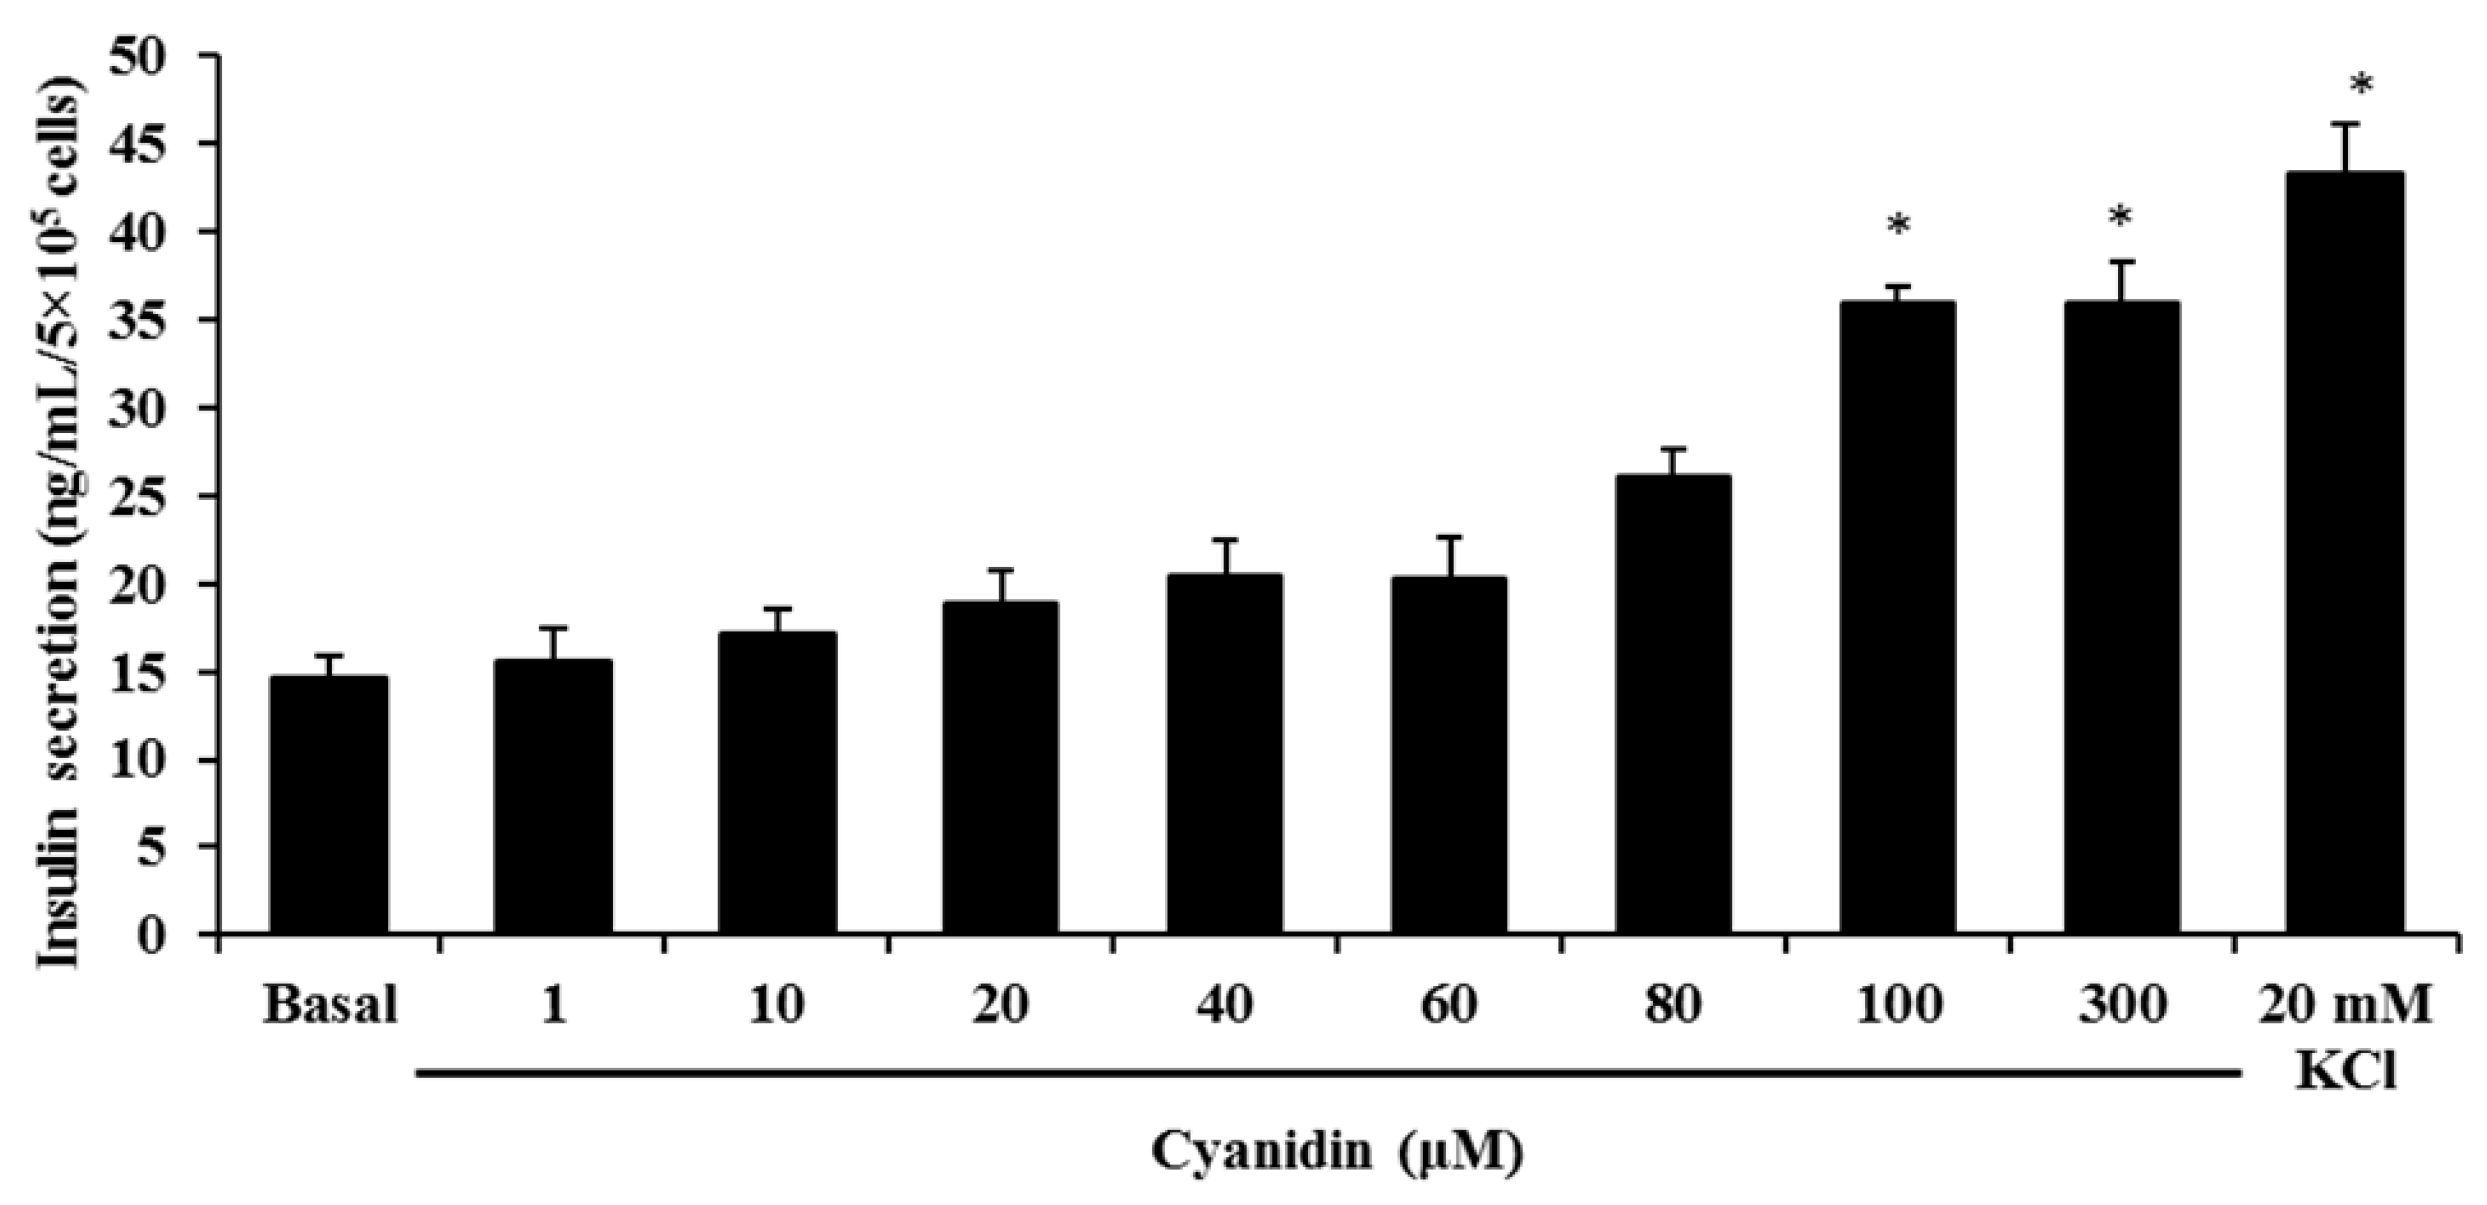
3.2. Cyanidin Stimulates Insulin Secretion

Next, we stimulated cells with increasing concentrations of cyanidin to examine whether it could stimulate insulin secretion. The results showed that cyanidin (1–300 µM) markedly increased insulin release from INS-1 cells (Figure 2). The calculated EC50 for cyanidin was 80.08 ± 2.11 µM. The maximum secretion was achieved with 100 µM cyanidin that caused a 2.5-fold increase over basal, whereas 20 mM KCl resulted in a 3-fold increase.

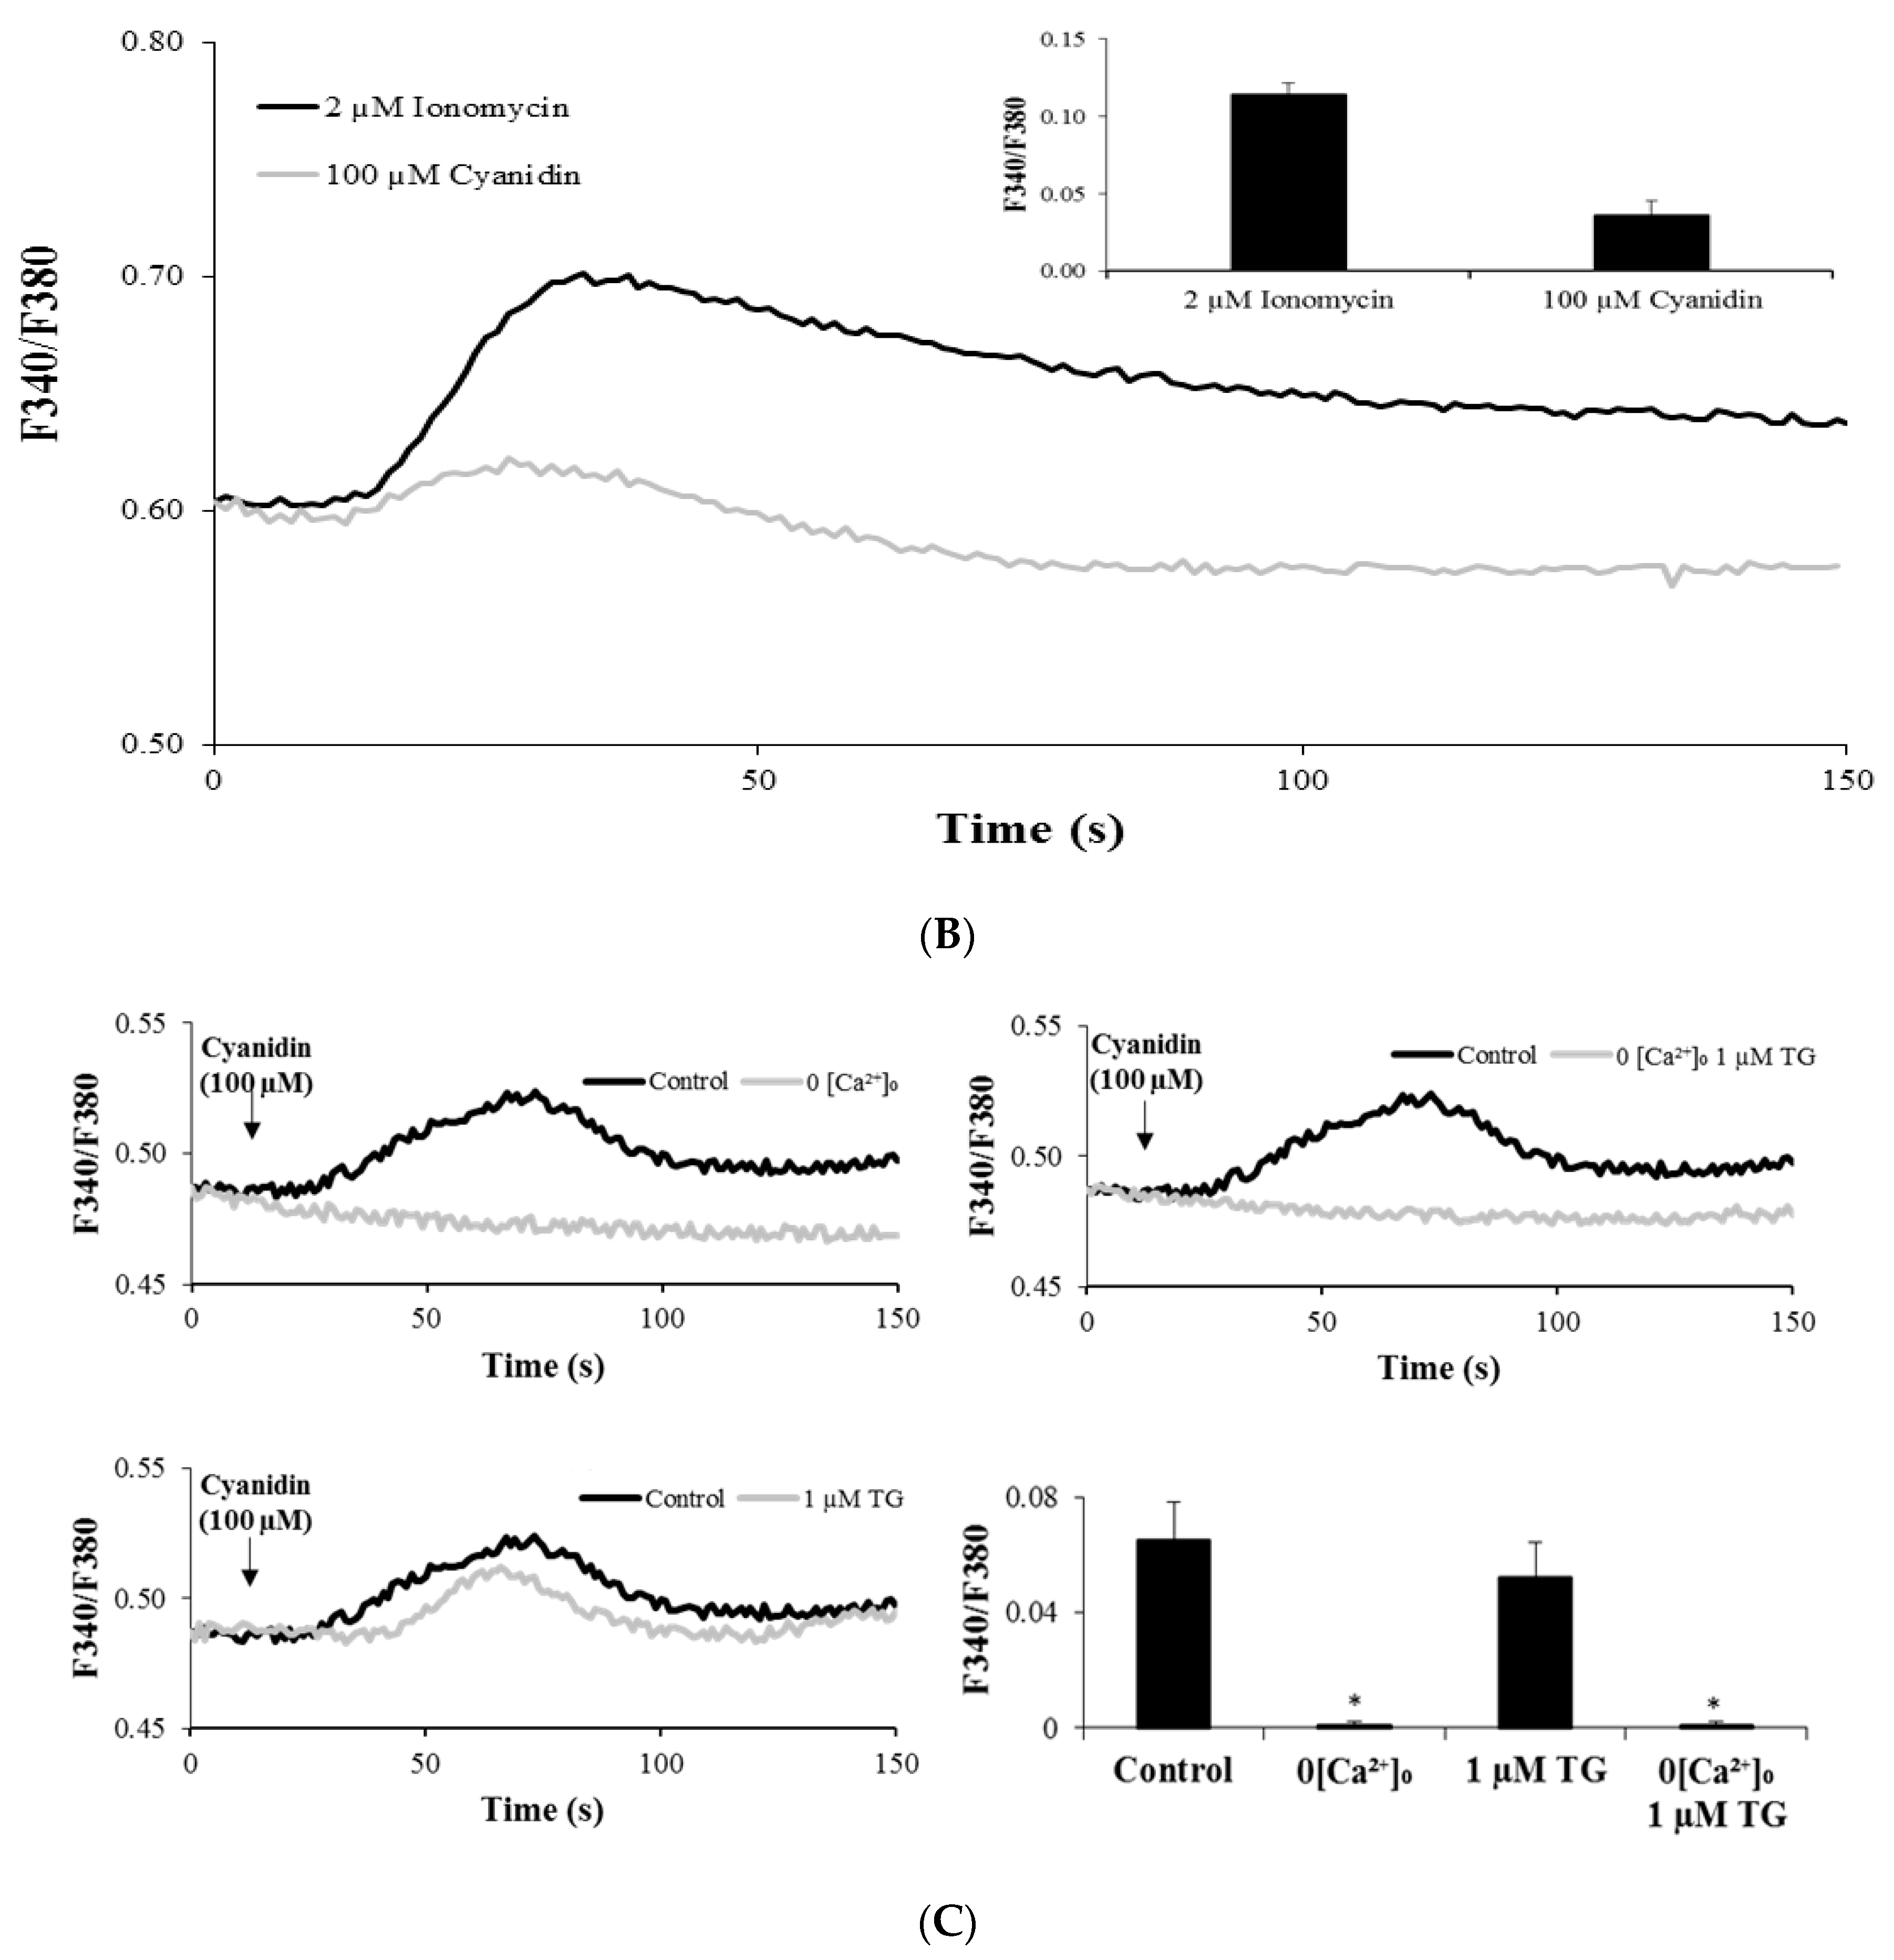
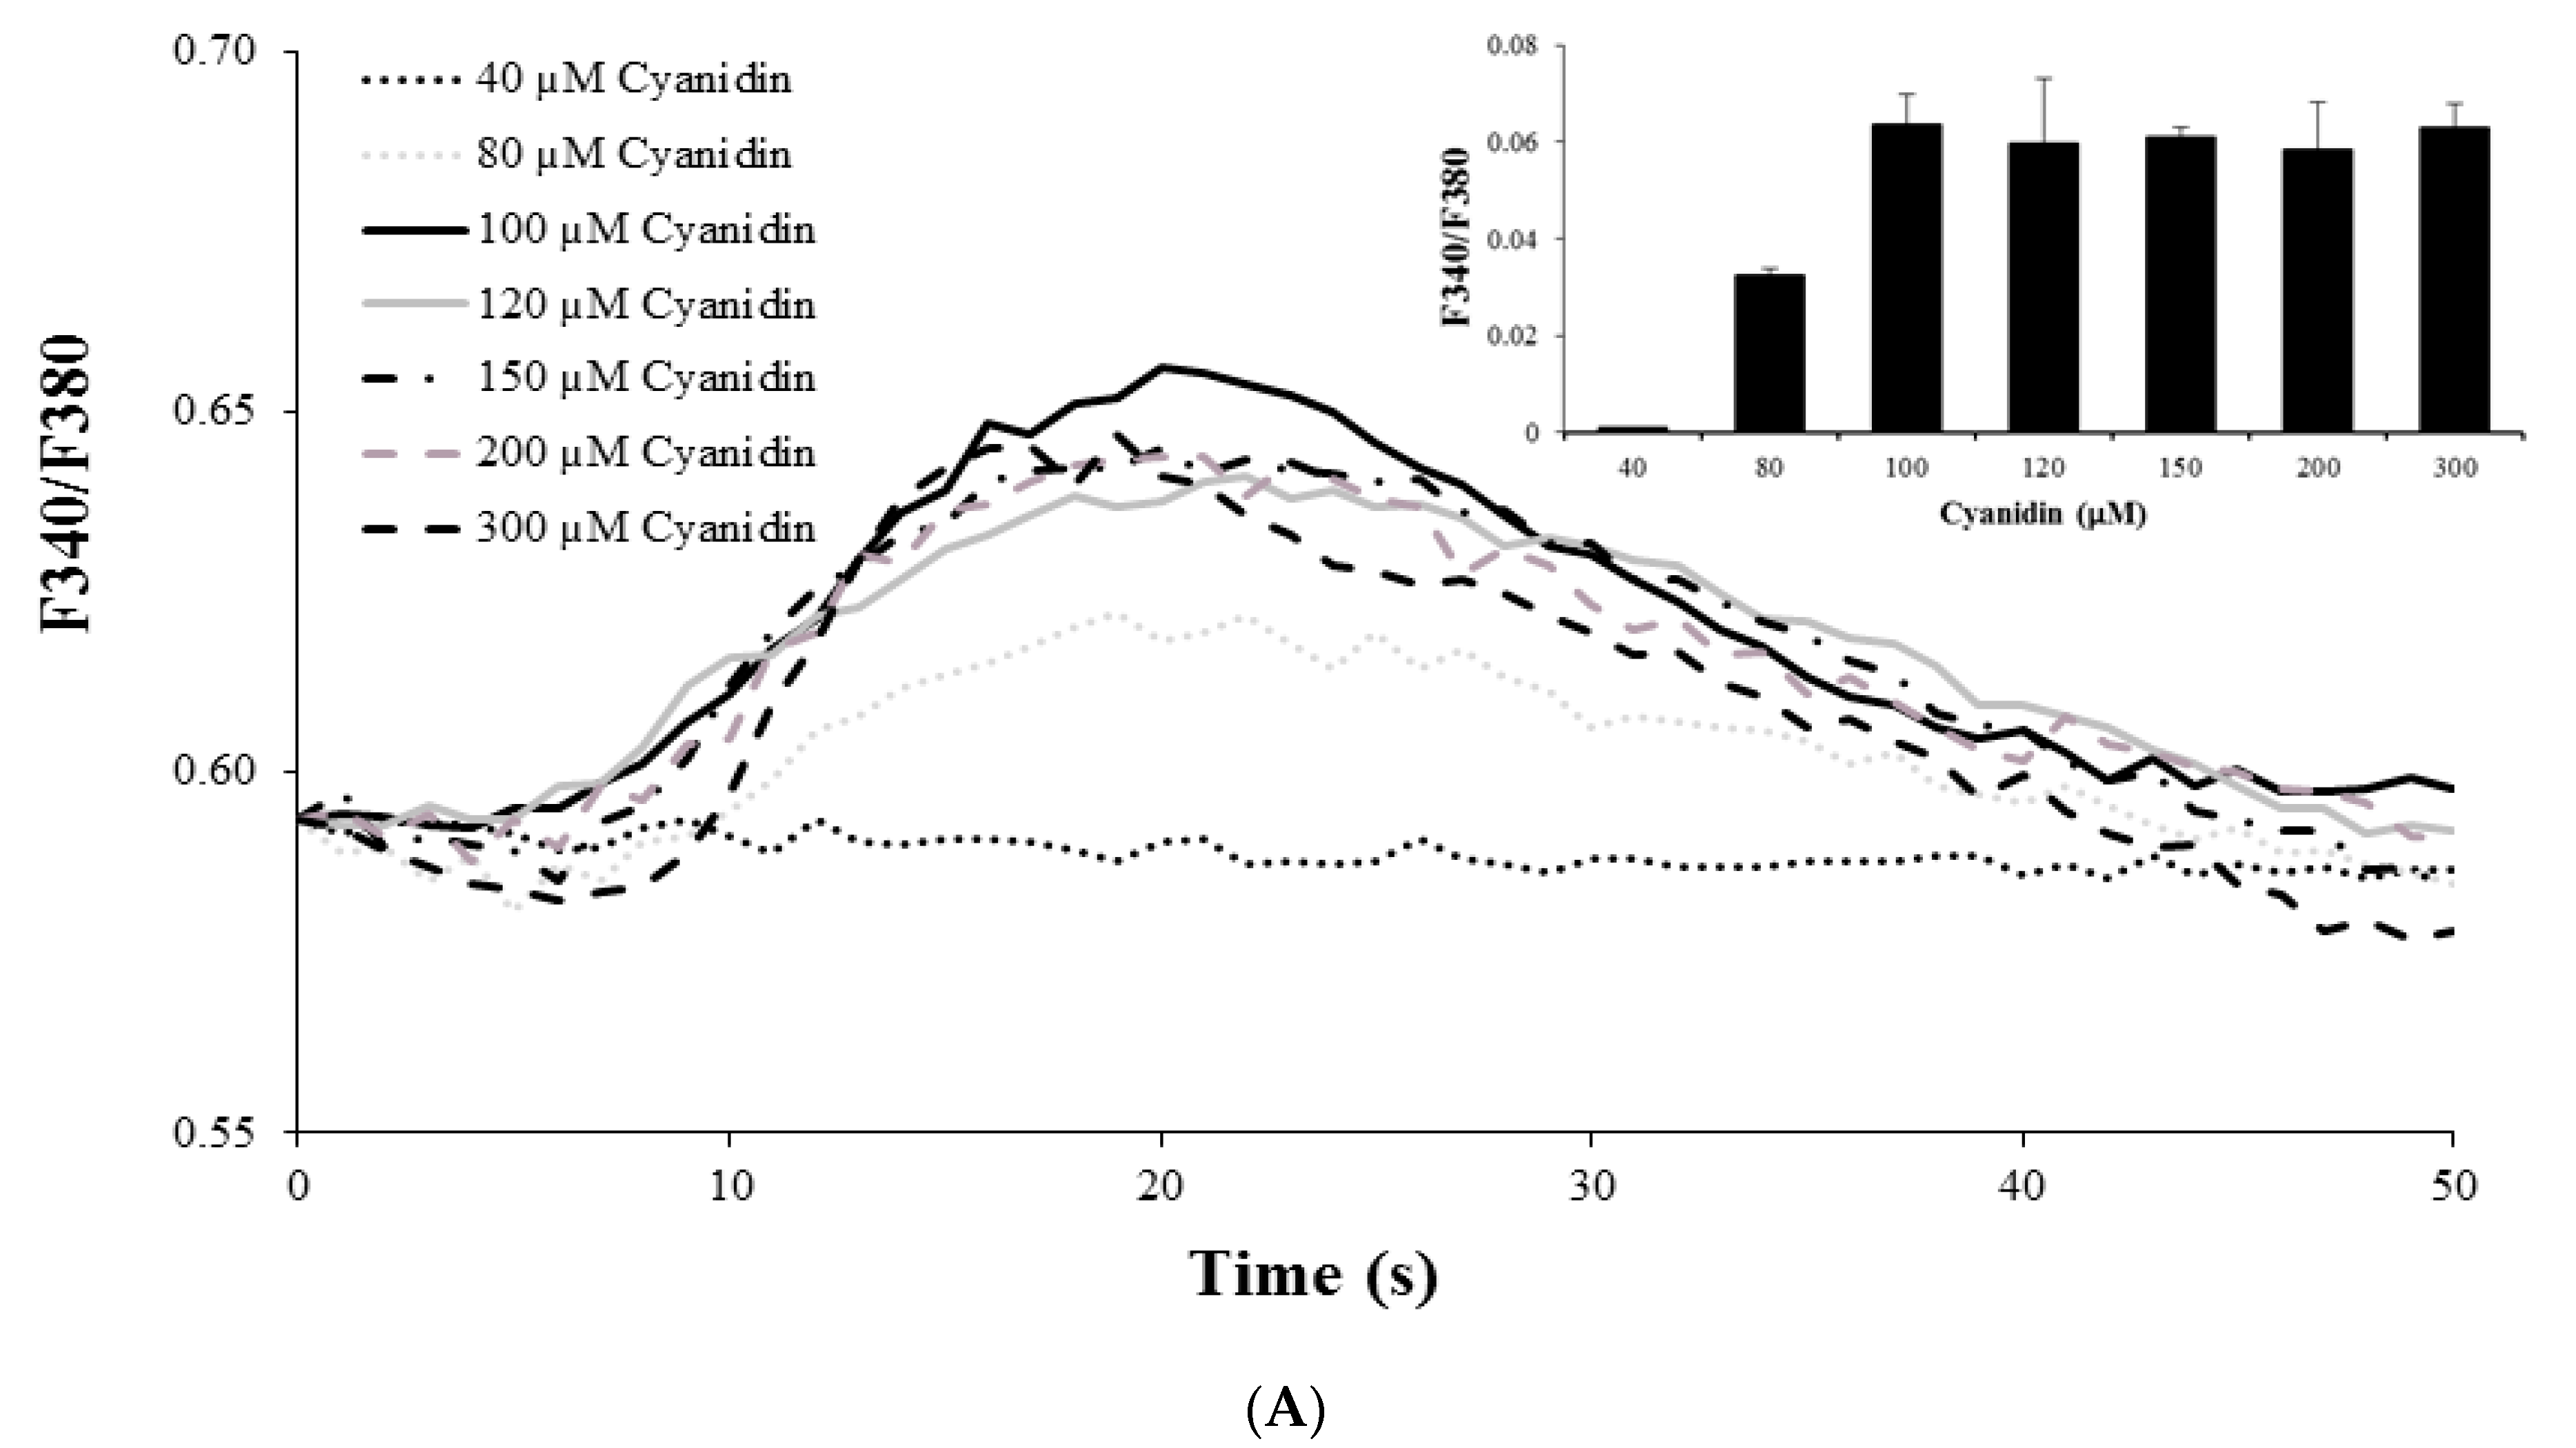
3.3. Cyanidin Increases Intracellular Ca2+ Concentration

Since elevations in intracellular Ca2+ are a requirement for insulin secretion, we examined whether cyanidin would induce Ca2+ signals. Stimulation of cells with cyanidin (80 to 300 µM) increased intracellular Ca2+ in a concentration-dependent manner (Figure 3A). The greatest increase was observed with 100 µM cyanidin. In comparison, cyanidin at 100 µM caused (33–35%) less Ca2+ increase than 2 μM ionomycin (Figure 3B). To investigate the Ca2+ sources for the cyanidin responses, experiments were performed under extracellular Ca2+ free conditions and/or after depletion of intracellular Ca2+ stores in the endoplasmic reticulum (ER). Removal of extracellular Ca2+ abolished the response to 100 µM cyanidin, but not after store depletion with thapsigarin, a Ca2+ ATPase pump inhibitor in the ER. Cyanidin also failed to increase intracellular Ca2+ under both Ca2+ free and store depletion conditions (Figure 3C).

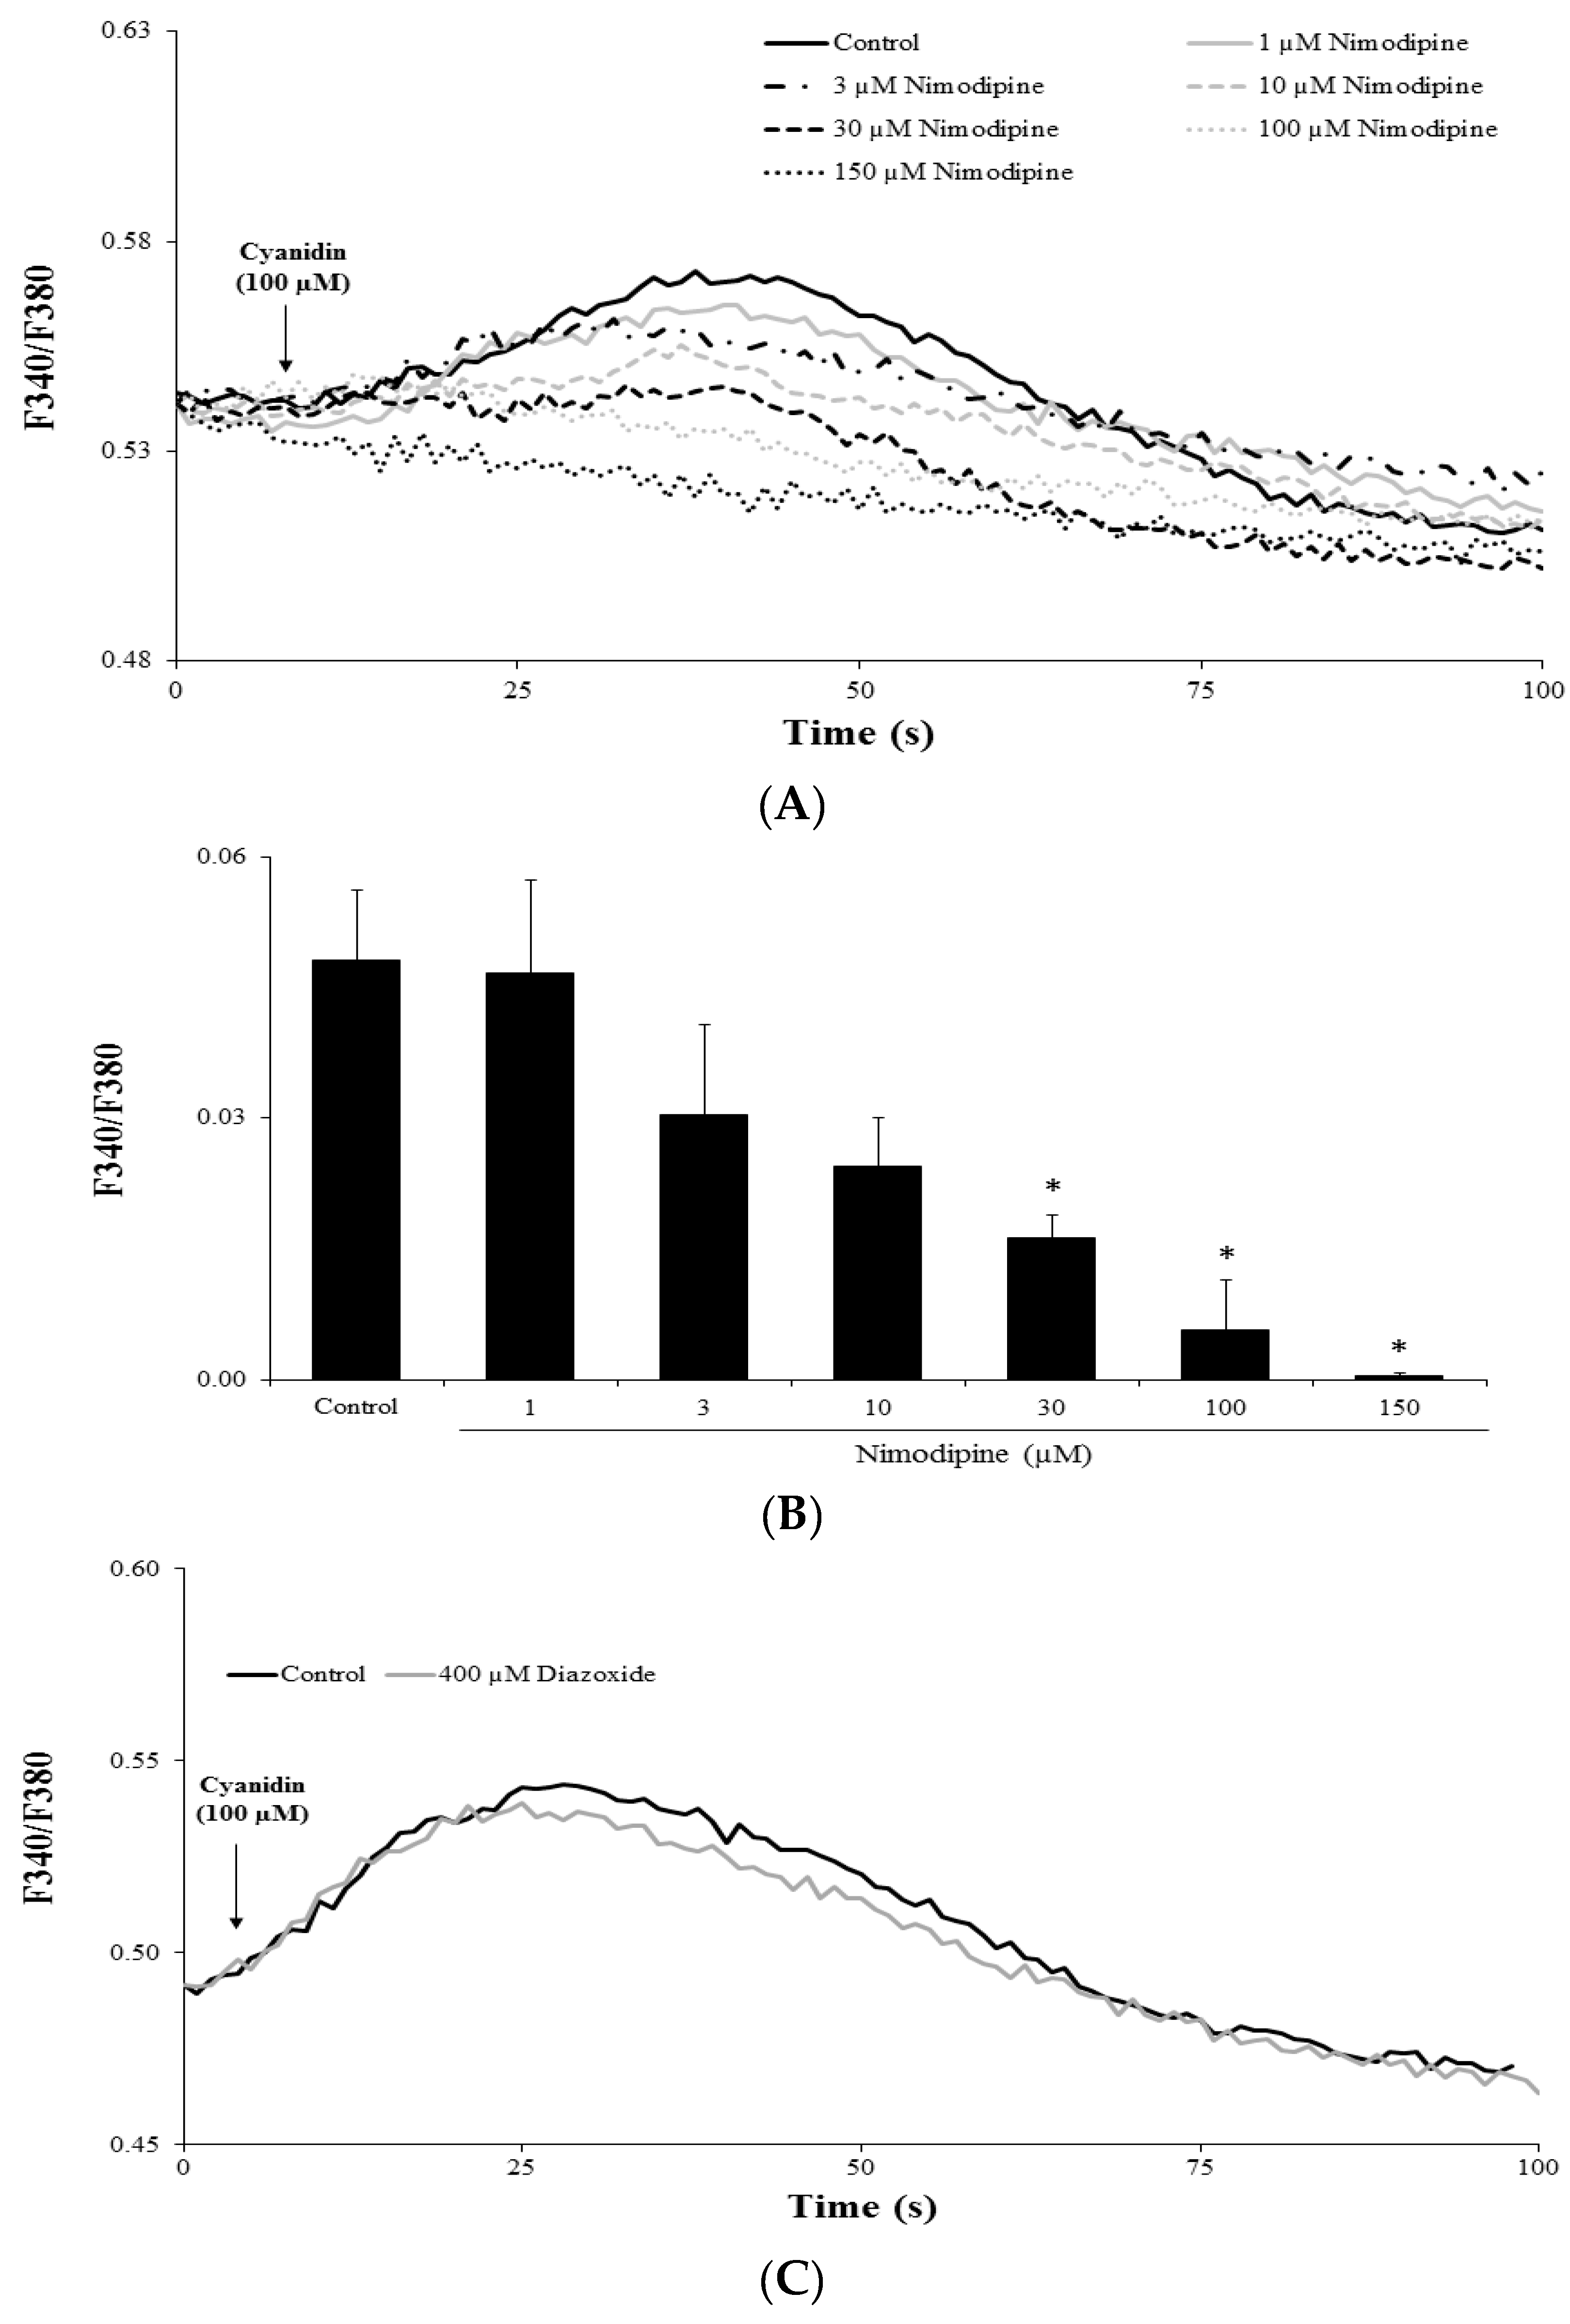
3.4. Cyanidin Increases Intracellular Ca2+ via l-Type Voltage-Dependent Ca2+ Channels

In pancreatic β-cells, VDCCs are responsible for extracellular Ca2+ influx. Hence, we performed experiments with the l-type Ca2+ channel blocker nimodipine to test whether this was the case for cyanidin. Pretreatment of cells with 30–150 µM nimodipine inhibited the cyanidin-induced Ca2+ increases in a concentration-dependent manner (Figure 4A,B). To exclude the effect of cyanidin on KATP channels, cells were pretreated with diazoxide, which opens this particular channel. As shown in Figure 4C, diazoxide failed to inhibit the Ca2+ signals.

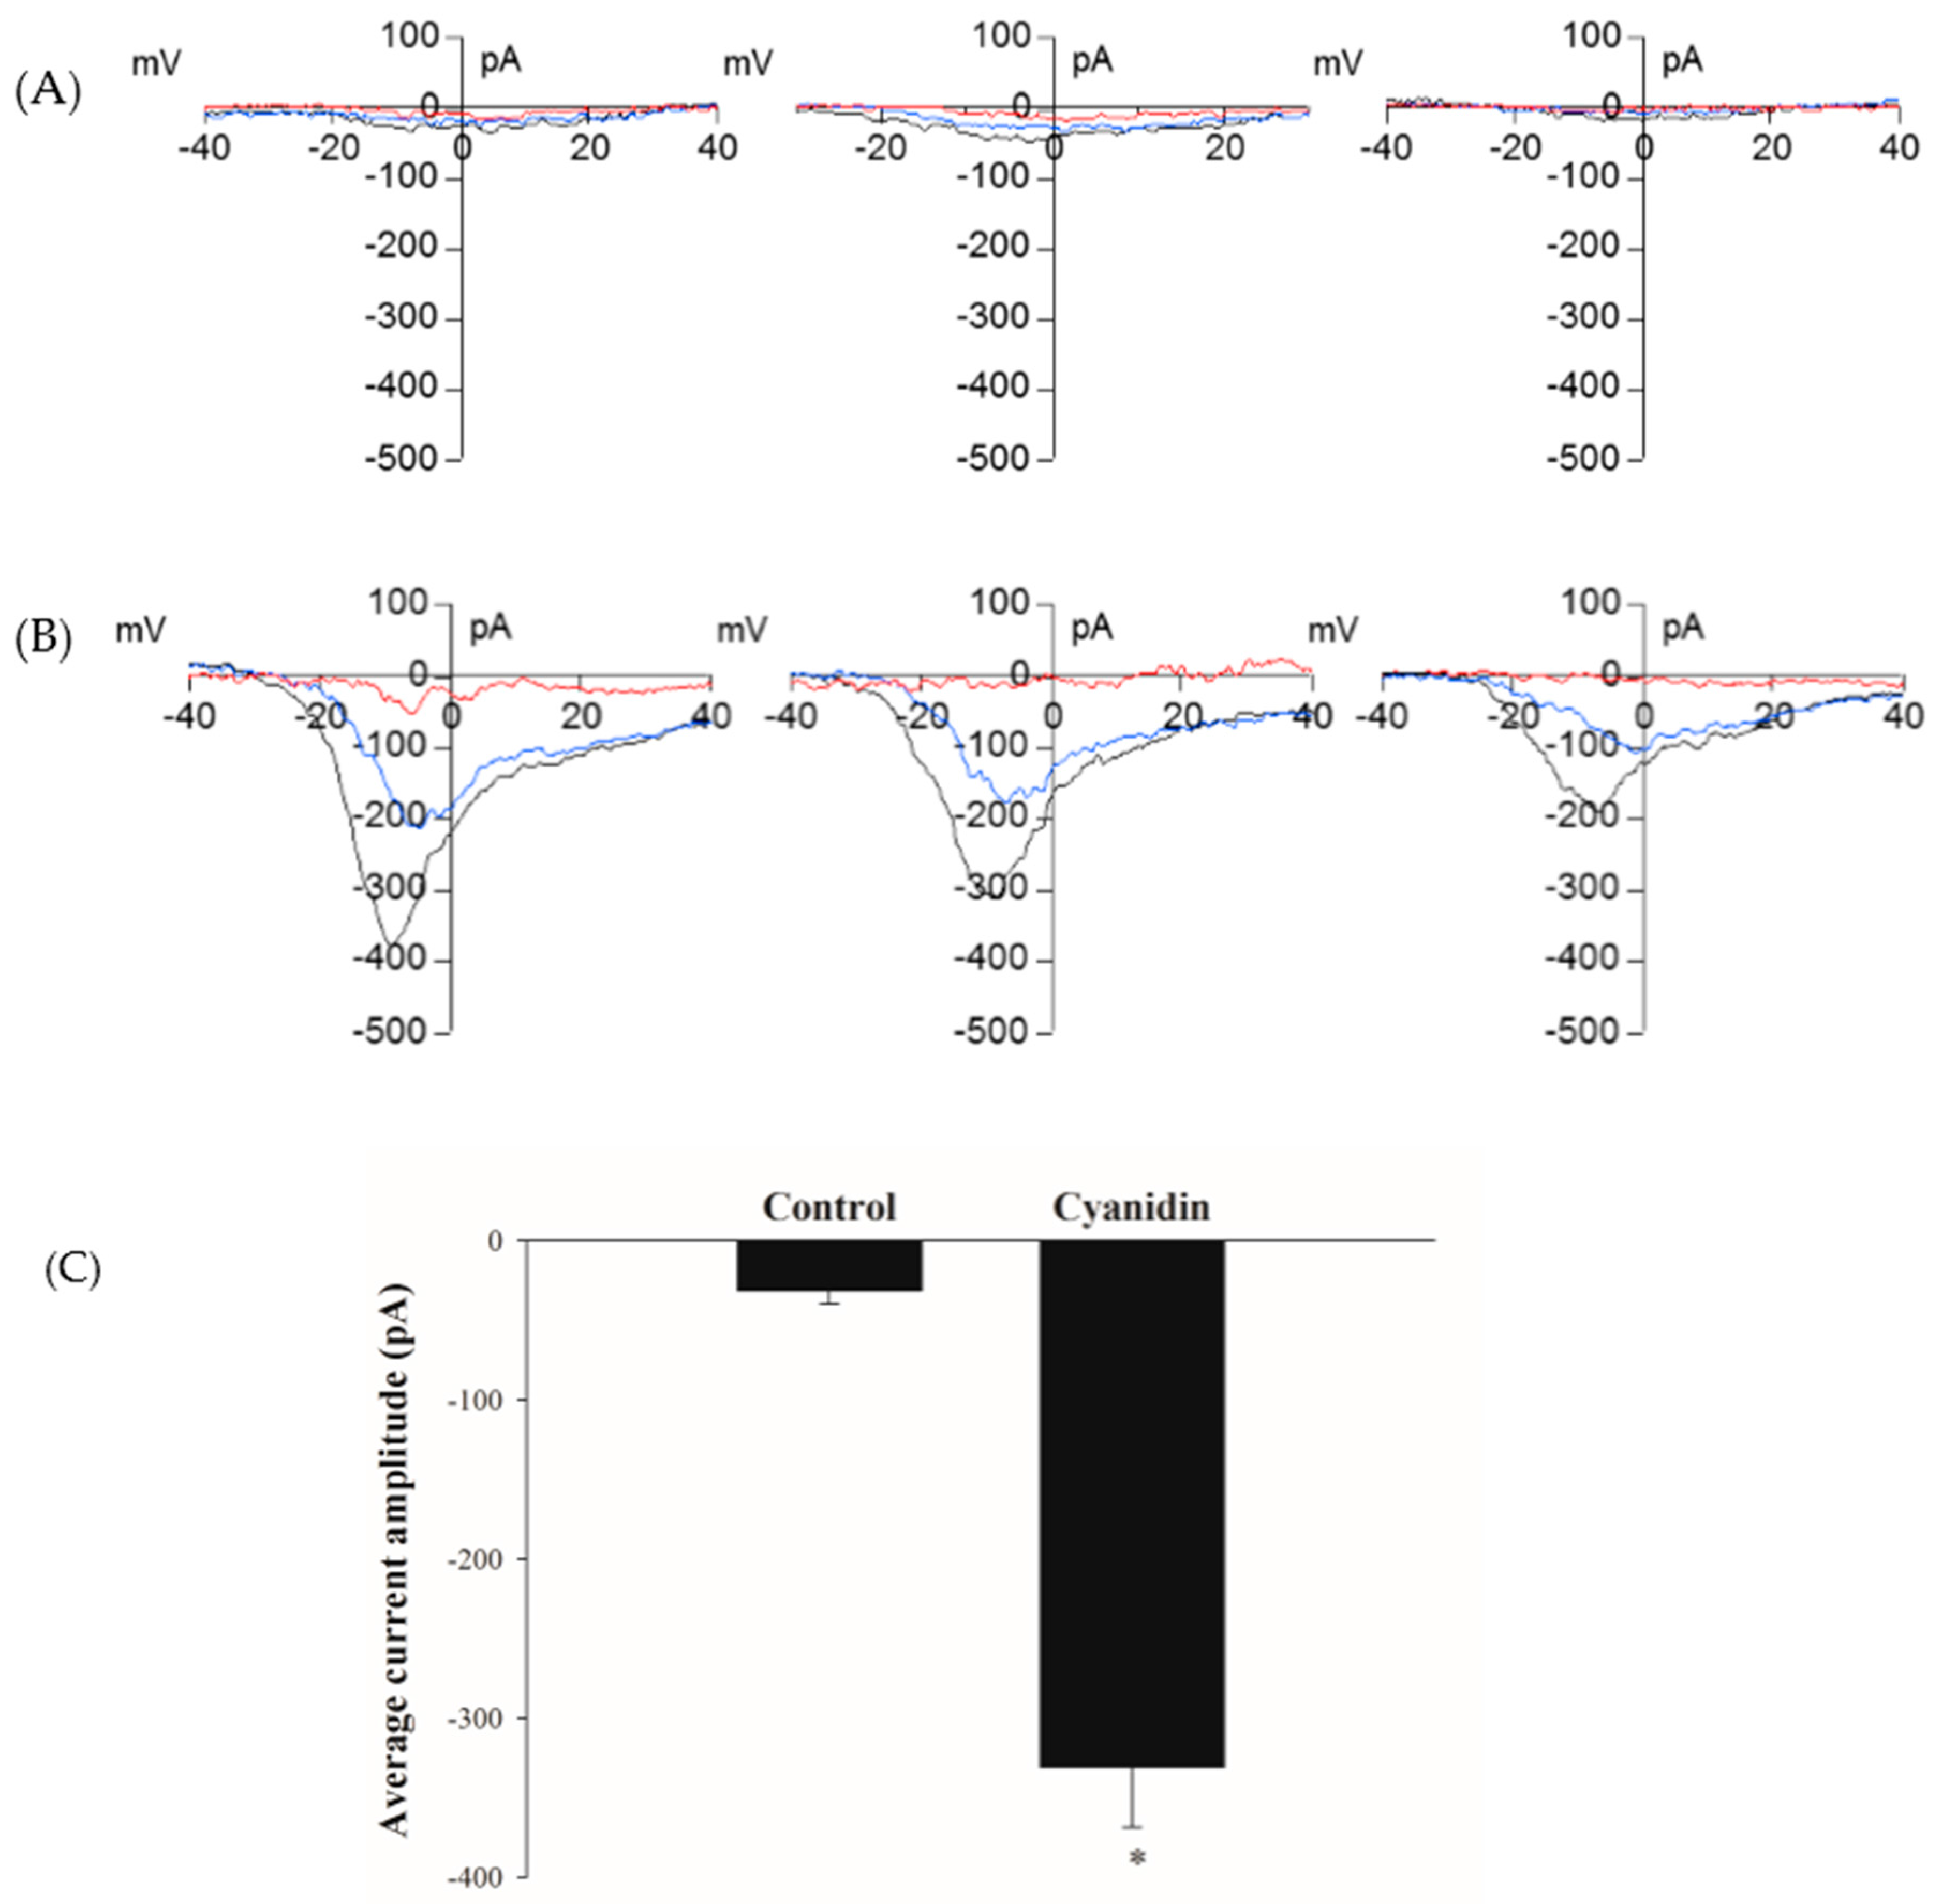
3.5. Cyanidin Directly Activates l-Type Voltage-Dependent Ca2+ Channels

The Ca2+ imaging experiments revealed that l-type VDCCs were responsible for the increase in intracellular Ca2+. Therefore, we tested whether it could activate these channels directly using the patch-clamp technique. Perfusion of single cells with 100 µM cyanidin in the pipette solution resulted in the development of currents with the characteristics of VDCCs, but not in control cells perfused with 0.1% DMSO (Figure 5A,B). The peak current amplitude obtained from control and cyanidin-treated cells are shown in Figure 5C.

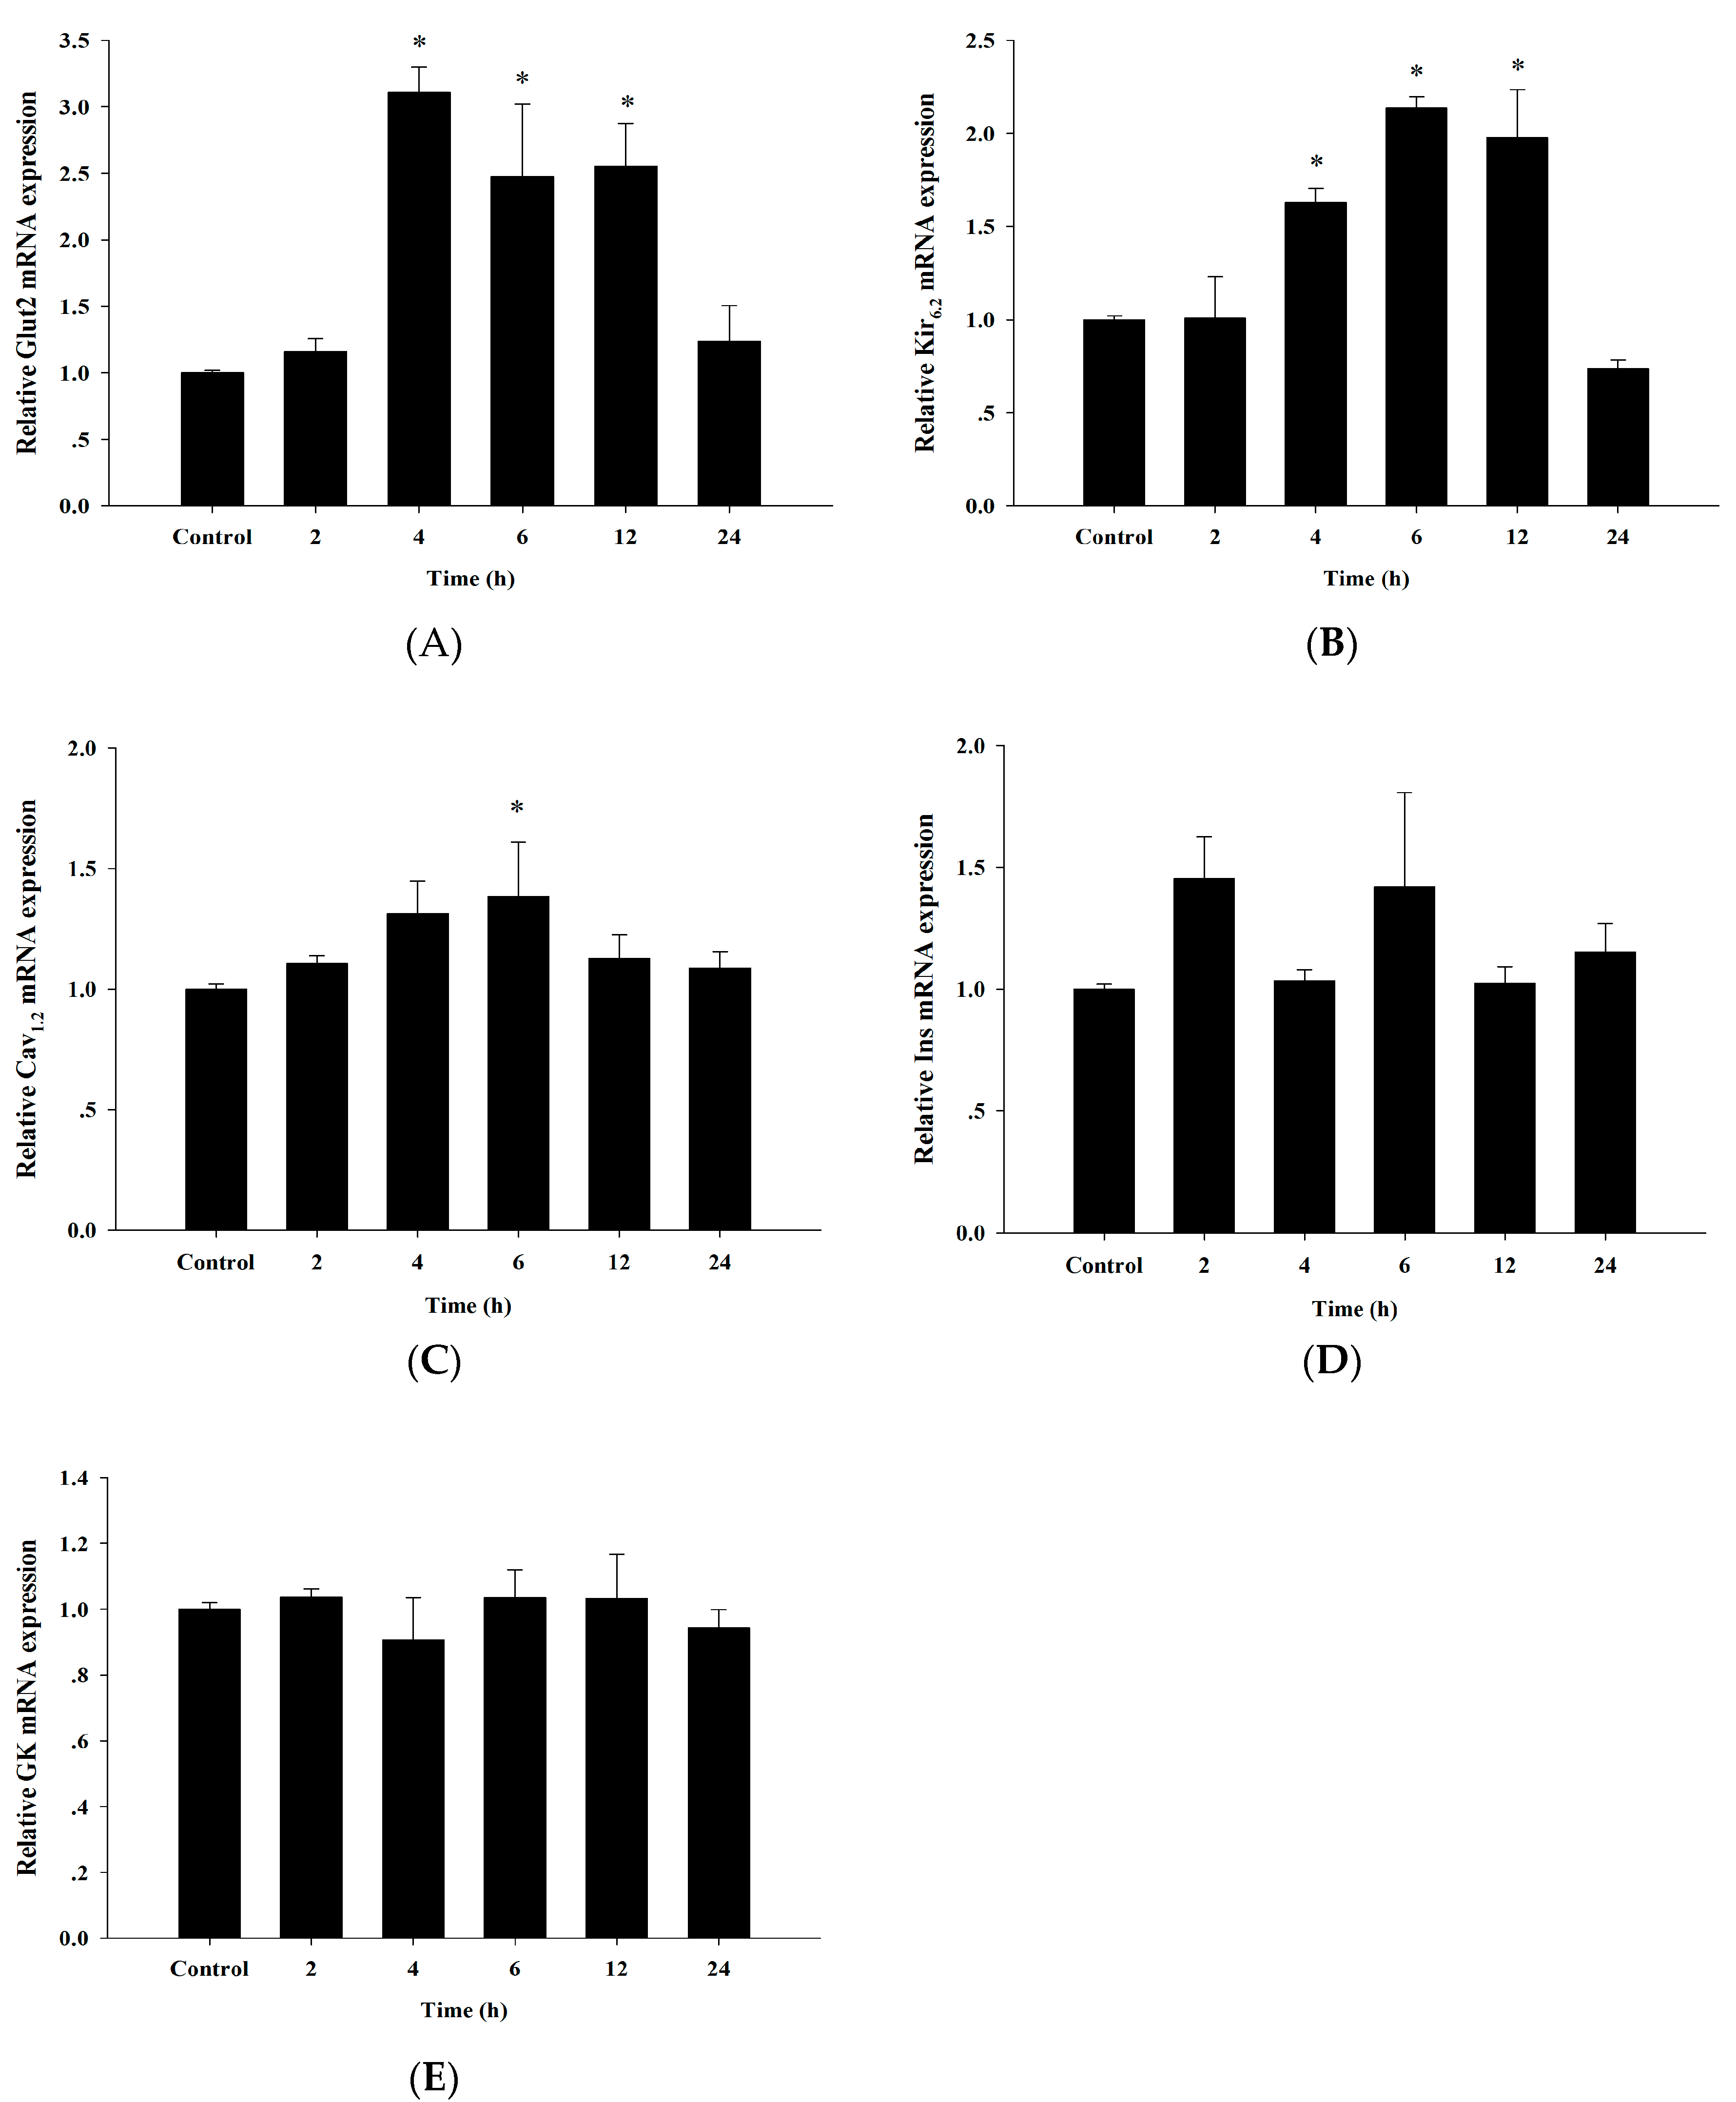
3.6. Up-Regulation of Insulin Secretion Genes by Cyanidin

In addition to insulin secretion, we tested whether cyanidin regulated the expression of genes involved in the glucose-induced insulin secretion response. This would suggest a potential role in this mechanism. Treatment of cells with 100 µM cyanidin for 2, 4, 6, 12, and 24 h up-regulated the expression of the GLUT2, Kir6.2, and Cav1.2 genes (Figure 6). However, cyanidin did not impact the expression of the Insulin and glucokinase genes.

4. Discussion

The insulin secreting activity of cyanidin has been demonstrated in pancreatic β-cells [16]. Our findings revealed that its mechanism of action is linked to intracellular Ca2+ signaling via l-type voltage-dependent Ca2+ channels. They are also consistent with reports of other flavonoids such as quercetin and quercetin-3-rutinoside (rutin) that stimulate insulin secretion using Ca2+ signaling [19,20]. Increases in intracellular Ca2+ can be due to influx across the plasma membrane and/or release from the ER [21]. Our results clearly showed that the increase in intracellular Ca2+ was due to influx, as store depletion did not alter the cyanidin response. Furthermore, the l-type VDCC blocker nimodipine abolished the Ca2+ signals to indicate the pathway for Ca2+ influx. In support of this finding, the patch-clamp data confirmed the activation of channels. The opening of l-type Ca2+ channels represents the final common pathway for insulin secretion in pancreatic β-cells. l-type Ca2+ channels comprise five subunits, including α1, α2, β, γ, and δ subunits [22]. It has been recognized that Bay K 8644, a calcium channel agonist, specially binds to l-type Ca2+ channel α1 subunits with high affinity [22]. Our findings are similar to those reported for quercetin which stimulates insulin secretion through activation of l-type VDCCs [19,23]. However, Bardy et al. suggest that quercetin interacts with the l-type Ca2+ channel at a different site from that of Bay K 8644, an l-type Ca2+ channel agonist [19]. Additional studies are required to ascertain the binding sites of cyanidin on the l-type Ca2+ channel. Other phytochemical compounds such a p-methoxycinnamic acid [24] stimulate insulin secretion by increasing Ca2+ influx through VDCCs. This mechanism now appears to be universal among the flavonoids. In our study, we also tested whether cyanidin functions as sulfonylureas, which induces the closure of KATP channels leading to membrane depolarization, Ca2+ influx, and insulin secretion [25]. We found that diazoxide, a KATP channel opener, did not impact the effect of cyanidin on Ca2+ signals which is in agreement with genistein [26] and p-methoxycinnamic acid [24]. Other data have shown the effect of cyanidin on glucose-induced insulin secretion in pancreatic β-cells (INS-1 823/13). It found that cyanidin at a concentration of 50 μg/mL enhanced glucose-induced insulin release at 10 mM glucose [16]. It suggests that cyanidin may improve pancreatic β-cells which defect in the response to insulin secretion to glucose.
In regard to its intracellular localization, flavonoids are absorbed into cells by passive diffusion and membrane transport [27]. We detected the presence of cyanidin in the cytosol of β-cells that is consistent with reports in HaCat human keratinocytes, human embryonic fibroblasts (NHF), uterine carcinoma (HeLa S3), and intestinal (CaCo-2) cells [20,28]. Quercetin enters Caco-2 cells and human embryonic kidney (HEK 293) cells through passive diffusion [29,30]. Faria et al. proposed that cyanidin-3-glucoside crosses the membrane of cerebral capillary endothelial (RBE-1) cells via glucose transporter-1 (GLUT1) [31]. It is hypothesized that hydrophilic flavonoid glucosides are transported across the membrane via glucose transporters, whereas passive diffusion of aglycone flavonoids occurs. It is possible that passive diffusion is involved in cellular uptake of cyanidin in pancreatic β-cells. Additional immunohistochemical stains together with Naturstoff reagent A might be required to identify the specific localization of cyanidin in the cells such as nucleus or plasma membrane l-type Ca2+ channel. Our gene expression analysis during cyanidin stimulation reports a down-regulation of genes associated with insulin secretion in diabetic animal models [32,33,34]. In this respect, chronic hyperglycemia leads to oxidative stress and gradual loss of pancreatic β-cell gene expression associated with impaired glucose-stimulated insulin secretion [35]. Administration of the glucose metabolite methylglyoxal reduces glucose uptake into β-cells due to down-regulation of the GLUT2 gene [36,37]. In regards to flavonoids, naringenin and quercetin increase GLUT2 gene expression to improve glucose-induced insulin secretion and glucose sensitivity [38]. In addition to GLUT2, the gene expression analysis during cyanidin stimulation demonstrated up-regulation of Kir6.2 and Cav1.2. The expression of Cav1.2 (a subunit of l-type VDCC) is crucial for insulin secretion because it promotes Ca2+ influx [39], whereas gene down-regulation reduces the glucose-induced secretion [40]. Our findings revealed that cyanidin activates VDCCs to promote Ca2+ influx, insulin secretion, and the expression of the Cav1.2 gene. The KATP channel comprises two subunits: the K+ inwardly rectifying (Kir6.2) and sulfonylurea receptor (SUR1). Hyperglycemia decreases Kir6.2 mRNA levels in rat pancreatic islets as well as in INS-1 cells [41] and reduces Ca2+ influx and insulin secretion from HIT-T15 cells [34]. Although cyanidin did not stimulate insulin secretion via the KATP dependent pathway, it might enhance glucose-induced insulin secretion by increasing Kir6.2 expression. Therefore, the up-regulation of genes controlled by cyanidin might be important to increase insulin sensitivity and insulin secretion. Further experiments are required to clarify the effect of cyanidin on these genes expression related to glucose-stimulated insulin secretion (GSIS) under dysfunction of pancreatic β-cells. Finally, there is accumulating evidence that cyanidin can stimulate insulin secretion [16], and inhibit protein glycation [15], intestinal α-glucosidase, and pancreatic α-amylase [11]. Our studies are consistent with other studies demonstrating that the concentration range of cyanidin (0.5–100 µM) exerted their preventive effects without noticeable toxicity in the cell line models [42,43,44]. However, plasma concentration of cyanidin and its derivatives can be detected in the low micromolar range [45]. At present, the aspects of bioavailability and the cellular concentration of cyanidin, especially in pancreatic β-cells, hepatocytes, and adipose tissue, are still not fully documented. To overcome bioavailability issues of cyanidin, encapsulation techniques might be a useful platform for the possible translation to clinical evaluation.

5. Conclusions

The results from our study revealed that cyanidin diffuses across the plasma membrane, leading to the activation of l-type VDCCs. This effect promotes Ca2+ influx which stimulates insulin secretion from pancreatic β-cells (Figure 7). Cyanidin also up-regulated the expression of the GLUT2, Kir6.2 and Cav1.2 genes that could have potential implications on glucose-induced insulin secretion, glucose homeostasis, and diabetes.

Acknowledgments

The authors wish to thank the RGJ-PhD program (PHD/0111/2556) supported by the Thailand Research Fund (TRF) and Chulalongkorn University. This research was supported by the Grant for International Research Integration: Chula Research Scholar, Ratchadaphiseksomphot Endowment Fund, Chulalongkorn University.

Author Contributions

T.S. was responsible for the study conception and design, acquisition, analysis and interpretation of data, drafting the manuscript. S.T.E. and W.H.H. performed the insulin radioimmunoassay and data analysis. S.Y. assisted with the design experiments and data analysis for Real-time PCR. H.C. and S.A. contributed a concept of writing, the experimental design, data analysis and helped to draft the manuscript. All authors read and approved the final manuscript.

Conflicts of Interest

The authors declare no conflict of interest.

Abbreviations

GLUT1Glucose transporter 1
GLUT2Glucose transporter 2
SUR1Sulfonylurea receptor
KATPATP-sensitive K+ channels
VDCCsVoltage-dependent Ca2+ channels
MGMethylglyoxal
Fura-2AMFura-2 acetoxymethyl ester
KRBKrebs-Ringer bicarbonate buffer
RIARadioimmunoassay
Vhholding potential
GKGlucokinase
Cav1.2l-type Ca2+ channel
InsInsulin
I/VCurrent–voltage relationship
EREndoplasmic reticulum
RutinQuercetin-3-rutinoside

References

  1. Kahn, S. The relative contributions of insulin resistance and beta-cell dysfunction to the pathophysiology of type 2 diabetes. Diabetologia 2003, 46, 3–19. [Google Scholar] [CrossRef] [PubMed]
  2. Gembal, M.; Gilon, P.; Henquin, J.C. Evidence that glucose can control insulin release independently from its action on ATP-sensitive K+ channels in mouse B cells. J. Clin. Investig. 1992, 89, 1288–1295. [Google Scholar] [CrossRef] [PubMed]
  3. Prentki, M.; Nolan, C.J. Islet β cell failure in type 2 diabetes. J. Clin. Investig. 2006, 116, 1802–1812. [Google Scholar] [CrossRef] [PubMed]
  4. Eurich, D.T.; Simpson, S.H.; Majumdar, S.R.; Johnson, J.A. Secondary failure rates associated with metformin and sulfonylurea therapy for type 2 diabetes mellitus. Pharmacotherapy 2005, 25, 810–816. [Google Scholar] [CrossRef] [PubMed]
  5. Youl, E.; Bardy, G.; Magous, R.; Cros, G.; Sejalon, F.; Virsolvy, A.; Richard, S.; Quignard, J.F.; Gross, R.; Petit, P.; et al. Quercetin potentiates insulin secretion and protects INS-1 pancreatic β-cells against oxidative damage via the ERK1/2 pathway. Br. J. Pharmacol. 2010, 161, 799–814. [Google Scholar] [CrossRef] [PubMed]
  6. Li, W.; Zheng, H.; Bukuru, J.; De Kimpe, N. Natural medicines used in the traditional Chinese medical system for therapy of diabetes mellitus. J. Ethnopharmacol. 2004, 92, 1–21. [Google Scholar] [CrossRef] [PubMed]
  7. Yibchok-Anun, S.; Adisakwattana, S.; Yao, C.Y.; Sangvanich, P.; Roengsumran, S.; Hsu, W.H. Slow acting protein extract from fruit pulp of Momordica charantia with insulin secretagogue and insulinomimetic activities. Biol. Pharm. Bull. 2006, 29, 1126–1131. [Google Scholar] [CrossRef] [PubMed]
  8. Galvano, F.; La Fauci, L.; Lazzarino, G.; Fogliano, V.; Ritieni, A.; Ciappellano, S.; Battistini, N.C.; Tavazzi, B. Cyanidins: Metabolism and biological properties. J. Nutr. Biochem. 2004, 15, 2–11. [Google Scholar] [CrossRef] [PubMed]
  9. Fukumoto, L.; Mazza, G. Assessing antioxidant and prooxidant activities of phenolic compounds. J. Agric. Food Chem. 2000, 48, 3597–3604. [Google Scholar] [CrossRef] [PubMed]
  10. Chao, P.Y.; Huang, Y.P.; Hsieh, W.B. Inhibitive effect of purple sweet potato leaf extract and its components on cell adhesion and inflammatory response in human aortic endothelial cells. Cell. Adhes. Migr. 2013, 7, 237–245. [Google Scholar] [CrossRef]
  11. Akkarachiyasit, S.; Charoenlertkul, P.; Yibchok-anun, S.; Adisakwattana, S. Inhibitory activities of cyanidin and its glycosides and synergistic effect with acarbose against intestinal α-glucosidase and pancreatic α-amylase. Int. J. Mol. Sci. 2010, 11, 3387–3396. [Google Scholar] [CrossRef] [PubMed]
  12. Nizamutdinova, I.T.; Jin, Y.C.; Chung, J.I.; Shin, S.C.; Lee, S.J.; Seo, H.G.; Lee, J.H.; Chang, K.C.; Kim, H.K. The anti-diabetic effect of anthocyanins in streptozotocin-induced diabetic rats through glucose transporter 4 regulation and prevention of insulin resistance and pancreatic apoptosis. Mol. Nutr. Food Res. 2009, 53, 1419–1429. [Google Scholar] [CrossRef] [PubMed]
  13. Park, S.; Kang, S.; Jeong, D.Y.; Jeong, S.Y.; Park, J.J.; Yun, H.S. Cyanidin and malvidin in aqueous extracts of black carrots fermented with Aspergillus oryzae prevent the impairment of energy, lipid and glucose metabolism in estrogen-deficient rats by AMPK activation. Genes Nutr. 2015, 10, 1–14. [Google Scholar] [CrossRef] [PubMed]
  14. Seymour, E.M.; Tanone, I.I.; Urcuyo-Llanes, D.E.; Lewis, S.K.; Kirakosyan, A.; Kondoleon, M.G.; Kaufman, P.B.; Bolling, S.F. Blueberry intake alters skeletal muscle and adipose tissue peroxisome proliferator-activated receptor activity and reduces insulin resistance in obese rats. J. Med. Food 2011, 14, 1511–1518. [Google Scholar] [CrossRef] [PubMed] [Green Version]
  15. Suantawee, T.; Cheng, H.; Adisakwattana, S. Protective effect of cyanidin against glucose-and methylglyoxal-induced protein glycation and oxidative DNA damage. Int. J. Biol. Macromol. 2016, 93, 814–821. [Google Scholar] [CrossRef] [PubMed]
  16. Jayaprakasam, B.; Vareed, S.K.; Olson, L.K.; Nair, M.G. Insulin secretion by bioactive anthocyanins and anthocyanidins present in fruits. J. Agric. Food Chem. 2005, 53, 28–31. [Google Scholar] [CrossRef] [PubMed]
  17. Elhabiri, M.; Figueiredo, P.; Fougerousse, A.; Brouillard, R. A convenient method for conversion of flavonols into anthocyanins. Tetrahedron Lett. 1995, 36, 4611–4614. [Google Scholar] [CrossRef]
  18. Ernst, I.; Wagner, A.; Lipinski, S.; Skrbek, S.; Ruefer, C.E.; Desel, C.; Rimbach, G. Cellular uptake, stability, visualization by ‘Naturstoff reagent A’, and multidrug resistance protein 1 gene-regulatory activity of cyanidin in human keratinocytes. Pharmacol. Res. 2010, 61, 253–258. [Google Scholar] [CrossRef] [PubMed]
  19. Bardy, G.; Virsolvy, A.; Quignard, J.F.; Ravier, M.A.; Bertrand, G.; Dalle, S.; Cros, D.; Magous, R.; Richard, S.; Oiry, C. Quercetin induces insulin secretion by direct activation of l-type calcium channels in pancreatic beta cells. Br. J. Pharmacol. 2013, 169, 1102–1113. [Google Scholar] [CrossRef] [PubMed]
  20. Kappel, V.D.; Frederico, M.J.; Postal, B.G.; Mendes, C.P.; Cazarolli, L.H.; Silva, F.R.M.B. The role of calcium in intracellular pathways of rutin in rat pancreatic islets: Potential insulin secretagogue effect. Eur. J. Pharmacol. 2013, 702, 264–268. [Google Scholar] [CrossRef] [PubMed]
  21. Kawano, S.; Shoji, S.; Ichinose, S.; Yamagata, K.; Tagami, M.; Hiraoka, M. Characterization of Ca(2+) signaling pathways in human mesenchymal stem cells. Cell Calcium 2002, 32, 165–174. [Google Scholar] [CrossRef] [PubMed]
  22. Hofmann, F.; Lacinova, L.; Klugbauer, N. Voltage-dependent calcium channels: From structure to function. Rev. Physiol. Biochem. Pharmacol. 1999, 139, 33–87. [Google Scholar] [PubMed]
  23. Kittl, M.; Beyreis, M.; Tumurkhuu, M.; Fuerst, J.; Helm, K.; Pitschmann, A.; Gaisberger, M.; Glasl, S.; Ritter, M.; Jakab, M. Quercetin stimulates insulin secretion and reduces the viability of rat INS-1 beta-Cells. Cell. Physiol. Biochem. 2016, 39, 278–293. [Google Scholar] [CrossRef] [PubMed]
  24. Adisakwattana, S.; Hsu, W.; Yibchok-anun, S. Mechanisms of p-methoxycinnamic acid-induced increase in insulin secretion. Horm. Metab. Res. 2011, 43, 766–773. [Google Scholar] [CrossRef] [PubMed]
  25. Ammälä, C.; Moorhouse, A.; Ashcroft, F. The sulphonylurea receptor confers diazoxide sensitivity on the inwardly rectifying K+ channel Kir6.1 expressed in human embryonic kidney cells. J. Physiol. 1996, 494, 709–714. [Google Scholar] [CrossRef] [PubMed]
  26. Fu, Z.; Liu, D. Long-term exposure to genistein improves insulin secretory function of pancreatic β-cells. Eur. J. Pharmacol. 2009, 616, 321–327. [Google Scholar] [CrossRef] [PubMed]
  27. Gonzales, G.B.; Van Camp, J.; Vissenaekens, H.; Raes, K.; Smagghe, G.; Grootaert, C. Review on the use of cell cultures to study metabolism, transport, and accumulation of flavonoids: From mono-cultures to co-culture systems. Compr. Rev. Food Sci. Food Saf. 2015, 14, 741–754. [Google Scholar] [CrossRef]
  28. Lazzè, M.C.; Savio, M.; Pizzala, R.; Cazzalini, O.; Perucca, P.; Scovassi, A.I.; Stivala, L.A.; Bianchi, L. Anthocyanins induce cell cycle perturbations and apoptosis in different human cell lines. Carcinogenesis 2004, 25, 1427–1433. [Google Scholar] [CrossRef] [PubMed]
  29. Chabane, M.N.; Ahmad, A.A.; Peluso, J.; Muller, C.D.; Ubeaud-Séquier, G. Quercetin and naringenin transport across human intestinal Caco-2 cells. J. Pharm. Pharmacol. 2009, 61, 1473–1483. [Google Scholar] [CrossRef]
  30. Glaeser, H.; Bujok, K.; Schmidt, I.; Fromm, M.F.; Mandery, K. Organic anion transporting polypeptides and organic cation transporter 1 contribute to the cellular uptake of the flavonoid quercetin. Naunyn-Schmiedebergs Arch. Pharmacol. 2014, 387, 883–891. [Google Scholar] [CrossRef] [PubMed]
  31. Faria, A.; Pestana, D.; Teixeira, D.; Azevedo, J.; Freitas, D.V.; Mateus, N.; Calhau, C. Flavonoid transport across RBE4 cells: A blood-brain barrier model. Cell. Mol. Biol. Lett. 2010, 15, 234–241. [Google Scholar] [CrossRef] [PubMed]
  32. Bonny, C.; Roduit, R.; Gremlich, S.; Nicod, P.; Thorensb, B.; Waebera, G. The loss of GLUT2 expression in the pancreatic β-cells of diabetic db/db mice is associated with an impaired DNA-binding activity of islet-specific trans-acting factors. Mol. Cell. Endocrinol. 1997, 135, 59–65. [Google Scholar] [PubMed]
  33. Orci, L.; Ravazzola, M.; Baetens, D.; Inman, L.; Amherdt, M.; Peterson, R.G.; Newgard, C.B.; Johnson, J.H.; Unger, R.H. Evidence that down-regulation of beta-cell glucose transporters in non-insulin-dependent diabetes may be the cause of diabetic hyperglycemia. Proc. Natl. Acad. Sci. USA 1990, 87, 9953–9957. [Google Scholar] [PubMed]
  34. Chen, F.; Zheng, D.; Xu, Y.; Luo, Y.; Li, H.; Yu, K.; Song, Y.; Zhong, W.; Ji, Y. Down-regulation of Kir6.2 affects calcium influx and insulin secretion in HIT-T15 cells. J. Pediatr. Endocrinol. Metab. 2010, 23, 709–717. [Google Scholar] [PubMed]
  35. Cernea, S.; Dobreanu, M. Diabetes and beta cell function: From mechanisms to evaluation and clinical implications. Biochem. Medica 2013, 23, 266–280. [Google Scholar]
  36. Dhar, A.; Dhar, I.; Jiang, B.; Desai, K.M.; Wu, L. Chronic methylglyoxal infusion by minipump causes pancreatic β-cell dysfunction and induces type 2 diabetes in Sprague-Dawley rats. Diabetes 2011, 60, 899–908. [Google Scholar] [CrossRef] [PubMed]
  37. Lee, B.H.; Hsu, W.H.; Chang, Y.Y.; Kuo, H.F.; Hsu, Y.W.; Pan, T.M. Ankaflavin: A natural novel PPARγ agonist upregulates Nrf2 to attenuate methylglyoxal-induced diabetes in vivo. Free Radic. Biol. Med. 2012, 53, 2008–2016. [Google Scholar] [CrossRef] [PubMed]
  38. Bhattacharya, S.; Oksbjerg, N.; Young, J.; Jeppesen, P. Caffeic acid, naringenin and quercetin enhance glucose-stimulated insulin secretion and glucose sensitivity in INS-1E cells. Diabetes Obes. Metab. 2014, 16, 602–612. [Google Scholar] [CrossRef] [PubMed]
  39. Velasco, M.; Díaz-García, C.M.; Larqué, C.; Hiriart, M. Modulation of ionic channels and insulin secretion by drugs and hormones in pancreatic beta cells. Mol. Pharmacol. 2016, 90, 341–357. [Google Scholar] [CrossRef] [PubMed]
  40. Nitert, M.D.; Nagorny, C.L.; Wendt, A.; Eliasson, L.; Mulder, H. CaV1.2 rather than CaV1.3 is coupled to glucose-stimulated insulin secretion in INS-1 832/13 cells. J. Mol. Endocrinol. 2008, 41, 1–11. [Google Scholar] [CrossRef] [PubMed]
  41. Moritz, W.; Leech, C.A.; Ferrer, J.; Habener, J.F. Regulated expression of adenosine triphosphate-sensitive potassium channel subunits in pancreatic β-cells. Endocrinology 2001, 142, 129–138. [Google Scholar] [CrossRef] [PubMed]
  42. Oak, M.H.; Bedoui, J.; Madeira, S.F.; Chalupsky, K.; Schini-Kerth, V. Delphinidin and cyanidin inhibit PDGFAB-induced VEGF release in vascular smooth muscle cells by preventing activation of p38 MAPK and JNK. Br. J. Pharmacol. 2006, 149, 283–290. [Google Scholar] [CrossRef] [PubMed]
  43. Jia, Y.; Hoang, M.H.; Jun, H.J.; Lee, J.H.; Lee, S.J. Cyanidin, a natural flavonoid, is an agonistic ligand for liver X receptor alpha and beta and reduces cellular lipid accumulation in macrophages and hepatocytes. Bioorganic Med. Chem. Lett. 2013, 23, 4185–4190. [Google Scholar] [CrossRef] [PubMed]
  44. Jia, Y.; Kim, J.Y.; Jun, H.J.; Kim, S.J.; Kim, S.J.; Lee, J.H.; Hoang, M.H.; Kim, H.S.; Chang, H.I.; Hwang, K.Y.; et al. Cyanidin is an agonistic ligand for peroxisome proliferator-activated receptor-alpha reducing hepatic lipid. Biochim. Biophys. Acta 2013, 1831, 698–708. [Google Scholar] [CrossRef] [PubMed]
  45. Galvano, F.; La Fauci, L.; Vitaglione, P.; Fogliano, V.; Vanella, L.; Felgines, C. Bioavailability, antioxidant and biological properties of the natural free-radical scavengers cyanidin and related glycosides. Ann. Ist. Super. Sanita 2006, 43, 382–393. [Google Scholar]
Figure 1. Localization of cyanidin in INS-1 cells. Confocal laser scanning microscopy after treatment of cells with 100 µM cyanidin for 10 min followed by Naturstoff reagent A showed the diffusion into the intracellular space.
Nutrients 09 00814 g001
Figure 2. Treatment of INS-1 cells with 1–300 µM cyanidin increased insulin secretion. Results are expressed as mean ± S.E.M. from the three independent experiments; * p < 0.05 when compared with basal.
Nutrients 09 00814 g002
Figure 3. (A) Stimulation of cells with 40–300 µM cyanidin increased intracellular Ca2+ in a concentration-dependent manner; (B) 100 µM Cyanidin resulted in a 33–35% increase in intracellular Ca2+ compared to 2 µM ionomycin; (C) Removal of extracellular Ca2+ abolished the effect of cyanidin, but not after endoplasmic reticulum (ER) store depletion with thapsigargin. Under extracellular Ca2+ free and store depletion conditions, the cyanidin response is also abolished. Results are presented as average traces or mean + S.E.M.; n = 89–162 cells/group from the three independent experiments; * p < 0.05 when compared with the control.
Nutrients 09 00814 g003aNutrients 09 00814 g003b
Figure 4. Voltage-dependent Ca2+ channels mediate the effect of cyanidin. (A,B) Pretreatment of cells with the l-type Ca2+ channel blocker nimodipine (1–100 µM) inhibited the intracellular Ca2+ signals by cyanidin in a concentration-dependent manner; (C) Pretreatment of cells with 400 µM diazoxide, a KATP activator, failed to inhibit the responses to cyanidin. Results are presented as average traces or mean + S.E.M.; n = 91–174 cells per group from the three independent experiments. * p < 0.05 when compared with the control.
Nutrients 09 00814 g004
Figure 5. Cyanidin activates voltage-dependent Ca2+ channels. (A) Representative current–voltage relationships (I/V) from single cells perfused with control DMSO; (B) Representative current–voltage relationships (I/V) from single cells perfused with 100 µM cyanidin. The red (at break-in), blue (during), and black (fully developed) lines represent the current development; (C) Average inward peak current amplitude from control and 100 µM cyanidin groups. Results are represented as mean – S.E.M. (n = 24–31 cells/group). * p < 0.05 when compared with the control.
Nutrients 09 00814 g005
Figure 6. Effect of cyanidin on the mRNA levels of insulin secretion genes including Glut2; Glucose transporter 2 (A), Kir6.2; Potassium channel 6.2; (B), Cav1.2; Voltage-dependent Ca2+ channel 1.2; (C), Ins; Insulin; (D), and GK; Glucokinase; (E). All data normalized to β-actin expression. Results are expressed as mean ± S.E.M. from the three independent experiments; * p < 0.05 when compared with the control.
Nutrients 09 00814 g006
Figure 7. Proposed diagram for the mechanism of action of cyanidin. In pancreatic β-cells, cyanidin diffuses across the plasma membrane, leading to the activation of l-type VDCCs. Consequently, it promotes Ca2+ influx which stimulates insulin secretion. The increases in intracellular Ca2+ also up-regulate the expression of the GLUT2, Kir6.2 and Cav1.2 genes.
Nutrients 09 00814 g007

