Trans Fat Intake and Its Dietary Sources in General Populations Worldwide: A Systematic Review


1
Unilever R & D Vlaardingen, 3133 AT Vlaardingen, The Netherlands
2
Department of Health Sciences, Faculty of Earth & Life Sciences, Vrije Universiteit Amsterdam, Amsterdam Public Health Research Institute, 1081 HV Amsterdam, The Netherlands
*
Author to whom correspondence should be addressed.
Nutrients 2017, 9(8), 840; https://doi.org/10.3390/nu9080840
Submission received: 3 June 2017
/
Revised: 28 July 2017
/
Accepted: 31 July 2017
/
Published: 5 August 2017
Abstract
:After the discovery that trans fat increases the risk of coronary heart disease, trans fat content of foods have considerably changed. The aim of this study was to systematically review available data on intakes of trans fat and its dietary sources in general populations worldwide. Data from national dietary surveys and population studies published from 1995 onward were searched via Scopus and websites of national public health institutes. Relevant data from 29 countries were identified. The most up to date estimates of total trans fat intake ranged from 0.3 to 4.2 percent of total energy intake (En%) across countries. Seven countries had trans fat intakes higher than the World Health Organization recommendation of 1 En%. In 16 out of 21 countries with data on dietary sources, intakes of trans fat from animal sources were higher than that from industrial sources. Time trend data from 20 countries showed substantial declines in industrial trans fat intake since 1995. In conclusion, nowadays, in the majority of countries for which data are available, average trans fat intake is lower than the recommended maximum intake of 1 En%, with intakes from animal sources being higher than from industrial sources. In the past 20 years, substantial reductions in industrial trans fat have been achieved in many countries.
1. Introduction
Trans fats are found in foods originating from ruminant animals, such as cows and sheep, and are found in foods containing partially hydrogenated vegetable oils (PHVO). Animal trans fat levels can comprise up to 6% of a product’s fat content in ruminant foods, and industrial trans fat levels can comprise up to 60% of a product's fat content in foods containing PHVO. The discovery of adverse effects on the blood cholesterol profile and the increased risk of coronary heart disease of industrial trans fat [1,2,3,4,5] have led to public health recommendations to lower total trans fat intake to below 1% of total energy intake (En%), primarily by the removal of industrial trans fat [6]. Subsequent voluntary initiatives, trans fat labelling measures and regulatory limits have led to reductions in industrial trans fat, although not in all foods and countries [7,8].
Earlier studies showed that over the past two decades, both the voluntary and regulatory measures to lower industrial trans fat content of foods have resulted in significant reductions in global trans fat intakes [9,10,11,12]. In 1995, the TRANSFAIR study showed that in most Western European countries, the intakes of total trans fat were already below 1 En%. This study also showed that in the majority of the countries, trans fat primarily came from animal sources [13]. However, across countries, large differences exist in the intakes of trans fat. In 2010, estimated intakes varied from 0.2 to 6.5 En% worldwide [10]. At present, many countries actively work on measures to further lower industrial trans fat levels in foods [7,14,15].
Up-to-date data on global trans fat intakes, and its dietary sources are relevant for the development of public health measures and to monitor their effectiveness. Therefore, this study aimed to provide an up-to-date review of intakes of trans fat and its dietary sources in general populations worldwide. A secondary aim was to quantify trans fat and saturated fat levels in biscuits, a food that can nowadays still be relatively high in trans fat, to serve as a marker for the presence of industrial trans fat in countries for which no population dietary intake data are available [16].
2. Materials and Methods
2.1. Search Strategy
We conducted a broad, systematic search strategy to identify dietary intake studies. Peer reviewed papers, reports and grey literature on trans fat intake in countries and regions in any language published after 1995 were considered for inclusion. First, Scopus was searched through 29 May 2017 with the following search terms: “diet” AND “survey” AND (“trans fat” or “trans fatty acids”). In addition, all references reporting trans fat intake from two recent publications on global fat intake were screened [10,17]. Additionally, for each national survey that was identified, earlier and later editions were hand searched through Scopus and Google, and national intake data were checked via the websites of national public health institutes (Supplemental Figure S1). Methods of the analysis and inclusion criteria were not documented in a registered review protocol.
We determined eligibility of all publications and reports based on the following inclusion criteria: (1) national survey or population-based study; (2) trans fat intake measured by food composition data or new analytical data; (3) published after 1995; (4) data from the general adult population; and (5) reporting either the calendar year of the dietary survey or of the food composition data. For countries with multiple datasets, we included all data published after 1995.
For our secondary research question aiming to quantify trans fat and saturated fat levels in biscuits, we conducted a search on Scopus with the elements: “trans fat” AND “composition”. All identified publications were screened to determine eligibility based on the following inclusion criteria: (1) random sampling of biscuits or cookies; (2) new analytical data measured by gas chromatography; (3) published after 2005; (4) reporting both trans fat and saturated fat composition.
2.2. Data Extraction and Analysis
From publications or reports that met the inclusion criteria, one investigator extracted the following information: country, type and year of dietary intake survey, type and year of food composition data, age group (19–64 years-or the nearest age), sample size, mean, standard deviation (SD), and 95th percentile of total trans fat intake (g/day and En%), trans fat intake from animal sources (%) and industrial sources (%), and reported local measures to lower trans fat intake (voluntary, mandatory, and year).
Where total trans fat intake was reported both as fatty acids and as fat, we used fatty acids. Where trans fat intake was not reported in either g/day or En%, intakes in these units were calculated using reported energy intake and the energy content of dietary fat of 9 kcal/g. Where data were reported for subgroups (for example by gender), a weighted mean for the total population was calculated by weighing the mean intake of each subgroup by the number of the subjects in this subgroup.
“Animal sources” of trans fat were defined as milk, cheese, eggs, meat, fish, butter, and “industrial sources” of trans fat were defined as oils and fats, biscuits, pizza, grains, seeds, nuts, chocolate, soups, savory snacks, meals, and restaurant foods. In specific publications and reports, clustered food items could contain both animal and industrial sources of trans fat. We regarded these food items an industrial source of trans fat. Examples were butter being clustered in a “fats and oils” food group, and ice-cream being categorized in a “sweet snacks” food group.
The included data were assessed and scored on quality using four criteria: type of survey data (maximum score of 3), dietary assessment method (maximum score of 3), type of food composition data (maximum score of 3), and sample size (maximum score of 2) [18] (Supplemental Table S1). The total attainable score of a study ranged between 4 and 11. Based on the score, three quality categories were defined: high quality (score of 10–11), medium quality (score of 8–9), low quality (score of 4–7).
For dietary intake data, mean population intakes per country were compared to the recommended intake level of less than 1 En% as determined by the Food and Agriculture Organization (FAO)/World Health Organization (WHO) [6]. For biscuit data, mean trans fat levels were compared to the Danish regulatory limit of less than 2 g per 100 g total fat.
3. Results
The systematic search in Scopus and in references from available publications on global fat intake [10,17] identified 265 publications. After screening, 27 publications were judged eligible for inclusion in the review. Additional hand searching resulted in 16 eligible publications. A flow-chart and reasons for exclusion are given in Supplemental Figure S1. The 43 eligible publications included 64 datasets representing 29 countries (Table 1). One study representing trans fat intakes in Costa Rica [19], was exempted from exclusion. This study should have been excluded as it reported data for adolescents, and not adults. It was decided to be included in the study in the review because it reported repeated measurements of trans fat intakes over time, which was considered to be of sufficient importance to deviate from the inclusion criteria.
The most up-to-date estimates of population total trans fat intake ranged from 0.3 to 4.2 percent of energy intake (En%). In 22 out of 29 (76%) countries mean trans fat intake was below the WHO recommendation of 1 En% (Figure 1). At the time of the survey, Brazil (2008/09), Canada (2008), Costa Rica (2006), Iran (2004), Lebanon (2006), Puerto Rico (2010) and USA (2009/10) reported trans fat intakes above 1 En%. In 16 out of 21 (76%) countries with data on trans fat sources, mean intakes of animal trans fat were higher than that of industrial trans fat. Industrial trans fat intake was higher in Brazil (2008/09), China (2011), Iran (2004), Poland (2009/10) and USA (2009/10).
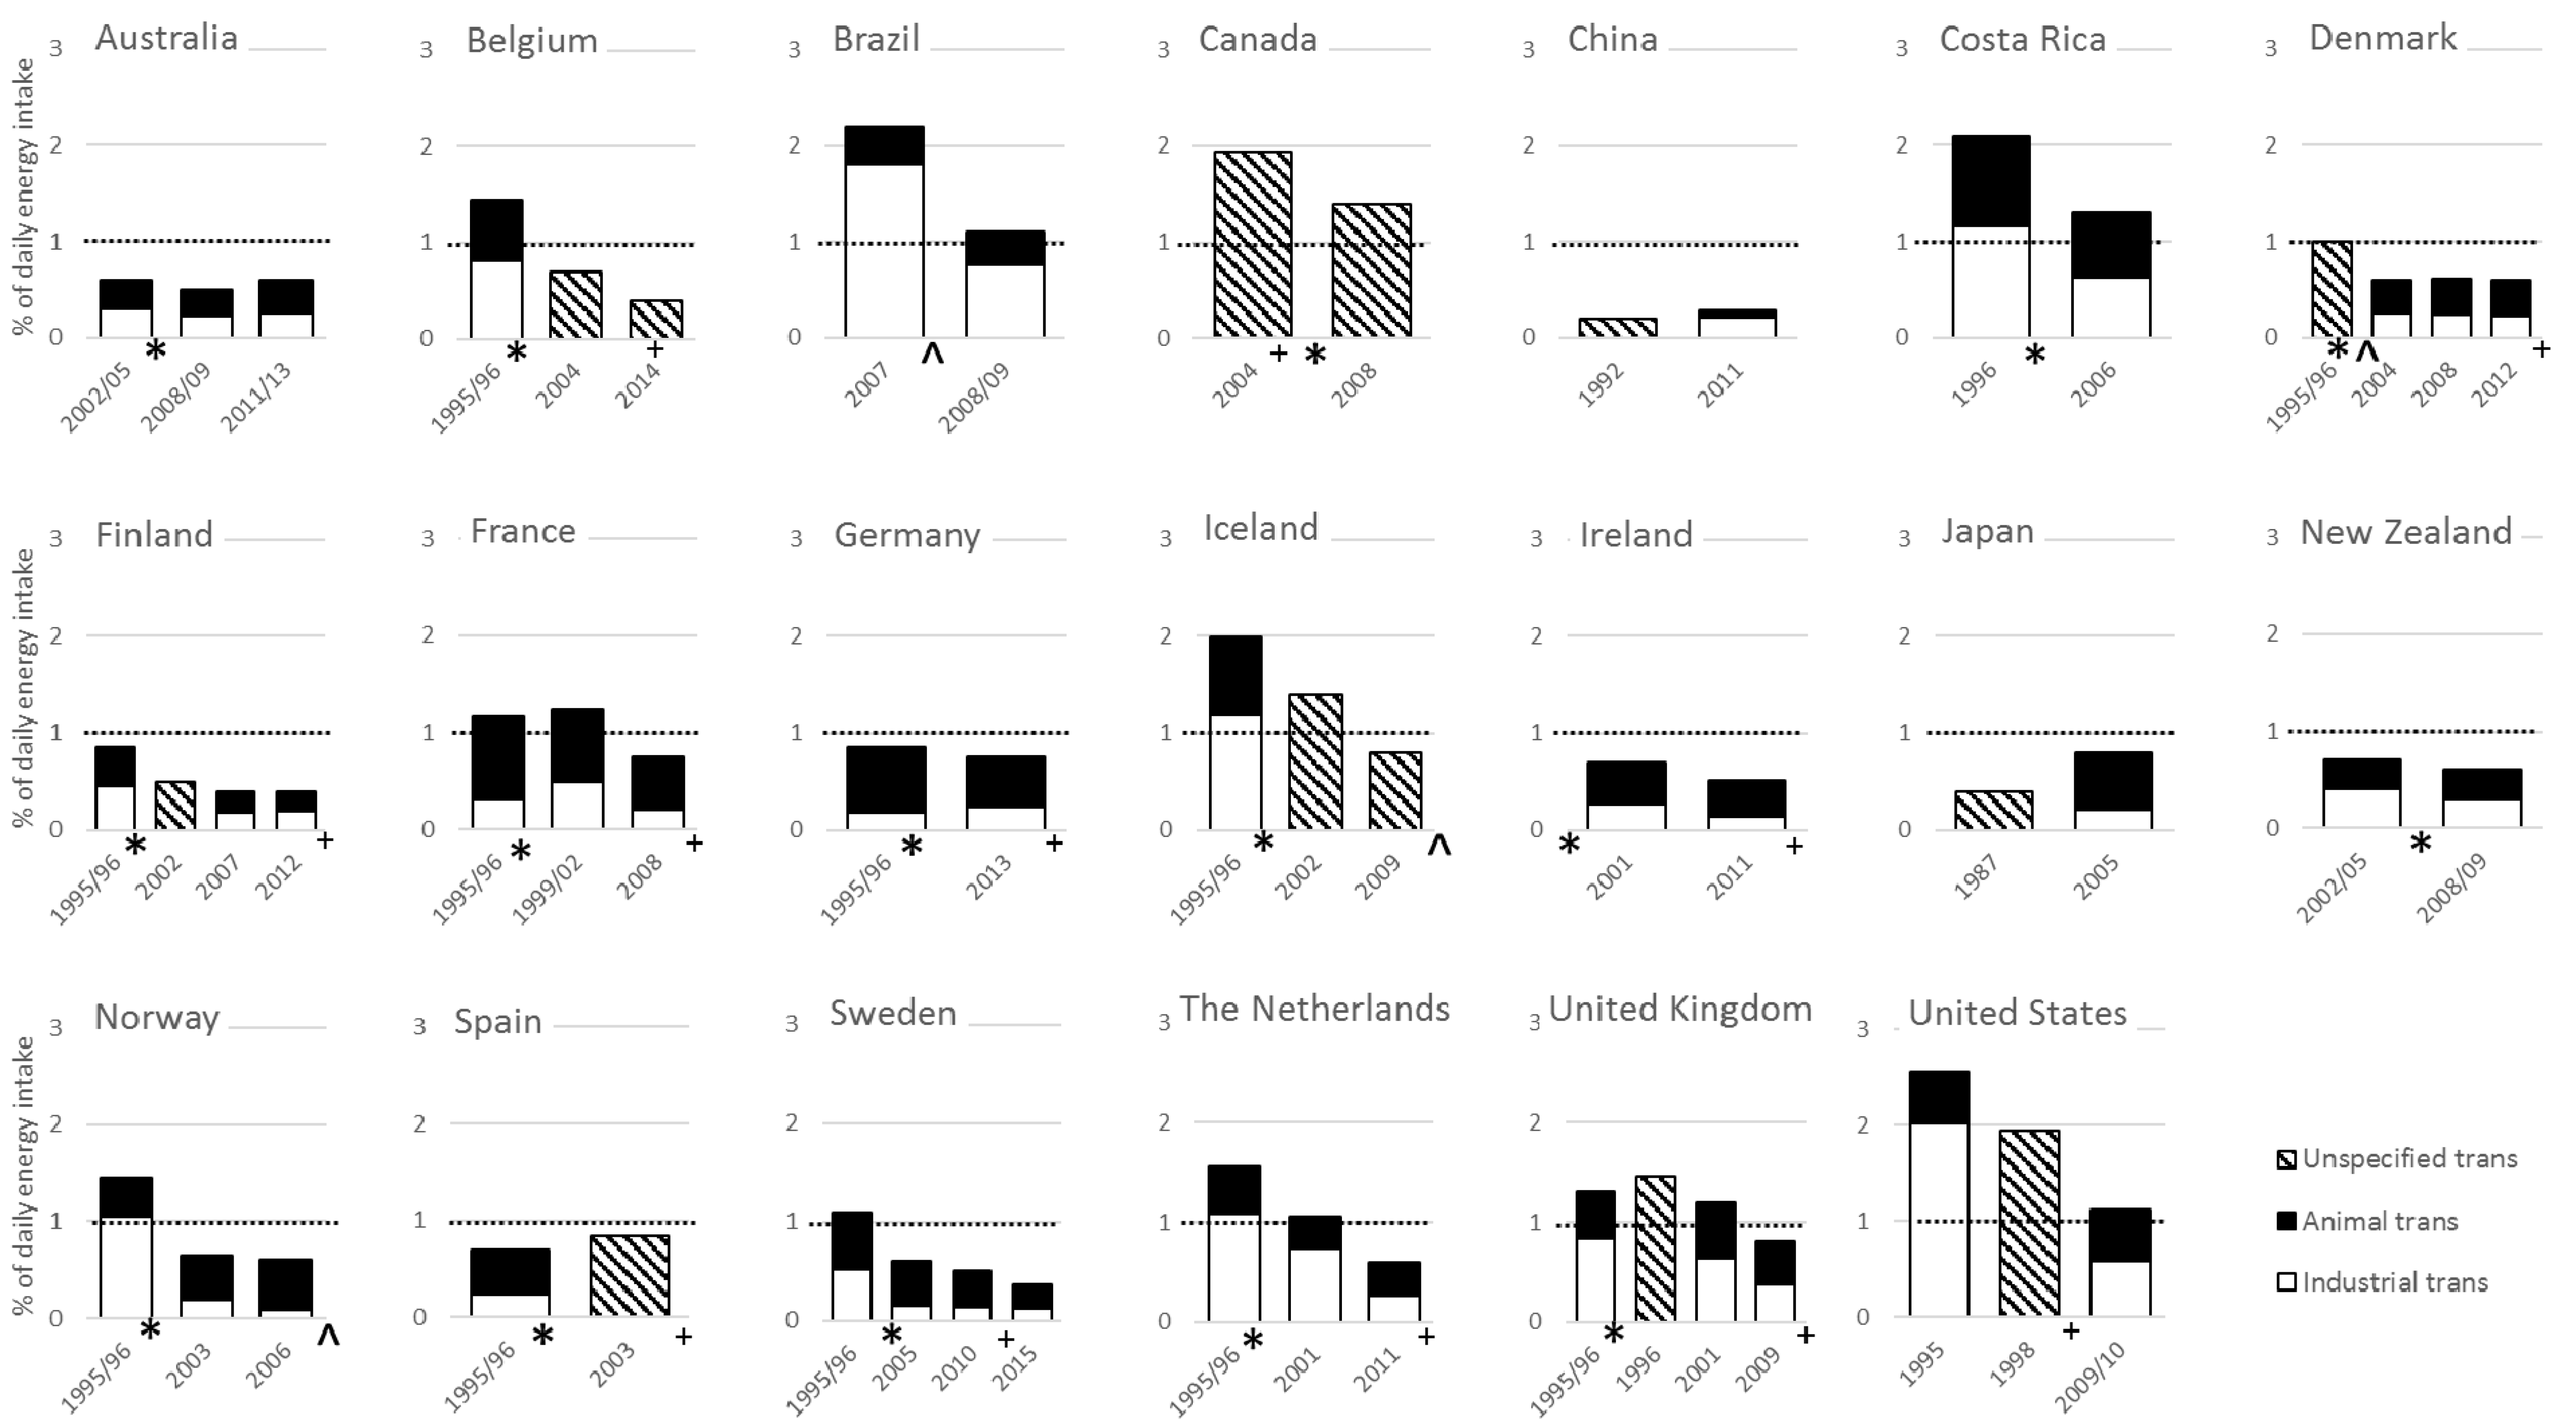
For 20 countries we found multiple surveys over time so that time trends could be made (Figure 2). These time trends showed substantial declines in trans fat intake over the past two decades. In seven countries, mean intakes decreased from above 1 En% to below 1 En%. Nine countries had trans fat intakes that were already equal or below 1 En% at the time of the first survey, and in four countries trans fat intake did not decrease to below 1 En%. The largest reductions were seen in industrial trans fat intake, although in several countries also trans fat from animal sources reduced. The introduction of voluntary or mandatory measures to lower trans fat in foods were associated with reductions in trans fat intakes in many countries.
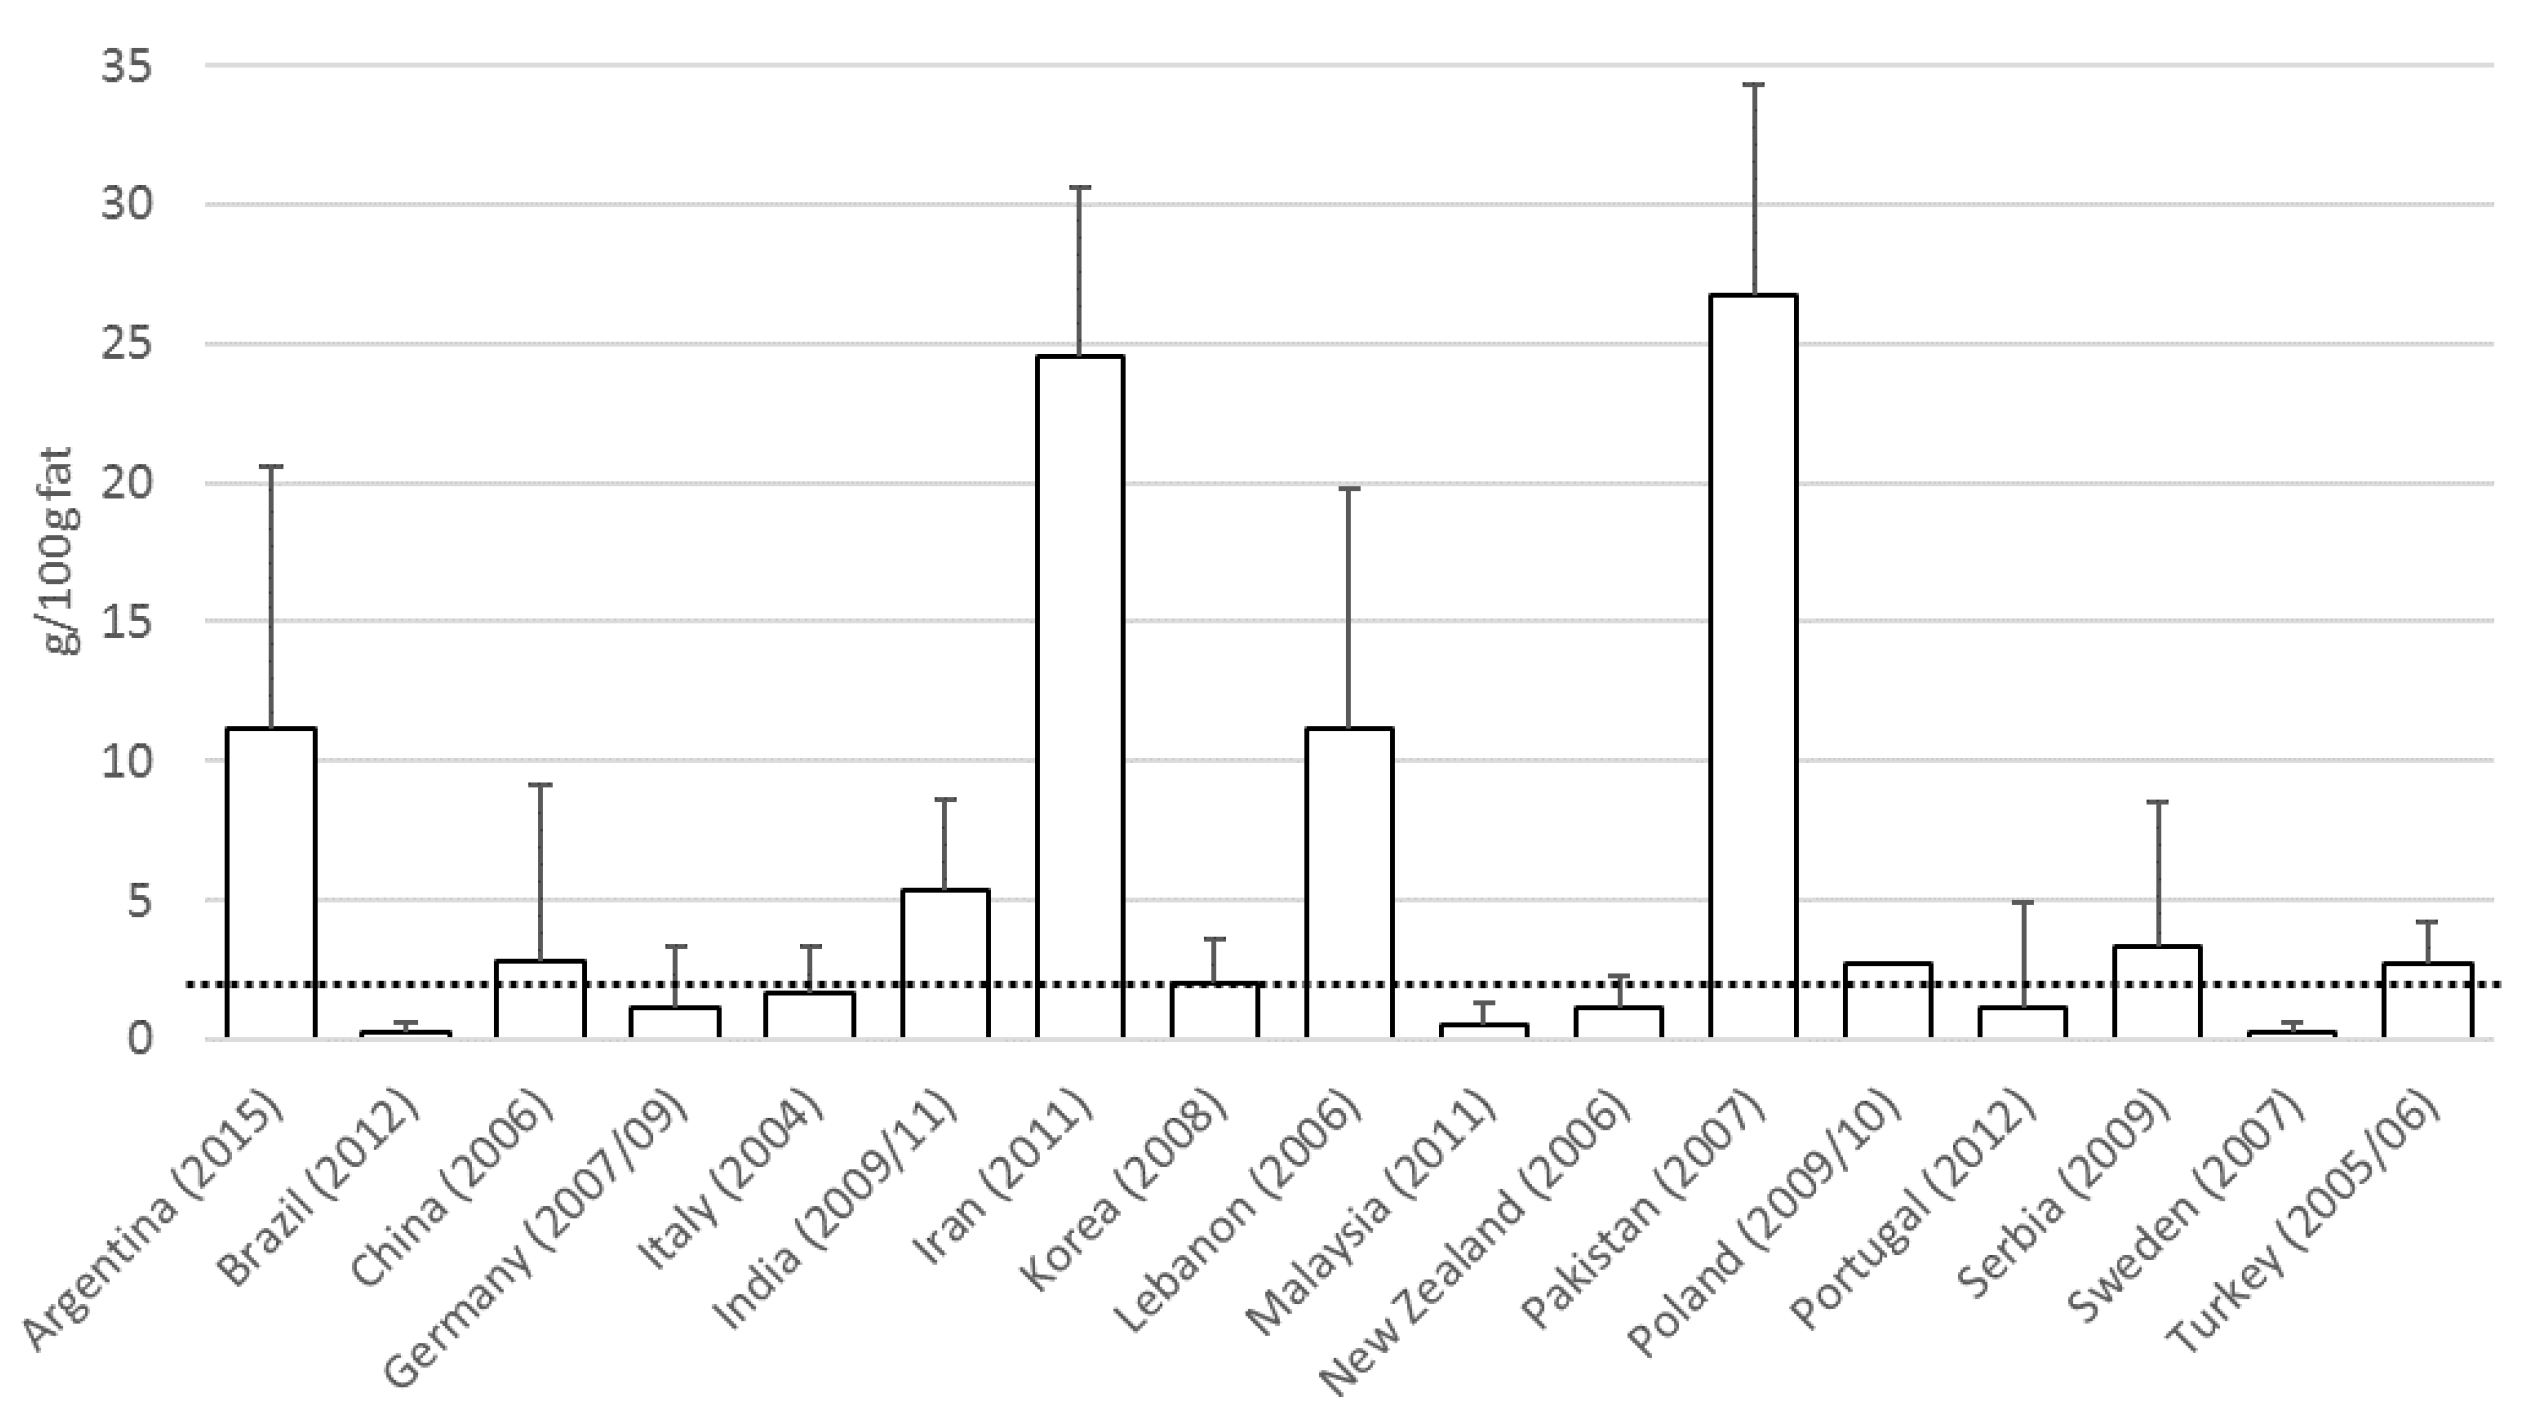
The search on trans and saturated fat content of biscuits resulted in 20 publications and reports representing 17 countries (Supplemental Table S2). Of these countries, seven did not have data on population total trans fat intake. At the time of the surveys in Brazil (2012), Germany (2007/09), Italy (2004), Malaysia (2011), New Zealand (2006), Portugal (2012) and Sweden (2007) the trans fat content of biscuits was below the Danish limit of 2 g per 100 g fat. In Argentina (2015), China (2006), India (2009/11), Iran (2011), Korea (2008), Lebanon (2006), Pakistan (2007), Poland (2009/10), Serbia (2009) and Turkey (2005/06) the reported trans fat content of biscuits was higher, up to 26.7 g/100 g fat (Figure 3).
Time trends of the solid fat composition of biscuits could be made for Brazil, Korea, Malaysia, Serbia and Sweden (Supplemental Figure S2). In Brazil, Korea, Malaysia and Serbia, the decrease in trans fat content in biscuits was accompanied by equal or higher content of solid fat (sum of saturated fat and trans fat), whereas in Sweden the solid fat content of biscuits decreased.
4. Discussion
The data summarized in this systematic review show that for 22 out of 29 countries, the intake of total trans fat is currently below the recommended maximum intake of 1 En%. Like earlier studies from Craig-Smith and Micha [9,10], we also showed that total trans fat intakes have been decreasing over the past decades. This review is the first to distinguish trans fat intake from animal and industrial sources.
Several limitations of our analysis should be considered when interpreting the results. The first is heterogeneity of the trans fat intake data with respect to different sampling and dietary assessment methods within and across countries. For example, not all datasets provide national representative food survey data, as we also included household intake surveys and intake data from large observational studies in general populations. As a result, differences in reported trans fat intakes between and within countries may be partly due to differences in the data collection methods.
A second limitation is the limited reliability of data on trans fat content of foods in local food composition tables. Determination of trans fat content is often not included in routine fatty acid analyses of foods. Also, trans fat consists of different isomers, which occur in different levels in different foods. As a result, food composition tables tend to be more incomplete for trans fat than for other nutrients. This may increase the number of borrowed or estimated data which can lead to larger bias in estimations of true intakes. Also, data on trans fat content of foods can be outdated because of changing food compositions (reduced trans content), which can contribute to overestimation of true trans fat intakes. It was not possible to evaluate the quality of food composition databases and trans fat isomers included in the analyses in different surveys, because the reported information was in many cases too limited. For several national surveys, analytical data from market basket studies on trans fat content were newly generated. As such data represent actual average population intakes, these data can be regarded as the most reliable.
Third, data on trans fat intake are limited or not available for many countries in less developed regions, in particular Asia, Africa and the Middle East. Also, some more developed countries such as Sweden stopped reporting trans fat in their national dietary surveys in 2010, reasons may be that trans fat intake was below the recommended maximum intake of 1 En% and therefore not high priority for public health [61] or that data quality was considered insufficient. Trans fat intakes reported in this review for specific countries may therefore not be representative for other countries.
The last limitation is the imperfect distinction between industrial, animal and ruminant trans fat sources. Ruminant trans fat mainly comes from dairy, beef, and lamb, but non-ruminant animal foods such as pork, chicken and fish can also contain trans fat [62]. The source of this trans fat is unclear, but it may come from animal feed made with industrial trans fat. In this review we reported total animal trans fat, because in most dietary surveys no distinction was made between ruminant and non-ruminant animal food groups. The reporting of animal trans fat sources may lead to a minor overestimation of ruminant trans fat intakes. For example, in the 2011 survey from the Netherlands, 0.32 En% of the total trans fat intake came from ruminant animal sources and 0.01 En% from non-ruminant animal sources. In addition, in case a food group in a dietary survey contained both animal and industrial foods (e.g., the food group ”fats and oils” comprising both butter and margarines), we considered this food group an industrial trans fat source. This may underestimate animal trans fat and overestimate industrial trans fat intakes. For example, in one third of the datasets trans fat intake from butter was not separately reported. From available data, we calculated that per country the average trans fat intake from butter was 0.07 En%. As a result, industrial trans fat intake may have been overestimated. Likewise, the trans fat source in biscuits could either be industrial sources or butter. Butter may comprise trans fat levels up to 6% of total fat. In an extreme scenario assuming that all biscuits containing trans fat levels up to 6% of total fat are made from butter, in four countries, Argentina (2015), Iran (2011), Lebanon (2006) and Pakistan (2007) biscuits must have high industrial trans fat levels.
Overall, this review showed that in almost all countries included in this review, the intake of trans fat has substantially decreased over the past 20 years. In 22 out of 29 countries (76%) the average intake is now well below the recommended maximum intake of 1 En%. The reduction in trans fat intake can be primarily attributed to the reduction of the use of industrial trans fat. Apparently, voluntary self-regulation by the industry, trans fat labelling, and local or national regulatory measures on use of PHVO or trans fat in the food supply chain [7,8,63] have successfully lowered industrial trans fat intake in these countries. However, a decline of the use of trans fat in foods has not yet happened everywhere. In many countries, including USA and the European Union, statutory measures to reduce trans fat intake do not yet exist, or are only recently in place or effective [7,15]. Our review of the composition of fats in biscuits showed that in several countries foods can still contain high levels of trans fat. Assuming that biscuits are a marker for the presence of industrial trans fat in other foods [16], industrial trans fat intakes in these countries may still be substantial. It should also be realized that even if average trans fat intakes in a country are low, specific subgroups with a preference for certain foods (such as low income groups preferring specific brands of biscuits) may consume trans fat in amounts that significantly increase their risk of coronary heart disease [11,64].
Concerns have been voiced that food manufacturers may replace trans fat in foods with saturated fats, to maintain the required or preferred solid fat content (saturated fat plus trans fat) in the food [65,66]. Such replacements are not in agreement with public health recommendations to lower trans fat intake and to replace saturated fat intake with polyunsaturated fat to decrease the risk of coronary heart disease [6]. However, studies in North America show that over the past 10–15 years, most supermarket and restaurant foods decreased trans fat content without a concomitant increase in saturated fat [67,68]. Nevertheless, this was not the case for all foods in all countries [66]. This was also reflected in our findings that in Sweden the solid fat content of biscuits decreased, whereas the solid fat content of biscuits in Brazil, Korea, Malaysia, and Serbia remained stable or increased. For solid foods such as biscuits, technical innovations are required to preserve texture properties while replacing trans fat with unsaturated fat, instead of saturated fat [65]. The present review suggests that thus far, not all food manufacturers have applied these technical innovations.
This review also indicated that with the considerable reductions in the intake of industrial trans fat, the primary dietary source of trans fat is now animal foods. Industrial and animal trans fats are likely to have comparably adverse effects on the blood cholesterol profile at similar intake levels [69,70]. However, because intakes of animal trans fats are generally well below 1 En%, their impact on the blood cholesterol profile and coronary heart disease risk in the population is limited. The intake of ruminant trans fat is therefore not seen as a major dietary problem for public health [71]. The most important sources of animal trans fat are full-fat dairy products and high-fat meats. Current food-based dietary guidelines advise to reduce saturated fat intake by limiting the intake of full-fat dairy products and high-fat meats. Adhering to these guidelines will also reduce the intake of animal trans fat [72,73,74]. While many countries now have average trans fat intakes below 1 En%, recent research suggests that trans fat intakes at dosages around 1 En% may still adversely affect outcomes other than cardiovascular risk, such as reproductive health [75,76]. However, more research is needed to confirm benefits of further reducing trans fat intakes.
5. Conclusions
In the past 20 years the total intake of trans fat substantially decreased. In the majority of countries for which data are available, average trans fat intake is nowadays lower than the recommended maximum intake of 1 En%, with intakes from animal sources being higher than from industrial sources. Both voluntary and regulatory measures to reduce the intake of industrial trans fat have resulted in substantial reductions in many countries.
Supplementary Materials
The following are available online at www.mdpi.com/2072-6643/9/8/840/s1, Figure S1: PRISMA flow chart; Table S1: Criteria for evaluating scoring the data quality; Table S2: Mean trans fat and saturated fat composition of biscuits in 17 countries; Figure S2: Time trends of mean trans and saturated fat content of biscuits in 5 countries.
Acknowledgments
Funding for open access was provided by Unilever R & D, Vlaardingen, The Netherlands.
Author Contributions
A.J.W., P.L.Z. and I.A.B. designed the research; A.J.W. performed the review and wrote the manuscript; P.L.Z. and I.A.B. critically reviewed the manuscript and approved the final version.
Conflicts of Interest
A.J.W. and P.L.Z. are employed by Unilever; Unilever markets food products made of vegetable oils, including margarines and dressings. I.A.B. supervises a student whose project is partly funded by Unilever R & D, The Netherlands.
References
- Ascherio, A.; Katan, M.B.; Zock, P.L.; Stampfer, M.J.; Willett, W.C. Trans fatty acids and coronary heart disease. N. Engl. J. Med. 1999, 340, 1994–1998. [Google Scholar] [CrossRef] [PubMed]
- Mensink, R.P.; Katan, M.B. Effect of dietary trans fatty acids on high-density and low-density lipoprotein cholesterol levels in healthy subjects. N. Engl. J. Med. 1990, 323, 439–445. [Google Scholar] [CrossRef] [PubMed]
- Willett, W.C.; Stampfer, M.J.; Manson, J.E.; Colditz, G.A.; Speizer, F.E.; Rosner, B.A.; Sampson, L.A.; Hennekens, C.H. Intake of trans fatty acids and risk of coronary heart disease among women. Lancet 1993, 341, 581–585. [Google Scholar] [CrossRef]
- Mozaffarian, D.; Katan, M.B.; Ascherio, A.; Stampfer, M.J.; Willett, W.C. Trans fatty acids and cardiovascular disease. N. Engl. J. Med. 2006, 354, 1601–1613. [Google Scholar] [CrossRef] [PubMed]
- De Souza, R.J.; Mente, A.; Maroleanu, A.; Cozma, A.I.; Ha, V.; Kishibe, T.; Uleryk, E.; Budylowski, P.; Schünemann, H.; Beyene, J.; et al. Intake of saturated and trans unsaturated fatty acids and risk of all cause mortality, cardiovascular disease, and type 2 diabetes: Systematic review and meta-analysis of observational studies. BMJ 2015, 351, h3978. [Google Scholar] [CrossRef] [PubMed]
- Food and Agriculture Organization (FAO)/World Health Organisation (WHO). Fats and Fatty Acids in Human Nutrition; Report of an Expert Consultation; WHO Press: Geneva, Switzerland, 2010. [Google Scholar]
- Downs, S.M.; Thow, A.M.; Leeder, S.R. The effectiveness of policies for reducing dietary trans fat: A Systematic review of the evidence. Bull. World Health Organ. 2013, 91, 262–269. [Google Scholar] [CrossRef] [PubMed]
- World Health Organisation. Eliminating Trans Fats in Europe: A Policy Brief; WHO Regional Office for Europe: Copenhagen, Denmark, 2015. [Google Scholar]
- Craig-Schmidt, M.C. World-wide consumption of trans fatty acids. Atheroscler. Suppl. 2006, 7, 1–4. [Google Scholar] [CrossRef] [PubMed]
- Micha, R.; Khatibzadeh, S.; Shi, P.; Fahimi, S.; Lim, S.; Andrews, K.G.; Engell, R.E.; Powles, J.; Ezzati, M.; Mozaffarian, D.; et al. Global, regional, and national consumption levels of dietary fats and oils in 1990 and 2010: A systematic analysis including 266 country-specific nutrition surveys. BMJ 2014, 348, g2272. [Google Scholar] [CrossRef] [PubMed] [Green Version]
- Mouratidou, T.; Livaniou, A.; Saborido, C.M.; Wollgast, J.; Caldeira, S. Trans Fatty Acids in Europe: Where do We Stand? A synthesis of the evidence: 2003–2013, in JRC Science and Policy Reports; European Commission Joint Research Centre: Luxembourg, 2014. [Google Scholar]
- Precht, D.; Molkentin, J. Trans fatty acids: Implications for health, analytical methods, incidence in edible fats and intake (a review). Nahrung 1995, 39, 343–374. [Google Scholar] [CrossRef] [PubMed]
- Hulshof, K.F.; van Erp-Baart, M.A.; Anttolainen, M.; Becker, W.; Church, S.M.; Couet, C.; Hermann-Kunz, E.; Kesteloot, H.; Leth, T.; Martins, I.; et al. Intake of fatty acids in Western Europe with emphasis on trans fatty acids: The TRANSFAIR study. Eur. J. Clin. Nutr. 1999, 53, 143–157. [Google Scholar] [CrossRef]
- Martin-Saborido, C.; Mouratidou, T.; Livaniou, A.; Caldeira, S.; Wollgast, J. Public health economic evaluation of different European Union-level policy options aimed at reducing population dietary trans fat intake. Am. J. Clin. Nutr. 2016, 104, 1218–1226. [Google Scholar] [CrossRef] [PubMed]
- Tentative Determination Regarding Partially Hydrogenated Oils; Request for Comments and for Scientific Data and Information. Available online: https://www.federalregister.gov/documents/2013/11/08/2013-26854/tentative-determination-regarding-partially-hydrogenated-oils-request-for-comments-and-for (accessed on 5 August 2017).
- Stender, S.; Astrup, A.; Dyerberg, J. Tracing artificial trans fat in popular foods in Europe: A market basket investigation. BMJ Open 2014, 4, e005218. [Google Scholar] [CrossRef] [PubMed]
- Harika, R.K.; Eilander, A.; Alssema, M.; Osendarp, S.J.; Zock, P.L. Intake of fatty acids in general populations worldwide does not meet dietary recommendations to prevent coronary heart disease: A systematic review of data from 40 countries. Ann. Nutr. Metab. 2013, 63, 229–238. [Google Scholar] [CrossRef] [PubMed]
- Harika, R.K.; Cosgrove, M.C.; Osendarp, S.J.; Verhoef, P.; Zock, P.L. Fatty acid intakes of children and adolescents are not in line with the dietary intake recommendations for future cardiovascular health: A systematic review of dietary intake data from thirty countries. Br. J. Nutr. 2011, 106, 307–316. [Google Scholar] [CrossRef] [PubMed]
- Monge-Rojas, R.; Aragon, M.C.; Chinnock, A.; Campos, H.; Colón-Ramos, U. Changes in dietary intake and food sources of saturated and cis and trans unsaturated fatty acids in Costa Rican adolescents: 1996 versus 2006. Nutrition 2013, 29, 641–645. [Google Scholar] [CrossRef] [PubMed]
- Food Standards Australia New Zealand. Intakes of Trans Fatty Acids in the New Zealand and Australian Food Supply: Review Report, Attachment 1; FSANZ: Canberra, Australia, 2009. [Google Scholar]
- Australian Bureau of Statistics. Australian Health Survey: Nutrition First Results-Foods and Nutrients, 2011–12; Australian Bureau of Statistics: Belconnen, Australia, 2014. [Google Scholar]
- University of Vienna. Austrian Nutrition Report 2008; Institute of Nutritional Sciences: Vienna, Austria, 2009. [Google Scholar]
- Belgian Institute of Public Health. De Belgische Voedselconsumptiepeiling 1-2004; Department of Epidemiology: Brussels, Belgium, 2006. [Google Scholar]
- Lebacq, T. Vetten: Voedselconsumptiepeiling 2014–2015; Bel, S., Tafforeau, J., Eds.; Scientific Institute of Public Health: Brussels, Belgium, 2016. [Google Scholar]
- Castro, M.A.; Barros, R.R.; Bueno, M.B.; César, C.L.; Fisberg, R.M. Trans fatty acid intake among the population of the city of Sao Paulo, Brazil. Rev. Saude Publica 2009, 43, 991–997. [Google Scholar] [CrossRef] [PubMed]
- Pereira, R.A.; Duffey, K.J.; Sichieri, R.; Popkin, B.M. Sources of excessive saturated fat, trans fat and sugar consumption in Brazil: An analysis of the first Brazilian nationwide individual dietary survey. Public Health Nutr. 2014, 17, 113–121. [Google Scholar] [CrossRef] [PubMed]
- Souza, R.A.; Yokoo, E.M.; Sichieri, R.; Pereira, R.A. Energy and macronutrient intakes in Brazil: Results of the first nationwide individual dietary survey. Public Health Nutr. 2015, 18, 3086–3095. [Google Scholar] [CrossRef] [PubMed]
- Ratnayake, W.M.; L’Abbe, M.R.; Farnworth, S.; Dumais, L.; Gagnon, C.; Lampi, B.; Casey, V.; Mohottalage, D.; Rondeau, I.; Underhill, L.; et al. Trans fatty acids: Current contents in Canadian foods and estimated intake levels for the Canadian population. J. AOAC Int. 2009, 92, 1258–1276. [Google Scholar] [PubMed]
- Zhou, B.F.; Stamler, J.; Dennis, B.; Moag-Stahlberg, A.; Okuda, N.; Robertson, C.; Zhao, L.; Chan, Q.; Elliott, P.; INTERMAP Research Group. Nutrient intakes of middle-aged men and women in China, Japan, United Kingdom, and United States in the late 1990s: The INTERMAP study. J. Hum. Hypertens. 2003, 17, 623–630. [Google Scholar] [PubMed]
- Liu, A.D.; Li, J.W.; Liu, Z.P.; Zhou, P.P.; Mao, W.F.; Li, N.; Zhang, L. Trans Fatty Acid Levels in Foods and Intakes among Population Aged 3 Years and above in Beijing and Guangzhou Cities, China. Biomed. Environ. Sci. 2015, 28, 477–485. [Google Scholar] [PubMed]
- Danmarks Fodevareforskning. Dietary Habits in Denmark 2000–2002: Main Results; Department of Nutrition: Soborg, Denmark, 2005. [Google Scholar]
- DTU Fodevareinstituttet. Dietary Habits in Denmark 2003–2008: Main Results; Department of Nutrition: Soborg, Denmark, 2010. [Google Scholar]
- DTU Fodevareinstituttet. Dietary Habits in Denmark 2011–2013: Main Results; Department of Nutrition: Soborg, Denmark, 2015. [Google Scholar]
- Mannisto, S.; Ovaskainen, M.; Valsta, L. The National FINDIET 2002 Survey; National Public Health Institute: Helsinki, Finland, 2003. [Google Scholar]
- Paturi, M.; Tapanainen, H.; Reinivuo, H.; Pietinen, P. The National FINDIET 2007 Survey; KTL National Public Health Institute: Helsinki, Finland, 2008. [Google Scholar]
- Helldan, A.; Raulio, S.; Kosola, M.; Tapanainen, H.; Ovaskainen, M.L.; Smith, S. The National FINDIET 2012 Survey; National Institute for Health and Welfare: Tampere, Finland, 2013. [Google Scholar]
- Laloux, L.; du Chaffaut, L.; Razanamahefa, L.; Lafay, L. Trans fatty acid content of foods and intake levels in France. Eur. J. Lipid Sci. Technol. 2007, 109, 918–929. [Google Scholar] [CrossRef]
- Agence Francaise de Securite Sanitaire des Aliments. Avis de l’Agence Francaise de Securite Sanitaire des Aliments sur L’estimation des Apports en Acides Gras Trans de la Population Francaise; Agence Francaise de Securite Sanitaire des Aliments: Maisons-Alfort, France, 2009. [Google Scholar]
- Bundesinstitut fur Risikobewertung. Hohe der Derzeitigen Trans-Fettsaureaufnahme in Deutschland ist Gesundheidlich Unbedenklich; Bundesinstitut fur Risikobewertung: Berlin, Germany, 2013. [Google Scholar]
- Steingrimsdottir, L.; Porgeirsdottir, H.; Olafsdottir, A. The Diet of Icelanders : Dietary Survey of The Icelandic Nutrition Council 2002: Main findings; The Icelandic Nutrition Council: Reykjavik, Iceland, 2002. [Google Scholar]
- Porgeirsdottir, H.V.; Gunnarsdottir, H.; Gisladottir, I.; Gunnarsdottir, E.; Porsdottir, B.; Stefansdottir, I.; Steingrimsdottir, J.L. The Diet of Icelanders: Dietary Survey of The Icelandic Nutrition Council 2012 Main Findings; The Icelandic Nutrition Council: Reykjavik, Iceland, 2012. [Google Scholar]
- Mozaffarian, D.; Abdollahi, M.; Campos, H.; Houshiarrad, A.; Willett, W.C. Consumption of trans fats and estimated effects on coronary heart disease in Iran. Eur. J. Clin. Nutr. 2007, 61, 1004–1010. [Google Scholar] [CrossRef] [PubMed]
- Li, K.; McNulty, B.A.; Tiernery, A.M.; Devlin, N.F.; Joyce, T.; Leite, J.C.; Flynn, A.; Walton, J.; Brennan, L.; Gibney, M.J.; et al. Dietary fat intakes in Irish adults in 2011: How much has changed in 10 years? Br. J. Nutr. 2016, 115, 1798–1809. [Google Scholar] [CrossRef] [PubMed]
- Yamada, M.; Sasaki, S.; Murakami, K.; Takahashi, Y.; Okubo, H.; Hirota, N.; Notsu, A.; Todoriki, H.; Miura, A.; Fukui, M.; et al. Estimation of trans fatty acid intake in Japanese adults using 16-day diet records based on a food composition database developed for the Japanese population. J. Epidemiol. 2010, 20, 119–127. [Google Scholar] [CrossRef] [PubMed]
- Farhat, A.G.; Jaalouk, D.; Moukarzel, S.R.; Ayoub, J.J. Consumption of trans fatty acid and omega 6 to omega 3 ratio in Lebanese adults. Nutr. Food Sci. 2016, 46, 120–129. [Google Scholar] [CrossRef]
- Ramirez-Silva, I.; Villalpando, S.; Moreno-Saracho, J.E.; Bernal-Medina, D. Fatty acids intake in the Mexican population. Results of the National Nutrition Survey 2006. Nutr. Metab. 2011, 8, 33. [Google Scholar] [CrossRef] [PubMed]
- Johansson, L.; Borgejordet, A.; Pedersen, J.I. [Trans fatty acids in the Norwegian diet]. Tidsskr. Nor. Laegeforen. 2006, 126, 760–763. [Google Scholar] [PubMed]
- Norwegian Directorate of Health. Utviklingen I Norsk Kosthold 2015; Matforsyningsstatistikk og Forbruksundersokelser; Norwegian Directorate of Health: Oslo, Norway, 2015. [Google Scholar]
- Zbikowska, A.; Rutkowska, J.; Kowalska, M. Consumption Safety of Pastries, Confectioneries, and Potato Products as Related to Fat Content. J. Am. Coll. Nutr. 2015, 34, 507–514. [Google Scholar] [CrossRef] [PubMed]
- Palacios, C.; Trak, M.A.; Betancourt, J.; Joshipura, K.; Tucker, K.L. Validation and reproducibility of a semi-quantitative FFQ as a measure of dietary intake in adults from Puerto Rico. Public Health Nutr. 2015, 18, 2550–2558. [Google Scholar] [CrossRef] [PubMed]
- Mayneris-Perxachs, J.; Bondia-Pons, I.; Molto-Puigmarti, C.; Pairo, M.; Castellote, A.I.; Lopez-Sabater, M.C. Diet and plasma evaluation of the main isomers of conjugated linoleic acid and trans-fatty acids in a population sample from Mediterranean north-east Spain. Food Chem. 2010, 123, 296–305. [Google Scholar] [CrossRef]
- Becker, W.; Eriksson, A.; Haglund, M.; Wretling, S. Contents of total fat, fatty acids, starch, sugars and dietary fibre in Swedish market basket diets. Br. J. Nutr. 2015, 113, 1453–1465. [Google Scholar] [CrossRef] [PubMed]
- Darnerud, P.O.; Becker, W.; Ohrvik, V.; Kollander, B.; Sunstrom, B.; Strandler, H.S.; Nälsén, C.; von Malmborg, A.; Staffas, A.; Grönholm, R.; et al. Swedish Market Basket Survey 2015: Per capita-based analysis of nutrients and toxic compounds in market baskets and assessment of benefit or risk. In Livsmedelsverkets Rapportserie; National Food Agency: Uppsala, Sweden, 2017. [Google Scholar]
- Hulshof, K.F.A.M.; Ocke, M.C.; van Rossum, C.T.M.; Buurma-Rethans, E.J.M.; Brants, H.A.M.; Drijvers, J.J.M.M.; ter Doest, D. Resultaten van de Voedselconsumptiepeiling 2003; RIVM: Bilthoven, The Netherlands, 2004. [Google Scholar]
- Van Rossum, C.T.M.; Fransen, H.P.; Verkaik-Kloosterman, J.; Buurma-Rethans, E.J.M.; Ocké, M.C. Dutch National Food Consumption Survey 2007–2010: Supporting Tables; National Institute for Public Health and the Environment: Bilthoven, The Netherlands, 2011. [Google Scholar]
- Henderson, L.; Gregory, J.; Irving, K. The National Diet & Nutrition Survey: Adults Aged 19 to 64 Years, Vol 2. In Energy, Protein, Carbohydrate, Fat and Alcohol Intake; Office for National Statistics: London, UK, 2003. [Google Scholar]
- Pot, G.K.; Prynne, C.J.; Roberts, C.; Olson, A.; Nicholson, S.K.; Whitton, C.; Teucher, B.; Bates, B.; Henderson, H.; Pigott, S.; et al. National Diet and Nutrition Survey: Fat and fatty acid intake from the first year of the rolling programme and comparison with previous surveys. Br. J. Nutr. 2012, 107, 405–415. [Google Scholar] [CrossRef] [PubMed]
- Food and Drug Administration. Food Labeling: Trans Fatty Acids in Nutrition Labeling, Nutrient Content Claims, and Health Claims; Food and Drug Administration: College Park, MD, USA, 2003. [Google Scholar]
- Allison, D.B.; Egan, S.K.; Barraj, L.M.; Caughman, C.; Infante, M.; Heimbach, J.T. Estimated intakes of trans fatty and other fatty acids in the US population. J. Am. Diet. Assoc. 1999, 99, 166–174. [Google Scholar] [CrossRef]
- Doell, D.; Folmer, D.; Lee, H.; Honigfort, M.; Carberry, S. Updated estimate of trans fat intake by the US population. Food Addit. Contam. 2012, 29, 861–874. [Google Scholar] [CrossRef] [PubMed]
- Amcoff, E.; Edberg, A.; Barbieri, H.E.; Lindroos, A.K.; Nälsén, C.; Lemming, E.W. Riksmaten-Vuxna 2010–11: Livsmedels-Och Naringsintag Bland Vuxna I Sverige; Livsmedelsverket: Uppsala, Sweden, 2012. [Google Scholar]
- Public Health England. McCance and Widdowson’s Composition of Foods Integrated Dataset (CoFID). Available online: https://www.gov.uk/government/publications/composition-of-foods-integrated-dataset-cofid (accessed on 23 May 2017).
- Colon-Ramos, U.; Monge-Rojas, R.; Campos, H. Impact of WHO recommendations to eliminate industrial trans-fatty acids from the food supply in Latin America and the Caribbean. Health Policy Plan. 2014, 29, 529–541. [Google Scholar] [CrossRef] [PubMed]
- Stender, S.; Astrup, A.; Dyerberg, J. Artificial trans fat in popular foods in 2012 and in 2014: A market basket investigation in six European countries. BMJ Open 2016, 6, e010673. [Google Scholar] [CrossRef] [PubMed]
- Eckel, R.H.; Borra, S.; Lichtenstein, A.H.; Yin-Piazza, S.Y.; Trans Fat Conference Planning Group. Understanding the complexity of trans fatty acid reduction in the American diet: American Heart Association Trans Fat Conference 2006: Report of the Trans Fat Conference Planning Group. Circulation 2007, 115, 2231–2246. [Google Scholar] [PubMed]
- Stender, S.; Astrup, A.; Dyerberg, J. What went in when trans went out? N. Engl. J. Med. 2009, 361, 314–316. [Google Scholar] [CrossRef] [PubMed]
- Mozaffarian, D.; Jacobson, M.F.; Greenstein, J.S. Food reformulations to reduce trans fatty acids. N. Engl. J. Med. 2010, 362, 2037–2039. [Google Scholar] [CrossRef] [PubMed]
- Ratnayake, W.M.; L’Abbe, M.R.; Mozaffarian, D. Nationwide product reformulations to reduce trans fatty acids in Canada: When trans fat goes out, what goes in? Eur. J. Clin. Nutr. 2009, 63, 808–811. [Google Scholar] [CrossRef] [PubMed]
- Brouwer, I.A.; Wanders, A.J.; Katan, M.B. Trans fatty acids and cardiovascular health: Research completed? Eur. J. Clin. Nutr. 2013, 67, 541–547. [Google Scholar] [CrossRef] [PubMed]
- Gebauer, S.K.; Destaillats, F.; Dionisi, F.; Krauss, R.M.; Baer, D.J. Vaccenic acid and trans fatty acid isomers from partially hydrogenated oil both adversely affect LDL cholesterol: A double-blind, randomized controlled trial. Am. J. Clin. Nutr. 2015, 102, 1339–1346. [Google Scholar] [CrossRef] [PubMed]
- Willett, W.; Mozaffarian, D. Ruminant or industrial sources of trans fatty acids: Public health issue or food label skirmish? Am. J. Clin. Nutr. 2008, 87, 515–516. [Google Scholar] [PubMed]
- Kromhout, D.; Spaaij, C.J.; de Goede, J.; Weggemans, R.M. The 2015 Dutch food-based dietary guidelines. Eur. J. Clin. Nutr. 2016, 70, 869–878. [Google Scholar] [CrossRef] [PubMed]
- U.S. Department of Health and Human Services and U.S. Department of Agriculture. 2015–2020 Dietary Guidelines for Americans, 8th ed. Available online: http://health.gov/dietaryguidelines/2015/guidelines/ (accessed on 23 May 2017).
- Nordic Council of Ministers. Nordic Nutrition Recommendations 2012-Part 2; Integrating Nutrition and Physical Activity: Copenhagen, Denmark, 2014. [Google Scholar]
- Minguez-Alarcon, L.; Chavarro, J.E.; Mendiola, J.; Roca, M.; Tanrikut, C.; Vioque, J.; Jørgensen, N.; Torres-Cantero, A.M. Fatty acid intake in relation to reproductive hormones and testicular volume among young healthy men. Asian J. Androl. 2017, 19, 184–190. [Google Scholar] [CrossRef] [PubMed]
- Wise, L.A.; Wesselink, A.K.; Tucker, K.L.; Saklani, S.; Mikkelsen, E.M.; Cueto, H.; Riis, A.H.; Trolle, E.; McKinnon, C.J.; Hahn, K.A.; et al. Dietary fat intake and fecundability in two preconception cohort studies. Am. J. Epidemiol. 2017. [Google Scholar] [CrossRef] [PubMed]
Figure 1.
Mean (Standard Deviation) intakes of trans fat and its sources in populations from 29 countries. Data represent estimates of population total trans fat intake reported by year of food composition data. The dotted line represents the maximal recommended intake level of trans fat [6].
Figure 1.
Mean (Standard Deviation) intakes of trans fat and its sources in populations from 29 countries. Data represent estimates of population total trans fat intake reported by year of food composition data. The dotted line represents the maximal recommended intake level of trans fat [6].
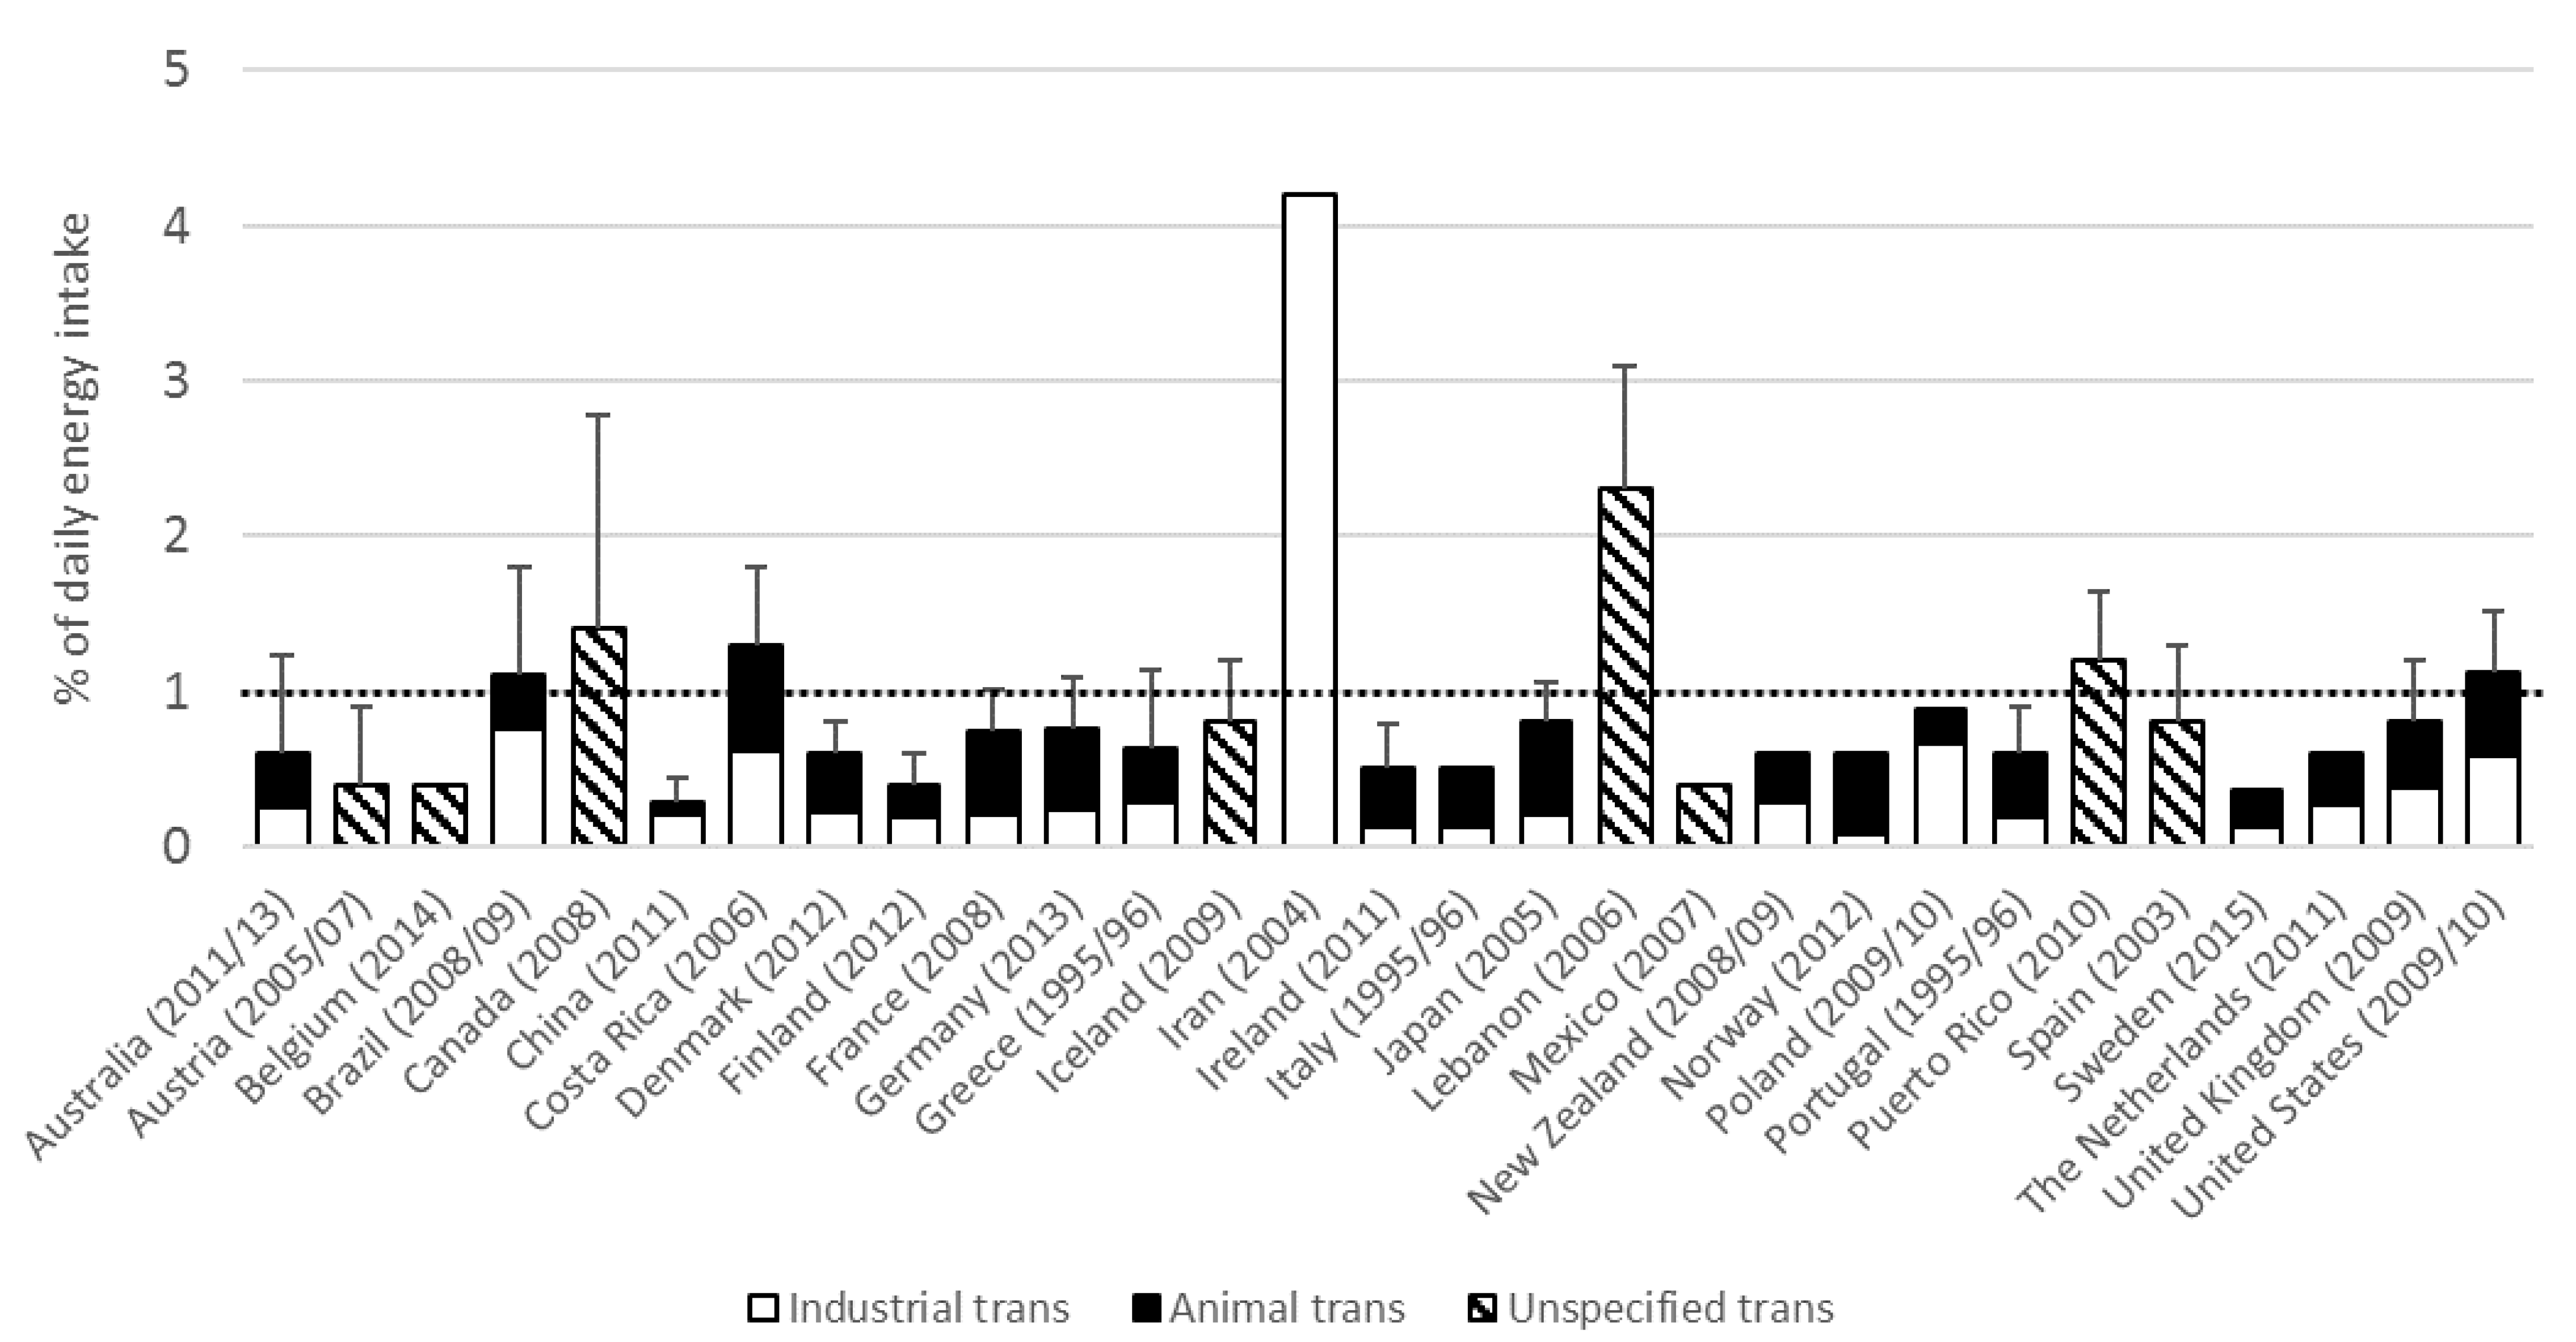
Figure 2.
Time trends of intakes of trans fat and its sources in populations from 20 countries. Data reported by year of food composition data. Symbols on the time-axis refer to the year of the introduction of voluntary reductions (*), mandatory labeling (+), or mandatory limits (^) to lower trans fat intake. The dotted lines represent the maximal recommended intake level of trans fat [6].

Figure 3.
Mean (Standard Deviation) trans fat content of biscuits in 17 countries. Data reported by year of sampling. The dotted line represents the Danish regulatory limit for foods of less than 2 g trans fat per 100 g total fat.
Figure 3.
Mean (Standard Deviation) trans fat content of biscuits in 17 countries. Data reported by year of sampling. The dotted line represents the Danish regulatory limit for foods of less than 2 g trans fat per 100 g total fat.

Table 1.
Mean intakes of trans fat and its dietary sources in populations from 29 countries.
| Country [Reference] | Survey Type | Survey Method | Survey Year | Food Composition Data Type | Year Food Composition Data | Age | Sample Size | Mean Trans Fat Intake | Mean Trans Fat Intake | SD Trans Fat Intake | 95th p Trans Fat Intake | Animal Trans | Industrial Trans | Study Quality # | Trans Fat Lowering Measures (Year) |
|---|---|---|---|---|---|---|---|---|---|---|---|---|---|---|---|
| Year | Number | g/day | En% | En% | En% | % | % | ||||||||
| Australia [20] | National | 24hr recall | 1995 | Market basket | 2002/2005 | 17+ | ~11,000 | 1.5 | 0.6 | 1.2 | 51 | 49 | Medium | Voluntary reduction (2007) | |
| Australia [20] | National | 24hr recall | 1995 | Market basket | 2008/2009 | 17+ | ~11,000 | 1.3 | 0.5 | 1.1 | 55 | 45 | Medium | ||
| Australia [21] | National | 24hr recall | 2011/12 | Food database | 2011/2013 | 19+ | ~9000 | 1.4 | 0.6 | 0.6 | 58 | 42 | Medium | ||
| Austria [22] | Local | 24hr recall | - | Market basket | 2005/2007 | 14–36 | 2989 | 1.0 | 0.4 | 0.5 | 1.4 | Medium | Mandatory limit (2009) 6 | ||
| Belgium [13] | Local | 3 d record | 1991/92 | Market basket | 1995/1996 | 18–65 | 492 | 4.1 | 1.4 | 0.5 | 2.1 3 | 44 | 57 | Medium | |
| Belgium [23] | National | 2 × 24hr recall | 2004 | Food database | 2004 | 15–64 | 3252 | 1.9 | 0.7 | 1.3 | Medium | 6 | |||
| Belgium [24] | National | 2 × 24hr recall | 2014/15 | Food database | 2014 | 15–64 | 3138 | 0.9 | 0.4 | 0.6 | Medium | ||||
| Brazil [25] | Local | 24hr recall | 2003 | Food database 2 | 2007 | 20–59 | 713 | 4.5 | 2.2 | 2.7 | 18 | 82 | Low | Mandatory limit (2007) | |
| Brazil [26,27] | National | 2 d record | 2008/09 | Food database | 2008/2009 | 10+ | 32,749 | 2.4 | 1.1 | 0.7 | 31 | 69 | Medium | ||
| Canada [28] | National | 24hr recall | 2004 | Food database | 2004 | 19+ | 19,053 | 4.7 | 1.9 | 2.8 | Medium | Mandatory labeling (2005), voluntary reduction (2007) | |||
| Canada [28] | National | 24hr recall | 2004 | Market basket | 2008 | 19+ | 19,053 | 3.4 | 1.4 | 1.4 | Medium | ||||
| China [29] | Local | 4 × 24hr recall | 1997/99 | Food database | 1992 | 40–59 | 839 | 0.5 | 0.2 | 0.4 | Low | ||||
| China [30] | Local | 3 × 24hr recall | 2011 | Market basket | 2011 | >18 | 4424 | 0.6 | 0.3 | 0.2 | 0.6 | 27 | 73 | Medium | |
| Costa Rica [19] | Local | 3 d record | 1996 | Food database | 1996 | 12–17 | 275 | 4.5 | 2.1 | 0.9 | 45 | 55 | Medium | Voluntary reduction (1996) | |
| Costa Rica [19] | Local | 3 d record | 2006 | Food database | 2006 | 12–17 | 133 | 2.8 | 1.3 | 0.5 | 52 | 48 | Medium | ||
| Denmark [13] | National | 7 d record | 1995 | Market basket | 1995/1996 | 1–80 | 3000 | 2.6 | 1.0 | 0.5 | 1.5 3 | High | Mandatory limit (2003) 6 | ||
| Denmark [31] | National | 7 d record | 2000/02 | Food database | 2004 | 18–75 | 3151 | 1.5 | 0.6 | 0.2 | 0.8 3 | 56 | 43 | High | |
| Denmark [32] | National | 7 d record | 2003/08 | Food database | 2008 | 18–75 | 3354 | 1.4 | 0.6 | 0.2 | 0.8 3 | 61 | 41 | High | |
| Denmark [33] | National | 7 d record | 2011/13 | Food database | 2012 | 18–75 | 3016 | 1.5 | 0.6 | 0.2 | 0.8 3 | 62 | 38 | High | |
| Finland [13] | National | 3 d record | 1992 | Market basket | 1995/1996 | 25–64 | 1861 | 2.1 | 0.9 | 0.3 | 1.2 3 | 46 | 53 | High | 6 |
| Finland [34] | National | 48hr recall | 2002 | Food database | 2002 | 25–64 | 2007 | 1.0 | 0.5 | 0.2 | Medium | ||||
| Finland [35] | National | 48hr recall | 2007 | Food database | 2007 | 25–64 | 1576 | 0.8 | 0.4 | 0.2 | 55 | 45 | Medium | ||
| Finland [36] | National | 48hr recall | 2012 | Food database | 2012 | 25–64 | 1295 | 1.0 | 0.4 | 0.2 | 53 | 47 | Medium | ||
| France [13] | National | 7 d record | 1993/94 | Market basket | 1995/1996 | 15–65 | 1500 | 2.3 | 1.2 | 0.3 | 1.6 3 | 75 | 26 | High | 6 |
| France [37] | National | 7 d record | 1998/99 | Market basket | 1999/2002 | 15+ | 1985 | 3.0 | 1.2 | 0.4 | 2.0 | 60 | 40 | High | |
| France [38] | National | 7 d record | 2006/07 | Food database | 2008 | 18–79 | 1918 | 1.8 | 0.8 | 0.3 | 1.2 | 72 | 28 | High | |
| Germany [13] | Local | diet history | 1991 | Market basket | 1995/1996 | 18–80 | 1897 | 2.1 | 0.9 | 0.2 | 1.1 3 | 79 | 21 | Medium | Voluntary reduction (2012) 6 |
| Germany [39] | National | 4 w diet history | 2005/06 | Food database | 2013 | 14–80 | 15,371 | 1.9 | 0.8 | 0.3 | 1.3 | 70 | 30 | Medium | |
| Greece [13] | Local | 24hr recall | 1995 | Market basket | 1995/1996 | 23–64 | 248 | 1.4 | 0.6 | 0.5 | 1.2 3 | 55 | 46 | Low | 6 |
| Iceland [13] | National | diet history | 1990 | Market basket | 1995/1996 | 15–80 | 1240 | 5.4 | 2.0 | 0.6 | 2.7 3 | 40 | 60 | High | Mandatory limit (2011) |
| Iceland [40] | National | 24hr recall | 2002 | Food database | 2002 | 15–80 | 1242 | 3.5 | 1.4 | 0.9 | Medium | ||||
| Iceland [41] | National | 2 × 24hr recall | 2010/11 | Food database | 2009 | 18–80 | 1312 | 1.8 | 0.8 | 0.4 | Medium | ||||
| Iran [42] | National | 3 × hh 24hr recall | 2001/03 | Market basket | 2004 | all | 35,924 | 12.3 | 4.2 | - 1 | 100 | Medium | Mandatory limit (2004) | ||
| Ireland [43] | National | 4 d record | 1997/99 | Food database | 2001 | 18–64 | 1097 | 1.9 | 0.7 | 0.3 | 62 | 38 | High | 6 | |
| Ireland [43] | National | 4 d semi-w record | 2008/10 | Food database | 2011 | 18–64 | 889 | 1.3 | 0.5 | 0.3 | 74 | 26 | Medium | ||
| Italy [13] | National | 7 d hh record | 1980/84 | Market basket | 1995/1996 | 1–80 | 10,000 | 1.6 | 0.5 | 76 | 24 | Medium | 6 | ||
| Japan [29] | Local | 4 × 24hr recall | 1997/99 | Food database | 1987 | 40–59 | 1145 | 0.9 | 0.4 | 0.3 | Medium | ||||
| Japan [44] | Local | 16 d semi-w record | 2002/03 | Food database | 2005 | 30–69 | 225 | 1.7 | 0.8 | 0.3 | 1.9 4 | 74 | 26 | Medium | |
| Lebanon [45] | Local | FFQ | 2009/11 | Food database 2 | 2006 | 19–70 | 657 | 6.1 | 2.3 | 0.8 | Low | ||||
| Mexico [46] | National | FFQ | 2006 | Food database | 2007 | 20–60 | 16,366 | 0.5 | 0.4 | 0.5 | Medium | ||||
| New Zealand [20] | National | 24hr recall | 1997 | Market basket | 2002/2005 | 15+ | 4636 | 1.9 | 0.7 | 1.3 | 43 | 57 | Medium | Voluntary reduction (2007) | |
| New Zealand [20] | National | 24hr recall | 1997 | Market basket | 2008/2009 | 15+ | 4636 | 1.6 | 0.6 | 1.2 | 52 | 48 | Medium | ||
| Norway [13] | National | FFQ | 1993/94 | Market basket | 1995/1996 | 16–79 | 3144 | 4.0 6 | 1.4 | 0.5 | 2.2 3 | 28 | 72 | Medium | Mandatory limit (2014) |
| Norway [47] | National | FFQ | 1997 | Food database | 2003 | 16–79 | 2672 | 1.6 | 0.6 | 71 | 29 | Medium | |||
| Norway [48] | National | hh record | 2012 | Food database | 2006 | All | 4125 hh | 1.6 | 0.6 | 87 | 13 | Low | |||
| Poland [49] | National | 1 m hh record | 2009/10 | Market basket | 2009/2010 | all | N/A | 2.0 | 0.9 | 25 | 75 | Medium | 6 | ||
| Portugal [13] | National | 24hr recall | 1988/89 | Market basket | 1995/1996 | 38 | 78 men | 1.6 | 0.6 | 0.3 | 1.1 3 | 69 | 31 | Medium | |
| Puerto Rico [50] | Local | 6 d record | 2012 | Food database | 2010 | 21+ | 92 | 2.5 | 1.2 | 0.4 | Medium | Mandatory limit (2007) | |||
| Spain [13] | National | 7 d hh record | 1991 | Market basket | 1995/1996 | 0–70 | 21,555 | 2.1 | 0.7 | 64 | 35 | Medium | 6 | ||
| Spain [51] | Local | FFQ | 2000 | Food database | 2003 | 18–77 | 516 | 1.9 | 0.8 | 0.5 | Low | ||||
| Sweden [13] | National | 7 d record | 1989 | Market basket | 1995/1996 | 1–74 | 3000 | 2.6 | 1.1 | 0.5 | 1.6 3 | 53 | 47 | High | 6 |
| Sweden [52] | National | Product/trade data | 2003 | Market basket | 2005 | all | N/A | 1.9 | 0.6 | 73 | 27 | Low | |||
| Sweden [52] | National | Product/trade data | 2007 | Market basket | 2010 | all | N/A | 1.7 | 0.5 | 73 | 27 | Low | |||
| Sweden [53] | National | Product/trade data | 2013 | Market basket | 2015 | All | N/A | 1.2 | 0.4 | 64 | 36 | Low | |||
| The Netherlands [13] | National | 2 d record | 1992 | Market basket | 1995/1996 | 1–92 | 6218 | 4.3 | 1.6 | 0.7 | 2.4 3 | 29 | 70 | High | 6 |
| The Netherlands [54] | National | 2 × 24hr recall | 2003 | Food database | 2001 | 19–30 | 750 | 2.8 | 1.1 | 0.5 | 1.5 | 30 | 70 | Medium | |
| The Netherlands [55] | National | 2 × 24hr recall | 2007/10 | Food database | 2011 | 19–69 | 2106 | 1.5 | 0.6 | 0.9 | 56 | 44 | Medium | ||
| United Kingdom [13] | National | 7 d hh record | 1996 | Market basket | 1995/1996 | 0–75 | 7921 | 2.8 | 1.3 | 37 | 64 | Medium | Voluntary reduction (2011) 6 | ||
| United Kingdom [29] | Local | 4 × 24hr recall | 1997/99 | Food database | 1996 | 40–59 | 501 | 3.6 | 1.5 | 0.9 | Low | ||||
| United Kingdom [56] | National | 7 d record | 2000/01 | Food database | 2001 | 19–64 | 1724 | 2.4 | 1.2 | 0.4 | 2.1 5 | 47 | 53 | High | |
| United Kingdom [57] | National | 4 d record | 2008/09 | Food database | 2009 | 19–64 | 434 | 1.6 | 0.8 | 0.4 | 53 | 47 | Medium | ||
| USA [58,59] | National | 2 × 24hr recall | 1994/96 | Food database | 1995 | 2+ | 11,258 | 5.3 | 2.6 | 2.1 | 3.2 3 | 21 | 79 | Medium | Mandatory labeling (2006), local bans |
| USA [29] | Local | 4 × 24hr recall | 1997/99 | Food database | 1998 | 40–59 | 2195 | 4.9 | 2.0 | 0.8 | Medium | ||||
| USA [58,60] | National | 2 × 24hr recall | 2003/06 | Food database | 2009/2010 | 2+ | ~10,000 | 2.5 | 1.1 | 0.4 | 48 | 52 | Medium |
Abbreviations: d = day; FFQ = food frequency questionnaire; hr = hour; hh = household; m = month; SD = standard deviation; w = week; 95th p = 95th percentile; # Study quality was based on four criteria: type of survey data, dietary assessment method, type of food composition data, and sample size (Supplemental Table S1). Based on the total attainable score three quality categories were defined: high quality (score 10–11), medium quality (score 8–9), low quality (score 4–7). 1 Animal trans fat was not assessed in Iran; 2 Food composition data originate from USA; 3 90th percentile; 4 maximum; 5 97.5th percentile; 6 Across Europe, voluntary measures were introduced as of 1995 and mandatory labeling of partially hydrogenated vegetable oils (PHVO) was introduced as of 2014.
© 2017 by the authors. Licensee MDPI, Basel, Switzerland. This article is an open access article distributed under the terms and conditions of the Creative Commons Attribution (CC BY) license (http://creativecommons.org/licenses/by/4.0/).
Share and Cite
MDPI and ACS Style
Wanders, A.J.; Zock, P.L.; Brouwer, I.A. Trans Fat Intake and Its Dietary Sources in General Populations Worldwide: A Systematic Review. Nutrients 2017, 9, 840. https://doi.org/10.3390/nu9080840
AMA Style
Wanders AJ, Zock PL, Brouwer IA. Trans Fat Intake and Its Dietary Sources in General Populations Worldwide: A Systematic Review. Nutrients. 2017; 9(8):840. https://doi.org/10.3390/nu9080840
Chicago/Turabian StyleWanders, Anne J., Peter L. Zock, and Ingeborg A. Brouwer. 2017. "Trans Fat Intake and Its Dietary Sources in General Populations Worldwide: A Systematic Review" Nutrients 9, no. 8: 840. https://doi.org/10.3390/nu9080840
Note that from the first issue of 2016, this journal uses article numbers instead of page numbers. See further details here.