Prediction Equations Overestimate the Energy Requirements More for Obesity-Susceptible Individuals

 ,
,  ,
, 
Abstract
:1. Introduction
2. Materials and Methods
2.1. Study Participants
2.2. Body Composition
2.3. Resting Metabolic Rate
2.4. Predictive Equations for Estimating Resting Metabolic Rate (RMR)
2.5. Physical Activity
2.6. Dietary Assessment
2.7. Statistical Analysis
3. Results
3.1. Participant Characteristics
3.2. Dietary Intake
3.3. Weight History
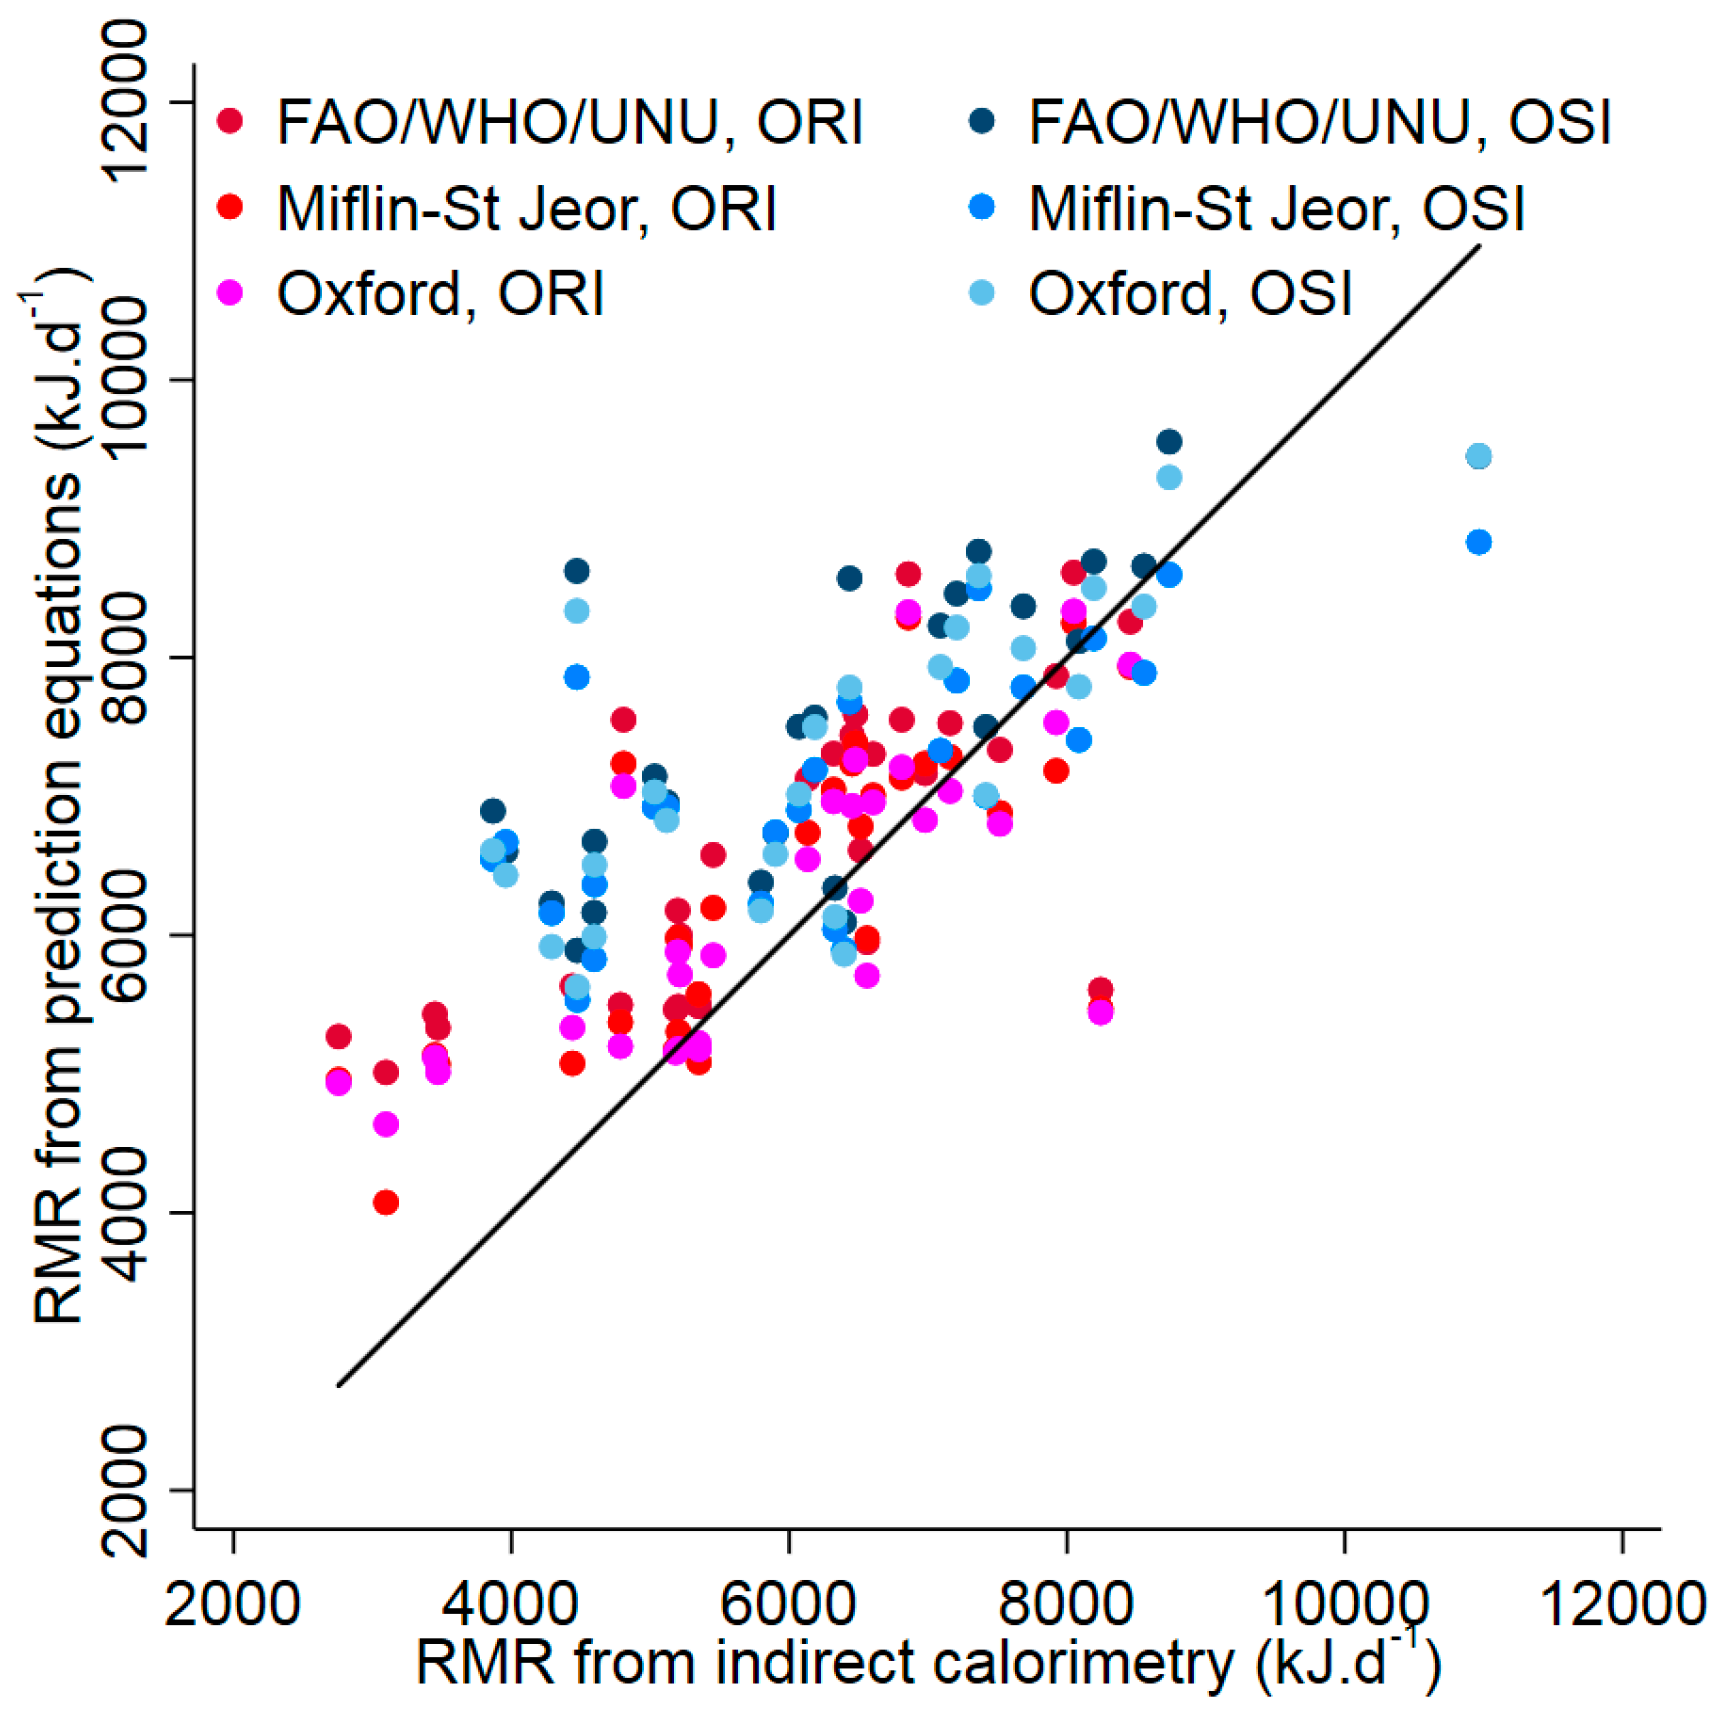
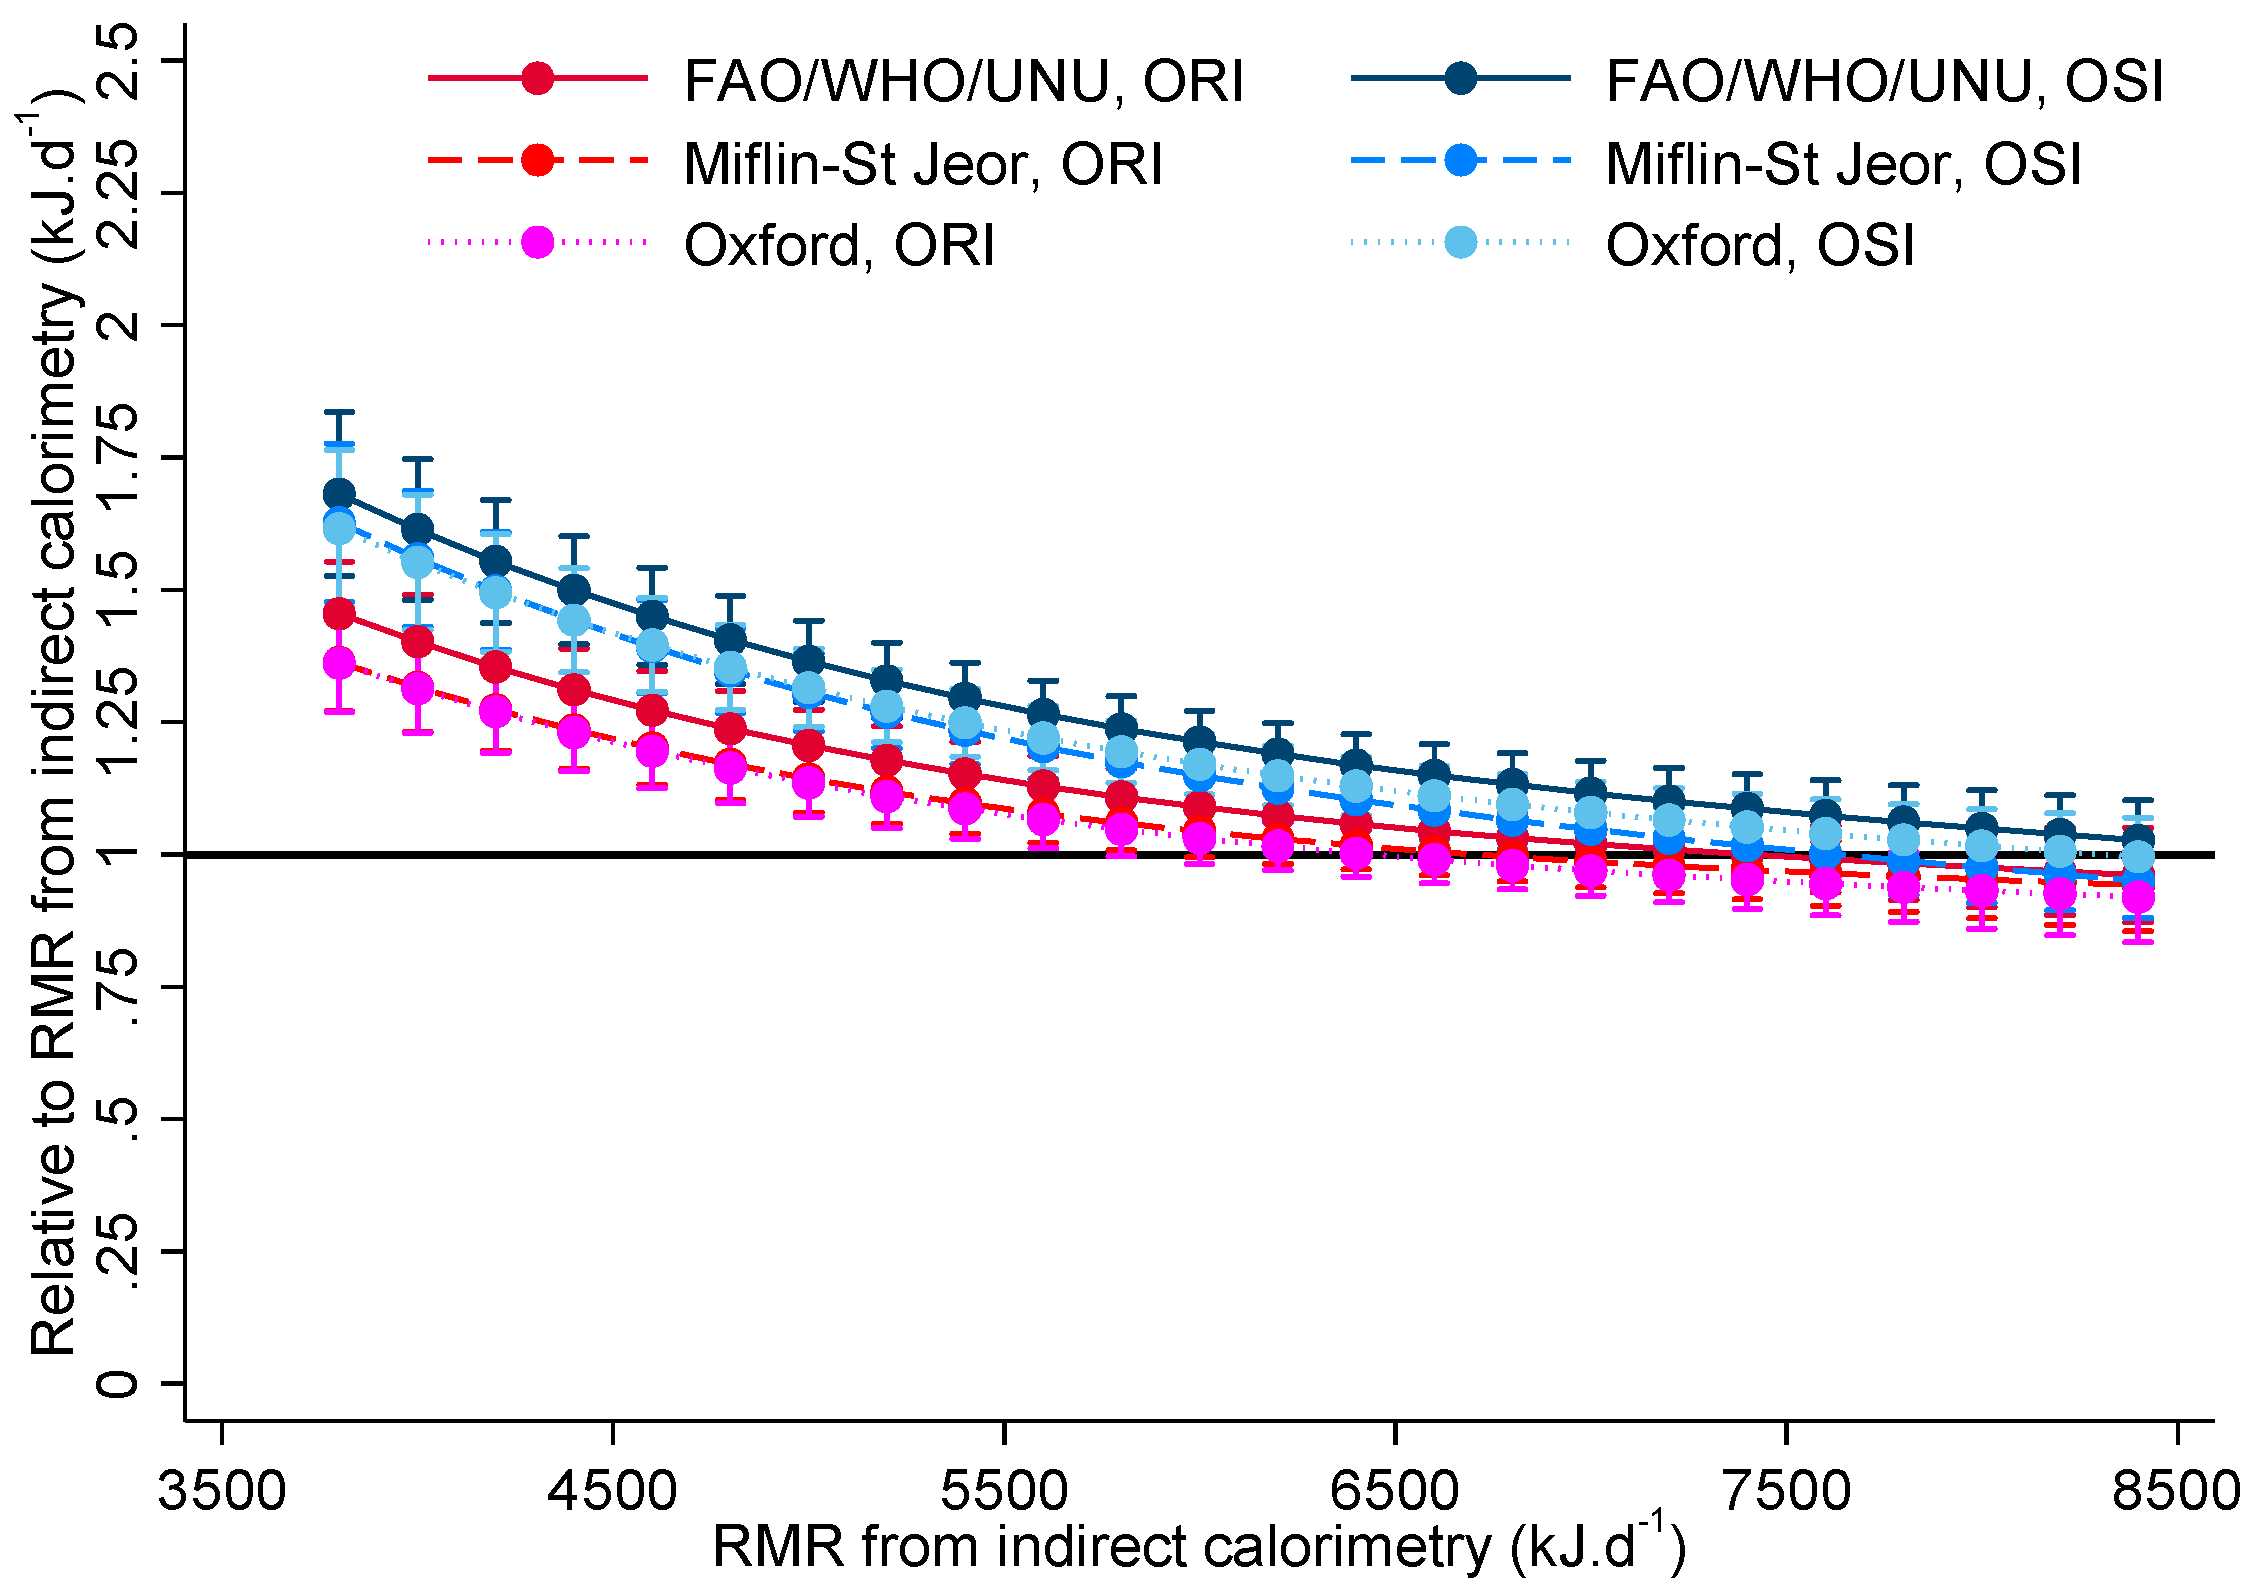
3.4. Resting Metabolic Rate (RMR)
4. Discussion
5. Conclusions
Acknowledgments
Author Contributions
Conflicts of Interest
Abbreviations
| % | percent |
| BMI | body mass index |
| BW | body weight |
| CHO | carbohydrate |
| CI | confidence interval |
| d | day |
| FAO/WHO/UNU | Food and Agricultural Organisation/World Health Organisation/United Nations University |
| FFM | fat-free mass |
| h | hour |
| MUFA | monounsaturated fatty acids |
| n | number |
| ORI | obesity resistant individuals |
| OSI | obesity susceptible individuals |
| PUFA | polyunsaturated fatty acids |
| RMR | resting metabolic rate |
| SD | standard deviation |
| SFA | saturated fatty acids |
| TEI | total energy intake |
| WC | waist circumference. |
References
- Harris, J.; Benedict, F. A Biometric Study of Basal Metabolism in Man; Carnegie Institute of Washington: Washington, DC, USA, 1919. [Google Scholar]
- Felig, P.; Cunningham, J.; Levitt, M.; Hendler, R.; Nadel, E. Energy expenditure in obesity in fasting and postprandial state. Am. J. Physiol. 1983, 244, 45–51. [Google Scholar]
- Hoffmans, M.; Pfeifer, W.A.; Gundlach, B.L.; Nijkrake, H.G.; Oude Ophuis, A.J.; Hautvast, J.G. Resting metabolic rate in obese and normal weight women. Int. J. Obes. 1979, 3, 111–118. [Google Scholar] [PubMed]
- James, W.P.; Davies, H.L.; Bailes, J.; Dauncey, M.J. Elevated metabolic rates in obesity. Lancet 1978, 1, 1122–1125. [Google Scholar] [CrossRef]
- Prentice, A.; Black, A.; Murgatroyd, P.; Goldberg, G.; Coward, W. Metabolism or appetite: Questions of energy balance with particular reference to obesity. J. Hum. Nutr. Diet. 1989, 2, 95–104. [Google Scholar] [CrossRef]
- Prentice, A.M.; Black, A.E.; Coward, W.A.; Cole, T.J. Energy expenditure in overweight and obese adults in affluent societies: An analysis of 319 doubly-labelled water measurements. Eur. J. Clin. Nutr. 1996, 50, 93–97. [Google Scholar] [PubMed]
- Ravussin, E.; Burnand, B.; Schutz, Y.; Jéquier, E. Twenty-four-hour energy expenditure and resting metabolic rate in obese, moderately obese, and control subjects. Am. J. Clin. Nutr. 1982, 35, 566–573. [Google Scholar] [PubMed]
- Karhunen, L.; Franssila-Kallunki, A.; Rissanen, A.; Kervinen, K.; Kesäniemi, Y.A.; Uusitupa, M. Determinants of resting energy expenditure in obese non-diabetic caucasian women. Int. J. Obes. Relat. Metab. Disord. 1997, 21, 197–202. [Google Scholar] [CrossRef] [PubMed]
- Owen, O.E.; Kavle, E.; Owen, R.S.; Polansky, M.; Caprio, S.; Mozzoli, M.A.; Kendrick, Z.V.; Bushman, M.C.; Boden, G. A reappraisal of caloric requirements in healthy women. Am. J. Clin. Nutr. 1986, 44, 1–19. [Google Scholar] [PubMed]
- Lam, Y.Y.; Ravussin, E. Indirect calorimetry: An indispensable tool to understand and predict obesity. Eur. J. Clin. Nutr. 2017, 71, 318–322. [Google Scholar] [CrossRef] [PubMed]
- Verga, S.; Buscemi, S.; Caimi, G. Resting energy expenditure and body composition in morbidly obese, obese and control subjects. Acta Diabetol. 1994, 31, 47–51. [Google Scholar] [CrossRef] [PubMed]
- Astrup, A.; Gøtzsche, P.C.; Van de Werken, K.; Ranneries, C.; Toubro, S.; Raben, A.; Buemann, B. Meta-analysis of resting metabolic rate in formerly obese subjects. Am. J. Clin. Nutr. 1999, 69, 1117–1122. [Google Scholar] [PubMed]
- Fothergill, E.; Guo, J.; Howard, L.; Kerns, J.C.; Knuth, N.D.; Brychta, R.; Chen, K.Y.; Skarulis, M.C.; Walter, M.; Walter, P.J.; et al. Persistent metabolic adaptation 6 years after “the biggest loser” competition. Obesity 2016, 24, 1612–1619. [Google Scholar] [CrossRef] [PubMed]
- Johannsen, D.L.; Knuth, N.D.; Huizenga, R.; Rood, J.C.; Ravussin, E.; Hall, K.D. Metabolic slowing with massive weight loss despite preservation of fat-free mass. J. Clin. Endocrinol. Metab. 2012, 97, 2489–2496. [Google Scholar] [CrossRef] [PubMed]
- Rosenbaum, M.; Leibel, R.L. Adaptive thermogenesis in humans. Int. J. Obes. 2010, 34 (Suppl. S1), 47–55. [Google Scholar] [CrossRef] [PubMed]
- Müller, M.J.; Bosy-Westphal, A. Adaptive thermogenesis with weight loss in humans. Obesity 2013, 21, 218–228. [Google Scholar] [CrossRef] [PubMed]
- Ravussin, E.; Swinburn, B. Metabolic predictors of obesity: Cross sectional versus longitudinal data. Int. J. Obes. Relat. Metab. Disord. 1993, 17 (Suppl. S3), 28–31. [Google Scholar]
- Frankenfield, D.; Roth-Yousey, L.; Compher, C. Comparison of predictive equations for resting metabolic rate in healthy nonobese and obese adults: A systematic review. J. Am. Diet. Assoc. 2005, 105, 775–789. [Google Scholar] [CrossRef] [PubMed]
- Hasson, R.E.; Howe, C.A.; Jones, B.L.; Freedson, P.S. Accuracy of four resting metabolic rate prediction equations: Effects of sex, body mass index, age, and race/ethnicity. J. Sci. Med. Sport 2011, 14, 344–351. [Google Scholar] [CrossRef] [PubMed]
- Weijs, P.J.M.; Vansant, G.A.A.M. Validity of predictive equations for resting energy expenditure in belgian normal weight to morbid obese women. Clin. Nutr. 2010, 29, 347–351. [Google Scholar] [CrossRef] [PubMed]
- Bonganha, V.; Libardi, C.A.; Santos, C.F.; De Souza, G.V.; Conceição, M.S.; Chacon-Mikahil, M.P.T.; Madruga, V.A. Predictive equations overestimate the resting metabolic rate in postmenopausal women. J. Nutr. Health Aging 2013, 17, 211–214. [Google Scholar] [CrossRef] [PubMed]
- Dietitians New Zealand Inc. 2016 Clinical Handbook; Gillanders, L., Ed.; Manor House Press: Wellington, New Zealand, 2016. [Google Scholar]
- Seagle, H.M.; Strain, G.W.; Makris, A.; Reeves, R.S. Position of the American Dietetic Association: Weight management. J. Am. Diet. Assoc. 2009, 109, 330–346. [Google Scholar] [PubMed]
- Sabounchi, N.S.; Rahmandad, H.; Ammerman, A. Best-fitting prediction equations for basal metabolic rate: Informing obesity interventions in diverse populations. Int. J. Obes. 2013, 37, 1364–1370. [Google Scholar] [CrossRef] [PubMed]
- Flack, K.D.; Siders, W.A.; Johnson, L.; Roemmich, J.N. Cross-validation of resting metabolic rate prediction equations. J. Acad. Nutr. Diet. 2016, 116, 1413–1422. [Google Scholar] [CrossRef] [PubMed]
- Kee, A.L.; Isenring, E.; Hickman, I.; Vivanti, A. Resting energy expenditure of morbidity obese patients using indirect calorimetry: A systematic review. Obes. Rev. 2012, 13, 753–765. [Google Scholar] [CrossRef] [PubMed]
- Psota, T.; Chen, K.Y. Measuring energy expenditure in clinical populations: Rewards and challenges. Eur. J. Clin. Nutr. 2013, 67, 436–442. [Google Scholar] [CrossRef] [PubMed]
- Henry, C.J.K. Basal metabolic rate studies in humans: Measurement and development of new equations. Public Health Nutr. 2005, 8, 1133–1152. [Google Scholar] [CrossRef] [PubMed]
- Daly, J.M.; Heymsfield, S.B.; Head, C.A.; Harvey, L.P.; Nixon, D.W.; Katzeff, H.; Grossman, G.D. Human energy requirements: overestimation by widely used prediction equation. Am. J. Clin. Nutr. 1985, 42, 1170–1174. [Google Scholar] [PubMed]
- Frankenfield, D.C. Bias and accuracy of resting metabolic rate equations in non-obese and obese adults. Clin. Nutr. 2013, 32, 976–982. [Google Scholar] [CrossRef] [PubMed]
- Marrades, M.P.; Martínez, J.A.; Moreno-Aliaga, M.J. Differences in short-term metabolic responses to a lipid load in lean (resistant) vs. obese (susceptible) young male subjects with habitual high-fat consumption. Eur. J. Clin. Nutr. 2007, 61, 166–174. [Google Scholar] [CrossRef] [PubMed]
- Brown, R.C.; McLay-Cooke, R.T.; Richardson, S.L.; Williams, S.M.; Grattan, D.R.; Chisholm, A.W.A. Appetite response among those susceptible or resistant to obesity. Int. J. Endocrinol. 2014. [Google Scholar] [CrossRef] [PubMed]
- Brown, R.C.; McLay-Cooke, R.; Gray, A.R.; Tey, S.L. Oral fatty acid sensitivity among obesity resistant and obesity susceptible individuals. Clin. Nutr. Diet. 2015, 1, 1–5. [Google Scholar]
- Stewart, A.; Marfell-Jones, M.; Olds, T.; De Ridder, H. International Standards for Anthropometric Assessment; The International Society for the Advancement of Kinanthropometry: Wellington, New Zealand, 2011. [Google Scholar]
- Compher, C.; Frankenfield, D.; Keim, N.; Roth-Yousey, L.; Group, E.A.W. Best practice methods to apply to measurement of resting metabolic rate in adults: A systematic review. J. Am. Diet. Assoc. 2006, 106, 881–903. [Google Scholar] [CrossRef] [PubMed]
- Barr, S.I.; Janelle, K.C.; Prior, J.C. Energy intakes are higher during the luteal phase of ovulatory menstrual cycles. Am. J. Clin. Nutr. 1995, 61, 39–43. [Google Scholar] [PubMed]
- Bisdee, J.T.; James, W.P.; Shaw, M.A. Changes in energy expenditure during the menstrual cycle. Br. J. Nutr. 1989, 61, 187–199. [Google Scholar] [CrossRef] [PubMed]
- Tai, M.M.; Castillo, T.P.; Pi-Sunyer, F.X. Thermic effect of food during each phase of the menstrual cycle. Am. J. Clin. Nutr. 1997, 66, 1110–1115. [Google Scholar] [PubMed]
- Weir, J.B.D.B. New methods for calculating metabolic rate with special reference to protein metabolism. J. Physiol. 1949, 109, 1–9. [Google Scholar] [CrossRef] [PubMed]
- Reeves, M.M.; Davies, P.S.W.; Bauer, J.; Battistutta, D. Reducing the time period of steady state does not affect the accuracy of energy expenditure measurements by indirect calorimetry. J. Appl. Physiol. 2004, 97, 130–134. [Google Scholar] [CrossRef] [PubMed]
- FAO/WHO/UNU (Food and Agricultural Organisation/World Health Organisation/United Nations University). Energy and Protein Requirements; WHO Technical Report Series No. 724; World Health Organisation: Geneva, Switzerland, 1985. [Google Scholar]
- Mifflin, M.D.; St Jeor, S.T.; Hill, L.A.; Scott, B.J.; Daugherty, S.A.; Koh, Y.O. A new predictive equation for resting energy expenditure in healthy individuals. Am. J. Clin. Nutr. 1990, 51, 241–247. [Google Scholar] [PubMed]
- MeterPlus–Software Support for Actical. Available online: www.meterplussoftware.com (accessed on 5 September 2017).
- Troiano, R.P.; Berrigan, D.; Dodd, K.W.; Mâsse, L.C.; Tilert, T.; Mcdowell, M. Physical activity in the United States measured by accelerometer. Med. Sci. Sports Exerc. 2008, 40, 181–188. [Google Scholar] [CrossRef] [PubMed]
- Colley, R.C.; Garriguet, D.; Janssen, I.; Craig, C.L.; Clarke, J.; Tremblay, M.S. Physical activity of Canadian adults: Accelerometer results from the 2007 to 2009 Canadian Health Measures Survey. Health Rep. 2011, 22, 7–14. [Google Scholar] [PubMed]
- Wong, S.L.; Colley, R.; Connor Gorber, S.; Tremblay, M. Actical accelerometer sedentary activity thresholds for adults. J. Phys. Act. Health 2011, 8, 587–591. [Google Scholar] [CrossRef] [PubMed]
- Colley, R.C.; Tremblay, M.S. Moderate and vigorous physical activity intensity cut-points for the Actical accelerometer. J. Sport Sci. 2011, 29, 783–789. [Google Scholar] [CrossRef] [PubMed]
- Department of Human Nutrition, University of Otago. Kai-Culator [v1.08] Including Foodfiles 2010v2; University of Otago: Dunedin, New Zealand, 2013. [Google Scholar]
- Gibson, R. Validity in dietary assessment methods. In Principles of Nutritional Assessment; Oxford University Press: Oxford, UK, 2005; pp. 149–196. [Google Scholar]
- Heymsfield, S.B.; Thomas, D.; Bosy-Westphal, A.; Shen, W.; Peterson, C.M.; Müller, M.J. Evolving concepts on adjusting human resting energy expenditure measurements for body size. Obes. Rev. 2012, 13, 1001–1014. [Google Scholar] [CrossRef] [PubMed]
- Pennington Biomedical Research. Weight Loss Predictor; Louisianna State University: Baton Rouge, LA, USA; Available online: http://www.pbrc.edu/research-and-faculty/calculators/weight-loss-predictor/ (accessed on 26 October 2016).
- Thomas, D.M.; Martin, C.K.; Heymsfield, S.; Redman, L.M.; Schoeller, D.A.; Levine, J.A. A simple model predicting individual weight change in humans. J. Biol. Dyn 2011, 5, 579–599. [Google Scholar] [CrossRef] [PubMed]
- Zurlo, F.; Lillioja, S.; Esposito-Del Puente, A.; Nyomba, B.L.; Raz, I.; Saad, M.F.; Swinburn, B.A.; Knowler, W.C.; Borgardus, C.; Ravussin, E. Low ratio of fat to carbohydrate oxidation as predictor of weight gain: Study of 24-h RQ. Am. J. Physiol. 1990, 259, 650–657. [Google Scholar]
- Livingstone, M.B.E.; Black, A.E. Markers of the validity of reported energy intake. J. Nutr. 2003, 133 (Suppl. S3), 895–920. [Google Scholar]
- Poslusna, K.; Ruprich, J.; De Vries, J.H.M.; Jakubikova, M.; Van’t Veer, P. Misreporting of energy and micronutrient intake estimated by food records and 24 hour recalls, control and adjustment methods in practice. Br. J. Nutr. 2009, 101 (Suppl. S2), 73–85. [Google Scholar] [CrossRef] [PubMed]
- Myfitnesspal. BMR Calculator. Available online: http://myfitnesspal.com/tools/bmr-calculator (accessed on 1 May 2017).
- Nutrino. Nutrino Explains: How We Really Calculate Your Breakdown. Available online: https://nutrino.co/nutrino-tell-all-how-we-really-calculate-your-break (accessed on 1 May 2017).
- Fitday. Free Diet and Weight Loss Journal. Available online: www.fitday.com/fitness-articles/fitness/equipment/calculating-basal-metabolic-rate-and-body-temperature.html (accessed on 1 May 2017).
- Perez, S. Under Armour Snatches Up Health and Fitness Trackers Endomondo and myfitnesspal. Available online: http://social.techcrunch.com/2015/02/04/athletic-apparel-company-under-armour-snathces-up-health-and-fitness-trackers-endomondo-and-myfitnesspal (accessed on 1 May 2017).
- FITDAY. Available online: www.fitday.com (accessed on 5 September 2017).
- Manini, T.M. Energy expenditure and aging. Ageing Res. Rev. 2010, 9, 1–11. [Google Scholar] [CrossRef] [PubMed]
- Speakman, J.R.; Selman, C. Physical activity and resting metabolic rate. Proc. Nutr. Soc. 2003, 62, 621–634. [Google Scholar] [CrossRef] [PubMed]
- Stiegler, P.; Cunliffe, A. The role of diet and exercise for the maintenance of fat-free mass and resting metabolic rate during weight loss. Sports Med. 2006, 36, 239–262. [Google Scholar] [CrossRef] [PubMed]

| Statements for OSI | Statements for ORI |
|---|---|
| 1. I am a person who needs to eat small amounts of food to manage my weight | 1. I am a person who can eat whatever I like without gaining weight |
| 2. I am a person who gains weight easily | 2. I am a person who loses weight easily |
| 3. I am a person who maintains my weight easily | |
| 4. I am a person who finds it difficult to put on weight |
| Variable | OSI (n = 26) | ORI (n = 30) | p-Value |
|---|---|---|---|
| Sex | |||
| Female | 14 (54%) | 14 (47%) | |
| Male | 12 (46%) | 16 (53%) | 0.592 a |
| Age * | 35.6 (8.1) | 32.4 (7.8) | 0.135 b |
| Anthropometrics | |||
| Height (m) * | 1.70 (0.10) | 1.70 (0.10) | 0.322 b |
| Weight (kg) * | 89.5 (14.0) | 66.0 (12.4) | <0.001 b |
| BMI (kg/m2) ¶ | 29.9 (26.5, 33.2) | 21.5 (19.7, 23.2) | <0.001 c |
| WC (cm) ¶ | 98.2 (87.3, 106.3) | 77.8 (71.8, 81.8) | <0.001 c |
| Body Composition | |||
| Fat Mass (kg) ¶ | 30.7 (23.9, 38.3) | 12.7 (9.0, 16.0) | <0.001 c |
| FFM (kg) ¶ | 51.9 (45.0, 62.2) | 47.8 (38.4, 58.1) | 0.153 c |
| Percentage Body Fat (%) ¶ | 35.2 (27.2, 43.9) | 21.8 ((13.8, 24.6) | <0.001 c |
| Physical Activity | |||
| Sedentary (h·d−1) ¶ | 10.7 (9.8, 11.1) | 11.2 (9.9, 12.0) | 0.238 c |
| Light (h·d−1) ¶ | 3.5 (3.0, 3.7) | 3.0 (2.5, 3.7) | 0.207 c |
| Moderate (h·d−1) ¶ | 0.5 (0.4, 0.8) | 0.6 (0.4, 0.9) | 0.341 c |
| Vigorous (h·d−1) ¶ | 0.0 (0.0, 0.2) | 0.2 (0.0, 0.4) | 0.070 c |
| Dietary Intake | |||
| Energy (kJ·d−1) ¶ | 9803 (8379, 12,203) | 11467 (9581, 12,913) | 0.119 c |
| Energy (kJ·kgBW−1·d−1) ¶ | 121 (100, 132) | 172 (149, 196) | <0.001 c |
| Protein (%TEI) ¶ | 17.6 (15.3, 19.3) | 15.6 (13.7, 17.8) | 0.152 c |
| Fat (%TEI) ¶ | 32.3 (27.8, 35.4) | 34.2 (29.9, 37.1) | 0.359 c |
| CHO (%TEI) ¶ | 46.4 (42.2, 50.0) | 47.6 (44.6, 50.2) | 0.340 c |
| SFA (%TEI) ¶ | 12.0 (10.4, 15.5) | 12.7 (10.9, 15.7) | 0.646 c |
| MUFA (%TEI) ¶ | 11.5 (9.2, 12.9) | 12.1 (10.4, 13.6) | 0.313 c |
| PUFA (%TEI) ¶ | 4.5 (3.7, 6.1) | 4.7 (4.0, 5.7) | 0.883 c |
| Sugar (%TEI) ¶ | 21.3 (16.2, 25.7) | 20.1 (18.7, 24.4) | 0.985 c |
| Alcohol (%TEI) ¶ | 0.1 (0.0, 3.9) | 0.0 (0.0, 1.2) | 0.138 c |
| Eating Frequency | |||
| Eating Occasions (n·d−1) ¶ | 4.4 (3.5, 4.9) | 4.5 (3.9, 5.6) | 0.156 c |
| Weight History | |||
| Weight loss attempts 0 | 8 (31%) | 26 (87%) | <0.001 d |
| 1 | 3 (12%) | 2 (7%) | |
| 2–3 | 9 (35%) | 1 (3%) | |
| 4–9 | 4 (15%) | 1 (3%) | |
| 10+ | 2 (8%) | 0 (0%) | |
| Weight gain attempts 0 | 26 (100%) | 16 (53%) | <0.001 e |
| 1 | 0 (0%) | 9 (30%) | |
| 2 | 0 (0%) | 5 (17%) | |
| Lightest weight (kg) * 67.7 (10.7) | 59.9 (13.0) | 0.020 b | |
| Heaviest weight (kg) * 96.9 (17.5) | 70.1 (13.5) | <0.001 b | |
| Individual weight fluctuation (kg) ¶ 25.0 (14.0, 38.0) | 8.0 (6.0, 13.0) | <0.001 c | |
| RMR (indirect calorimetry) | |||
| Absolute (kJ·d−1) * | 6339 (1752) | 5893 (1520) | 0.313 b |
| RMR (prediction equations) | |||
| FAO/WHO/UNU (kJ·d−1) * | 7545 (1109) | 6609 (1103) | 0.003 b |
| Miflin-St Jeor (kJ·d−1) * | 7108 (906) | 6334 (1110) | 0.007 b |
| Oxford (kJ·d−1) * | 7291 (1100) | 6253 (1080) | <0.001 b |
| Estimated RMR from Indirect Calorimetry (kJ·d−1) | Difference between OSI and ORI for FAO/WHO/UNU | p-Value | Difference between OSI and ORI for Oxford | p-Value | Difference between OSI and ORI for Miflin-St Jeor | p-Value |
|---|---|---|---|---|---|---|
| 2000 | 1.19 (1.00, 1.42) | 0.052 | 1.23 (1.03, 1.47) | 0.021 | 1.27 (1.07, 1.52) | 0.007 |
| 3000 | 1.17 (1.02, 1.34) | 0.025 | 1.21 (1.05, 1.38) | 0.008 | 1.23 (1.07, 1.41) | 0.003 |
| 4000 | 1.15 (1.04, 1.28) | 0.007 | 1.18 (1.07, 1.31) | 0.001 | 1.18 (1.07, 1.31) | 0.001 |
| 5000 | 1.13 (1.05, 1.22) | 0.001 | 1.16 (1.08, 1.25) | <0.001 | 1.14 (1.06, 1.23) | <0.001 |
| 6000 | 1.11 (1.05, 1.18) | <0.001 | 1.14 (1.07, 1.20) | <0.001 | 1.10 (1.04, 1.17) | 0.001 |
| 7000 | 1.09 (1.02, 1.17) | 0.012 | 1.11 (1.04, 1.19) | 0.003 | 1.06 (0.99, 1.14) | 0.094 |
| 8000 | 1.08 (0.97, 1.19) | 0.149 | 1.09 (0.99, 1.20) | 0.084 | 1.02 (0.93, 1.13) | 0.646 |
| 9000 | 1.06 (0.92, 1.21) | 0.415 | 1.07 (0.94, 1.22) | 0.325 | 0.99 (0.86, 1.13) | 0.845 |
| 10,000 | 1.04 (0.88, 1.24) | 0.658 | 1.05 (0.88, 1.25) | 0.589 | 0.95 (0.80, 1.13) | 0.569 |
| 11,000 | 1.02 (0.83, 1.26) | 0.839 | 1.03 (0.83, 1.27) | 0.798 | 0.92 (0.74, 1.13) | 0.422 |
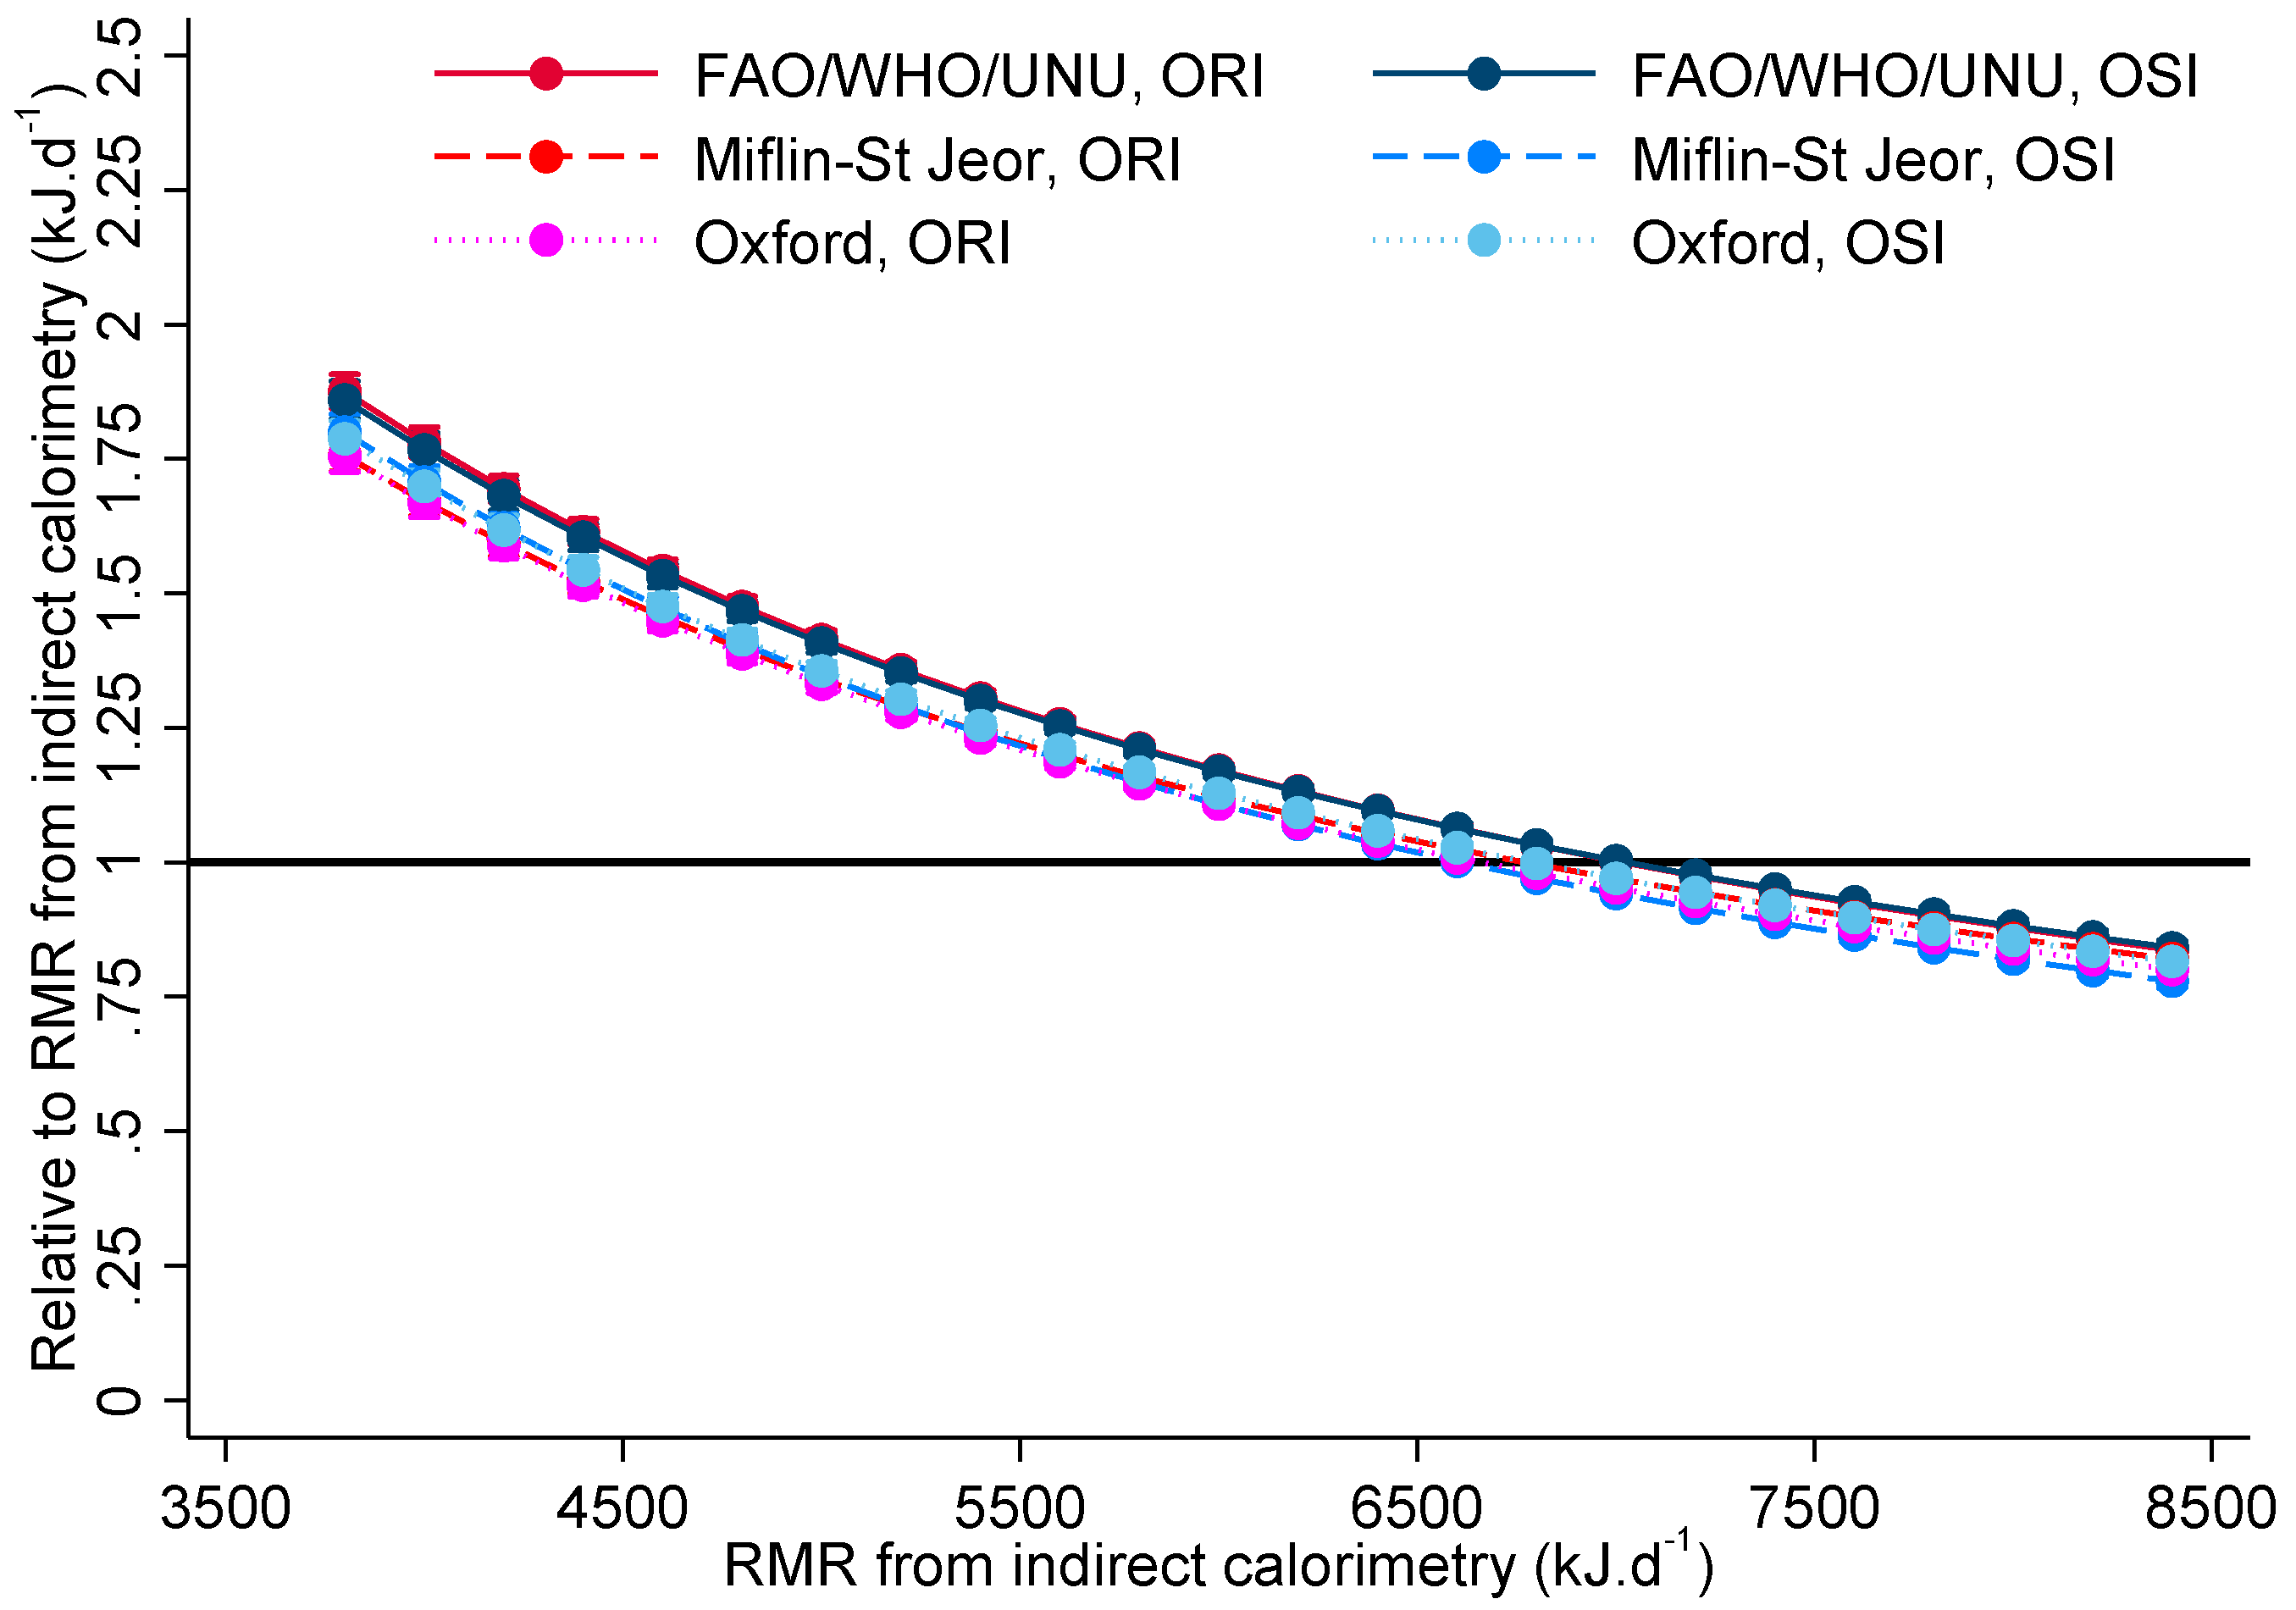
| Estimated RMR from Indirect Calorimetry (kJ·d−1) | Difference between OSI and ORI for FAO/WHO/UNU | p-Value | Difference between OSI and ORI for Oxford | p-Value | Difference between OSI and ORI for Miflin-St Jeor | p-Value |
|---|---|---|---|---|---|---|
| 2000 | 0.99 (0.95, 1.02) | 0.489 | 1.02 (0.98, 1.06) | 0.310 | 1.06 (1.02, 1.09) | 0.004 |
| 3000 | 0.99 (0.96, 1.02) | 0.493 | 1.02 (0.99, 1.05) | 0.213 | 1.04 (1.01, 1.07) | 0.013 |
| 4000 | 0.99 (0.97, 1.02) | 0.512 | 1.02 (1.00, 1.04) | 0.112 | 1.02 (1.00, 1.05) | 0.068 |
| 5000 | 1.00 (0.98, 1.01) | 0.576 | 1.02 (1.00, 1.04) | 0.040 | 1.01 (0.99, 1.02) | 0.569 |
| 6000 | 1.00 (0.98, 1.01) | 0.757 | 1.02 (1.00, 1.03) | 0.016 | 0.99 (0.97, 1.00) | 0.139 |
| 7000 | 1.00 (0.98, 1.02) | 0.968 | 1.02 (1.00, 1.03) | 0.030 | 0.97 (0.96, 0.99) | 0.001 |
| 8000 | 1.00 (0.98, 1.02) | 0.778 | 1.02 (1.00, 1.04) | 0.097 | 0.96 (0.94, 0.98) | <0.001 |
| 9000 | 1.01 (0.98, 1.03) | 0.682 | 1.02 (0.99, 1.05) | 0.208 | 0.94 (0.92, 0.97) | <0.001 |
| 10,000 | 1.01 (0.97, 1.04) | 0.633 | 1.02 (0.98, 1.05) | 0.325 | 0.93 (0.90, 0.96) | <0.001 |
| 11,000 | 1.01 (0.97, 1.05) | 0.605 | 1.02 (0.98, 1.06) | 0.425 | 0.91 (0.87, 0.95) | <0.001 |
© 2017 by the authors. Licensee MDPI, Basel, Switzerland. This article is an open access article distributed under the terms and conditions of the Creative Commons Attribution (CC BY) license (http://creativecommons.org/licenses/by/4.0/).
Share and Cite
McLay-Cooke, R.T.; Gray, A.R.; Jones, L.M.; Taylor, R.W.; Skidmore, P.M.L.; Brown, R.C. Prediction Equations Overestimate the Energy Requirements More for Obesity-Susceptible Individuals. Nutrients 2017, 9, 1012. https://doi.org/10.3390/nu9091012
McLay-Cooke RT, Gray AR, Jones LM, Taylor RW, Skidmore PML, Brown RC. Prediction Equations Overestimate the Energy Requirements More for Obesity-Susceptible Individuals. Nutrients. 2017; 9(9):1012. https://doi.org/10.3390/nu9091012
Chicago/Turabian StyleMcLay-Cooke, Rebecca T., Andrew R. Gray, Lynnette M. Jones, Rachael W. Taylor, Paula M. L. Skidmore, and Rachel C. Brown. 2017. "Prediction Equations Overestimate the Energy Requirements More for Obesity-Susceptible Individuals" Nutrients 9, no. 9: 1012. https://doi.org/10.3390/nu9091012