Distribution of Gb3 Immunoreactivity in the Mouse Central Nervous System

Department of Microbiology and Immunology, University of Maryland School of Medicine, 685 W. Baltimore St. HSFI suite 380, Baltimore, MD 21201, USA
*
Author to whom correspondence should be addressed.
Toxins 2010, 2(8), 1997-2006; https://doi.org/10.3390/toxins2081997
Submission received: 25 June 2010
/
Accepted: 1 August 2010
/
Published: 4 August 2010
(This article belongs to the Special Issue Novel Properties of Well-Characterized Toxins)
Abstract
:We have shown previously that neurons in the mouse spinal cord express Gb3. We show in this article that distribution of anti-Gb3-Ab reactivity occurs in many different types of neurons of different areas of the central nervous system (CNS). The immunoreactive neurons are in olfactory bulbs, cerebral cortex, hippocampus, striatum, amygdala, thalamus, hypothalamus, cerebellum, and medulla oblongata. In several different circumventricular organs where vessels do not have the blood-brain-barrier (BBB) structure, anti-Gb3-Ab is not positive for vessel structures, while neurons at these regions are positive. Also, within the ventricular area, ependymal cells in the third ventricle express Gb3, as revealed by anti-Gb3-Ab staining and intensity analysis.
1. Introduction
In Shiga-toxin producing Escherichia coli (STEC) infections, a broad spectrum of central nervous system (CNS) symptoms occurs (abbreviations used in this article are listed in Table 1). Those symptoms include cortical blindness, poor fine-motor coordination, seizures and coma [1,2,3,4,5,6,7,8,9,10,11,12,13]. Globotriaosylceramide (Gb3) is a known receptor of Shiga toxin (Stx), which is central to the intoxication and disease process [14]. It has been shown that a Gb3 knockout mouse is resistant to Stx [15]. To understand target components within the CNS, determining which cell types express Gb3 is essential. Previously, we reported that in the mouse CNS, Shiga toxin-2 acts on spinal cord neurons which express Gb3, and leads to hindlimb paralysis [16]. Other mouse CNS cell types expressing Gb3 have not been described in detail.

| Abbreviation | Abbreviated Term |
|---|---|
| AP | Area postrema (e) |
| ARH | Arcuate nucleus of hypothalamus (c) |
| BBB | Blood-brain-barrier |
| BLA | Basolateral nucleus of the amygdala (c) |
| CNS | Central nervous system |
| CP | Caudate-putamen (a) |
| CSF | Cerebro-spinal fluid |
| CVO | Circumventricular organs |
| DMX | Dorsal motor nucleus of the vagus (e) |
| ec | External capsule (c) |
| MD | Mediodorsal nucleus of the thalamus (d) |
| ME | Median eminence (c) |
| MH | Medial habenula (d) |
| NTS | Nucleus of the solitary tract (e) |
| OVLT | Organum vasculosum of the lamina terminalis (b) |
| PVT | Paraventricular nucleus of the thalamus (d) |
| SCO | Subcommissural organ |
| SFO | Subfornical organ (d) |
| V3 | Third ventricle |
| V4 | Fourth ventricle |
| VL | Lateral ventricle |
| XII | Hypoglossal nucleus (e) |
The trafficking route of Stx into the CNS is as important as determining its target. In human STEC patients’ brain magnetic resonance imaging (MRI), regions as the basal ganglia and also thalamus, cerebellum and brain stem, are found positive for increased permeability of fluid [17,18,19,20]. In a rabbit model, MRI showed enhanced permeability in the area surrounding V3 after Stx injections [21]. However, precise Stx trafficking routes and the mechanisms involved are still in question. Circumventricluar organs (CVO) are known to be devoid of the blood-brain-barrier (BBB), thus exchange of substances between the plasma and the CNS parenchyma is relatively easy [22]. The CVO is situated around the V3 (OVLT, SFO, ME, posterior pituitary, pineal gland and SCO) as well as the V4 (AP). Also, the choroid plexus located at both V3 and V4, is sometimes considered as the CVO. If the vessels at the CVO are expressing Gb3, it may increase the chance of being the primary target in the CNS. In this article, Gb3 expression in the CVO is addressed. Ependymal cells form a lining of the ventricle, which separates cerebro-spinal fluid (CSF) and parenchyma. As the choroid plexus makes CSF from serum and secretes it into the ventricles, there is a possibility of Stx2 in serum being transferred to the ventricle. If ependymal cells express Gb3, this also could be an entry point of Stx into the CNS parenchyma.
2. Materials and Methods
2.1. Animals
Specific pathogen-free C57BL/6 mice, male, 20–22 g body weight (b.w.) were purchased from Charles River (Wilmington, MA, USA). Mice were given food and water ad libitum. All procedures were approved by the University of Maryland School of Medicine Animal Care and Use Committee. A total of 5 mice were used in this study.
2.2. Tissue Harvesting
Mice were euthanized by CO2 inhalation. Two mice were perfused with 20 mL saline, followed by 20 mL 4% paraformaldehyde/phosphate buffered saline (4% PFA/PBS). Brains were marked for the Bregma position (the crossing point of the coronal suture and the sagittal suture on the skull) with a knife incision. Brains and spinal cords were harvested, and further fixed in 4% PFA/PBS overnight at room temperature. Brains and spinal cords from 3 mice were fixed in the same manner without perfusion. Brains were trimmed to 2 mm thickness from the Bregma to both rostral and caudal ends. Spinal cords were trimmed into cervical, thoracic and lumbar segments. After incubating in 30% sucrose/PBS at 4 °C overnight, trimmed segments were sectioned to 50 μm thickness using a sliding microtome (SM2000R, Leica Microsystems, Bannockburn, IL, USA). The positions of brain sections from the Bregma was determined with reference to a C57BL/6 brain atlas [23]. Sections were collected and held in PBS at 4 °C until use.
2.3. Immunofluorescence Staining of Free-Floating Sections
Staining was done according to Obata et al. [16] and Kolling et al. [24]. Antibodies used in this study were anti-Gb3 monoclonal antibody (MAb) (Beckman Coulter, Brea, CA, USA), anti-NeuN MAb (a neuronal marker, Millipore, Billerica, MA, USA) and Cy3 conjugated anti-GFAP MAb (an astrocytic marker, Sigma-Aldrich, St. Louis, MO, USA), at dilutions of 1:100, 1:1000, and 1:1000, respectively. For isotype matched controls, rat IgM (Millipore) and mouse IgG1 (Millipore) were used at dilutions of 1:100 and 1:100, respectively. 4’,6-Diamidino-2-phenylindole (DAPI) was used to visualize nuclei. A Zeiss LSM510 microscope (Carl Zeiss Inc., Thornwood, NY, USA) was utilized in this study.
2.4. Intensity Analysis of Anti-Gb3 Immunofluorescence
For line profile intensity analysis, a LSM510 software line profile function was used. Within one image, a fixed length line was used to collect intensity data. Three intensity samples of neuronal and ependymal cytoplasm were collected per image. Appearance of high intensity of 2000 or higher was expressed as percentage of total data collected from the line profile. The VL, V3 and central canal regions were analyzed. Six images from each area were taken randomly from 3 mice, which were selected from a total of 5 mice (either perfuse-fixed or none perfuse-fixed). Averages of high intensity (%) between neurons and ependymal cells were compared. For area intensity analysis, Image-Pro Plus software (MediaCybernetics, Inc., Silver Spring, MD, USA) was used. The image acquired by LSM510 was saved as Tagged Image File Format (TIFF) in RGB, and only green channel (Gb3-AlexaFluor488) was retained in the image using Adobe Photoshop 7.0 (Adobe Systems Inc., San Jose, CA, USA). The TIFF image was converted to Gray scale, and a fixed area (μm2) of region of interest (ROI) was made using Image-Pro Plus. The intensity range higher than background pixels was chosen, and 3 ROI areas within neuronal or ependymal cytoplasm per image were taken as intensity samples. The equivalent regions and number of samples comparable to those used in the Line profile intensity analysis were analyzed by the area intensity analysis method. Averages of ROI areas between neurons and ependymal cells were compared.
2.5. Statistics
Data from line profile or area intensity analysis were analyzed by student t-test (paired two-tail test), and p-values less than 0.01 were determined as significant.
3. Results and Discussion
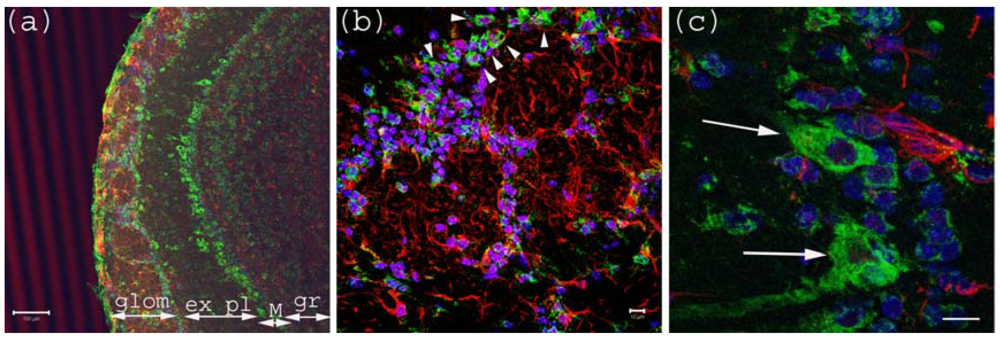
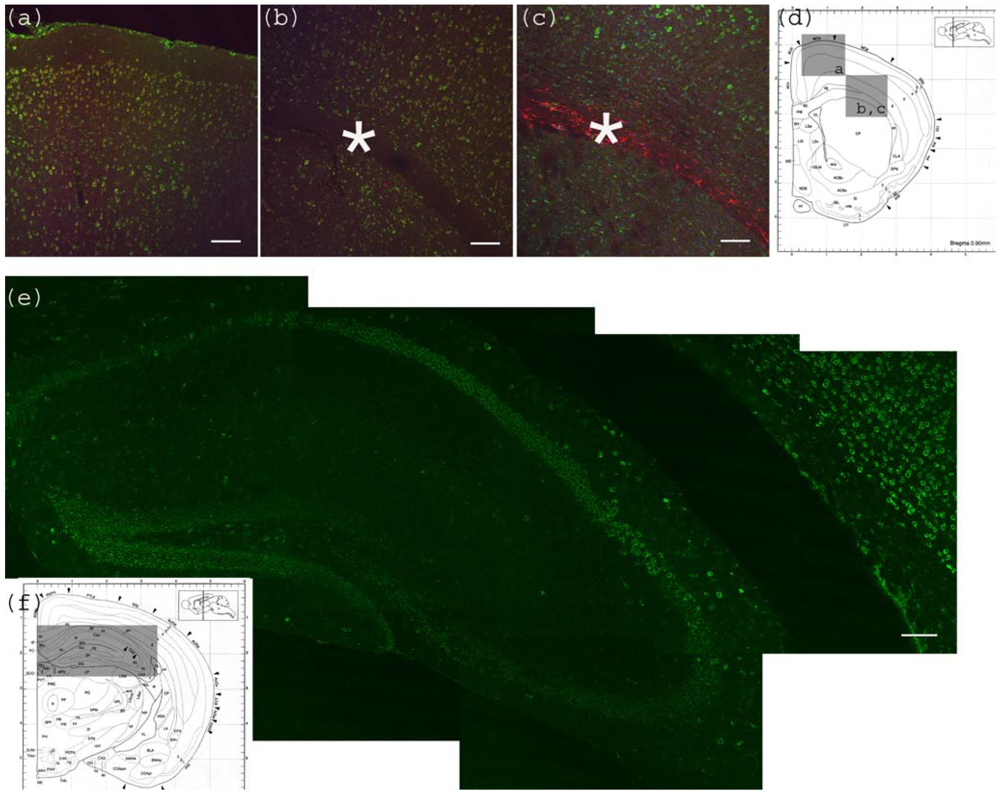
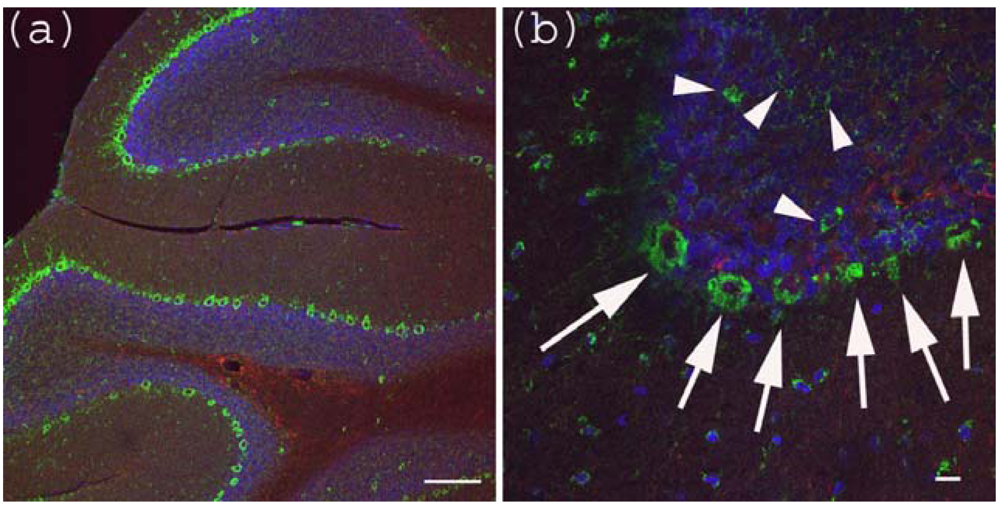
Anti-Gb3-Ab reactive neurons were seen throughout the mouse CNS. In the olfactory bulb, where Mitral cells accept input from nasal epithelium cells to sense smell, and interneurons such as periglomerular cells and granule cells reside, all neurons were Gb3 positive (Figure 1). In the cerebrum, neurons in the cortex, including motor cortex were also Gb3 positive (Figure 2a). Astrocytes in the corpus callosum which is close to the cerebral cortex were Gb3 negative (Figure 2b,c). Hippocampus neurons, CA1, 2, 3 and dentate gyrus, were Gb3 positive (Figure 2e). Also, the neurons in the striatum (Figure 2b), amygdala (Figure 4i), thalamus (Figure 4e) and hypothalamus were Gb3 positive. The hypothalamic nuclei (ARH) neurons are shown to be Gb3 positive in Figure 4c. In the cerebellum, Perkinje cells as well as granule cells were also Gb3 positive (Figure 3). Neurons throughout the mouse CNS appeared to express Gb3, hence, depending on the CNS entry site of Stx, all these neurons could become targets of the toxin.
Figure 1.
Anti-Gb3-Ab staining of Olfactory bulb. (a) Olfactory bulb sections stained with anti-Gb3-Ab (Green), and anti-GFAP-Ab (Red) and DAPI (Blue). Glomerular layer (glom), external plexiform (ex pl), Mitral cell layer (M) and granular layer (gr) are visible as neurons are stained anti-Gb3. Bar indicates 100 μm. (b) High magnification of glomerular layer. Arrowheads point to anti-Gb3-Ab reactive periglomerular neurons. Bar indicates 10 μm. (c) High magnification of Mitral cell layer. Arrows show anti-Gb3-Ab positive Mitral cells. Bar indicates 10 μm.

Figure 2.
Anti-Gb3-Ab staining of cerebrum. (a) Motor cortex region showing anti-Gb3 stain (Green) in 2-6 layers of neurons, which are also positive for neuron specific anti-NeuN-Ab (Red). Position of the image corresponding to the Bregma 0.90 mm is shown in (d) as a square. (b) Corpus callosum region of the same section is shown. Astrocyte rich corpus callosum (*) is anti-Gb3 and anti-NeuN negative. Lowerleft area to corpus callosum is striatum (CP). Note that neurons of this area are also positive for anti-Gb3 Ab. Bar indicates 100 μm. (c) Corpus callosum region is stained with anti-Gb3-Ab (Green) and anti-GFAP-Ab (an astrocytic marker, Red). Contrast of GFAP (Red) positive layer versus cortex neurons (Green) is clear. Bar indicates 100 m. (d) Coronal architectural positions at Bregma 0.90 mm is shown with indication of images (a), (b) and (c) in squares. (e) Hippocampus region is shown with anti-Gb3-Ab (Green) stain. Neuronal layers of CA1, 2, 3 and dentate gyras are anti-Gb3 positive. Area in (e) is shown as a rectangle in (f). Bar indicates 100 m. (f) Coronal section architecture at Bregma −2.40 mm is shown. (d) and (f) are modified from [23].

Figure 3.
Anti-Gb3-Ab staining of cerebellum. (a) Cerebellum sections were stained with anti-Gb3 Ab (Green), anti-GFAP-Ab (Red) and DAPI (Blue). Perkinje layer is shown reactive to anti-Gb3-Ab. Bar indicates 100 μm. (b) Higher magnification of (a). Arrows indicate anti-Gb3-Ab positive Perkinje cells, while arrowheads indicate anti-Gb3-Ab positive neurons in the granule layer. Bar indicates 10 μm.

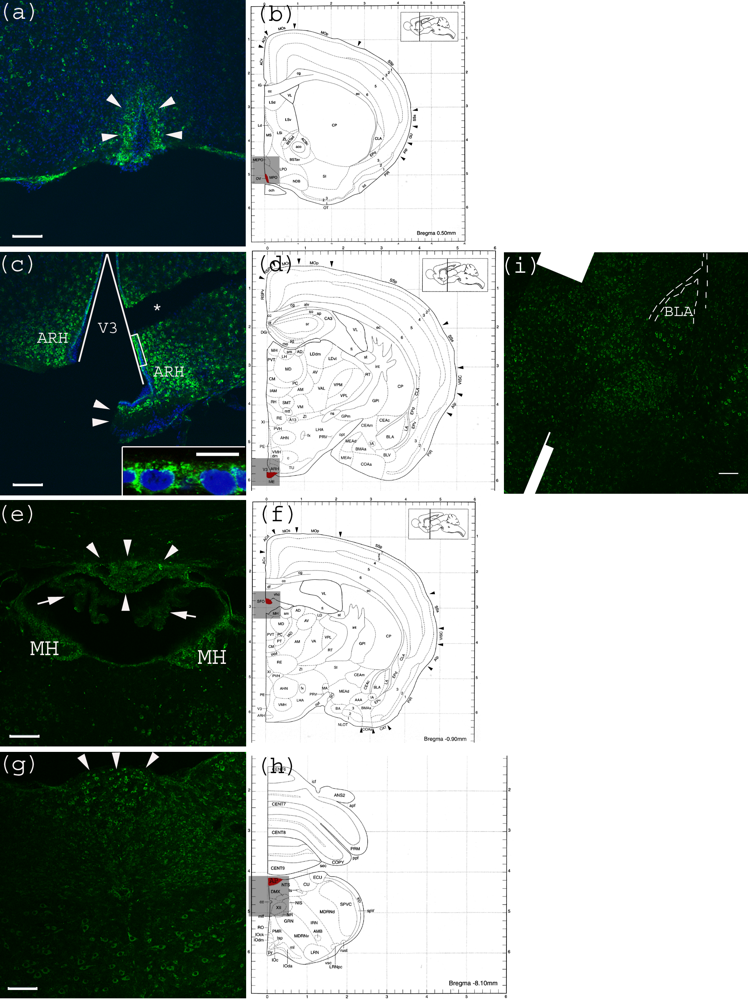
CVO areas in the mouse CNS were also tested for anti-Gb3-Ab reactivity. Within the tested CVO areas, none appeared to have a Gb3 expressing vessel structure. In contrast, neurons of these areas were positive for Gb3. In the OVLT, neurons which have characteristic large nuclei, were shown to be Gb3 positive (Figure 4a). In Figure 4c, the lining of V3 consisting of ependymal cells appears positive for Gb3. In Figure 4e, neurons in the SFO, as well as MH are Gb3 positive, while the choroid plexus is Gb3 negative. In Figure 4g, neurons in the medulla oblongata are Gb3 positive including the AP area. Within this image, a central canal positioned in the center, appears very dim.
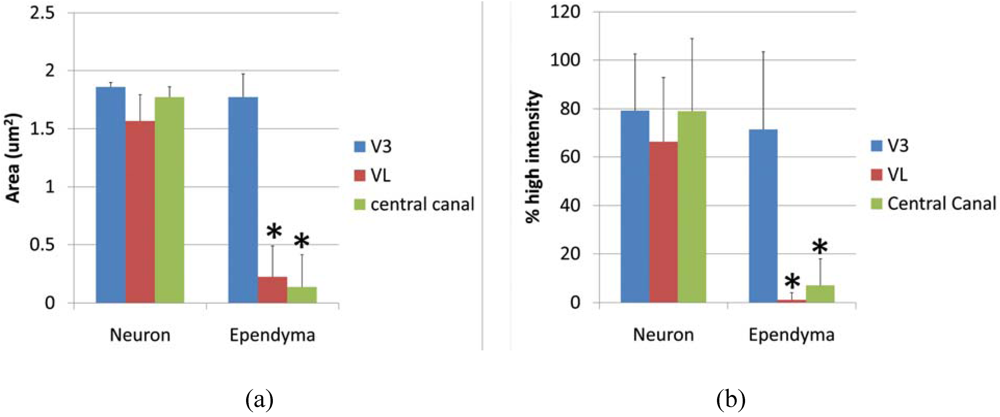
Ependymal cells were tested as a Gb3 expressing cell type and intensity analysis was performed comparing high intensity pixels in neuron and ependyma in the ventricle area as V3, VL and central canal. A square shaped region of interest (ROI) was used to detect the pixel area which is higher than background intensity. The average area (μm2) of neurons vs. ependymal cells in V3, VL and central canal was; 1.857 ± 0.039 vs. 1.773 ± 0.197 (p = 0.275), 1.567 ± 0.085 vs. 0.226 ± 0.262 (p = 0.0097), 1.7739 ± 0.085 vs. 0.137 ± 0.275 (p = 0.0014), respectively. P values less than 0.01 were considered to be statistically significant, and shown as (*) in Figure 5a. The line profile intensity analysis revealed a similar result that averages of high intensity percent of neurons vs. ependyma in V3, VL and central canal were; 79.23 ± 23.29 vs. 71.41 ± 32.03 (p = 0.289), 66.31 ± 26.46 vs. 1.156 ± 2.997 (p = 4.029E-10), 77.73 ± 30.39 vs. 4.346 ± 4.954 (p = 1.042E-08). The results are graphed in Figure 5b. In both analyses, the intensity level of Gb3 positive neurons and ependymal cells in the V3 region was similar, thus ependymal cells in this area were Gb3 positive. In contrast, VL and central canal ependymal cells were Gb3 negative.
As the CVO is naturally leaky, serum Stx2 might travel through this route where vessels do not express Gb3. As ependymal cells at V3 express Gb3, this could serve as an entry point of Stx, if Stx enters into CSF in the mouse CNS. Trafficking of Stx in the CNS needs to be further investigated.
Figure 4.
Anti-Gb3-Ab staining of CVO areas (a) Anti-Gb3-Ab stain (Green) of OVLT region, which is depicted in (b) as Red. Arrowheads indicate the OVLT area; (b) Architectural structure of mouse Bregma 0.50 mm; (c) Anti-Gb3-Ab stain (Green) of a region containing ME, which is depicted in (d) as Red. Arrowheads indicate the ME area. Neurons in ARH, which are adjacent to ME are anti-Gb3-Ab reactive. The V3 is shown as a triangular area. A part of ependymal layer (square region) is shown in inset with higher magnification. (*) indicates a broken tissue space; (d) Architectural structure of mouse Bregma −1.30 mm; (e) Anti-Gb3-Ab stain (Green) of a region containing SFO, which is depicted in (f) as Red. Arrowheads indicate the SFO area, while arrows show anti-Gb3-Ab negative choroid plexus. Neurons of MH are also anti-Gb3-Ab reactive. Lower area of this field includes thalamic nuclei as PVT and MD, in which neurons are positive for anti-Gb3-Ab. (f) Architectural structure of mouse Bregma -0.90 mm; (g) Anti-Gb3-Ab stain (Green) of a region containing AP, which is depicted in (h) as Red. Arrowheads indicate AP area. Neurons of several different nuclei in the medulla oblongata such as NTS, DMX and XII are also anti-Gb3-Ab positive; (h) Architectural structure of mouse Bregma −8.10 mm; (i) Neurons in the amygdala are also anti-Gb3-Ab positive. BLA is indicated in the picture. Dotted line outlines external capsule (ec). See architectural structure in (d). All Bars indicate 100 m, except an inset in (c) which indicates 10 m. Blue color in (a) and (c) indicates nuclei staining using DAPI. (b), (d), (f) and (h) are modified from [23]. See abbreviations in Table 1.

Figure 5.
Intesnsity of anti-Gb3-Ab staining in neurons vs. ependyma. (a) High intensity area comparison of neurons and ependymal cells from V3, VL or central canal. Values from each region (neuron vs. ependyma) are compared, and the statistically significant difference is shown as (*). (b) High intensity percentage from Line profile analysis comparing neurons and ependymal cells from V3, VL or central canal. Values from each region (neuron vs. ependyma) are compared, and statistically significant differences are shown as (*). * indicates p < 0.01 in 2-tailed, paired t-test.

4. Conclusions
Mouse CNS neurons from various areas exhibited anti-Gb3-Ab reactivity. Ependymal cells at V3 were also found to be positive for anti-Gb3-Ab reactivity. However, vessels at the CVO or other areas of the mouse CNS did not exhibit anti-Gb3 reactivity.
Acknowledgements
This work was supported by funding from United States Public Health Service grant AI024431 to T.O.
References
- Bale, J.F.; Brasher, C.; Siegler, R.L. CNS manifestations of the hemolytic-uremic syndrome. Relationship to metabolic alterations and prognosis. Am. J. Dis. Child 1980, 134, 869–872. [Google Scholar] [PubMed]
- Brasher, C.; Siegler, R.L. The hemolytic-uremic syndrome. West J. Med. 1981, 134, 193–197. [Google Scholar]
- Cimolai, N.; Morrison, B.J.; Carter, J.E. Risk factors for the central nervous system manifestations of gastroenteritis-associated hemolytic-uremic syndrome. Pediatrics 1992, 90, 616–621. [Google Scholar]
- Gianantonio, C.A.; Vitacco, M.; Mendilaharzu, F.; Gallo, G.E.; Sojo, E.T. The hemolytic-uremic syndrome. Nephron 1973, 11, 174–192. [Google Scholar]
- Hamano, S.; Nakanishi, Y.; Nara, T.; Seki, T.; Ohtani, T.; Oishi, T.; Joh, K.; Oikawa, T.; Muramatsu, Y.; Ogawa, Y.; Akashi, S. Neurological manifestations of hemorrhagic colitis in the outbreak of Escherichia coli O157:H7 infection in Japan. Acta Paediatr. 1993, 82, 454–458. [Google Scholar]
- Karmali, M.A.; Petric, M.; Lim, C.; Fleming, P.C.; Arbus, G.S.; Lior, H. The association between idiopathic hemolytic uremic syndrome and infection by verotoxin-producing Escherichia coli. J. Infect. Dis. 1985, 151, 775–782. [Google Scholar]
- Rooney, J.C.; Anderson, R.M.; Hopkins, I.J. Clinical and pathologic aspects of central nervous system involvement in the haemolytic uraemic syndrome. Proc. Aust. Assoc. Neurol. 1971, 8, 67–75. [Google Scholar]
- Sheth, K.J.; Sarff, L.D. Hemolytic uremic syndrome associated with Corynebacterium diphtheria infection. Int. J. Pediatr. Nephrol. 1986, 7, 17–20. [Google Scholar]
- Tapper, D.; Tarr, P.; Avner, E.; Brandt, J.; Waldhausen, J. Lessons learned in the management of hemolytic uremic syndrome in children. J. Pediatr. Surg. 1995, 30, 158–163. [Google Scholar]
- Siegler, R.L. Spectrum of extrarenal involvement in postdiarrheal hemolytic-uremic syndrome. J. Pediatr. 1994, 125, 511–518. [Google Scholar]
- Taylor, C.M.; White, R.H.; Winterborn, M.H.; Rowe, B. Haemolytic-uraemic syndrome: Clinical experience of an outbreak in the West Midlands. Br. Med. J. (Clin. Res. Ed.) 1986, 292, 1513–1516. [Google Scholar] [PubMed]
- Upadhyaya, K.; Barwick, K.; Fishaut, M.; Kashgarian, M.; Siegel, N.J. The importance of nonrenal involvement in hemolytic-uremic syndrome. Pediatrics 1980, 65, 115–120. [Google Scholar]
- Verweyen, H.M.; Karch, H.; Allerberger, F.; Zimmerhackl, L.B. Enterohemorrhagic Escherichia coli (EHEC) in pediatric hemolytic-uremic syndrome: A prospective study in Germany and Austria. Infection 1999, 27, 341–347. [Google Scholar]
- Waddell, T.; Cohen, A.; Lingwood, C.A. Induction of verotoxin sensitivity in receptor-deficient cell lines using the receptor glycolipid globotriosylceramide. Proc. Natl. Acad. Sci. USA 1990, 87, 7898–7901. [Google Scholar]
- Okuda, T. Targeted disruption of Gb3/CD77 synthase gene resulted in the complete deletion of globo-series glycosphingolipids and loss of sensitivity to verotoxins. J. Biol. Chem. 2006, 281, 10230–10235. [Google Scholar]
- Obata, F.; Tohyama, K.; Bonev, A.D.; Kolling, G.L.; Keepers, T.R.; Gross, L.K.; Nelson, M.T.; Sato, S.; Obrig, T.G. Shiga toxin 2 affects the central nervous system through receptor globotriaosylceramide localized to neurons. J. Infect. Dis. 2008, 198, 1398–1406. [Google Scholar]
- DiMario, F.J., Jr.; Bronte-Stewart, H.; Sherbotie, J.; Turner, M.E. Lacunar infarction of the basal ganglia as a complication of hemolytic-uremic syndrome. MRI and clinical correlations. Clin. Pediatr. (Phila) 1987, 26, 586–590. [Google Scholar] [CrossRef] [PubMed]
- Jeong, Y.K.; Kim, I.O.; Kim, W.S.; Hwang, Y.S.; Choi, Y.; Yeon, K.M. Hemolytic uremic syndrome: MR findings of CNS complications. Pediatr. Radiol. 1994, 24, 585–586. [Google Scholar]
- Signorini, E.; Lucchi, S.; Mastrangelo, M.; Rapuzzi, S.; Edefonti, A.; Fossali, E. Central nervous system involvement in a child with hemolytic uremic syndrome. Pediatr. Nephrol. 2000, 14, 990–992. [Google Scholar]
- Steinborn, M.; Leiz, S.; Rudisser, K.; Griebel, M.; Harder, T.; Hahn, H. CT and MRI in haemolytic uraemic syndrome with central nervous system involvement: Distribution of lesions and prognostic value of imaging findings. Pediatr. Radiol. 2004, 34, 805–810. [Google Scholar]
- Fujii, J.; Kinoshita, Y.; Kita, T.; Higure, A.; Takeda, T.; Tanaka, N.; Yoshida, S. Magnetic resonance imaging and histopathological study of brain lesions in rabbits given intravenous verotoxin 2. Infect. Immun. 1996, 64, 5053–5060. [Google Scholar]
- Duvernoy, H.M.; Risold, P.-Y. The circumventricular organs: An atlas of comparative anatomy and vascularization. Brain Res. Rev. 2007, 56, 119–147. [Google Scholar]
- Abbott, N.J. Evidence for bulk flow of brain interstitial fluid: Significance for physiology and pathology. Neurochem. Int. 2004, 45, 545–552. [Google Scholar]
- Kolling, G.L.; Obata, F.; Gross, L.K.; Obrig, T.G. Immunohistologic techniques for detecting the glycolipid Gb(3) in the mouse kidney and nervous system. Histochem. Cell Biol. 2008, 130, 157–164. [Google Scholar]
© 2010 by the authors; licensee MDPI, Basel, Switzerland This article is an open-access article distributed under the terms and conditions of the Creative Commons Attribution license (http://creativecommons.org/licenses/by/3.0/).
Share and Cite
MDPI and ACS Style
Obata, F.; Obrig, T. Distribution of Gb3 Immunoreactivity in the Mouse Central Nervous System. Toxins 2010, 2, 1997-2006. https://doi.org/10.3390/toxins2081997
AMA Style
Obata F, Obrig T. Distribution of Gb3 Immunoreactivity in the Mouse Central Nervous System. Toxins. 2010; 2(8):1997-2006. https://doi.org/10.3390/toxins2081997
Chicago/Turabian StyleObata, Fumiko, and Tom Obrig. 2010. "Distribution of Gb3 Immunoreactivity in the Mouse Central Nervous System" Toxins 2, no. 8: 1997-2006. https://doi.org/10.3390/toxins2081997