Article

A qPCR Assay to Detect and Quantify Shiga Toxin-Producing E. coli (STEC) in Cattle and on Farms: A Potential Predictive Tool for STEC Culture-Positive Farms

1
Technology and Food Science Unit, Institute for Agricultural and Fisheries Research (ILVO), Brusselsesteenweg 370, Melle 9090, Belgium
2
Applied Molecular Genomics Group, Department of Molecular Genetics, Flemish Institute for Biotechnology (VIB), Universiteitsplein 1, Antwerpen 2610, Belgium
3
Department of Veterinary Public Health and Food Safety, Ghent University, Salisburylaan 133, Merelbeke 9820, Belgium
4
Department of Pathology, Bacteriology and Poultry Diseases, Ghent University, Salisburylaan 133, Merelbeke 9820, Belgium
*
Author to whom correspondence should be addressed.
Toxins 2014, 6(4), 1201-1221; https://doi.org/10.3390/toxins6041201
Submission received: 3 January 2014 / Revised: 3 March 2014 / Accepted: 11 March 2014 / Published: 27 March 2014
(This article belongs to the Section Bacterial Toxins)

Abstract

:
Shiga toxin-producing E. coli (STEC), of various serogroups harboring the intimin gene, form a serious threat to human health. They are asymptomatically carried by cattle. In this study, a quantitative real-time PCR (qPCR) method was developed as a molecular method to detect and quantify Shiga toxin genes stx1 and stx2 and the intimin gene eae. Subsequently, 59 fecal samples from six farms were tested using qPCR and a culture method as a reference. Three farms had contaminated animals as demonstrated by the culture method. Culture-positive farms showed moderate significantly higher stx prevalences than culture-negative farms (p = 0.05). This is the first study which showed preliminary results that qPCR can predict STEC farm contamination, with a specificity of 77% and a sensitivity of 83%, as compared with the culture method. Furthermore, the presence or quantity of stx genes in feces was not correlated to the isolation of STEC from the individual animal. Quantitative data thus did not add value to the results. Finally, the detection of both stx and eae genes within the same fecal sample or farm using qPCR was not correlated with the isolation of an eae-harboring STEC strain from the respective sample or farm using the culture method.

1. Introduction

Shiga toxin-producing Escherichia coli (STEC) are important food-borne pathogens which can cause severe disease, including hemorrhagic colitis (HC) and a life-threatening complication known as hemolytic uremic syndrome (HUS) [1,2]. The prominent virulence factor of STEC is the phage-encoded Shiga toxin 1 or 2 (stx1 or stx2 genes), which is responsible for kidney failure in humans. The adhesin intimin (eae gene) is often present in human pathogenic strains, where it mediates both intimate attachment to the intestinal epithelial cells, as well as lesions (both attaching and effacing) in the intestinal mucosa. eae is also carried by EPEC (Enteropathogenic E. coli), a pathotype of E. coli that can cause diarrhea in humans but for which no zoonotic transmission route exists [3]. For each of these genes, different subtypes were described, showing variation in DNA and amino acid sequence [4]. For intimin, the allelic differentiation mediates host tissue tropisms, whereas for the Shiga toxins it also involves different biological activity with a correlation to the clinical manifestations [5,6]. Additionally, virulence factors are transferrable between microorganisms, especially those encoded on mobile elements like plasmids and bacteriophages [7]. Human pathogenic STEC strains mainly belong to the serotypes O157:H7, O26:H11, O103:H2, O111:H8, and O145:H28 [8], which generally possess the eae gene. Of these, serotype O157:H7 has been the one studied most extensively.
Domestic ruminants, mainly cattle, have been implicated as the principal reservoir of the STEC pathogens [9]. They can carry both STEC O157 and non-O157 serogroups. Cattle play an important role in the epidemiology of human infections, because food contaminated with cattle feces is the most prominent contamination source [10]. On-farm control of the pathogen first requires a thorough understanding of on-farm epidemiology. Both prevalence data and quantitative data are important for epidemiology [11]. Either culture or molecular methods can be used. Culture methods have the disadvantage of generally targeting only a subset of serogroups [12]. Furthermore, they are labor-intensive and time-consuming. A culture-dependent method was developed to simultaneously isolate this subset of five serogroups by using selective agars [13]. Quantification of STEC strains using a culture method is possible using either the most probable number (MPN) technique or direct plating [14]. The disadvantages of culture methods led us to develop and evaluate a quantitative real-time PCR (qPCR) method. In the literature, qPCR methods have been described for the detection [15] and quantification [16,17,18] of STEC genetic markers in cattle feces. Ibekwe et al. [17] explored the potential of qPCR to quantify STEC O157 in naturally contaminated cattle feces; they promote a culture-free approach.
The aim of this study was to investigate if a molecular method can predict STEC contamination of cattle or cattle farms as compared to a culture method. A molecular method is DNA-based and can only detect the genetic material of STEC. In order to determine the actual presence of STEC or eae-harboring STEC, a culture method is always needed. Therefore, the qPCR method was evaluated with a culture method as a reference. Second, we evaluated if quantitative data obtained by qPCR would give additional information about the degree of contamination of the individual animal or farm. Third, we evaluated if stx and eae were detected in the same sample by qPCR, then could eae-harboring STEC be isolated from the respective sample by means of the culture method? For all of these purposes, a quantitative real-time PCR method was developed which targeted most clinical variants of stx1, stx2, and eae. Primers and probes needed to be optimal, as all variants of stx and eae needed to be detected with the same sensitivity.

2. Results

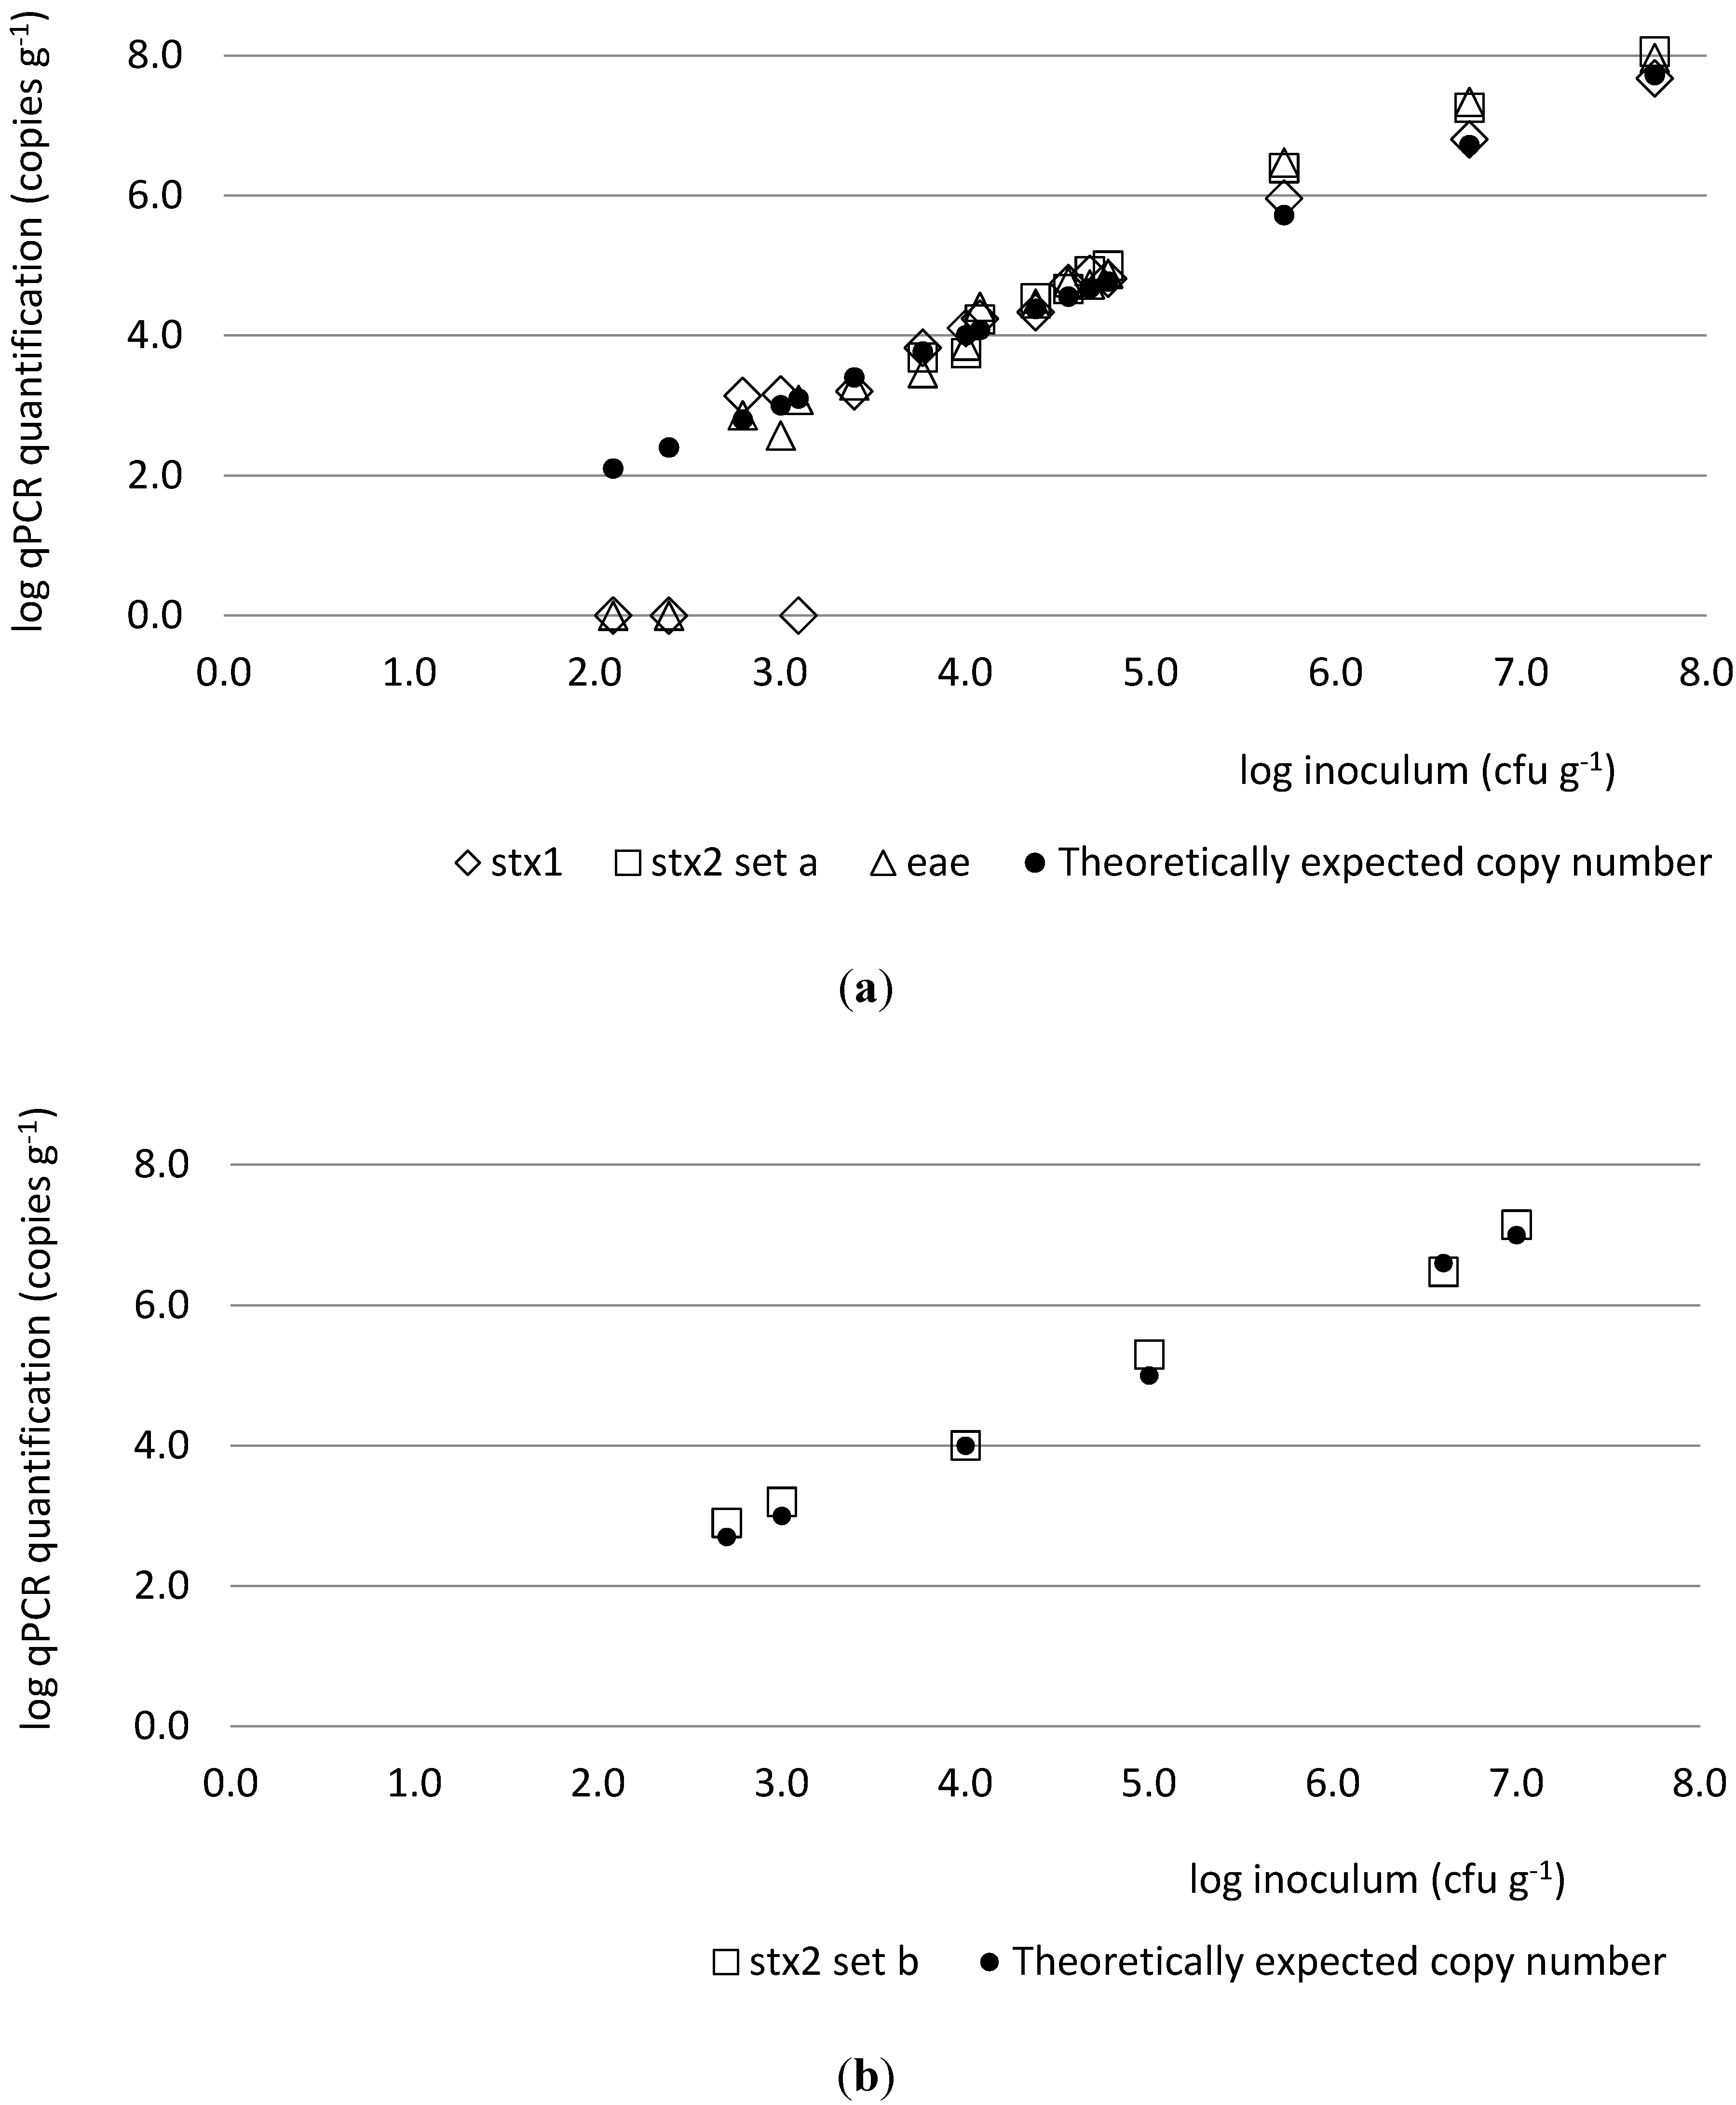
2.1. Method Development and Testing

The utility of the selected primers was evaluated in qPCR assays using SYBR Green I and DNA standards of strains MB3936 and MB4378. For stx1 quantification, Cq values for 105 gene copies were lower for the newly designed primers (stx1-F/-R; Cq 23.0) than for the primers adapted from literature (598-F/1015’-R; Cq 30.0 and 598-F/1015”-R; Cq 28.3). Also, results of the slopes of the standard curves showed that the newly designed primer pairs were preferable (slope close to −3.34). Likewise for stx2, the newly designed primers gave lower Cq values for 105 copies (stx2-F/-R; Cq 28.0) than the primers adapted from literature (Cq 30.9) and slopes were close to −3.34. However, to make the Cq value of the newly designed primer set for stx2 comparable to that used for stx1, the inosine to compensate for one of the two polymorphisms in the sequence of the reverse primer was replaced by the respective specific base, leaving only one per primer (stx2-Ra and stx2-Rb). As a consequence, Cq values for 105 copies dropped drastically (stx2-F/-Ra; Cq 22.3 and stx2-F/-Rb; Cq 22.7) compared to the original primer set. This resulted in quantification of stx2 using two primer sets, a and b. For eae, both newly designed primer pairs gave similar low Cq values for 105 copies (eae-F/-R; Cq 23.5 and eae-F/-R2; Cq 23.1) and slopes were close to −3.34.
qPCR assays were performed using the final selection of primers (Table 1) with corresponding probes together with the appropriate DNA standards of strain MB3936 or MB4378. Properties of the standard curves are listed in Table 2.
For stx2 using primer-probe set a, positive no-template controls were consistently found after 36 cycles. Consequently, a cut-off value was set at Cq 36. Therefore, the lowest number of gene copies detected with this primer-probe set was between 10 and 100 copies per reaction tube.
Inhibition was evaluated on eight cattle fecal samples that were previously demonstrated to be negative using qPCR and culture method. Cq values did not increase as compared to the standard curve, pointing to an absence of inhibition (data not shown).
Table 1. Primers and probes designed in this study for qPCR quantification of STEC. Corresponding nucleotide positions in the sequences of indicated EMBL/Genbank accession numbers are given.
GenePrimer or probe Sequence (5’- 3’) Position (5’- 3’)Accession number
stx1stx1-FGAC GCA GTC TGT IGC AAG AG516-535Z36899
stx1-Rcga aaa cgi aaa gct tca gct g581-560Z36899
stx1-P ФATG TTA CGG TTT GTT ACT GTG538-558Z36899
stx2stx2-FTCA GGC AIA TAC AGA GAG AAT TTC G578-602AY443044
stx2-Raccg gig tca tcg tat aca cag646-626AY443044
stx2-Rbccg gig tca tcg tat aaa cag646-626AY443044
stx2-P ФCAC TGT CTG AAA CTG CT608-624AY443044
eaeeae-FGGA AGC CAA AGC GCA CAA1507-1524AF025311
eae-Rggc icg agc igt cac ttt ata a1593-1572AF025311
eae-P §TAC CAG GCT ATT TTG CCI GCT TAT GTG C1528-1555AF025311
Notes: Forward primers with suffix -F; Reverse primers with suffix -R; Probes with suffix -P. Ф Probe tagged with minor groove-binding non-fluorescent quencher (MGBNFQ) and 6-carboxyfluorescin (FAM) fluorescent label (Applied Biosystems). § Probe tagged with black hole quencher (BHQ-1) and a FAM fluorescent label (Eurogentec).
Table 2. Properties of the standard curves of the qPCR assays for stx1, stx2, and eae detection and quantification.
Target geneLOQ
(copies/reaction)
Cq Ф for 105 copies/reactionEfficiencyR2 (Regression coefficient)
stx11 to 1024.390%0.9997
stx2 (using primer set a)10 to 10022.894%0.9983
stx2(using primer set b)1 to 1023.987%0.9997
eae1 to 1023.998%0.9992
Notes: Limit of quantification; Ф Threshold cycle for qPCR gene detection and quantification.
The limit of quantification (LOQ) was <2.7 log copies g−1 feces for stx1, stx2 (primer-probe set b) and eae, and <3.7 log copies g−1 feces for stx2 (primer-probe set a) (Figure 1a). The quantification of genes did not differ more than 1 log from the theoretically calculated number based on the inoculums of strain MB3936 or MB4378 for concentrations ≥2.7 log CFU g−1 for stx1, stx2 (primer-probe set b) and eae, and for concentrations ≥3.7 log CFU g−1 for stx2 (primer-probe set a) (Figure 1b). The reference sample (blank) was found negative for stx1, stx2 and eae.
Results on inclusivity and exclusivity are listed in Table 3. E. coli strains carrying different variants of the genes stx1, stx2 and eae were detected using the qPCR assays, except for one strain carrying stx2f, which was not targeted by the qPCR assays. No amplification was noticed for any of the non-E. coli strains, the non-pathogenic E. coli type strain, or the ETEC strain, which did not carry stx and/or eae genes. For Shigella dysenteriae, Citrobacter rodentium, and Escherichia albertii, qPCR detected stx1 or eae genes.
Figure 1. Quantification of stx1, stx2 and eae genes by qPCR in cattle fecal samples artificially inoculated with STEC cells. Artificial inoculation was performed using various dilutions of strain MB3936 in 16 contamination levels (a) and of strain MB4378 in five contamination levels (b). Primer-probe set a was used to quantify stx2 gene of strain MB3936 and primer-probe set b to quantify stx2e gene of strain MB4378.
Toxins 06 01201 g001
Table 3. Bacterial strains used to test inclusivity (EPEC and STEC strains) and exclusivity (non-pathogenic E. coli or non-E. coli strains) of the qPCR assays for stx1, stx2 and eae and the respective results.
Species orbacterial subgroupStrainSerotypeVirulence genesqPCR detection
stx1stx2eaestx1stx2eae
EPEC MB3885 O157--eae γ1--+
MB3886O157--eae γ1--+
STEC ФMB3892O91stx1abstx2b-++-
MB3900O175-stx2--+-
MB3957O146stx1ab, stx1cstx2b-++-
MB3963O128abstx1ab, stx1cstx2b-++-
MB3986O181stx1ab--+--
MB4213no info-Stx2d, stx2e, stx2g--+-
MB4376 (EH250)O118-stx2b--+-
MB4377no infostx1d--+--
MB4378O138-stx2e--+-
MB4380no infostx1cstx2b-++-
MB3893O145stx1ab-eae γ1+-+
MB3920O157-stx2eae γ1-++
MB3936O26stx1abstx2eae β1+++
MB3938O145-stx2deae γ1-++
MB4033O111stx1abstx2eae γ2+++
MB4074O26stx1ab-eae β1+-+
MB4108O111stx1abstx2eae γ2+++
MB4117O103stx1ab-eae ε+-+
MB4141O103stx1abstx2deae ε+++
MB4208O157stx1abstx2ceae γ1+++
MB4379Orough-stx2feae--+
ETEC §MB1520-------
Escherichia coliMB544
(LMG2092T)
-------
Shigella dysenteriaeMB 4436
(CIP 57.28)
-stx1ab--+--
Citrobacter rodentiumMB4471
(ATCC 51116)
---eae--+
Escherichia albertiiMB4434
(LMG 20972)
---eae--+
Enterobacter aerogenesMB260-------
Citrobacter diversusMB423-------
Hafnia alveiMB291-------
Klebsiella pneumoniaeMB263-------
Salmonella DublinMB1145-------
Salmonella TyphimuriumMB1135-------
Serratia proteamaculansMB262-------
Shigella boydiiMB4435-------
Yersinia enterocoliticaMB868-------
Campylobacter jejuniMB1263-------
Pseudomonas aeruginosaMB289-------
Bacillus subtilisMB3611-------
Clostridium perfringensMB128-------
Enterococcus faecalisMB30-------
Listeria monocytogenesMB38-------
Staphylococcus aureusMB4038-------
Streptococcus thermophilusMB1654-------
Notes: EPEC, Enteropathogenic Escherichia coli; Ф STEC, Shiga toxin-producing Escherichia coli; § ETEC, Enterotoxigenic Escherichia coli; Strains with the MB collection number belong to the collection of ILVO’s Technology and Food Science Unit (ILVO-T&V), Laboratory of Molecular Bacteriology. EPEC and STEC strains were kindly donated by the Belgian national VTEC reference laboratory (by D. Piérard).

2.2. Study of Molecular Method on Native Cattle Fecal Samples

Using the culture method, STEC strains were isolated from 10 animals originating from three farms (farm A, B, and C; Table 4). These were named the culture-positive farms. On farms D, E, and F, no STEC strains could be isolated from any of the animals tested. Using the molecular qPCR method, stx (stx1 and/or stx2) was detected in 78%, 90%, and 80% of the animals tested on farms A, B, and C, respectively (Figure 2). On farms D, E, and F, stx was detected in 40%, 10%, and 20% of the animals tested, respectively. Statistical analysis showed that the prevalence of stx was moderate significantly higher on the culture-positive farms (A, B, C) than on the culture-negative farms (D, E, F) (p = 0.05).
Table 4. PCR characterization of STEC isolates recovered from cattle fecal samples carrying STEC virulence genes.
SampleFarmSerogroup Virulence gene isolateEnumeration of virulence genes in fecal sample (log copies g−1)
stx1stx2
(using primer set a)
stx2b
(using primer set b)
eae
A1AO157stx1stx2eae0.04.70.04.2
A7AO157stx1stx2eae0.04.20.03.5
A8AO157stx1stx2eae0.03.50.00.0
A9AO157stx1stx2eae0.02.80.00.0
B9B--stx2-0.04.40.00.0
C1C-stx1stx2-0.00.00.0.0.0
C3C--stx2-0.04.40.00.0
C4CO26stx1-eae4.85.65.10.0
C6CO26stx1-eae4.34.40.00.0
C9CO26stx1-eae0.05.25.00.0
Note: Serogroups targeted by PCR include O26, O91, O103, O111, O121, O145, and O157.
Figure 2. Quantification of stx1, stx2 and eae genes by qPCR in individual cattle fecal samples (n = 59). (a) Samples originated from three culture-positive farms (A, B, C) and (b) three culture-negative farms (D, E, F). * Cattle fecal samples that were found to be culture-positive. Primer-probe sets a and b were used to quantify all possible stx2 variants.
Toxins 06 01201 g002
Cross tabulation of the qPCR detection of stx in the individual animal vs. the culture-positive or culture-negative status of the farm showed that the qPCR technique has the potential of being a good predictive screening test for STEC culture-positive farms (Table 5), with a McNemar’s coefficient of 0.774, and a Kappa value of 0.60. The specificity was 77% and the sensitivity 83% at farm level in comparison to the culture method. A specificity of 77% indicates the likelihood of finding an stx-negative animal as determined by qPCR on a STEC culture-negative farm. A sensitivity of 83% indicates the likelihood of finding an stx-positive animal on a STEC culture-positive farm.
Table 5. Cross tabulation of qPCR stx detection in cattle fecal samples versus the culture-positive or culture-negative status of its respective farm.
Result culture method:STEC culture-positive farmTotal
NegativePositive
Result qPCR method: stx detection in the individual fecal sampleNegative23528
Positive72431
Total302959
At the level of the individual animal, the presence of stx was not correlated to the isolation of STEC from the respective fecal sample. This was shown by a McNemar’s coefficient of 0.000 and a Kappa value of 0.009. STEC was isolated from 10 animals. These animals originated from three farms. Three farms were thus culture-positive and three were culture-negative. In total, 31 animals carried stx genes in their feces as determined with qPCR, of which 24 animals were located on culture-positive farms. However, STEC strains could be isolated using the culture method from only nine stx-positive animals as determined by qPCR; no STEC strains could be isolated from the other 15 stx-positive animals, and furthermore, no STEC strains could be isolated from the seven stx-positive samples at the culture-negative farms. Moreover, a STEC strain could be isolated from one stx-negative animal as determined with qPCR. All these findings demonstrate that there was no correlation between the presence of stx as determined with qPCR and the isolation of STEC from the respective sample.
In addition, the virulence genes carried by the isolate (Table 4) did not correspond to the genes detected in the sample as measured by qPCR (Figure 2). For example, the STEC O157 strains isolated from farm A all contained stx1, but when using qPCR, the stx1 gene could not be detected in the fecal sample. The same was observed for the eae gene for two out of the four samples. Conversely, on farm C, the stx2 gene was detected in the sample using qPCR, but the STEC strains that were isolated did not carry this gene.
Because stx detection was not related to the isolation of STEC in the individual animal, quantitative data were also not informative about the contamination level of the animal. Quantitative data of stx (stx1 and stx2) were also not related to the contamination status of the farm, as the level of stx in qPCR-positive samples was in the same range (between ≤ 5 × 10² and 4 × 10⁵ copies g−1) for culture-positive and culture-negative farms (Figure 2).
No correlation was found between a combined presence of stx and eae genes in the animal feces as determined by qPCR and the isolation of eae harboring STEC strains from the respective individual animal or farm by the culture method (Figure 2). In detail, eae and stx genes were detected within the same cattle fecal samples that did not harbor eae+ STEC strains and vice versa. On the farm level, eae harboring STEC strains were isolated from farms A and C (Table 4). On these farms, prevalences of stx and eae were 78 and 44%, respectively, for farm A and 80, and 0%, respectively for farm C (Figure 2). On farm B, no eae harboring STEC strains were isolated, but the prevalence of stx and eae were 90% and 70%, respectively.
Within a sample, quantification levels of stx1, stx2 and eae were frequently unequal (Figure 2).

3. Discussion

This report describes the development of a qPCR method to quantify STEC virulence genes stx1, stx2 and eae in cattle feces. To the best of our knowledge, this is the first study in which the level of these genes in correlation to the isolation of STEC strains on the respective farm has been evaluated. In literature, a correlation has been demonstrated between high-level shedding of E. coli O157 and high levels of stx genes in that animal’s feces [16,17]. However, in these studies, only a small number of native samples were tested, with the focus on serogroup O157 only; no attention was given to culture-negative samples nor to the contamination status of the respective farm. In this study, the value of qPCR was studied using both quantitative and qualitative data. We used a serogroup-independent approach in which both the stx and eae genes were included as genetic markers of virulence.
In terms of method development, all variants of the genes which have been implicated in human disease, except stx2f, were included for primer design to make this study relevant to risk assessment of cattle farms for public health. Subtype stx2f was genetically too divergent to include in the assay, and it has only rarely been associated with a clinical case [19]. For subtypes stx2a and stx2c, reports indicate that they have been found most often in HUS cases, with stx2d and stx2e found less frequently [6], and stx2g has never been found, despite its cytotoxicity for Vero cells [20]. They all form a potential risk for human health and were thus all targeted in the current assay.
We aimed for 100% matching of primers to the annealing sites of the target gene. This ensured optimal efficiency of the PCR and excluded quantitative underestimation of the target [21]. During method development, we observed that a single base mismatch resulted in a log 3 reduction in the gene copy number. This is detrimental for reliable quantification. We demonstrated above that most of the primers and probes described in the literature for STEC detection or quantification [17,22,23,24,25,26,27,28,29,30,31] contained several mismatches when aligned to gene sequences of the different variants of stx1, stx2 and eae. This implies that amplification is not optimal for some gene variants only. For primer-probe sets that contained few mismatches (≤2 in a primer, ≤1 in a probe) [32,33], inosine bases were built in and the qPCR efficiency was evaluated. Preliminary results demonstrated that primers designed in this study were the most efficient compared to those already published, despite needing two primer sets for stx2 quantification. Corresponding probes for stx1 and stx2 contained a minor groove-binding tag which heightens the melting temperature (Tm) of the probe by attaching to the minor groove of the target DNA. This enables the probe to be made shorter. This is useful in cases where conserved regions are limited in length. Notwithstanding the drawback of positive no-template controls for one primer pair (stx2-F/-Ra) and the subsequent necessary cut-off after 36 cycles, a user-friendly assay was established for simultaneous quantification of all three genes. The DNA was placed in separate wells but run using one common qPCR program. Although the inhibition tests were negative in this study, it is advisable to insert an internal amplification control (IAC) in the current qPCR method to detect false negative results in case of inhibition. As possible internal control a non-competitive IAC whereby different primers and probes and exogenous target DNA are added to the reaction mix in low copy numbers, may be used [34].
Using artificial contamination of cattle feces, a limit of quantification (LOQ) of <2.7 log copies g−1 feces was demonstrated for stx1, stx2 (primer set b) and eae; the LOQ was 3.7 log copies g−1 feces for stx2 (primer set a). This was due to the cut-off after 36 cycles. Taking the dilution factor of 160 into account, LOQ corresponded to 1 to 10 gene copies per reaction tube for stx1, stx2 (primer set b) and eae and between 10 and 100 copies per reaction tube for stx2 (primer set a). This means that the same high sensitivity was reached for STEC detection in cattle feces as for pure DNA in water. These results also indicate that all STEC DNA was recovered from the sample, and that no inhibiting compounds interfered with the real-time PCR reaction. Second, quantification results did not differ more than 1 log from the theoretically calculated number of genes in the sample.
To study the potential of the qPCR assay for detecting and quantifying STEC in cattle and on cattle farms, native cattle fecal samples were analyzed in parallel assays, using qPCR and a culture method as a reference. STEC was isolated from 10 animals. When we compared the genes carried by the isolates with the genes detected in the respective fecal sample by means of qPCR, much inconsistency was found. First, the genes carried by the strains obtained by means of the culture method (Table 4) did not correspond to the genes detected in the fecal sample (Figure 2). Further, from 15 stx-positive samples, no STEC strain could be isolated. These results demonstrated the high complexity of cattle fecal samples, with an abundance of microorganisms carrying the stx and eae genes. With qPCR it is measured if the genes stx or eae are somewhere present in the community DNA of the fecal sample, but the actual origin of the genes cannot be determined/Further in this section, we discuss the possible origin of the stx and eae signals detected with qPCR in the fecal sample.
In contrast to the discrepancies observed at the individual animal level, a clear correlation was observed between the detection of stx in the samples and the STEC-positive status of the farm. STEC was isolated on three out of six farms. The qPCR assay proved to be a valuable tool to detect culture-positive farms, as there was a good agreement between the two tests. In total, 83% of the cows identified as positive by the qPCR assay were indeed located on a culture-positive farm. In addition, 77% of the cows detected as negative by the qPCR assay originated from a culture-negative farm. Real-time PCR is fast and is not labor-intensive; this makes it suitable for use as a screening method. Due to the lack of common biochemical properties, STEC are difficult to distinguish from other E. coli. Culture methods generally isolate only a subset of serogroups [12,35,36], leaving other STEC serogroups undetected. Our qPCR method, used as a predictive tool, makes use of a pool of stx genes present in the fecal sample to identify potential high-risk farms. Thus far, no explanation for this pool of stx genes on STEC-positive farms has been given. No STEC could be isolated from many stx-positive samples. The stx genes may originate from either STEC cells of serogroups other than those selected by the culture method, non-E. coli bacteria, like Shigella dysenteriae, stx-phages, or free DNA molecules. Intensive culture methods [11,37], stx-phage isolation methods and molecules which exclude the detection of free DNA [38] may give insight into the actual origin of the stx genes that were detected in this study. Currently, the hypothesis can be made that once STEC cells proliferate on a farm, a wide variation of E. coli becomes transfected by stx-phages, which exponentially multiply the population of STEC cells on the farm. If this is true, then many more other questions arise, such as what is their stability, why would not all E. coli become STEC, and what is their importance in human pathogenicity? More research is needed to identify this pool of stx genes and to identify their role in the epidemiology of STEC on cattle farms.
The aim of this study was to investigate if quantitative data obtained by qPCR give additional information about the degree of contamination of the individual animal or farm. Validation using artificially inoculated cattle feces confirmed that the assay is perfectly suitable for quantification of stx1, stx2 and eae. Unfortunately, the research question itself was answered negatively, because quantitative data did not give additional insights into the STEC contamination level of the animal or the farm. We observed that stx levels were equally high in culture-negative and culture-positive cattle. This was in contrast to results described by Ibekwe et al. [17], which proved the potential of qPCR to quantify STEC O157 in naturally contaminated cattle feces, and promoted a culture-free approach. However, the latter authors might not have looked at the level of stx in culture-negative animals on the farm, which according to our findings would have contained high levels of stx as well.
On the other hand, the presence of both stx and eae genes as detected by qPCR in an individual animal or on a farm was not correlated to the isolation of eae-harboring STEC strains by means of the culture method in the animal or farm in question. The explanation is that using DNA-based methods, it cannot be determined whether genes are present within one cell or not. Eae-harboring organisms other than STEC produce eae signals undistinguishable from eae-harboring STEC. The eae genes may originate from EPEC cells, other species, such as Citrobacter rodentium and Escherichia albertii, or free DNA molecules. In the literature, the presence of EPEC and STEC on the same cattle farm has been described [39,40].

4. Experimental Section

4.1. Method Development and Testing

4.1.1. Bacterial Isolates

The bacterial strains used in this study are listed in Table 1. All strains were stored at −80 °C using Pro-Lab Microbank cryovials (Pro-Lab, Richmond Hill, ON, Canada) according to the manufacturer’s instructions. Strains were cultured on Tryptone Soy Agar (TSA; Oxoid Ltd., Basingstoke, Hampshire, UK) and incubated either aerobically or anaerobically, as appropriate, at 37 °C for 24 h, except for Campylobacter, which was incubated under microaerophilic conditions (at 5% O2, 10% CO2, 85% N2 in an O2/CO2 incubator; Thermo Forma, OH, USA) at 42 °C for 48 h.
For artificial inoculation of cattle feces, strains MB3936 (O26 stx1+ stx2+ eae+) and MB4378 (O138 stx2e+) were grown by transferring one colony from TSA into Tryptone Soy Broth (TSB; Oxoid), and incubating at 37 °C for 24 h. Then, the stationary grown culture was ten-fold serially diluted in Buffered Peptone Water (BPW; Oxoid) at 4 °C. Inoculation of fecal samples was performed immediately, as well as the determination of the number of total number of viable cells. The latter was determined on TSA inoculated with 0.1 mL of 10−6 to 10−8 dilutions in duplicate and incubated at 37 °C overnight.

4.1.2. Cattle Fecal Samples

Sample Preparation and DNA Extraction

Sixty cattle fecal samples were taken from 10 individual adult animals at six local farms (beef, dairy and combined farms). One STEC culture-negative sample (determined using the culture method; see below) was used for artificial inoculation to evaluate the qPCR assays. The other 59 samples were analyzed as native fecal samples using qPCR and classical culture for STEC isolation. For artificial inoculation (see below), 25 g subsamples were diluted tenfold in 225 mL TSB (Oxoid) in a filter stomacher bag. Subsequently, 2.5 mL volumes were concentrated by centrifugation (14,000 g, for 5 min) and the pellet (corresponding with 0.25 g feces) was subjected to DNA extraction using the QIAamp DNA Stool Mini Kit (Qiagen Inc, Valencia, CA, US) according to the manufacturer’s instructions. DNA was finally dissolved in a volume of 200 µL of elution supplied in the kit buffer. For analysis of the native samples, 0.25 g of each sample was subjected to DNA extraction by using the QIAamp DNA Stool Mini Kit (Qiagen Inc) according to the manufacturer’s instructions. qPCR analysis was performed on the DNA samples, and fecal samples were not enriched before processing. Additionally, from each native fecal sample, 25 g was diluted tenfold in 225 mL TSB (Oxoid) in a filter stomacher bag and subjected to the classical culture method for STEC isolation (see below).

Artificial Contamination with STEC

The sample used for artificial contamination was divided into 22, 25 g subsamples that were diluted separately tenfold in 225 mL TSB (Oxoid) in a filter stomacher bag by stomaching for 2 min. Appropriate volumes of diluted bacterial cultures were added to an individual subsample to obtain 16 contamination levels of STEC strain MB3936, ranging between 5.0 × 10⁷ and 1.6 × 10² CFU g−1 feces and six contamination levels of STEC strain MB4378, ranging between 1.0 × 10⁷ and 2.7 × 10² CFU g−1 feces. One subsample was not inoculated and was used as a blank sample.

4.1.3. Real-Time PCR (qPCR)

Preparation of DNA Standards

DNA standards were made for STEC strain MB3936 and for STEC strain MB4378. Isolated DNA was serially diluted tenfold in water and in a series from 105 to 10 copies used as standard in the qPCR. DNA isolation was performed according to the method described by Flamm et al. [41]. The concentration and purity of the purified DNA was determined by measuring the optical density by photo spectroscopy at 260 nm using the Nanodrop® ND-1000 UV-VIS Spectrophotometer (Nanodrop Technologies, Wilmington, NC, USA). The number of genomic copies was calculated using the equation M = n × 1.093 × 10⁻²¹g bp−1 with M as the mass of one genome and n as the total number of base pairs (bp). For E. coli strain O157:H7 EDL933, this was determined to be 5.53 × 10⁶ bp [42].

Primers and Probes

Gene sequences of the different variants of stx1, stx2 and eae were downloaded from the EMBL/Genbank database using BLAST (based on sequence similarity). Subsequently, the sequences were aligned using Kodon software version 3.5 (Applied Maths NV, Sint-Martens-Latem, Belgium). The local database in Kodon contained 25, 137 and 82 gene sequences of stx1, stx2 and eae, respectively, which were grouped into subtypes: (1) stx1a, stx1c and stx1d; stx2a, stx2b, stx2c, stx2d, stx2e, stx2f and stx2g; (2) eae α1, eae β1, eae γ1, eae γ2, eae ε, eae ζ; and (3) some other variants of eae. Subtypes of stx were denominated according to the subtyping nomenclature established at the 7th International Symposium on Shiga Toxin (Verocytotoxin)-Producing Escherichia coli Infections (Buenos Aires, 10–13 May, 2009). Various primer-probe combinations for stx1, stx2 and eae from the literature [17,22,23,24,25,26,27,28,29,30,31,32,33] and newly designed primers and probes using Primer Express 2.0 (Applied Biosystems, Foster City, CA, US), were aligned to the local database. The combinations that resulted in the fewest mismatches (≤2 in a primer, ≤1 in a probe) for the aforementioned subtypes (except stx2f) were selected. Occurring mismatching bases were replaced by inosine. Selected primer sets for stx1 quantification included primer set stx1-F/-R (5’-gacgcagtctgtigcaagag-3’/5’-cgaaaacgiaaagcttcagctg-3’), designed in this study, and primer sets 598-F/1015’-R (5’-agtcgtacggggatgcagataaat-3’/5’-icggicacatagaaggaaactcat-3’) and 598-F/1015”-R (5’-agtcgtacggggatgcagataaat- 3’/5’-cggicacatagaaggaaactcat-3’), both adapted from Bellin et al. [32]. Selected primer sets for stx2 quantification included primer set stx2-F/-R (5’-tcaggcaiatacagagagaatttcg-3’/5’-ccggigtcatcgtataiacag-3’), designed in this study, and primer sets stx2-F/-Ra and stx2-F/-Rb, which contained the same forward primer and a slightly adapted reverse primer stx2-Ra (5’-ccggigtcatcgtatacacag-3’) or stx2-Rb (5’-ccggigtcatcgtataaacag-3’) containing only one inosine base instead of two. In addition, primer set Fitz-F/-R (5’-ggcactgtctgaaactgctcc-3’/5’-tcgccaittatctgacattctg-3’), adapted from Fitzmaurice et al. [33], was evaluated for stx2 quantification. Selected primer sets for eae quantification comprised primer set eae-F/-R (5’-ggaagccaaagcgcacaa-3’/5’-ggcicgagcigtcactttataa-3’) and primer set eae-F/-R2 using an adapted reverse primer eae-R2 (5’-cggtcataggcgcgagc-3’), both designed in this study. The utility of the selected primers was evaluated in a qPCR assay using SYBR Green fluorescence (see further).
The finally selected primers with corresponding hydrolysis probes are listed in Table 1. Two primer sets were needed to enclose all subtypes of stx2, except stx2f, without mismatching bases. Set a consists of primers stx2-F and stx2-Ra and probe stx2-P. Set b consists of primers stx2-F and stx2-Rb and probe stx2-P. The hydrolysis probes stx1-P and stx2-P carried a minor groove-binding non-fluorescent quencher (MGBNFQ) in a combination with a 6-carboxyfluorescin (FAM) fluorescent label (Applied Biosystems). Probe eae-P carried a black hole quencher (BHQ-1) and a FAM fluorescent label (Eurogentec, Seraing, Belgium).

qPCR Using SYBR Green Fluorescence

The utility of the selected primers was evaluated based on the Cq values (threshold cycle) in a qPCR using SYBR Green I and DNA standards of strains MB3936 and MB4378 using 10-fold serial dilutions of 105 to 10. The qPCR was carried out in a 25 µL volume containing 1 × SYBR Green I Master Mix (Applied Biosystems), primers (final concentration 600 nM of each primer; Eurogentec, Seraing, Belgium) and 5 µL of template DNA. The qPCR was performed on a LightCycler® 480 (Roche Diagnostics) using the LightCycler® 480 software, with the following program: activation of the enzyme at 95 °C for 10 min, followed by 40 cycles of 95 °C for 15 s and 60 °C for 1 min. Finally, melting curve analysis of the PCR products was performed by completing one additional amplification cycle and gradually increasing the temperature from 60 °C to 95 °C. The program was ended after a cooling at 40 °C for 30 s.

qPCR Using Hydrolysis Probes

The three genes were quantified using four qPCR assays (1 × stx1, 2 × stx2, 1 × eae) in separate wells of the same plate. The qPCR assays were carried out in a 25 µ volume containing 1 × TaqMan® Environmental Master Mix 2.0 (Applied Biosystems), primers and probe designed in this study (final concentration 300 nM of each primer and 100 nM probe; Eurogentec) and 5 µL template DNA of the standards MB3936 or MB4378. qPCR was performed with the following amplification program: initial activation of the enzyme at 95 °C for 5 min followed by 40 cycles of 95 °C for 15 s and 1 min annealing and elongation at 60 °C, and cooling at 40 °C for 30 s.
DNA standards were used as a template to create standard curves. The amplification efficiency (E) was calculated as E = (10(−1/sl°pe) − 1) × 100% [43]. The linear correlation coefficient R2 represented the linearity.
Inclusivity, defined as the detection of target strains [44], was tested with 23 E. coli strains carrying a wide variation of stx1, stx2 or eae genes, whereas exclusivity, defined as the non-detection of non-target strains [44], was assessed with 22 non-E. coli and non-pathogenic E. coli strains (Table 5)

Quantification of STEC Virulence Genes in an Artificially Contaminated Cattle Fecal Sample

Inhibition by the fecal matrix was evaluated by performing the qPCR assays for stx1, stx2 and eae on eight cattle fecal samples originating from different farms. The samples had previously been confirmed negative by the qPCR and culture method. For the inhibition test, diluted genomic DNA from strain MB3936 was added to the PCR reaction, in order to obtain 104 gene copies per reaction tube of genes stx1, stx2 and eae. An increase of the Cq as compared to the standard curve would indicate that inhibition occurred.
From one cattle fecal sample, 16 subsamples were inoculated with different levels of strain MB3936, six subsamples with various levels of strain MB4378 and one subsample was not inoculated (blank). The fecal sample chosen for artificial inoculation had previously been confirmed as culture-negative for STEC, and did not generate positive signals for stx1, stx2 or eae with qPCR. stx1, stx2 and eae gene copies were quantified (primers and probes in Table 2) in fecal subsamples inoculated with strain MB3936 and in the blank sample. The samples inoculated with this strain (MB3936) were analyzed using primer-probe set a (stx2-F/-P/-Ra) to quantify stx2 variants containing the polymorphism which matches with primer-probe set a. Fecal subsamples inoculated with strain MB4378 and the blank sample were analyzed using primer-probe set b (stx2-F/-P/-Ra) for the quantification of stx2 variants which match with primer-probe set b. To quantify STEC virulence genes in feces, DNA standards of strains MB3936 and MB4378 were included in the same qPCR run. Based on the observed Cq values, gene copy numbers in 1 g inoculated feces were calculated while accounting for the dilution factor in the qPCR (×160). Quantification results were compared with theoretically calculated numbers of genes in the sample based on the inocula. The limit of quantification (LOQ) was defined as the lowest number of organisms that can be quantified in the fecal sample (1 g).

4.2. Study of the qPCR Assays on Native Cattle Feces Samples

4.2.1. Quantification of STEC Virulence Genes in Native Fecal Samples

For 59 native cattle fecal samples, the qPCR assays for quantification of genes stx1, stx2 and eae were carried out. For quantification of stx2 both primer sets a and b were performed, because the type of stx2 in a naturally contaminated sample is unknown and therefore also the set that will match 100%. Gene copy numbers in the reaction were calculated based on the DNA standard of strain MB3936 for enumeration of stx1, stx2 (enumeration of stx2 variants which match with primer-probe set a) and eae. For the enumeration of stx2 variants which match with primer-probe set b, the DNA standard of strain MB4378 was used. Subsequently, gene copy numbers in 1 g feces were calculated (dilution factor 160).
Cattle fecal samples for which stx1 or stx2 could be quantified were regarded as stx-positive. On the farm level, stx-positive animals were counted to determine the farm prevalence.

4.2.2. Classical Culture for Isolation of STEC

The same tenfold diluted and homogenized native cattle fecal samples were subjected to the STEC isolation method as described by Possé et al. [13] for five important serogroups (O157, O26, O103, O111, O145). Briefly, 8 mg L−1 novobiocine (Sigma, St. Louis, MO, USA), 16 mg L−1 vancomycin (Sigma), 2 mg L−1 rifampicin (Sigma), 1.5 g L−1 bile salts (Oxoid) and 1.0 mg L−1 potassium tellurite (Sigma) were supplemented to TSB (Biorad) to prepare the enrichment broth and incubation was performed for 24 h at 42 °C. Post incubation, the enrichment broths were spread on a O157 agar plate and a non-O157 agar plate. In parallel, immunomagnetic separation (IMS) was performed on 1 mL of the enrichment broth, using Dynabeads (Invitrogen) for serogroups O26, O103 and O157 and using Captivate beads (Lab M, Bury, UK) for O111 and O145, followed by plating of the resulting solution (100 µL) on the O157 and non-O157 agar plates. Plates were incubated at 37 °C for 24 h. Colonies were evaluated based on their general appearance and color. All suspected colonies according to the description of Possé et al. [45] with a maximum of 10 colonies per plate were evaluated with a multiplex PCR for stx1, stx2, and eae [46]. Subsequently, stx- or eae-harboring isolates were subjected to serogroup PCR for O26 [47], O103 [48], O111 and O157 [49], O145 [50], O91 [51], and O121 [52].
Individual animals for which STEC could be isolated from their fecal sample were considered culture-positive. Farms which harbored culture-positive samples were considered culture-positive farms.

4.3. Statistical Analysis

McNemar’s test was used to check agreements between the results of the qPCR assay and the results of the culture method. A kappa value was computed as a measure of agreement between the two tests. The specificity and sensitivity of all qPCR assays were computed as:
Specificity = True Negative/(True Negative + False Positive) × 100
Sensitivity = True Positive/(True Positive + False Negative) × 100
To test if the prevalence of stx was significantly higher on the culture-positive farms (A, B, C) than on the culture-negative farms (D, E, F), a Mann–Whitney rank test was performed.
Statistical analysis was performed using SPSS 19.0 (IBM, Chicago, IL, USA). The significance level α was set at 0.05.

5. Conclusions

In conclusion, we have established a sensitive method to quantify STEC virulence genes stx1, stx2, and eae in cattle feces, including all variants of the genes which have been implicated in human infection. Moreover, this study has demonstrated that STEC culture-positive farms had moderate to significantly higher prevalences of stx compared to culture-negative farms. Consequently, the qPCR assay may serve as a fast screening tool to identify potential high-risk farms. Quantitative data did not yield additional insight into the contamination level of the animal or the farm. Finally, the presence of both stx and eae genes in the same cattle fecal sample or farm as detected with qPCR was not correlated to the presence of eae-harboring STEC strains isolated with the culture method from the respective animal or farm. More research is needed to confirm these findings and to define criteria to distinguish potential high risk farms.

Acknowledgments

We thank Miriam Levenson for English-language editing of this manuscript. This work was supported by the Belgian Federal Public Service for Health, Food Chain and the Environment, grant FOODZOON RT-07/8.

Conflicts of Interest

The authors declare no conflict of interest.

References

  1. Beutin, L.; Krause, G.; Zimmermann, S.; Kaulfuss, S.; Gleier, K. Characterization of Shiga toxin-producing Escherichia coli strains isolated from human patients in Germany over a 3-year period. J. Clin. Microbiol. 2004, 42, 1099–1108. [Google Scholar] [CrossRef]
  2. Karmali, M.A. Infection by verocytotoxin-producing Escherichia coli. Clin. Microbiol. Rev. 1989, 2, 15–38. [Google Scholar]
  3. Vaz, T.M.; Irino, K.; Nishimura, L.S.; Cergole-Novella, M.C.; Guth, B.E. Genetic heterogeneity of Shiga toxin-producing Escherichia coli strains isolated in Sao Paulo, Brazil, from 1976 through 2003, as revealed by pulsed-field gel electrophoresis. J. Clin. Microbiol. 2006, 44, 798–804. [Google Scholar] [CrossRef]
  4. Verstraete, K.; de Reu, K.; van Weyenberg, S.; Piérard, D.; de Zutter, L.; Herman, L.; Robyn, J.; Heyndrickx, M. Genetic characteristics of Shiga toxin-producing E. coli O157, O26, O103, O111, and O145 isolates from humans, food, and cattle in Belgium. Epidemiol. Infect. 2012, 141, 2503–2515. [Google Scholar]
  5. Ramachandran, V.; Brett, K.; Hornitzky, M.A.; Dowton, M.; Bettelheim, K.A.; Walker, M.J.; Djordjevic, S.P. Distribution of intimin subtypes among Escherichia coli isolates from ruminant and human sources. J. Clin. Microbiol. 2003, 41, 5022–5032. [Google Scholar] [CrossRef]
  6. Persson, S.; Olsen, K.E.P.; Ethelberg, S.; Scheutz, F. Subtyping method for Escherichia coli Shiga toxin (verocytotoxin) 2 variants and correlations to clinical manifestations. J. Clin. Microbiol. 2007, 45, 2020–2024. [Google Scholar] [CrossRef]
  7. Boerlin, P. Evolution of virulence factors in Shiga-toxin-producing Escherichia coli. Cell. Mol. Life Sci. 1999, 56, 735–741. [Google Scholar] [CrossRef]
  8. Bettelheim, K.A. Non-O157 verotoxin-producing Escherichia coli: A problem, paradox, and paradigm. Exp. Biol. Med. 2003, 228, 333–344. [Google Scholar]
  9. Blanco, M.; Padola, N.L.; Kruger, A.; Sanz, M.E.; Blanco, J.E.; Gonzalez, E.A.; Dahbi, G.; Mora, A.; Bernardez, M.I.; Etcheverria, A.I.; et al. Virulence genes and intimin types of Shiga-toxin-producing Escherichia coli isolated from cattle and beef products in Argentina. Int. Microbiol. 2004, 7, 269–276. [Google Scholar]
  10. European Food Safety Authority (EFSA). The European Union summary report on trends and sources of zoonoses, zoonotic agents and food-borne outbreaks in the in 2009. EFSA J. 2011, 9, 200–209. [Google Scholar]
  11. Fukushima, H.; Seki, R. High numbers of Shiga toxin-producing Escherichia coli found in bovine faeces collected at slaughter in Japan. FEMS Microbiol. Lett. 2004, 238, 189–197. [Google Scholar]
  12. Verstraete, K.; de Zutter, L.; Messens, W.; Herman, L.; Heyndrickx, M.; de Reu, K. Effect of the enrichment time and immunomagnetic separation on the detection of Shiga toxin-producing Escherichia coli O26, O103, O111, O145 and sorbitol positive O157 from artificially inoculated cattle faeces. Vet. Microbiol. 2010, 145, 106–112. [Google Scholar] [CrossRef]
  13. Possé, B.; de Zutter, L.; Heyndrickx, M.; Herman, L. Quantitative isolation efficiency of O26, O103, O111, O145 and O157 STEC serotypes from artificially contaminated food and cattle feces samples using a new isolation protocol. J. Appl. Microbiol. 2008, 105, 227–235. [Google Scholar] [CrossRef]
  14. Arthur, T.M.; Keen, J.E.; Bosilevac, J.M.; Brichta-Harhay, D.M.; Kalchayanand, N.; Shackelford, S.D.; Wheeler, T.L.; Nou, X.; Koohmaraie, M. Longitudinal study of Escherichia coli O157:H7 in a beef cattle feedlot and role of high-level shedders in hide contamination. Appl. Environ. Microbiol. 2009, 75, 6515–6523. [Google Scholar] [CrossRef]
  15. Fratamico, P.M.; Bagi, L.K.; Pepe, T. A multiplex polymerase chain reaction assay for rapid detection and identification of Escherichia coli O157:H7 in foods and bovine feces. J. Food Prot. 2000, 63, 1032–1037. [Google Scholar]
  16. Ibekwe, A.M.; Grieve, C.M. Detection and quantification of Escherichia coli O157:H7 in environmental samples by real-time PCR. J. Appl. Microbiol. 2003, 94, 421–431. [Google Scholar] [CrossRef]
  17. Ibekwe, A.M.; Watt, P.M.; Grieve, C.M.; Sharma, V.K.; Lyons, S.R. Multiplex fluorogenic real-time PCR for detection and quantification of Escherichia coli O157:H7 in dairy wastewater wetlands. Appl. Environ. Microbiol. 2002, 68, 4853–4862. [Google Scholar] [CrossRef]
  18. Jacob, M.E.; Shi, X.; An, B.; Nagaraja, T.G.; Bai, J. Evaluation of a multiplex real-time polymerase chain reaction for the quantification of Escherichia coli O157 in cattle feces. Foodborne Pathog. Dis. 2012, 9, 79–85. [Google Scholar] [CrossRef]
  19. Isobe, J.; Kimata, K.; Shimojima, M.; Hosorogi, S.; Tanaka, D.; Gyobu, Y. Isolation of Escherichia coli O128:HNM harboring stx2f gene from diarrhea patients. Kansenshogaku Zasshi 2004, 78, 1000–1005. [Google Scholar]
  20. Kawano, K.; Okada, M.; Haga, T.; Maeda, K.; Goto, Y. Relationship between pathogenicity for humans and stx genotype in Shiga toxin-producing Escherichia coli serotype O157. Eur. J. Clin. Microbiol. Infect. Dis. 2008, 27, 227–232. [Google Scholar] [CrossRef]
  21. Werbrouck, H.; Botteldoorn, N.; Uyttendaele, M.; Herman, L.; van Coillie, E. Quantification of gene expression of Listeria monocytogenes by real-time reverse transcription PCR: Optimization, evaluation and pitfalls. J. Microbiol. Methods 2007, 69, 306–314. [Google Scholar] [CrossRef]
  22. Belanger, S.D.; Boissinot, M.; Menard, C.; Picard, F.J.; Bergeron, M.G. Rapid detection of Shiga toxin-producing bacteria in feces by multiplex PCR with molecular beacons on the smart cycler. J. Clin. Microbiol. 2002, 40, 1436–1440. [Google Scholar] [CrossRef]
  23. Fratamico, P.M.; DebRoy, C.; Miyamoto, T.; Liu, Y.H. PCR Detection of Enterohemorrhagic Escherichia coli O145 in food by targeting genes in the E. coli O145 O-Antigen gene cluster and the Shiga Toxin 1 and Shiga Toxin 2 genes. Foodborne Pathog. Dis. 2009, 6, 605–611. [Google Scholar] [CrossRef]
  24. Grys, T.E.; Sloan, L.M.; Rosenblatt, J.E.; Patel, R. Rapid and sensitive detection of Shiga toxin-producing Escherichia coli from nonenriched stool specimens by real-time PCR in comparison to enzyme immunoassay and culture. J. Clin. Microbiol. 2009, 47, 2008–2012. [Google Scholar] [CrossRef]
  25. Iijima, Y.; Asako, N.T.; Aihara, M.; Hayashi, K. Improvement in the detection rate of diarrhoeagenic bacteria in human stool specimens by a rapid realtime PCR assay. J. Med. Microbiol. 2004, 53, 617–622. [Google Scholar] [CrossRef]
  26. Jinneman, K.C.; Yoshitomi, K.J.; Weagant, S.D. Multiplex real-time PCR method to identify Shiga toxin genes stx1 and stx2 and Escherichia coli O157:H7/H- serotype. Appl. Environ. Microbiol. 2003, 69, 6327–6333. [Google Scholar] [CrossRef]
  27. O’Hanlon, K.A.; Catarame, T.M.G.; Duffy, G.; Blair, I.S.; McDowell, D.A. Rapid detection and quantification of E. coli O157/O26/O111 in minced beef by real-time PCR. J. Appl. Microbiol. 2004, 96, 1013–1023. [Google Scholar] [CrossRef]
  28. Perelle, S.; Dilasser, F.; Grout, J.L.; Fach, P. Detection by 5’-nuclease PCR of Shiga-toxin producing Escherichia coli O26, O55, O91, O103, O111, O113, O145 and O157:H7, associated with the world's most frequent clinical cases. Mol. Cell. Probes 2004, 18, 185–192. [Google Scholar] [CrossRef]
  29. Reischl, U.; Youssef, M.T.; Kilwinski, J.; Lehn, N.; Zhang, W.L.; Karch, H.; Strockbine, N.A. Real-time fluorescence PCR assays for detection and characterization of Shiga toxin, intimin, and enterohemolysin genes from Shiga toxin-producing Escherichia coli. J. Clin. Microbiol. 2002, 40, 2555–2565. [Google Scholar] [CrossRef]
  30. Sharma, V.K.; Dean-Nystrom, E.A.; Casey, T.A. Semi-automated fluorogenic PCR assays (TaqMan) for rapid detection of Escherichia coli O157:H7 and other Shiga toxigenic E. coli. Mol. Cell. Probes 1999, 13, 291–302. [Google Scholar] [CrossRef]
  31. Sharma, V.K. Detection and quantitation of enterohemorrhagic Escherichia coli O157, O111, and O26 in beef and bovine feces by real-time polymerase chain reaction. J. Food Prot. 2002, 65, 1371–1380. [Google Scholar]
  32. Bellin, T.; Pulz, M.; Matussek, A.; Hempen, H.G.; Gunzer, F. Rapid detection of enterohemorrhagic Escherichia coli by real-time PCR with fluorescent hybridization probes. J. Clin. Microbiol. 2001, 39, 370–374. [Google Scholar] [CrossRef]
  33. Fitzmaurice, J.; Glennon, M.; Duffy, G.; Sheridan, J.J.; Carroll, C.; Maher, M. Application of real-time PCR and RT-PCR assays for the detection and quantitation of VT1 and VT2 toxin genes in E. coli O157:H7. Mol. Cell. Probes 2004, 18, 123–132. [Google Scholar] [CrossRef]
  34. Hoorfar, J.; Malorny, B.; Abdulmawjood, A.; Cook, N.; Wagner, M.; Fach, P. Practical considerations in design of internal amplification controls for diagnostic PCR assays. J. Clin. Microbiol. 2004, 42, 1863–1868. [Google Scholar] [CrossRef]
  35. Verstraete, K.; de Zutter, L.; Robyn, J.; Daube, G.; Herman, L.; Heyndrickx, M.; de Schaetzen, M.A.; de Reu, K. Validation of a method for simultaneous isolation of Shiga toxin-producing Escherichia coli O26, O103, O111 and O145 from minced beef by an international ring-trial. Foodborne Pathog. Dis. 2012, 9, 412–417. [Google Scholar] [CrossRef] [Green Version]
  36. Verstraete, K.; Robyn, J.; Del-Favero, J.; de Rijk, P.; Joris, A.; Herman, L.; Heyndrickx, M.; de Zutter, L.; de Reu, K. Evaluation of a multiplex-PCR detection in combination with an isolation method for STEC O26, O103, O111, O145 and sorbitol fermenting O157 in food. Food Microbiol. 2012, 29, 49–55. [Google Scholar] [CrossRef]
  37. Menrath, A.; Wieler, L.H.; Heidemanns, K.; Semmler, T.; Fruth, A.; Kemper, N. Shiga toxin producing Escherichia coli: Identification of non-O157:H7-super-shedding cows ans related risk factors. Gut Pathog. 2010, 2, 1–9. [Google Scholar] [CrossRef]
  38. Bae, S.; Wuertz, S. Discrimination of viable and dead fecal Bacteroidales bacteria by quantitative PCR with propidium monoazide. Appl. Environ. Microbiol. 2009, 75, 2940–2944. [Google Scholar] [CrossRef]
  39. Hornitzky, M.A.; Mercieca, K.; Bettelheim, K.A.; Djordjevic, S.P. Bovine feces from animals with gastrointestinal infections are a source of serologically diverse atypical enteropathogenic Escherichia coli and Shiga toxin-producing E. coli strains that commonly possess intimin. Appl. Environ. Microbiol. 2005, 71, 3405–3412. [Google Scholar] [CrossRef]
  40. Blanco, M.; Schumacher, S.; Tasara, T.; Zweifel, C.; Blanco, J.E.; Dahbi, G.; Blanco, J.; Stephan, R. Serotypes, intimin variants and other virulence factors of eae positive Escherichia coli strains isolated from healthy cattle in Switzerland. Identification of a new intimin variant gene (eae-eta2). BMC Microbiol. 2005, 5, 23. [Google Scholar] [CrossRef] [Green Version]
  41. Flamm, R.K.; Hinrichs, D.J.; Thomashow, M.F. Introduction of Pam-Beta-1 into Listeria monocytogenes by conjugation and homology between native L. monocytogenes plasmids. Infect. Immun. 1984, 44, 157–161. [Google Scholar]
  42. Perna, N.T.; Plunkett, G.; Burland, V.; Mau, B.; Glasner, J.D.; Rose, D.J.; Mayhew, G.F.; Evans, P.S.; Gregor, J.; Kirkpatrick, H.A.; et al. Genome sequence of enterohaemorrhagic Escherichia coli O157:H7. Nature 2001, 410, 240–240. [Google Scholar]
  43. Knutsson, R.; Lofstrom, C.; Grage, H.; Hoorfar, J.; Radstrom, P. Modeling of 5’ nuclease real-time responses for optimization of a high-throughput enrichment PCR procedure for Salmonella enterica. J. Clin. Microbiol. 2002, 40, 52–60. [Google Scholar] [CrossRef]
  44. International Organization for Standardization (ISO). ISO 16140: Microbiology of Food and Animal Feeding Stuffs—Protocol for the Validation of Alternative Methods. International Organisation for Standardisation. Available online: http://www.iso.org/iso/home/store/catalogue_tc/catalogue_detail.htm?csnumber=30158 (accessed on 24 March 2014).
  45. Possé, B.; de Zutter, L.; Heyndrickx, M.; Herman, L. Novel differential and confirmation plating media for Shiga toxin-producing Escherichia coli serotypes O26, O103, O111, O145 and sorbitol-positive and -negative O157. FEMS Microbiol. Lett. 2008, 282, 124–131. [Google Scholar] [CrossRef]
  46. Botteldoorn, N.; Heyndrickx, M.; Rijpens, N.; Herman, L. Detection and characterization of verotoxigenic Escherichia coli by a VTEC/EHEC multiplex PCR in porcine faeces and pig carcass swabs. Res. Microbiol. 2003, 154, 97–104. [Google Scholar] [CrossRef]
  47. DebRoy, C.; Roberts, E.; Kundrat, J.; Davis, M.A.; Briggs, C.E.; Fratamico, P.M. Detection of Escherichia coli serogroups O26 and O113 by PCR amplification of the wzx and wzy genes. Appl. Environ. Microbiol. 2004, 70, 1830–1832. [Google Scholar] [CrossRef]
  48. Fratamico, P.M.; DebRoy, C.; Strobaugh, T.P.; Chen, C.Y. DNA sequence of the Escherichia coli O103O antigen gene cluster and detection of enterohemorrhagic E. coli O103 by PCR amplification of the wzx and wzy genes. Can. J. Microbiol. 2005, 51, 515–522. [Google Scholar] [CrossRef]
  49. Paton, A.W.; Paton, J.C. Detection and characterization of shiga toxigenic Escherichia coli by using multiplex PCR assays for stx(1), stx(2), eaeA, enterohemorrhagic E-coli hlyA, rfb(O111), and rfb(O.157). J. Clin. Microbiol. 1998, 36, 598–602. [Google Scholar]
  50. Feng, L.; Senchenkova, S.N.; Tao, J.; Shashkov, A.S.; Liu, B.; Shevelev, S.D.; Reeves, P.R.; Xu, J.G.; Knirel, Y.A.; Wang, L. Structural and genetic characterization of enterohemorrhagic Escherichia coli O145O antigen and development of an O145 serogroup-specific PCR assay. J. Bacteriol. 2005, 187, 758–764. [Google Scholar] [CrossRef]
  51. Perelle, S.; Dilasser, F.; Grout, J.; Fach, P. Identification of the O-antigen biosynthesis genes of Escherichia coli O91 and development of a O91 PCR serotyping test. J. Appl. Microbiol. 2002, 93, 758–764. [Google Scholar] [CrossRef]
  52. Fratamico, P.M.; Briggs, C.E.; Needle, D.; Chen, C.Y.; DebRoy, C. Sequence of the Escherichia coli O121 O-antigen gene cluster and detection of enterohemorrhagic E. coli O121 by PCR amplification of the wzx and wzy genes. J. Clin. Microbiol. 2003, 41, 3379–3383. [Google Scholar] [CrossRef]

