Article

Impact of Nitrogen Sources on Gene Expression and Toxin Production in the Diazotroph Cylindrospermopsis raciborskii CS-505 and Non-Diazotroph Raphidiopsis brookii D9

1
Alfred Wegener Institute Helmholtz Centre for Polar and Marine Research, Am Handelshafen 12, 27570 Bremerhaven, Germany
2
Department of Molecular Genetics and Microbiology, Faculty of Biological Sciences, Pontificia Universidad Católica de Chile, Alameda 340, Santiago, Chile
3
Millenium Nucleus EMBA, Alameda 340, Santiago, Chile
*
Author to whom correspondence should be addressed.
Present address: Genomic Microbiology Group, Institute of Microbiology, Christian-Albrechts University Kiel, Am Botanischen Garten 11, 24118 Kiel, Germany.
Toxins 2014, 6(6), 1896-1915; https://doi.org/10.3390/toxins6061896
Submission received: 1 May 2014 / Revised: 31 May 2014 / Accepted: 9 June 2014 / Published: 20 June 2014
(This article belongs to the Special Issue Genomics and Proteomics of Cyanotoxins)

Abstract

:
Different environmental nitrogen sources play selective roles in the development of cyanobacterial blooms and noxious effects are often exacerbated when toxic cyanobacteria are dominant. Cylindrospermopsis raciborskii CS-505 (heterocystous, nitrogen fixing) and Raphidiopsis brookii D9 (non-N2 fixing) produce the nitrogenous toxins cylindrospermopsin (CYN) and paralytic shellfish toxins (PSTs), respectively. These toxin groups are biosynthesized constitutively by two independent putative gene clusters, whose flanking genes are target for nitrogen (N) regulation. It is not yet known how or if toxin biosynthetic genes are regulated, particularly by N-source dependency. Here we show that binding boxes for NtcA, the master regulator of N metabolism, are located within both gene clusters as potential regulators of toxin biosynthesis. Quantification of intra- and extracellular toxin content in cultures at early stages of growth under nitrate, ammonium, urea and N-free media showed that N-sources influence neither CYN nor PST production. However, CYN and PST profiles were altered under N-free medium resulting in a decrease in the predicted precursor toxins (doCYN and STX, respectively). Reduced STX amounts were also observed under growth in ammonium. Quantification of toxin biosynthesis and transport gene transcripts revealed a constitutive transcription under all tested N-sources. Our data support the hypothesis that PSTs and CYN are constitutive metabolites whose biosynthesis is correlated to cyanobacterial growth rather than directly to specific environmental conditions. Overall, the constant biosynthesis of toxins and expression of the putative toxin-biosynthesis genes supports the usage of qPCR probes in water quality monitoring of toxic cyanobacteria.

1. Introduction

Cyanobacterial blooms often dominate the photosynthetic plankton in eutrophic freshwater and coastal brackish waters. Numerous forms of nitrogen (N), primarily nitrate/nitrite, ammonium, urea and cyanate can be assimilated by cyanobacteria [1]. Additionally, many cyanobacteria fix dinitrogen (N2), and therefore can survive and even thrive in N-depleted environments. Cyanobacteria produce a wide array of toxic secondary metabolites (cyanotoxins) [2,3], among them, the hepatotoxic microcystins and nodularins, the cytotoxic cylindrospermopsins and apratoxins, the dermatotoxins lyngbyatoxins, and the neurotoxic anatoxins. Putative gene clusters have been identified for the biosynthesis of these toxins; all encode for large multienzymatic complexes of non-ribosomal peptide synthetases (NRPS), polyketide synthases (PKS) or by hybrid NRPS/PKS complexes [4,5,6,7,8,9]. The paralytic shellfish poisoning toxins (PSTs) are neurotoxins produced in freshwater by cyanobacteria and in marine environments by dinoflagellates [10]. The putative biosynthesis pathway of PSTs is directed by a novel PKS and additional non-NRPS/PKS enzymes [11].
Independent of the biosynthesis pathway, all cyanotoxin chemical structures fall into cyclic peptides or alkaloids, thus the majority are highly nitrogenated. The availability and chemical composition of N sources are believed to influence cyanobacterial blooms, specifically in the succession of N2-fixing and non N2-fixing species [12]. These two aspects lead to several studies on the relationship between N-input and toxicity in microalgae, particularly in microcystin producers. In N-limited batch and continuous cultures of Microcystis aeruginosa, the specific microcystin production rate correlated to cell division rate at favorable cell growth conditions [13,14]. Induction of growth by nitrate, however, did not induce changes to microcystin cell quotas and consequently toxin genes (mcy) were not upregulated [15]. In Planktothrix agardhii, amino acid supplementation affected the ratio of microcystins toxic variants; however, a shift from the N-saturated to N-limited medium only produced a decrease in the total toxin content correlated with a decrease in cell biomass and not a shift in the toxin variants as expected [16].
N availability also plays a pivotal role in dinoflagellate blooms [17,18], and it is believed to influence PST production [19,20]. However, when normalized to cell growth, the studies indicate that under N-limitation, dinoflagellates divide slower while increasing their cell size, thereby accumulating toxins (increase in cell quota) instead of producing more [20]. Contrary to this, in the diazotroph Aphanizomenon flos-aquae, N-limitation increased PST production at the end of the growth phase [21]. However, in a diazotrophic organism such as A. flos-aquae, N-limitation is rapidly overcome by N2 fixation and implications of N-limitation at later stages of growth cannot be inferred.
Studies on cylindrospermopsin production and release have been carried out in a few cyanobacterial species, Cylindrospermopsis raciborskii, Aphanizomenon spp. and Oscillatoria. Modulation of N-sources (ammonium and N-deprivation) in C. raciborskii showed that higher toxin concentrations were produced under N-deprivation [22]. Toxin measurements were only performed in exponential phase, and gene expression data were not available at that time. In a different study, A. ovalisporum N-starvation resulted in a reduction of the cellular CYN content while transcript levels of the CYN biosynthetic genes, aoaA and aoaC, decreased independently of the amount of toxin recorded [23]. Other abiotic factors such as temperature, light and phosphate concentration have shown to affect CYN production and release [24,25,26,27,28,29], but toxin gene expression or protein activity was reported only in one study [27].
Understanding the factors that affect cyanotoxin production would provide a tool to monitor, predict, and prevent the emergence of toxic blooms of cyanobacteria, and with the previous identification of the toxin biosynthesis genes, quantification of these in blooms is now possible. Given the critical importance of N supply and metabolism in growth, bloom development and life history transitions of cyanobacteria, we aimed our study to compare the effects of alternative nitrogen sources in the cyanobacterial production of cylindrospermopsins and PSTs and their molecular regulation. The filamentous diazotroph Cylindrospermopsis raciborskii which produces CYN and its analog, deoxycylindrospermopsin (doCYN) [30], in addition to the non-diazotrophic Raphidiopsis brookii which produces gonyautoxins GTX2/3 and their respective decarbamoyl analogs, dcSTX and dcGTX2/3 [31], were used as model organisms. From both strains the genomes and putative toxin biosynthesis gene clusters have previously been elucidated [8,32,33]. These are located adjacent to genes regulated by NtcA, the master regulator for N availability raising the hypothesis that toxin synthesis could be regulated by nitrogen in these two cyanobacteria. We explored the relationship between toxin production and transcriptional regulation of ntcA and of the main putative genes for toxin biosynthesis and transport in C. raciborskii CS-505 and R. brookii D9.

2. Results

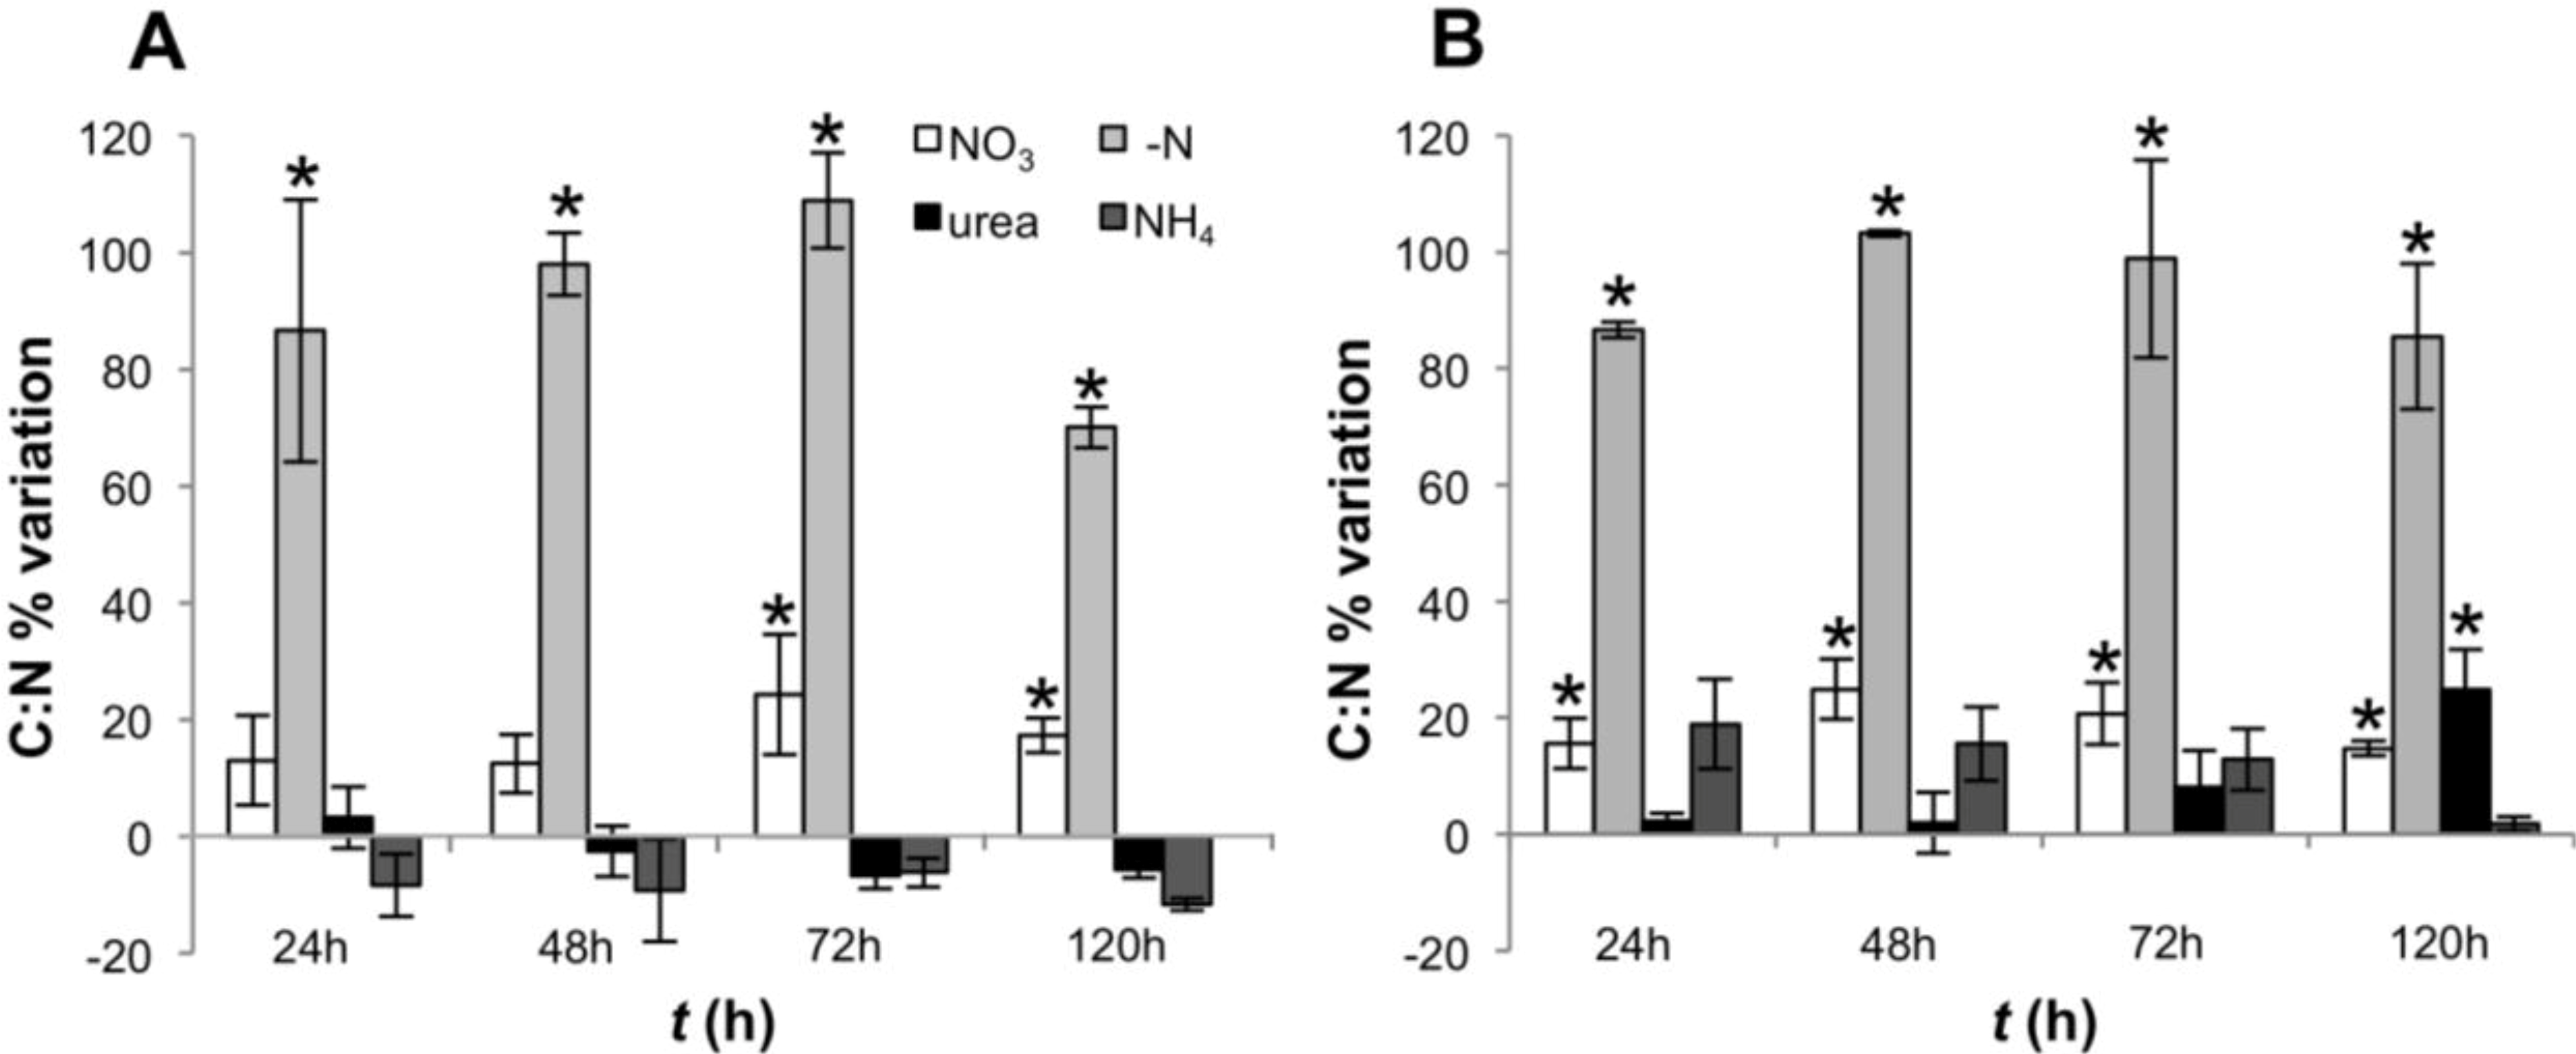
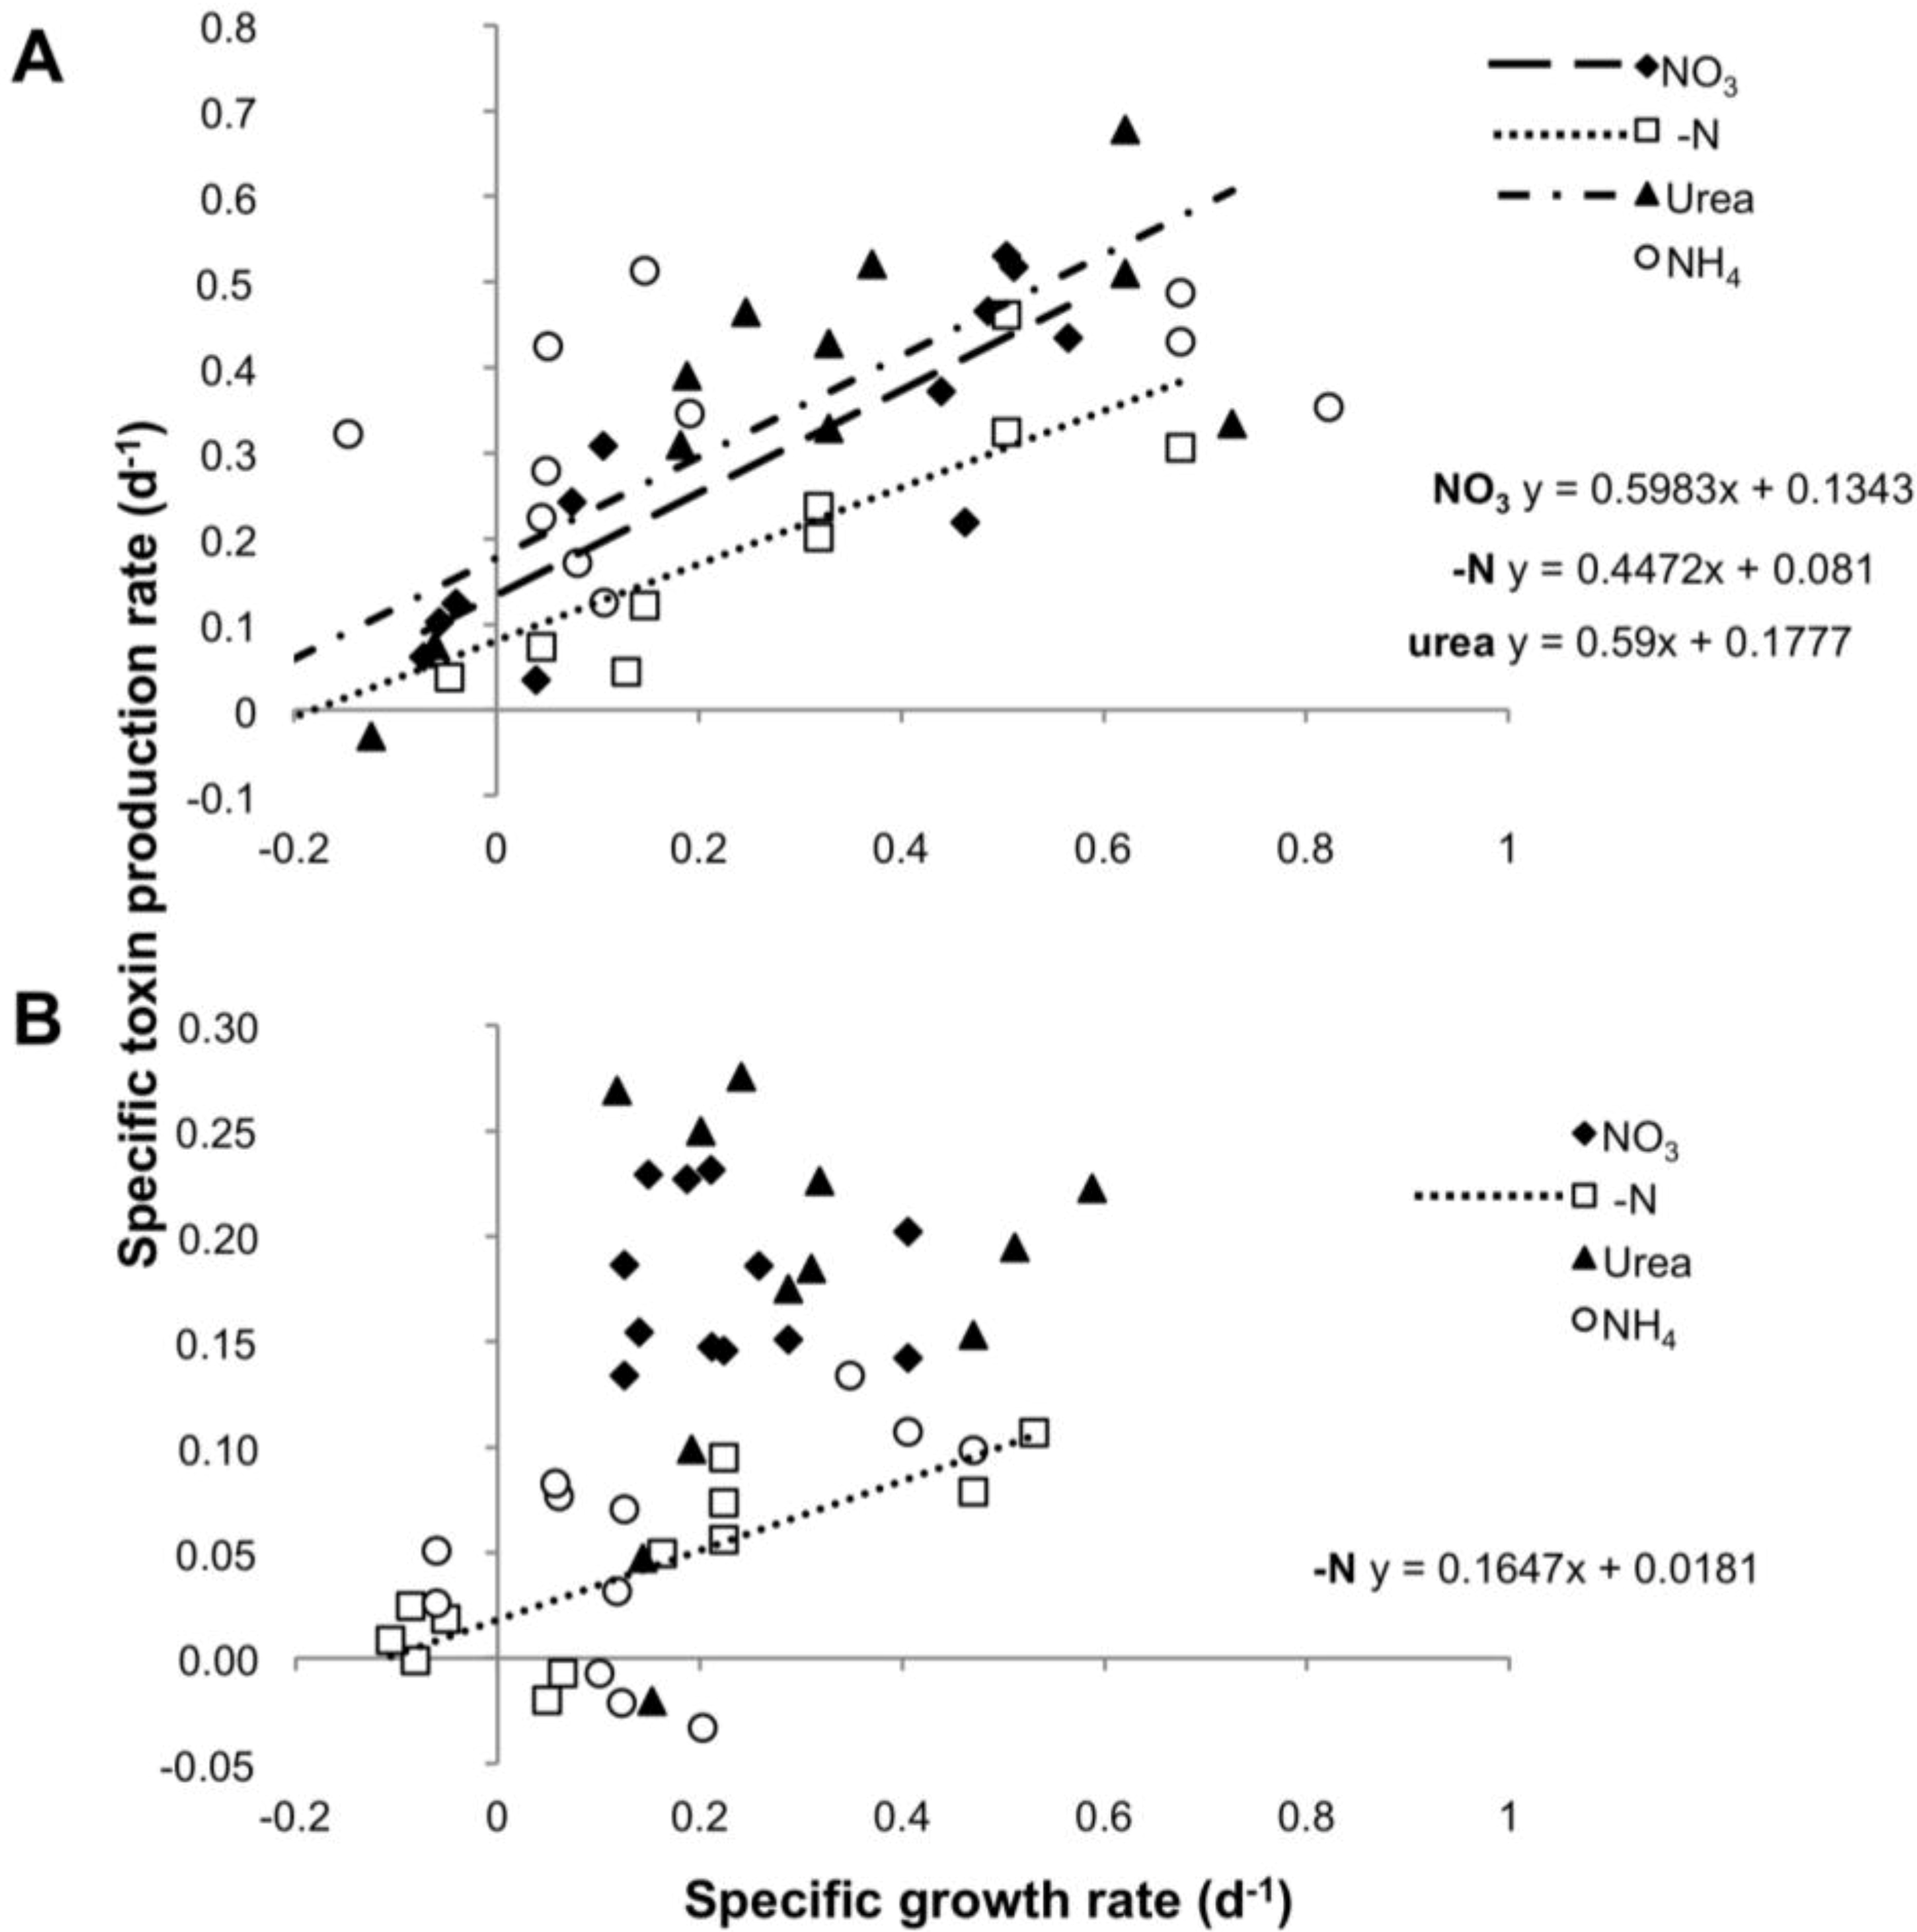
2.1. Growth and Toxin Production under Different N-Regimes

The growth and toxin production of C. raciborskii CS-505 and R. brookii D9 (heretofore called CS-505 and D9, respectively) were studied under nitrate, ammonium or urea as substrate or under the absence of dissolved N (Figure 1). Experiments were performed from cultures adapted to grow on nitrate in a five-day period to observe the early response to N-deprivation of CS-505 and D9. This response will be followed by N2 fixation and cell death on the respective strains. Growth of both strains was not apparently dependent on the N-source at the time studied, with the exception of the lower biomass yield in CS-505 under N-deprivation (Figure 1B), and the growth lag and consequently lower biomass of D9 under ammonium growth (Figure 1D). Besides the expected N-deprivation-induced cell bleaching, chl a measurements were in agreement with dry weight biomass estimations (Figure 1A,C) and OD750 (Table S1).
Figure 1. Growth curves of CS-505 (A,B) and D9 (C,D). Curves were plotted by chlorophyll a and dry weight per unit culture volume. Values are shown as the average of three biological replicates; error bars indicate ±SD from the mean (n = 3).
Toxins 06 01896 g001
The decrease in the intracellular levels of N, as reflected by high C:N ratios in cultures growing in N-free medium, was apparent after 24 h and remained high during the entire experiment (Figure 2). However, a significant decrease in the C:N ratio was observed after 120 h in CS-505 (one way ANOVA, Tukey’s HSD post hoc test p < 0.01) as reflected by an increase in the intracellular nitrogen pool while particulate carbon (PC) remained constant (Figure 2A and Figure S1).
Total intra- and extracellular CYN and doCYN concentration increased with time in CS-505 cultures under all N-treatments (Figure 3A). This response was, however, much lower in the treatment without dissolved N. When normalized to biomass, the effect of N-removal on toxin production correlated with the available N pool in the cells (Figure S1); the toxin content per unit biomass remained low until 72 h, then increased until 120 h (Figure 3B), along with a drop of almost 50% in the C:N ratio (Figure 2A). These changes reflect an increase in cellular N, probably derived from N2 fixation. Similarly, N-deprivation significantly affected the intra- and extracellular CYN: doCYN, ratio (one way ANOVA, Tukey’s HSD post hoc test p < 0.01), which increased as reflected by a dramatic decrease in the precursor doCYN (Figure 3C,D). The CYN:doCYN ratios progressively decreased in the cellular and extracellular fraction under all fixed N-sources (Figure 3C,D), although this trend was not as marked by 120 h in the extracellular fraction (Figure 3D). Small differences in this tendency are likely attributable to cell lysis and/or leakage of toxins rather than to active toxin transport.
Figure 2. C:N ratios of CS-505 (A) and D9 (B) grown under alternative N-regimes. Values are shown as a percentage of variation with respect to t = 0; error bars indicate ±SD from the mean (n = 3). Values significantly different from t = 0 (one way ANOVA, Tukey’s HSD post hoc test p < 0.01) are marked with a * symbol.
Toxins 06 01896 g002
Figure 3. Toxin production by CS-505 grown under four alternative N-regimes. (A) Total CYN + doCYN content over the time in the intra- and extracellular component per unit culture volume; (B) total toxin content normalized to biomass (dry weight); (C) and (D) intra- and extracellular ratios of CYN:doCYN, respectively.
Toxins 06 01896 g003
To test a possible correlation between toxin production and cell division, for each strain we compared the rates of toxin production (µtox) and growth rate (µc) in all four experimental settings. µtox and µc showed a significant correlation in cultures grown on nitrate and urea over the entire growth curve, with a slope not significantly different from 1 (ANCOVA: p = 0.204550 for nitrate and p = 0.566347 for urea), suggesting a balanced equilibrium between net growth and toxin production. In contrast, cultures grown on N-free medium showed a correlation between µtox and µc whose slope (m = 0.447) differed significantly from a slope = 1 (ANCOVA: p = 0.000930). No significant correlation was observed for the ammonium treatment, for which the toxin production rate appeared to be independent of growth rates (Figure 4A).
Figure 4. Specific toxin production rate as function of specific growth rate in the four N regimes for CS-505 (A) and D9 (B).
Toxins 06 01896 g004
R. brookii D9 produces six PST analogs in the following order of descending relative abundance: GTX2/3 > STX > dcSTX and dcGTX2/3. We explored by HPLC the production of all six analogs and represented our values as total toxin content, and ratios between STX and the epimers GTX2/3. The total PST content (intra- and extracellular) of R. brookii D9 grown on nitrate or urea increased along the time course of growth, but remained roughly constant in cultures grown with ammonium or under N-deprivation over the 120 h experiment (Figure 5A). The total toxin per unit biomass (µg·PSTs·mg−1) decreased during the first 24 h in all N-treatments, and continued to decrease in the ammonium and urea treatments, where it reached a minimum of 0.86 µg·mg−1 (approx. 50% of the initial amount) at 120 h (Figure 5B). In contrast, under -N conditions and with nitrate, the total PST content per unit biomass increased towards the end of the experiment but did not attain the initial levels. The increase of total PSTs in the -N treatment may be explained by the low biomass at this time point while the total PSTs remained constant (relatively refractory to degradation) in the medium. The trend towards decreasing intracellular toxins, except for the nitrate treatment, was only reflected in the increase in the extracellular STX pools in cultures grown on urea (Figure 5C,D).
Figure 5. Toxin production by D9 grown under four alternative N-regimes. (A) Total PST content over the time in the intra- and extracellular component per unit culture volume; (B) total toxin content normalized to biomass (dry weight); (C) and (D) intra- and extracellular STX content; (E) and (F) intra- and extracellular STX:GTX2/3 ratios.
Toxins 06 01896 g005
In the intracellular fraction, the toxin composition, expressed as the STX:GTX2/3 ratio, rapidly shifted down in the -N and ammonium treatments, while decreasing only later in the urea-grown cultures (Figure 5E). In the ammonium treatment, the intracellular content of STX decreased to the limit of detection (Figure 5C), thereby producing lower STX: GTX2/3 ratios; the same effect was observed in the -N treatment (Figure 5E,F). In these cases, the cultures were in two different physiological stages; N-depleted cultures were destined to die from starvation, whereas cultures grown on ammonium showed a lag phase only until the fourth day, after which they increased in biomass and chlorophyll a content (Figure 1). This lag phase suggests acclimation of the cells for a different assimilation strategy of dissolved N. With nitrate as growth substrate, the STX: GTX2/3 ratio (approximately 1:5) did not significantly change (one way ANOVA, Tukey’s HSD post hoc test p < 0.01) over the first 48 h, but increased slightly in the latter half of the experiment (Figure 5E,F). In general, the ratios in the intracellular and extracellular fractions followed similar patterns, with the exception of the urea treatment, which showed a downshift only in the intracellular component, presumably due to the release of STX to the extracellular medium. At this stage we cannot assess if this is an active or passive toxin release.
The rate of PST production was apparently independent of the growth rate in the urea, nitrate and ammonium treatments. Only the -N treatment showed a significant and positive correlation between these two parameters. Nevertheless, the slope of the regression line (m = 0.1647) was significantly different from a slope = 1 (ANCOVA p = 0.000116), showing that under N deprivation, a doubling in the biomass did not yield a corresponding doubling in toxin content (Figure 4B).

2.2. NtcA Binding Boxes and Transcriptional Regulation of cyr and sxt Genes

By computational predictions we inferred the presence of transcriptional units (TUs) within the cylindrospermopsin (cyr) and saxitoxin (sxt) gene clusters based on the assumption of gene proximity (i.e., intergenic region <50 nt) and the lack of regulatory boxes inside the intergenic regions. We could allocate two TUs, cyrDFGI and cyrABE, in the cyr cluster of CS-505 (Figure S2A) and five TUs, sxtQRST, sxtLSUL, sxtIJ, sxtFGH, and sxtABC, in the sxt cluster of D9 (Figure S3A). NtcA motifs were predicted as described above (see experimental section). The presence of a −10 box with the motif TAN3T, which appears downstream of all known NtcA binding sites [34,35] was considered as essential. Under these criteria, NtcA binding motifs were predicted for the hypF (part of the hydrogenase gene cluster, N-regulated in cyanobacteria), cyrABE, cyrJ, and cyrK genes (Figure S2B-E). Flanking the sxt gene cluster is the glutamine synthetase gene glnA, a known target for NtcA regulation [36]. Aside from the putative NtcA binding region for glnA (Figure S3B), NtcA motifs were predicted upstream of the sxtM and sxtABC genes (Figure S3C,D). In addition, other four motifs were found inside the coding sequences of the sxtA, sxtP, sxtQ, and sxtS genes (Figure S3D,E).
Candidate genes for the biosynthesis of the toxin precursor molecules (STX or CYN), tailoring reactions, toxin transport, and predicted functions are shown in Table 1. The expression of four cyr and eight sxt genes in cultures grown in nitrate, ammonium or urea were compared with N-free medium, considering nitrate-dependent growth as a control under which CYN and PSTs are synthesized constitutively. Thus, transcript abundance is expressed as the percentage of variation respect to time 0 (cells grown on nitrate) from absolute quantification values, which are obtained from standard curves and do not depend on normalization by a housekeeping gene (see experimental section). qRT-PCR values for D9 on N-free medium were not obtained because the filaments did not grow under this condition and produced only poor quality RNA after 24 h.
The expression of the N-regulator gene ntcA was determined as a proxy control for N-regulation (Table 1). With ammonium, the levels of ntcA showed a decrease after 72 h in CS-505. In D9, the mRNA levels of ntcA continuously decreased until 72 h in cells grown on nitrate and ammonium, as we expected for the negative regulation of ntcA under N-replete conditions. In the urea treatment, ntcA showed a two-fold up regulation at 72 h in CS-505, whereas the D9 expression remained unchanged. The ntcA transcript levels increased three-fold only after 48 h of N-deprivation, yet the C:N ratios were high after the first 24 h.
Cylindrospermopsin and saxitoxin biosynthetic genes were constitutively expressed under all treatments tested (Table 1), but toxin production was slower during the 120 h of the experiment in the -N treatment (Figure 3 and Figure 4). Under N-deprivation, the cyrB transcript level dropped 65% after the first 24 h; after 48 h, the levels increased but remained below the initial values until the end of the experiment. The cyrI and cyrJ transcripts decreased at a lesser extent (35%) at 24 h, but they returned to the initial levels and decreased at 120 h, whereas cyrK transcripts did not change. In N-replete treatments, the gene expression response was rather surprising. After 120 h, the transcript levels did not rise above the control, with the exception of cyrB at 48 h in ammonium, and at 72 h in nitrate, and cyrJ at 48 h in urea. Gene expression in the ammonium and nitrate treatments showed a similar response, namely a downregulation between 72–120 h. With urea, cyrI and cyrK were repressed at 24 and 48 h. The eight STX biosynthetic genes assayed responded similarly and comparably to the cyr genes; a tendency to downregulation was observed near the end of the time series (Table 1).
Table 1. Transcript abundance of ntcA, cyr and sxt genes under alternative N-sources.
Gene/Predicted Function/ReferenceNtcA MotifTime (h)% Transcript Relative to Time 0
NO3NH4urea-N
ntcA (CS-505)
Transcriptional regulator in nitrogen metabolism
[37]
Y2460.3 ± 3.989 ± 7.5132.3 ± 15.4110.5 ± 12.7
48135.9 ± 22139.1 ± 4.8220.7 ± 20283.1 ± 17.6
72107.2 ± 16.380.6 ± 12.8NM155.9 ± 14.9
120136.2 ± 20.147.8 ± 9.1NM181.8 ± 7.6
ntcA (D9)
Transcriptional regulator in nitrogen metabolism
[37]
Y2463.5 ± 6.898.7 ± 8.787.8 ± 13.3NM
4854.2 ± 9.556.3 ± 2.8111 ± 15.7NM
7216.6 ± 5.827.4 ± 1.3NMNM
12049 ± 130.5 ± 5.1NMNM
cyrB
NRPS/PKS, second step in CYN biosynthesis
[8]
Y2462.8 ± 1.793 ± 21121.9 ± 25.235.1 ± 9
48107.4 ± 4.7141.8 ± 15.9124.2 ± 58.775.3 ± 7.4
72126.3 ± 3.273 ± 4.6NM64.1 ± 8.9
12020.1 ± 529.8 ± 8.9NM65.4 ± 2.1
cyrI
Hydroxylation of C-7 in doCYN to form CYN
[8,38]
N2473.8 ± 8.880 ±7.8121.9 ± 25.235.1 ± 9
4896.4 ± 18.6141.8 ± 15.9124.2 ± 58.775.3 ± 7.4
72110.3 ± 11.773 ± 4.6NM64.1 ± 8.9
12066.7 ± 1629.8 ± 8.9NM65.4 ± 2.1
cyrJ
Sulfotransferase
[8]
Y2474.4 ± 6.174.2 ± 3.3106.2 ± 18.566.4 ± 10.2
48107.2 ± 1.6114.9 ± 1.7179 ± 2189.9 ± 12.3
7243.5 ± 376.7 ± 6.6NM60.7 ± 17.3
12054 ± 9.531.9 ± 9.8NM64.1 ± 9.4
cyrK
Transport of CYN/doCYN
[8]
Y2493.2 ± 4.668.3 ± 5.652.4 ± 1.8106.3 ± 15.9
48101 ± 0.496.9 ± 13.563.6 ±12.2114.9 ± 10
7244.5 ± 5.960.9 ± 1.7NM86.6 ± 11.6
12038.1 ± 7.329.2 ± 9.9NM96.7 ± 13.4
sxtSUL
Sulfotransferase rendering GTX2/3
[39]
N2438.5 ± 8.4160.2 ± 5.761.3 ± 13NM
4836.2 ± 9.4131.4 ± 21.798.4 ± 31.4NM
7220.5 ± 1.247.2 ± 4.8NMNM
12019.5 ± 346.2 ± 6NMNM
sxtDIOX
Hydroxylation of STX prior to GTX2/3 formation
[39]
N2485.8 ± 7.6116.1 ± 2557 ± 3.2NM
48146 ± 11.4104.9 ± 20.378 ± 7NM
7274.5 ± 6.451.8 ± 4.7NMNM
12071.6 ± 1.375.5 ± 1.2NMNM
sxtM
PST export
[11]
Y2483.8 ± 11.7161.3 ± 18.269.2 ± 6.4NM
4860.8 ± 2.8141 ± 25.5122.5 ± 25NM
7245.11 ± 4.471.9 ± 5.1NMNM
12048.1 ± 3.980 ± 6.6NMNM
sxtF
PST export
[11]
N2484.5 ± 13152.3 ± 14.386.8 ± 2.9NM
4864.9 ± 3.683 ± 14.186.9 ± 5.5NM
7252.4 ± 372.6 ± 11NMNM
12065.9 ± 6.270.5 ± 6NMNM
sxtA
ACP/aminotransferase, first step in STX biosynthesis
[11]
Y24116.2 ± 10.5165.8 ± 10.6124 ± 3.7NM
4877.5 ± 6.597 ± 10.4160.7 ± 26NM
7267.6 ± 236.6 ± 2.2NMNM
12058.2 ± 4.330.6 ± 1.2NMNM
sxtO
Donor of sulfate group
[11]
N2490.4 ± 3.860.3 ± 0.836 ± 6.9NM
4860.6 ± 3.951.4 ± 4.257.5 ± 8.5NM
7230.1 ± 2.922 ± 3.6NMNM
12035.6 ± 7.815.3 ± 1.5NMNM
sxtI
Carbamoyltransferase
[11]
N2447.3 ± 4.2179.1 ± 8.886.5 ± 8.1NM
4851.9 ± 3.1106.9 ± 10.7104.9 ± 9.5NM
7235.5 ± 4.159.1 ± 5.7NMNM
12039.5 ± 5.749.1 ± 8.4NMNM
sxtU
Reduction of C-1, eighth step in STX biosynthesis
[11]
N2461.8 ± 8.2125.8 ± 17.391.4 ± 13.5NM
4862.2 ± 2.8123.4 ± 21.2132.3 ± 13.4NM
7240.2 ± 0.382.1 ± 5.6NMNM
12037.6 ± 4.853.2 ± 1.7NMNM
Transcript abundance was calculated from absolute quantification measurements. Samples were taken from three biological replicates at 24 h intervals during 120 h. Urea samples were taken only until 48 h. Standard deviation of the mean (n = 3) is shown. Y: Yes; N: No; NM: not measured. In bold and underlined is shown the value where transcript levels surpassed more than two-fold that of nitrate growth.

3. Discussion

This work represents an integrated assessment of the physiological and transcriptional responses of two filamentous toxigenic cyanobacteria to growth on alternative N regimes. Both C. raciborskii CS-505 and R. brookii D9 demonstrated the capacity to grow on a variety of fixed N-sources. Independent of the N-regime, cells committed to cell division upon transfer from nitrate stock medium completed division, but under N-deprivation, further growth was arrested in both CS-505 and D9. Removal of nitrate from the culture medium caused a decrease in the intracellular N pools leading to an increased C:N ratio as early as 24 h in both species, indicating that the cells were under nitrogen limitation (Figure 2 and Figure S1). However, a significant decrease in the C:N ratio was observed after 120 h in CS-505 (one way ANOVA, p < 0.01) as reflected by an increase in the intracellular nitrogen pool while particulate carbon (PC) remained constant (Figure 2A and Figure S1). C. raciborskii CS-505 increased, likely as a consequence of N2 fixation and the time required for heterocyst development [40].
In C. raciborskii CS-505 (SDS), the highest concentrations of CYN have been previously recorded at late stationary phase in cultures grown at a moderate photon flux density of 140 μmol m−2·m−1 [41] and in the absence of a dissolved N-source [22]; the lowest concentrations were found in several C. raciborskii strains when cultures were supplemented with ammonium [22]. In Aphanizomenon spp. and C. raciborskii, a decrease of CYN accumulation was also reported as a result of increased temperature [25,26,28]. Our results highly contrast with Saker and Neilan’s findings [22], but in their report, CYN concentrations were recorded at the end of the exponential growth phase where C. raciborskii cultures have restored the N-status via N2 fixation and therefore the cells are no longer N-depleted.
Our study aimed to detect the early response towards changes in nitrogen availability excluding the acclimation of the cultures. Within this time frame, CS-505 and D9 showed constitutive toxin biosynthesis in all treatments where N was supplied as a dissolved source. This is in agreement with reports of CYNs and PST production in laboratory strains [24,26,42,43,44] and of CYNs in natural environments [45]. Based on the conditions tested in this study, the general implication is that the effect of the N-source is not directly related with toxin production in CS-505 and D9, but rather conditions that negatively affect growth also affect toxin production, as seen under N-deprivation and ammonium. Our results show a clear positive correlation of toxin production to cell growth under nitrate and urea growth for CS-505 (Figure 4A), both treatments which promoted growth. Similar results were shown earlier in C. raciborskii by Hawkins et al. [44] where CYN production correlated with growth rate at exponential phase, in A. ovalisporum [29], and are well described for microcystin producers [13,14]. However, they are in contradiction with reports on Aphanizomenon spp. and C. raciborskii where CYN quotas decoupled from growth rates [24,25,26].
The transcriptional regulator NtcA binds to the consensus sequence GTAN8TAC located at the promoter region of its target genes [36,46]. Upon N limitation, NtcA activates the genes responsible for uptake and assimilation of alternative nitrogen sources, although it can also act as a repressor [1]. Our results showed that even when cells had reduced levels of particulate intracellular nitrogen after 24 h (Figure S1), induction of ntcA was observed by qRT-PCR only after 48 h, after which the transcript levels remained high. If the target genes were regulated by NtcA, transcript abundance should have increased (or decreased) after 48 h of N removal; however, for most of the eight sxt and four cyr gene transcripts quantified by qRT-PCR, there was no transcriptional regulation for the period studied. This suggests that under the studied conditions at early growth stage, STX and CYN biosynthesis is not regulated at the transcriptomic level.
Studies in A. ovalisporum have shown that starvation for sulfate and phosphorous (P) produced a reduction of the cellular CYN content [29] whereas N starvation did not affect CYN content and increasing light intensity resulted in a larger accumulation of CYN in the cells and in the medium [23]. Transcript levels of the CYN biosynthetic genes, aoaA and aoaC (equivalent to cyrA and cyrC of C. raciborskii) decreased in the high light and N starvation experiments indicating that toxin production is regulated by additional mechanisms. Our results support this proposition since removal of N from the medium did not cause changes in the toxin content. An ArbB regulator was found to bind the upstream region of the aoaA and aoaC genes in A. ovalisporum, but no further experiments were carried on to demonstrate the involvement of this transcriptional regulator on CYN biosynthesis [23].
In our cultures, CS-505 cells growing on atmospheric N showed an increased CYN:doCYN ratio. In CYN biosynthesis, doCYN is the precursor that is hydroxylated by the enzyme CyrI to form CYN in a 2-oxoglutarate (2-OG)-dependent manner [38]. Since total CYN and doCYN content was constant, one possible explanation for the increased CYN:doCYN ratio would be an accelerated rate of conversion from doCYN to CYN given by the increased 2-OG levels under N deprivation [47]. CyrI activity assays under various concentrations of 2-OG are required to test this hypothesis. Recent reports showed that the proportion of doCYN to CYN in C. raciborskii is strain dependent and suggested that the changes in the ratio could be given by changes in cyrI activity or variation of the gene sequence [42,48]. Our qRT-PCR data showed no expression changes of cyrI, and only a slight downregulation of cyrB, involved in the synthesis of the precursor doCYN, supporting the first hypothesis.
The variation of PST composition observed in cultures grown with ammonium and under atmospheric N might be related to the stability of the protein complexes that synthesize STX and its analogs. Currently, the post-translational regulation (if any) of the proteins in this pathway remains unknown. Only two studies, with contradictory concluding remarks, reported the effect of chloramphenicol (CAM), a protein synthesis inhibitor, on PST biosynthesis in C. raciborskii T3 and R. brookii D9 (initially misclassified as C. raciborskii D9). Whereas Pomati et al. [49] suggested that PST biosynthetic enzymes have a high turnover rate (based on 76% inhibition of STX with CAM after 24 h), Soto et al. [31] found an early accumulation of STX (but not of GTX2/3), but they could not measure intracellular toxins after 24 h because CAM, in the applied concentrations, induced total cell lysis. The decrease of STX in D9 cultures grown on ammonium (down to the analytical limit of detection) and under N-deprivation, points towards a high turnover rate of STX biosynthetic enzymes.
A decrease of STX:GTX2/3 ratios was observed in ammonium and N-deprivation, in which cells showed slow growth. Thus, a direct correlation of PST analog inter-conversion with N-status (2-OG levels) cannot be inferred as with CYN:doCYN. The inter-conversion of STX into GTX2/3 under low growth must be studied at the enzymatic level. Shifts in the toxin variants have been reported for microcystins, in which increasing nitrogen availability leads to an increase of the nitrogen-rich variant microcystin-RR [50].
The cosmopolitan distribution of these toxic cyanobacterial species and their constitutive production of potent toxins pose increasing challenges for predicting and managing the consequences to aquatic ecosystems and human health. Furthermore, notwithstanding several efforts to identify the ecological and evolutionary functions of cyanobacterial toxins, this aspect remains elusive. It was proposed that in Aphanizomenon ovalisporum, CYN promotes its own inorganic phosphate supply by inducing alkaline phosphatase secretion by other phytoplankton [27]; similar effects were reported when M. aeruginosa was treated with purified CYN and with extracellular medium from a non-toxic C. raciborskii strain [51]. Despite the increase in alkaline phosphatase activity in M. aeruginosa, this effect was not exclusive for CYN and the authors concluded that C. raciborskii produces a hitherto unknown metabolite with allelopathic properties that mimics the effect of CYN. Furthermore, since C. raciborskii has a high affinity for phosphate [52], a role of CYN on phosphate acquisition seems unlikely. Accumulating evidence suggests that PSTs could act extracellularly as a protective mechanism to ensure homeostasis against extreme salt variation in the environment [39,49]. As now, the role of CYN as and PSTs in C. raciborskii and R. brookii (if any) remains to be elucidated. The results presented here show that both cyanobacterial toxin types, CYNs and PSTs, are constitutively synthesized in a growth-dependent manner, independently of the nitrogen source. This implies a role other than N-metabolism.

4. Experimental Section

4.1. Cultures and Experimental Settings

Cylindrospermopsis raciborskii strain CS-505 was isolated from the Solomon Dam in Palm Island, Queensland, Australia and obtained from the CSIRO culture collection, Hobart, Australia. Raphidiopsis brookii D9 (originally classified as C. raciborskii D9) is a clonal isolate from the Billings freshwater reservoir near Sao Paulo, Brazil. Batch cultures of non-axenic C. raciborskii CS-505 and R. brookii D9 were grown in MLA medium on 2 mM sodium nitrate [53] in a controlled environmental chamber on a 12/12 h light/dark photocycle at a photon flux density of 35 µmol·m−2·s−1 at 25 °C. All experiments were performed in three biological replicates starting from a stock culture. To change the experimental N regime, 800 mL of stock culture in early exponential growth phase (OD750 of 0.2) were filtered through an 8 µm pore-size cellulose ester membrane (Millipore, Darmstadt, Germany) which serves as a filter for removal of contaminating free-living bacteria. Cells were resuspended in twice the volume of new MLA medium containing 2 mM sodium nitrate, 2 mM ammonium chloride, 1 mM urea, or without a dissolved external N-source but with 2 mM NaCl to restore osmotic balance. In order to allow for faster growth, experiments were performed for 120 h under a continuous light regime at a photon flux density described above.
For determination of biomass, chlorophyll a, C:N ratios, toxins and RNA isolation, samples from each of the three biological replicates were harvested at time points of 0, 24, 48, 72 and 120 h after the exchange of the N-source. Estimation of biomass was based on optical density (OD750) of 3 mL cell culture and on dry weight from 30 mL harvested cells. Chlorophyll a was extracted from 1 mL samples in technical replicates and measured according to the ISO method [54]. For C:N ratios, technical duplicates (4 mL) from each biological replicate were filtered through a prebaked (500 °C, 5 h) GF/F filter (GE Healthcare, Freiburg, Germany) and analyzed with an Elemental Analyzer (Euro EA, HEKAtech, Wegberg, Germany).
Cellular CYN and PSTs were harvested from 30 mL of experimental cultures after centrifugation (20 min at 3220 g) at room temperature and pellets were frozen at −20 °C until extracted. For the extracellular toxin fraction, 10 mL of supernatant after centrifugation were filtered through a 0.2 μm pore-size nitrocellulose membrane (Carl Roth, Karlsruhe, Germany). To avoid degradation of PSTs, immediately after filtration the pH of the supernatant was adjusted to 2.5 with HCl and the extract was stored at −20 °C.
Frozen cell pellets and supernatants were lyophilized (Beta I Freeze Dryer, Martin Christ, Germany) at −20 °C and ca. 0.004 mbar vacuum. Intra- and extracellular toxins were extracted in 500 μL and 300 μL of 0.05 M acetic acid, respectively. Samples were disrupted with an ultrasonic cell disruptor (Sonoplus Bandelin Electronics, Berlin, Germany) for 1 min; extracellular toxins were transferred to vials and stored at −20 °C until analyzed. Intracellular toxin extracts were centrifuged at 5000 g for 10 min at 4 °C and filtered through a 0.45 μm pore-size membrane filter (Millipore, Darmstadt, Germany) and stored at −20 °C until analysis.

4.2. Analysis of Toxins

PSTs were determined by high performance liquid chromatography with fluorescence detection (LC-FD) following post-column oxidation. Details of the LC-FD analysis, equipment and PST standards are as previously described [55].
Cylindrospermopsin (CYN) and deoxycylindrospermopsin (doCYN) were identified and quantified by liquid chromatography coupled to tandem mass spectrometry (LC-MS/MS). Mass spectral experiments were performed on an ABI-SCIEX-2000 triple quadrupole mass spectrometer (Applied Biosystems, Darmstadt, Germany) coupled to a Model 1100 liquid chromatographic system (Agilent, Waldbronn, Germany).
Separation of CYN and doCYN was performed by reverse-phase chromatography on an analytical column (150 × 3 mm) packed with 3 µm Luna C18 (2) 120 Å (Phenomenex, Aschaffenburg, Germany) and maintained at 20 °C. The flow rate was 0.3 mL·min−1 and gradient elution was performed with two eluents, where eluent A was water and eluent B was methanol/water (95:5 v/v), both containing 2.0 mM ammonium formate and 50 mM formic acid. Initial conditions were 10 min column equilibration with 10% B, followed by a linear gradient to 90% B in 15 min and isocratic elution until 19 min with 90% B. The system was then returned to initial conditions until 20 min (total run time: 30 min).
Selected reaction monitoring (SRM) experiments were carried out in positive ion mode by selecting the following transitions (precursor ion > fragment ion): m/z 400 > 194 and m/z 400 > 176 for doCYN and m/z 416 > 194 and m/z 416 > 176 for CYN. Dwell times of 100 ms were used for each transition. Sample concentrations were calibrated against external standards of CYN and doCYN.
Specific growth and toxin production rates (µc and µtox, respectively) for both PSTs and CYN/doCYN were calculated for each interval in the growth and toxin production curves using either cell biomass (dry weight) or toxin concentration values according to Anderson et al. [56]. Both specific rates are reported in units of d−1.

4.3. Statistical Analysis

All experiments were conducted with three independent biological replicates and results are presented as the mean value (±SD). The means were evaluated with one way ANOVA for multiple comparisons among groups, followed by post hoc comparison using Tukey’s HSD.

4.4. RNA Isolation

Cells for RNA isolation were collected by filtration of 50 mL of culture through an 8 µm pore-size cellulose ester membrane (Millipore, Darmstadt, Germany). Filtered cells were resuspended in 800 µL of RLT lysis buffer (Qiagen, Hilden, Germany), and flash frozen in liquid nitrogen, in a complete process of less than 2 min. Samples were stored at −70 °C and total RNA was extracted with the RNeasy mini-kit (Qiagen, Hilden, Germany) following the manufacturer’s instructions. Briefly, frozen samples were thawed on ice, and cells were disrupted twice for 2 min with 0.1 mm diameter acid-washed glass beads in a tissue lyser (Qiagen, Hilden, Germany). The supernatant was separated from the glass beads and cell debris by centrifugation (10 min, 16,000 g, 4 °C). DNA digestion was performed after RNA isolation for 1 h at RT, followed by a final clean-up with a second 30 min DNA on-column digestion. The presence of genomic DNA in the RNA samples was tested by PCR. RNA was quantified by spectrophotometry (ND-1000, NanoDrop Technologies, Wilmington, DE, USA) and purity was assessed based upon the ratios A260/A230 and A260/A280. If required, samples were further cleaned with a Microcon Elute System (Millipore, Germany). RNA integrity was checked on RNA nano-chips using an Agilent Bioanalyzer 2100 (Agilent Technologies, Waldbronn, Germany).

4.5. qRT-PCR Conditions and Motif Search

The cDNA for qRT-PCR was synthesized from 500 ng total RNA using random hexamers with the Omniscript RT kit (Qiagen, Hilden, Germany). The qRT-PCR reactions were performed in 20 µL reaction mixtures composed of 1 µL 10-fold diluted cDNA, forward and reverse primers at a concentration of 100 nM, and 10 µL 2× SYBR Green PCR Master Mix (Applied Biosystems, Darmstadt, Germany). Cycle parameters were as follows: initial denaturation at 95 °C (10 min), followed by 40 cycles of 95 °C (15 s) and 59 °C (1 min). Finally, a product-primer dissociation step was utilized to verify formation of a single unique product/primer dimerization.
All qRT-PCR primers were designed with Primer Express 3.0 software (Applied Biosystems, Darmstadt, Germany) and synthesized by Eurofins MWG Operon (Ebersberg, Germany). Samples were run in biological and technical triplicates, and mean values were taken among these replicates, including standard deviation. For each primer pair, a standard curve was established by 10-fold dilutions of a PCR template, spanning concentration differences from 100 pg to 1 fg. Linear regression analysis between PCR product concentration and the cycle number (Ct-value) was used to determine primer efficiency and for absolute quantification of each gene transcript. The qRT-PCR amplicon sizes, primer sequences and efficiencies are shown in Table S2. For absolute quantification, cDNA values were obtained from Ct values using the linear regression from the standard curve (Table S2). Copy numbers of each gene transcript were calculated based on the molar mass and length derived from the qRT-PCR amplicon sequences using the Avogadro constant as previously described [57]. Copy numbers were normalized to total RNA of the sample to obtain the absolute copy number of gene transcripts/ng total RNA. Transcript abundance was expressed as the percentage of variation respect to time = 0 (cells grown in nitrate).
The Motif Search tool from the Nano+Bio-Center at the University of Kaiserslautern [58] was employed to search for putative NtcA-binding domains in the intergenic regions outside and within the cyr (41.6 Kb) and sxt (25.7 Kb) gene clusters. The NtcA-binding domains have a canonical sequence defined as GTAN8TAC, and they are separated by approximately 22 nucleotides from a −10 box with the consensus sequence TAN3T [34]. However, differences in the canonical structure and in the length of separation between the promoter and binding site have been described and probed for genes such as petH, nifH and cphA1 [34]. Following these criteria, we set the mismatches to 1, to allow variation in the six conserved positions of the NtcA-binding site. The results were further filtered according to the presence of a −10 box with the conserved motif TAN3T for NtcA-biding regions.

5. Conclusions

In C. raciborskii and R. brookii, both CYNs and PSTs, respectively, are constitutively produced along the growth curve and, to the best of our knowledge, there are no conditions that could arrest toxin production whilst growth conditions are positive. Here we showed that N-deprivation and cytotoxicity caused by ammonia (only in D9), negatively affect CYN and STX biosynthesis in C. raciborskii CS-505 and R. brookii D9, respectively, but in neither case is there evidence that these toxins are transcriptionally regulated as classic inducible/repressible secondary metabolites in response to environmental stress factors. In fact, their production dynamics and regulatory features are more typical of components of primary or intermediary metabolism, albeit of unknown function. In any case, the shifts in the ratios of toxin analogs with a clear independency of biosynthetic gene regulation strongly indicate that shifts in enzymatic activity or post-transcriptional mechanisms are involved in toxin biosynthesis and regulation.

Supplementary Files

  • Supplementary File 1:

    Supporting Information (PDF, 1149 KB)

  • Acknowledgments

    We thank our colleagues (AWI, Bremerhaven, Germany) Annegret Müller for technical support in toxin analysis, and Bernd Krock and Urban Tillmann for critical contributions to the manuscript. Financial support for this work was provided by Grants from Chile (to Mónica Vásquez): Fondecyt 1080075 and 1131037; Fondef MR10I1008; Millennium Nucleus EMBA P04/007; and “Programa de Cooperación Científica Internacional (PCCI) CONICYT/DFG” between the P. Universidad Católica de Chile and the Alfred Wegener Institute Helmholtz Centre for Polar and Marine Research.

    Author Contributions

    Karina Stucken, Uwe John, Mónica Vásquez and Allan Cembella designed the research; Karina Stucken performed the experiments; Karina Stucken and Katia Soto-Liebe analyzed the results; Karina Stucken, Uwe John, Mónica Vásquez and Allan Cembella wrote the manuscript.

    Conflicts of Interest

    The authors declare no conflict of interest.

    References

    1. Herrero, A.; Muro-Pastor, A.M.; Flores, E. Nitrogen control in cyanobacteria. J. Bacteriol. 2001, 183, 411–425. [Google Scholar] [CrossRef]
    2. Carmichael, W.W. The cyanotoxins. Adv. Bot. Res. 1997, 27, 211–256. [Google Scholar] [CrossRef]
    3. Sivonen, K.; Jones, G. Cyanobacterial toxins. In Toxic Cyanobacteria in Water: A Guide to Their Public Health Consequences,Monitoring and Management; Chrorus, I., Bartam, J., Eds.; E & FN Spon: London, UK, 1999; pp. 41–111. [Google Scholar]
    4. Tillett, D.; Dittmann, E.; Erhard, M.; Döhren, von, H.; Börner, T.; Neilan, B.A. Structural organization of microcystin biosynthesis in Microcystis aeruginosa PCC7806: An integrated peptide-polyketide synthetase system. Chem. Biol. 2000, 7, 753–764. [Google Scholar] [CrossRef]
    5. Edwards, D.J.; Gerwick, W.H. Lyngbyatoxin biosynthesis: Sequence of biosynthetic gene cluster and identification of a novel aromatic prenyltransferase. J. Am. Chem. Soc. 2004, 126, 11432–11433. [Google Scholar] [CrossRef]
    6. Moffitt, M.C.; Neilan, B.A. Characterization of the nodularin synthetase gene cluster and proposed theory of the evolution of cyanobacterial hepatotoxins. Appl. Environ. Microbiol. 2004, 70, 6353–6362. [Google Scholar] [CrossRef]
    7. Méjean, A.; Mann, S.; Maldiney, T.; Vassiliadis, G.; Lequin, O.; Ploux, O. Evidence that biosynthesis of the neurotoxic alkaloids anatoxin-a and homoanatoxin-a in the cyanobacterium Oscillatoria PCC 6506 occurs on a modular polyketide synthase initiated by L-proline. J. Am. Chem. Soc. 2009, 131, 7512–7513. [Google Scholar]
    8. Mihali, T.K.; Kellmann, R.; Muenchhoff, J.; Barrow, K.D.; Neilan, B.A. Characterization of the gene cluster responsible for cylindrospermopsin biosynthesis. Appl. Environ. Microbiol. 2008, 74, 716–722. [Google Scholar] [CrossRef]
    9. Grindberg, R.V.; Ishoey, T.; Brinza, D.; Esquenazi, E.; Coates, R.C.; Liu, W.-T.; Gerwick, L.; Dorrestein, P.C.; Pevzner, P.; Lasken, R.; et al. Single cell genome amplification accelerates identification of the apratoxin biosynthetic pathway from a complex microbial assemblage. PLoS One 2011, 6, e18565. [Google Scholar]
    10. Hackett, J.D.; Wisecaver, J.H.; Brosnahan, M.L.; Kulis, D.M.; Anderson, D.M.; Bhattacharya, D.; Plumley, F.G.; Erdner, D.L. Evolution of saxitoxin synthesis in cyanobacteria and dinoflagellates. Mol. Biol. Evol. 2013, 30, 70–78. [Google Scholar] [CrossRef]
    11. Kellmann, R.; Mihali, T.K.; Jeon, Y.J.; Pickford, R.; Pomati, F.; Neilan, B.A. Biosynthetic intermediate analysis and functional homology reveal a saxitoxin gene cluster in cyanobacteria. Appl. Environ. Microbiol. 2008, 74, 4044–4053. [Google Scholar] [CrossRef]
    12. Reynolds, C.S. The Ecology of Phytoplankton; Cambridge University Press: New York, NY, USA, 2006. [Google Scholar]
    13. Orr, P.T.; Jones, G.J. Relationship between microcystin production and cell division rates in nitrogen-limited Microcystis aeruginosa cultures. Limnol. Oceanogr. 1998, 43, 1604–1614. [Google Scholar] [CrossRef]
    14. Long, B.M.; Jones, G.J.; Orr, P.T. Cellular microcystin content in N-limited Microcystis aeruginosa can be predicted from growth rate. Appl. Environ. Microbiol. 2001, 67, 278–283. [Google Scholar]
    15. Sevilla, E.; Martin-Luna, B.; Vela, L.; Teresa Bes, M.; Luisa Peleato, M.; Fillat, M. Microcystin-LR synthesis as response to nitrogen: Transcriptional analysis of the mcyD gene in Microcystis aeruginosa PCC7806. Ecotoxicology 2010, 19, 1167–1173. [Google Scholar] [CrossRef]
    16. Tonk, L.; van De Waal, D.B.; Slot, P.; Huisman, J.; Matthijs, H.C.P.; Visser, P.M. Amino acid availability determines the ratio of microcystin variants in the cyanobacterium Planktothrix agardhii. FEMS Microbiol. Ecol. 2008, 65, 383–390. [Google Scholar] [CrossRef]
    17. Paerl, H. Coastal eutrophication and harmful algal blooms: Importance of atmospheric deposition andgroundwater as “new” nitrogen and other nutrient sources. Limnol. Oceanogr. 1997, 42, 1154–1165. [Google Scholar] [CrossRef]
    18. Anderson, D.M.; Cembella, A.D.; Hallegraeff, G.M. Progress in understanding harmful algal blooms: Paradigm shifts and new technologies for research, monitoring, and management. Annu. Rev. Mar. Sci. 2012, 4, 143–176. [Google Scholar] [CrossRef]
    19. Leong, S.C.Y.; Murata, A.; Nagashima, Y.; Taguchi, S. Variability in toxicity of the dinoflagellate Alexandrium tamarense in response to different nitrogen sources and concentrations. Toxicon 2004, 43, 407–415. [Google Scholar] [CrossRef]
    20. Cembella, A.D. Ecophysiology and metabolism of paralytic shellfish toxins in marine microalgae. In Physiological Ecology of Harmful Algal Blooms; Anderson, D.M., Cembella, A.D., Hallegraeff, G.M., Eds.; Springer Verlag: Heidelberg, Germany, 1998; pp. 381–403. [Google Scholar]
    21. Dias, E.; Pereira, P.; Franca, S. Production of paralytic shellfish toxins by Aphanizomenon sp. LMECYA 31 (cyanobacteria). J. Phycol. 2002, 38, 705–712. [Google Scholar] [CrossRef]
    22. Saker, M.L.; Neilan, B.A. Varied diazotrophies, morphologies, and toxicities of genetically similar isolates of Cylindrospermopsis raciborskii (Nostocales, Cyanophyceae) from northern Australia. Appl. Environ. Microbiol. 2001, 67, 1839–1845. [Google Scholar] [CrossRef]
    23. Shalev-Malul, G.; Lieman-Hurwitz, J.; Viner-Mozzini, Y.; Sukenik, A.; Gaathon, A.; Lebendiker, M.; Kaplan, A. An AbrB-like protein might be involved in the regulation of cylindrospermopsin production by Aphanizomenon ovalisporum. Environ. Microbiol. 2008, 10, 988–999. [Google Scholar] [CrossRef]
    24. Bormans, M.; Lengronne, M.; Brient, L.; Duval, C. Cylindrospermopsin accumulation and release by the benthic cyanobacterium Oscillatoria sp. PCC 6506 under different light conditions and growth phases. Bull. Environ. Contam. Toxicol. 2014, 92, 243–247. [Google Scholar] [CrossRef] [Green Version]
    25. Cirés, S.; Wörmer, L.; Timón, J.; Wiedner, C.; Quesada, A. Cylindrospermopsin production and release by the potentially invasive cyanobacterium Aphanizomenon ovalisporum under temperature and light gradients. Harmful Algae 2011, 10, 668–675. [Google Scholar] [CrossRef]
    26. Preußel, K.; Wessel, G.; Fastner, J.; Chorus, I. Response of cylindrospermopsin production and release in Aphanizomenon flos-aquae (cyanobacteria) to varying light and temperature conditions. Harmful Algae 2009, 8, 645–650. [Google Scholar] [CrossRef]
    27. Bar-Yosef, Y.; Sukenik, A.; Hadas, O.; Viner-Mozzini, Y.; Kaplan, A. Enslavement in the water body by toxic Aphanizomenon ovalisporum, inducing alkaline phosphatase in phytoplanktons. Curr. Biol. 2010, 20, 1557–1561. [Google Scholar] [CrossRef]
    28. Saker, M.L.; Griffiths, D.J. The effect of temperature on growth and cylindrospermopsin content of seven isolates of Cylindrospermopsis raciborskii (Nostocales, Cyanophyceae) from water bodies in northern Australia. Phycologia 2000, 39, 349–354. [Google Scholar] [CrossRef]
    29. Bácsi, I.; Vasas, G.; Surányi, G.; M-Hamvas, M.; Máthé, C.; Tóth, E.; Grigorszky, I.; Gáspár, A.; Tóth, S.; Borbely, G. Alteration of cylindrospermopsin production in sulfate- or phosphate-starved cyanobacterium Aphanizomenon ovalisporum. FEMS Microbiol. Lett. 2006, 259, 303–310. [Google Scholar] [CrossRef]
    30. Saker, M.L.; Neilan, B.A.; Griffiths, D.J. Two morphological forms of Cylindrospermopsis raciborskii (cyanobacteria) isolated from Solomon dam, Palm Island, Queensland. J. Phycol. 1999, 35, 599–606. [Google Scholar]
    31. Soto, K.; Stucken, K.; Méndez, M.A.; Lagos, N.; Cembella, A.D.; Krock, B.; Vásquez, M. The Effects of Chloramphenicol,Arginine and Temperature on PST-production by Cylindrospermopsis raciborskii Strain D9. In Proceedings of the 12th International Conference on Harmful Algae, Copenhagen, Denmark, 4–8 September 2006; Moestrup, O., Ed.; International Society for the Study of Harmful Algae and Intergovernmental Oceanographic Commission of UNESCO: Copenhagen, Denmark, 2008; pp. 330–333. [Google Scholar]
    32. Stucken, K.; John, U.; Cembella, A.; Murillo, A.A.; Soto-Liebe, K.; Fuentes-Valdés, J.J.; Friedel, M.; Plominsky, Á.M.; Vásquez, M.; Glöckner, G. The smallest known genomes of multicellular and toxic cyanobacteria: Comparison, minimal gene sets for linked traits and the evolutionary implications. PLoS One 2010, 5, e9235. [Google Scholar]
    33. Stucken, K. Physiogenomics of Cylindrospermopsis raciborskii/Raphidiopsis brookii: With Emphasis on cyanobacterial Evolution,Nitrogen Control and Toxin Biosynthesis; LAP Lambert Academic Publishing: Saarbrücken, Germany, 2010. [Google Scholar]
    34. Herrero, A.; Muro-Pastor, A.M.; Valladares, A.; Flores, E. Cellular differentiation and the NtcA transcription factor in filamentous cyanobacteria. FEMS Microbiol. Rev. 2004, 28, 469–487. [Google Scholar] [CrossRef]
    35. Su, Z.; Olman, V.; Mao, F.; Xu, Y. Comparative genomics analysis of NtcA regulons in cyanobacteria: regulation of nitrogen assimilation and its coupling to photosynthesis. Nucleic Acids Res. 2005, 33, 5156–5171. [Google Scholar] [CrossRef]
    36. Luque, I.; Flores, E.; Herrero, A. Molecular mechanism for the operation of nitrogen control in cyanobacteria. EMBO J. 1994, 13, 2682–2689. [Google Scholar]
    37. Vega-Palas, M.A.; Madueño, F.; Herrero, A.; Flores, E. Identification and cloning of a regulatory gene for nitrogen assimilation in the cyanobacterium Synechococcus sp. strain PCC 7942. J. Bacteriol. 1990, 172, 643–647. [Google Scholar]
    38. Mazmouz, R.; Chapuis-Hugon, F.; Pichon, V.; Méjean, A.; Ploux, O. The last step of the biosynthesis of the cyanotoxins cylindrospermopsin and 7-epi-cylindrospermopsin is catalysed by CyrI, a 2-oxoglutarate-dependent iron oxygenase. ChemBioChem 2011, 12, 858–862. [Google Scholar] [CrossRef]
    39. Soto-Liebe, K.; Méndez, M.A.; Fuenzalida, L.; Krock, B.; Cembella, A.; Vásquez, M. PSP toxin release from the cyanobacterium Raphidiopsis brookii D9 (Nostocales) can be induced by sodium and potassium ions. Toxicon 2012, 60, 1324–1334. [Google Scholar] [CrossRef]
    40. Plominsky, Á.M.; Larsson, J.; Bergman, B.; Delherbe, N.; Osses, I.; Vásquez, M. Dinitrogen fixation is restricted to the terminal heterocysts in the invasive cyanobacterium Cylindrospermopsis raciborskii CS-505. PLoS One 2013, 8, e51682. [Google Scholar]
    41. Dyble, J.; Tester, P.A.; Litaker, A.R.W. Effects of light intensity on cylindrospermopsin production in the cyanobacterial HAB species Cylindrospermopsis raciborskii. Afr.J. Mar. Sci. 2006, 28, 309–312. [Google Scholar] [CrossRef]
    42. Davis, T.W.; Orr, P.T.; Boyer, G.L.; Burford, M.A. Investigating the production and release of cylindrospermopsin and deoxy-cylindrospermopsin by Cylindrospermopsis raciborskii over a natural growth cycle. Harmful Algae 2014, 31, 18–25. [Google Scholar] [CrossRef]
    43. Yunes, J.S.; La Rocha De, S.; Giroldo, D.; Silveira, S.B.D.; Comin, R.; Bicho, M.D.S.; Melcher, S.S.; Sant’anna, C.L.; Vieira, A.A.H. Release of carbohydrates and proteins by a subtropical strain of Raphidiopsis brookii (cyanobacteria) able to produce saxitoxin at three nitrate concentrations. J. Phycol. 2009, 45, 585–591. [Google Scholar] [CrossRef]
    44. Hawkins, P.R.; Putt, E.; Falconer, I.; Humpage, A. Phenotypical variation in a toxic strain of the phytoplankter, Cylindrospermopsis raciborskii (Nostocales, Cyanophyceae) during batch culture. Environ. Toxicol. 2001, 16, 460–467. [Google Scholar] [CrossRef]
    45. Orr, P.T.; Rasmussen, J.P.; Burford, M.A.; Eaglesham, G.K.; Lennox, S.M. Evaluation of quantitative real-time PCR to characterise spatial and temporal variations in cyanobacteria, Cylindrospermopsis raciborskii (Woloszynska) Seenaya et Subba Raju and cylindrospermopsin concentrations in three subtropical Australian reservoirs. Harmful Algae 2010, 9, 243–254. [Google Scholar] [CrossRef]
    46. Vázquez-Bermúdez, M.F.; Herrero, A.; Flores, E. 2-oxoglutarate increases the binding affinity of the NtcA (nitrogen control) transcription factor for the Synechococcus glnA promoter. FEBS Lett. 2002, 512, 71–74. [Google Scholar] [CrossRef]
    47. Muro-Pastor, M.I.; Reyes, J.C.; Florencio, F.J. Cyanobacteria perceive nitrogen status by sensing intracellular 2-oxoglutarate levels. J. Biol. Chem. 2001, 276, 38320–38328. [Google Scholar]
    48. Jiang, Y.; Xiao, P.; Yu, G.; Sano, T.; Pan, Q.; Li, R. Molecular basis and phylogenetic implications of deoxycylindrospermopsin biosynthesis in the cyanobacterium Raphidiopsis curvata. Appl. Environ. Microbiol. 2012, 78, 2256–2263. [Google Scholar] [CrossRef]
    49. Pomati, F.; Burns, B.P.; Neilan, B.A. Use of ion-channel modulating agents to study cyanobacterial Na+-K+ fluxes. Biol. Res. 2004, 6, 137–143. [Google Scholar]
    50. Van De Waal, D.B.; Verspagen, J.M.H.; Lürling, M.; van Donk, E.; Visser, P.M.; Huisman, J. The ecological stoichiometry of toxins produced by harmful cyanobacteria: An experimental test of the carbon-nutrient balance hypothesis. Ecol. Lett. 2009, 12, 1326–1335. [Google Scholar] [CrossRef]
    51. Rzymski, P.; Poniedziałek, B.; Kokociński, M.; Jurczak, T.; Lipski, D.; Wiktorowicz, K. Interspecific allelopathy in cyanobacteria: cylindrospermopsin and Cylindrospermopsis raciborskii effect on the growth and metabolism of Microcystis aeruginosa. Harmful Algae 2014, 35, 1–8. [Google Scholar] [CrossRef]
    52. Isvánovics, V.; Shafik, H.M.; Présing, M.; Juhos, S. Growth and phosphate uptake kinetics of the cyanobacterium, Cylindrospermopsis raciborskii (Cyanophyceae) in throughflow cultures. Freshwater Biol. 2000, 43, 257–275. [Google Scholar] [CrossRef]
    53. Castro, D.; Vera, D.; Lagos, N.; García, C.; Vásquez, M. The effect of temperature on growth and production of paralytic shellfish poisoning toxins by the cyanobacterium Cylindrospermopsis raciborskii C10. Toxicon 2004, 44, 483–489. [Google Scholar] [CrossRef]
    54. Lawton, L.; Marsalek, B.; Padisák, J.; Chorus, I. Determination of cyanobacteria in the laboratory. In Toxic Cyanobacteria in Water: A Guide to Their Public Health Consequences,Monitoring and Management; Chorus, I., Bartram, J., Eds.; E&FN Spon: London, UK, 1999; pp. 1–28. [Google Scholar]
    55. Tillmann, U.; Alpermann, T.L.; da Purificação, R.C.; Krock, B.; Cembella, A. Intra-population clonal variability in allelochemical potency of the toxigenic dinoflagellate Alexandrium tamarense. Harmful Algae 2009, 8, 759–769. [Google Scholar] [CrossRef]
    56. Anderson, D.M.; Kulis, D.M.; Sullivan, J.J.; Hall, S.; Lee, C. Dynamics and physiology of saxitoxin production by the dinoflagellates Alexandrium spp. Mar. Biol. 1990, 104, 511–524. [Google Scholar] [CrossRef]
    57. Whelan, J.A.; Russell, N.B.; Whelan, M.A. A method for the absolute quantification of cDNA using real-time PCR. J. Immunol. Methods 2003, 278, 261–269. [Google Scholar] [CrossRef]
    58. Services in computational biology, Pattern search. Available online: http://nbc11.biologie.uni-kl.de (accessed on 13 June 2014).

    Share and Cite

    MDPI and ACS Style

    Stucken, K.; John, U.; Cembella, A.; Soto-Liebe, K.; Vásquez, M. Impact of Nitrogen Sources on Gene Expression and Toxin Production in the Diazotroph Cylindrospermopsis raciborskii CS-505 and Non-Diazotroph Raphidiopsis brookii D9. Toxins 2014, 6, 1896-1915. https://doi.org/10.3390/toxins6061896

    AMA Style

    Stucken K, John U, Cembella A, Soto-Liebe K, Vásquez M. Impact of Nitrogen Sources on Gene Expression and Toxin Production in the Diazotroph Cylindrospermopsis raciborskii CS-505 and Non-Diazotroph Raphidiopsis brookii D9. Toxins. 2014; 6(6):1896-1915. https://doi.org/10.3390/toxins6061896

    Chicago/Turabian Style

    Stucken, Karina, Uwe John, Allan Cembella, Katia Soto-Liebe, and Mónica Vásquez. 2014. "Impact of Nitrogen Sources on Gene Expression and Toxin Production in the Diazotroph Cylindrospermopsis raciborskii CS-505 and Non-Diazotroph Raphidiopsis brookii D9" Toxins 6, no. 6: 1896-1915. https://doi.org/10.3390/toxins6061896

    Article Metrics

    Back to TopTop