Article

A Survey of Aflatoxin-Producing Aspergillus sp. from Peanut Field Soils in Four Agroecological Zones of China

1
Institute of Food Science and Technology, Chinese Academy of Agricultural Sciences/Key Laboratory of Agro-Products Processing, Ministry of Agriculture, Beijing 100193, China
2
Shandong Peanut Research Institute, Qingdao 266100, China
3
Qingdao Agricultural University, Qingdao 266109, China
*
Author to whom correspondence should be addressed.
Present address: The College of Life Sciences, Hubei University, Wuhan 430062, China.
Toxins 2017, 9(1), 40; https://doi.org/10.3390/toxins9010040
Submission received: 25 October 2016 / Revised: 5 January 2017 / Accepted: 6 January 2017 / Published: 20 January 2017
(This article belongs to the Special Issue Exposure and Risk Assessment for Mycotoxins)

Abstract

:
Peanut pods are easily infected by aflatoxin-producing Aspergillus sp.ecies from field soil. To assess the aflatoxin-producing Aspergillus sp. in different peanut field soils, 344 aflatoxin-producing Aspergillus strains were isolated from 600 soil samples of four agroecological zones in China (the Southeast coastal zone (SEC), the Yangtze River zone (YZR), the Yellow River zone (YR) and the Northeast zone (NE)). Nearly 94.2% (324/344) of strains were A. flavus and 5.8% (20/344) of strains were A. parasiticus. YZR had the highest population density of Aspergillus sp. and positive rate of aflatoxin production in isolated strains (1039.3 cfu·g−1, 80.7%), the second was SEC (191.5 cfu·g−1, 48.7%), the third was YR (26.5 cfu·g−1, 22.7%), and the last was NE (2.4 cfu·g−1, 6.6%). The highest risk of AFB1 contamination on peanut was in YZR which had the largest number of AFB1 producing isolates in 1g soil, followed by SEC and YR, and the lowest was NE. The potential risk of AFB1 contamination in peanuts can increase with increasing population density and a positive rate of aflatoxin-producing Aspergillus sp. in field soils, suggesting that reducing aflatoxigenic Aspergillus sp. in field soils could prevent AFB1 contamination in peanuts.

1. Introduction

Peanuts (Arachishypogaea L) are an important economic crop in China, with its annual production being the highest on a global level at 16 million tons in 2015. China also accounts for more than 40% of world peanut production [1,2]. The four agroecological zones, namely the Southeast coastal zone (SEC), Yangtze River zone (YZR), the Yellow River zone (YR) and the Northeast zone (NE), are the major peanut producing regions in China [3].
Peanuts are often infected during pre-harvest by Aspergillus sp. which produces aflatoxins that are carcinogenic to humans and animals [4,5]. Soil is the main source of inoculum for aflatoxigenic Aspergillus sp.ecies, and since peanut pods grow underground, they are in direct contact with the soil fungal population [5,6].
Chemically, aflatoxins belong to the bisfuranocoumarin group, with aflatoxins B1 (AFB1), B2, G1, G2 being the most common contaminants. Aflatoxins have the potential to cause outbreaks of acute hepatitis and even liver cancer in animals and humans [7,8]. Of the naturally occurring aflatoxins, AFB1 is known for its toxic and carcinogenic nature [9,10]. In China, AFB1 predominantly contaminates peanuts, with an average rate of 86.2% of the total aflatoxins and a correlation coefficient of 0.99 [11].
Though aflatoxin-producing Aspergillus infection occurs generally on the aerial section of the host plant, soil tends to be the key reservoir for its inoculum and aflatoxin contamination in peanuts. This means it is definitely essential to assess the level of aflatoxin-producing Aspergillus sp. in field soils, which are prone to infecting peanuts when grown in these regions. Differences in the aflatoxin-producing Aspergillus communities in the agroecological zones are of great importance to understand their population dynamics and helping to develop suitable control measures for aflatoxin contamination reduction in the fields [12,13] .
In China, risk assessments of dietary exposure to AFB1 in post-harvest peanuts have been conducted [12,14], but little information exists on the distribution of aflatoxin-producing Aspergillus in the soil from different agroecological zones where peanuts are cultivated. Furthermore, no studies have been conducted on the AFB1 producing potential of Aspergillus in field soils in these regions.
The aim of this work was to examine the distribution and AFB1 producing ability of aflatoxin-producing Aspergillus across the four agroecological zones in peanut-producing soils in China and to determine the reason behind contamination.

2. Results

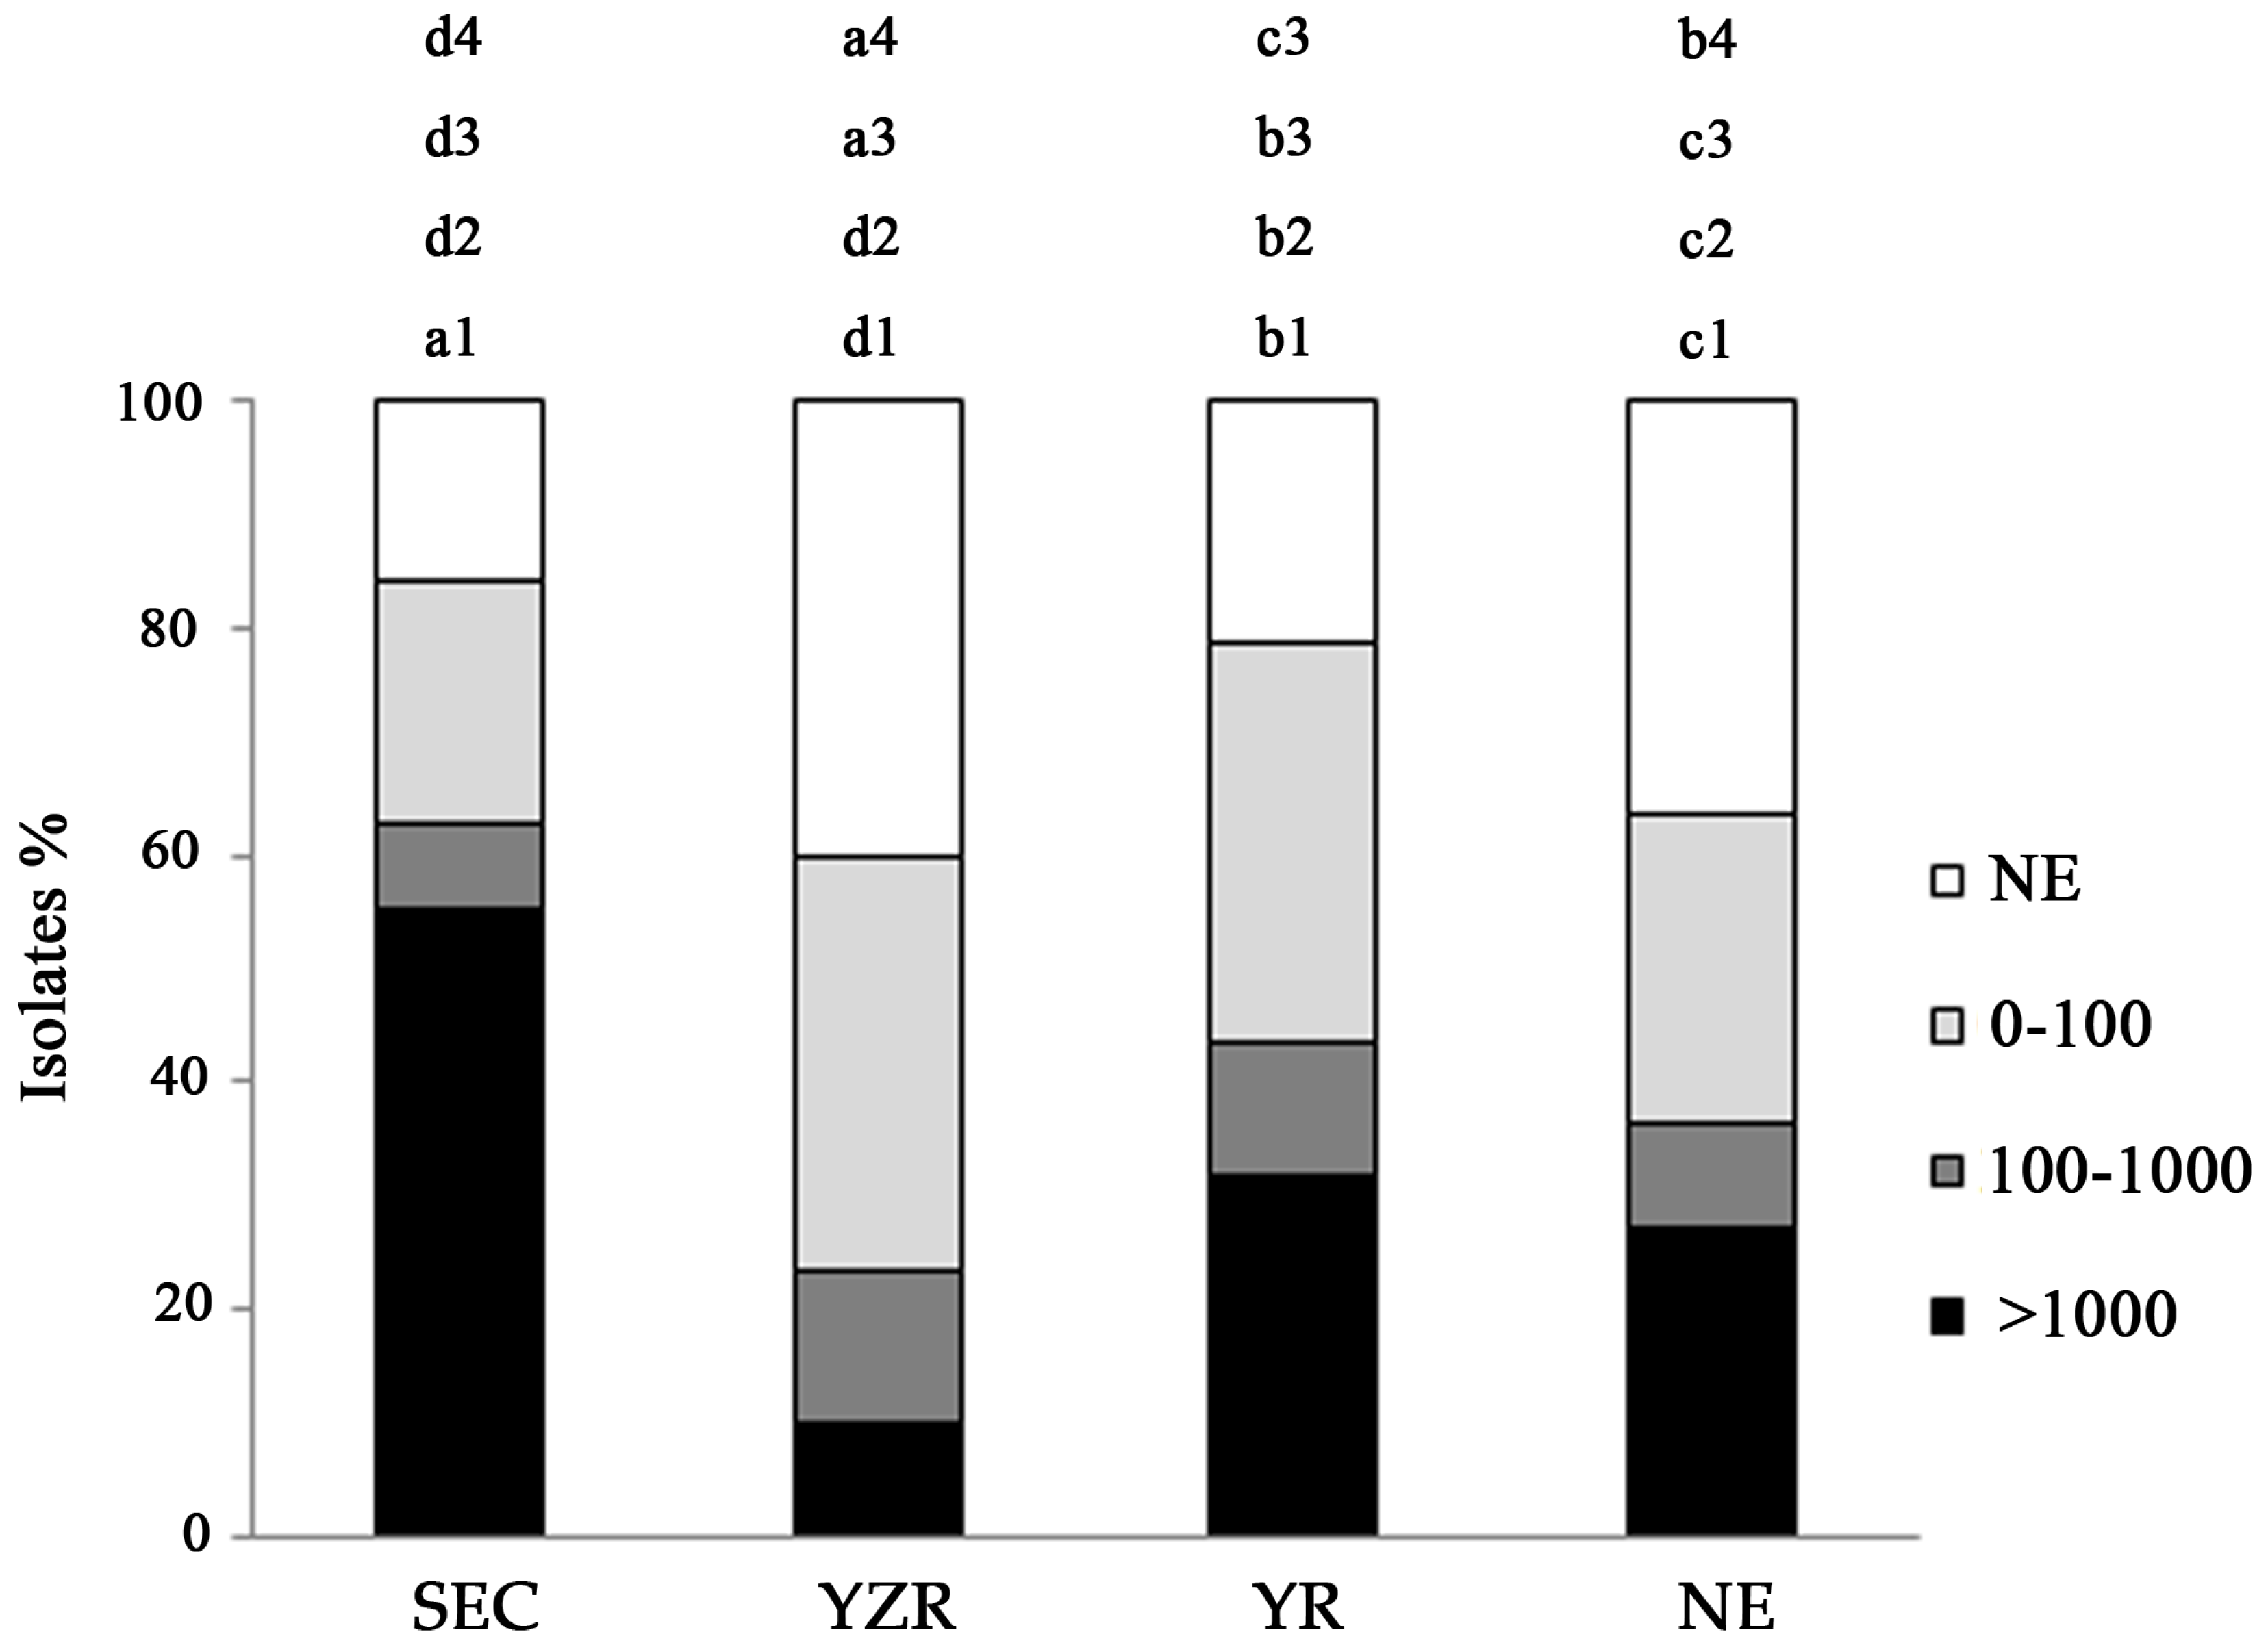
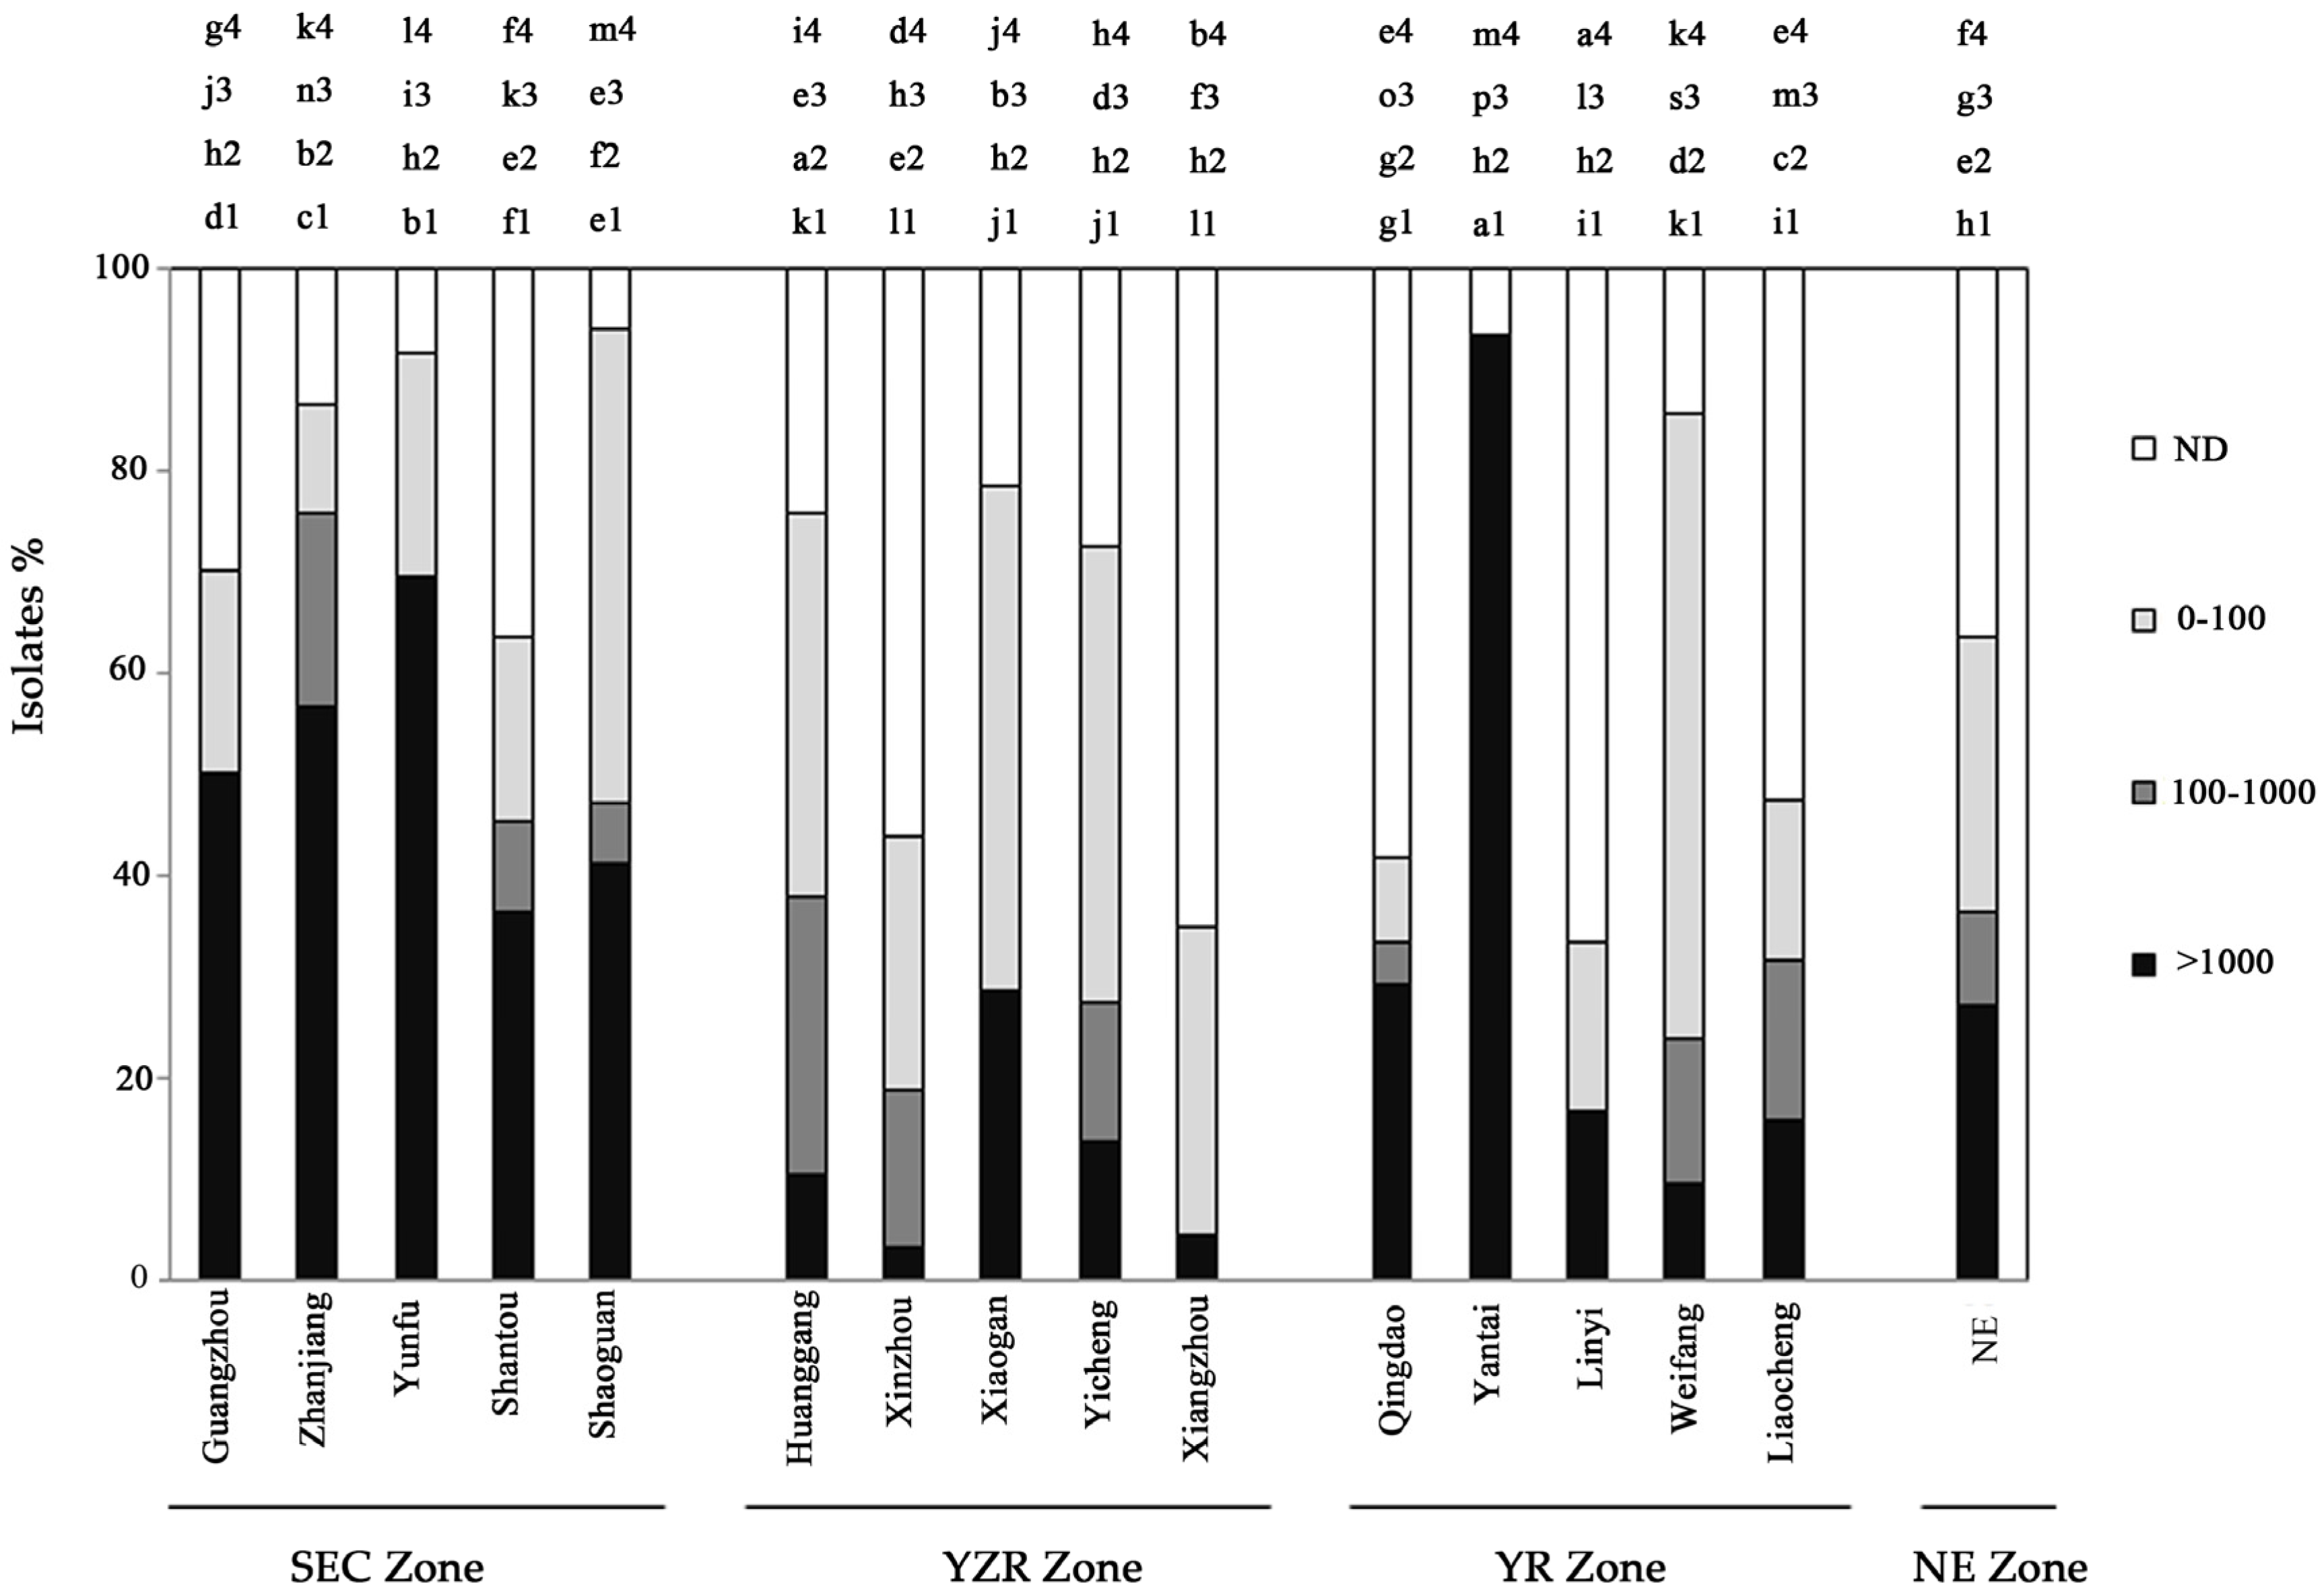
2.1. Distribution of Aflatoxin-Producing Aspergillus across China

Aflatoxin-producing Aspergillus sp.ecies were isolated from all the 600 soil samples collected from the four agroecological zones in China. In total, 344 Aspergillus strains were isolated from all the soil samples (Table 1). Among them, 324 strains (94.2%) were identified as A. flavus and the remaining 20 strains (5.8%) were identified as A. parasiticus. The population of aflatoxigenic A. flavus was highly predominant among the fungal population collected from all the districts.
A significant difference in the population density and positive rate of aflatoxin-producing Aspergillus sp. across the agroecological zones was observed (Table 2). YZR zone (1039.3 cfu·g−1, 80.7%) was the highest, followed by SEC (191.5 cfu·g−1, 48.7%) and YR (26.54 cfu·g−1, 22.7%). But the population density and positive rate of aflatoxigenic Aspergillus sp. in the NE zone (2.4 cfu·g−1, 6.6%) was significantly less than the other three reported zones in this study. The population densities of aflatoxigenic Aspergillus sp. varied among the districts from all the zones, ranging from 1.1 to 2749.3 cfu·g−1. In SEC zone, the Yunfu district recorded the highest population densities of aflatoxin-producing Aspergillus with high positive rate (481.1 cfu·g−1, 66.7%), but was significantly less in Shantou district (19.9 cfu·g−1, the positive rate 36.7%). When compared to SEC zone, population densities and positive rate of aflatoxigenic Aspergillus sp. in YZR zone was significantly higher, with Xiangzhou district (2749.3 cfu·g−1, 90%) being the highest and the lowest was Xiaogan district (55.5 cfu·g−1, 33.3%). But in YR zone, they were significantly lower when compared to SEC and YZR zone, with the Qingdao district (52.2 cfu·g−1, 30.0%) being the highest and Linyi (5.7 cfu·g−1, 16.7%) as the lowest. NE zone recorded significantly lower population densities of aflatoxin-producing Aspergillus and positive rate among all the zones studied, the largest district was Tieling (4.4 cfu·g−1, 13.2%), and the least districts were Dalian (1.1 cfu·g−1, 3.31%) and Shenyang (1.1 cfu·g−1, 3.31%). The population density had a significant positive correlation with the positive rate (r = 0.65). Also, the positive rate had a significant positive correlation with temperature (r = 0.61), but was negatively correlated with longitude (r = −0.71), and pH had a great influence on the positive rate (r = 0.48) (Table 3).
The isolates were further grouped according to sclerotium production and size: L-strain (average diameter >400 μm), S-strain (average diameter <400 μm) and NS (non-sclerotial)-strain (Figure 1). The NS-strains were recorded in highest percentage, representing nearly half of all the isolated strains from all the soil samples. In contrast, the recoveries of L-and S-strains were only 31.7 and 26.7%, respectively. Statistical analysis showed a significant difference in percentage of L, S and NS-strains (p ˂ 0.05). Figure 2 shows the distribution of different aflatoxin-producing Aspergillus morphotype among the sampling districts. Frequencies in the percentage of L, S and NS-strains significantly varied within the districts in each zones. L-strains were not observed in Xiaogan district from YZR zone, Yantai district from YR zone, and NE zone, S -strains were not observed in Yantai district from YR zone, but NS strains were observed in all the zones. NS strains were found to be significantly lower in Guangzhou district from SEC zone than in other districts. S strains were found to be significantly lower in Xiaogan district from YZR zone than in other districts. However, not much of a significant difference was found among the L strains between the zones. The average production of AFB1 by different Aspergillus phenotypes (Figure 1) was significantly different, with the highest being S-strains (5047.5 ng·mL−1), followed by L-strains (2963.4 ng·mL−1), and NS-strains (1304 ng·mL−1).

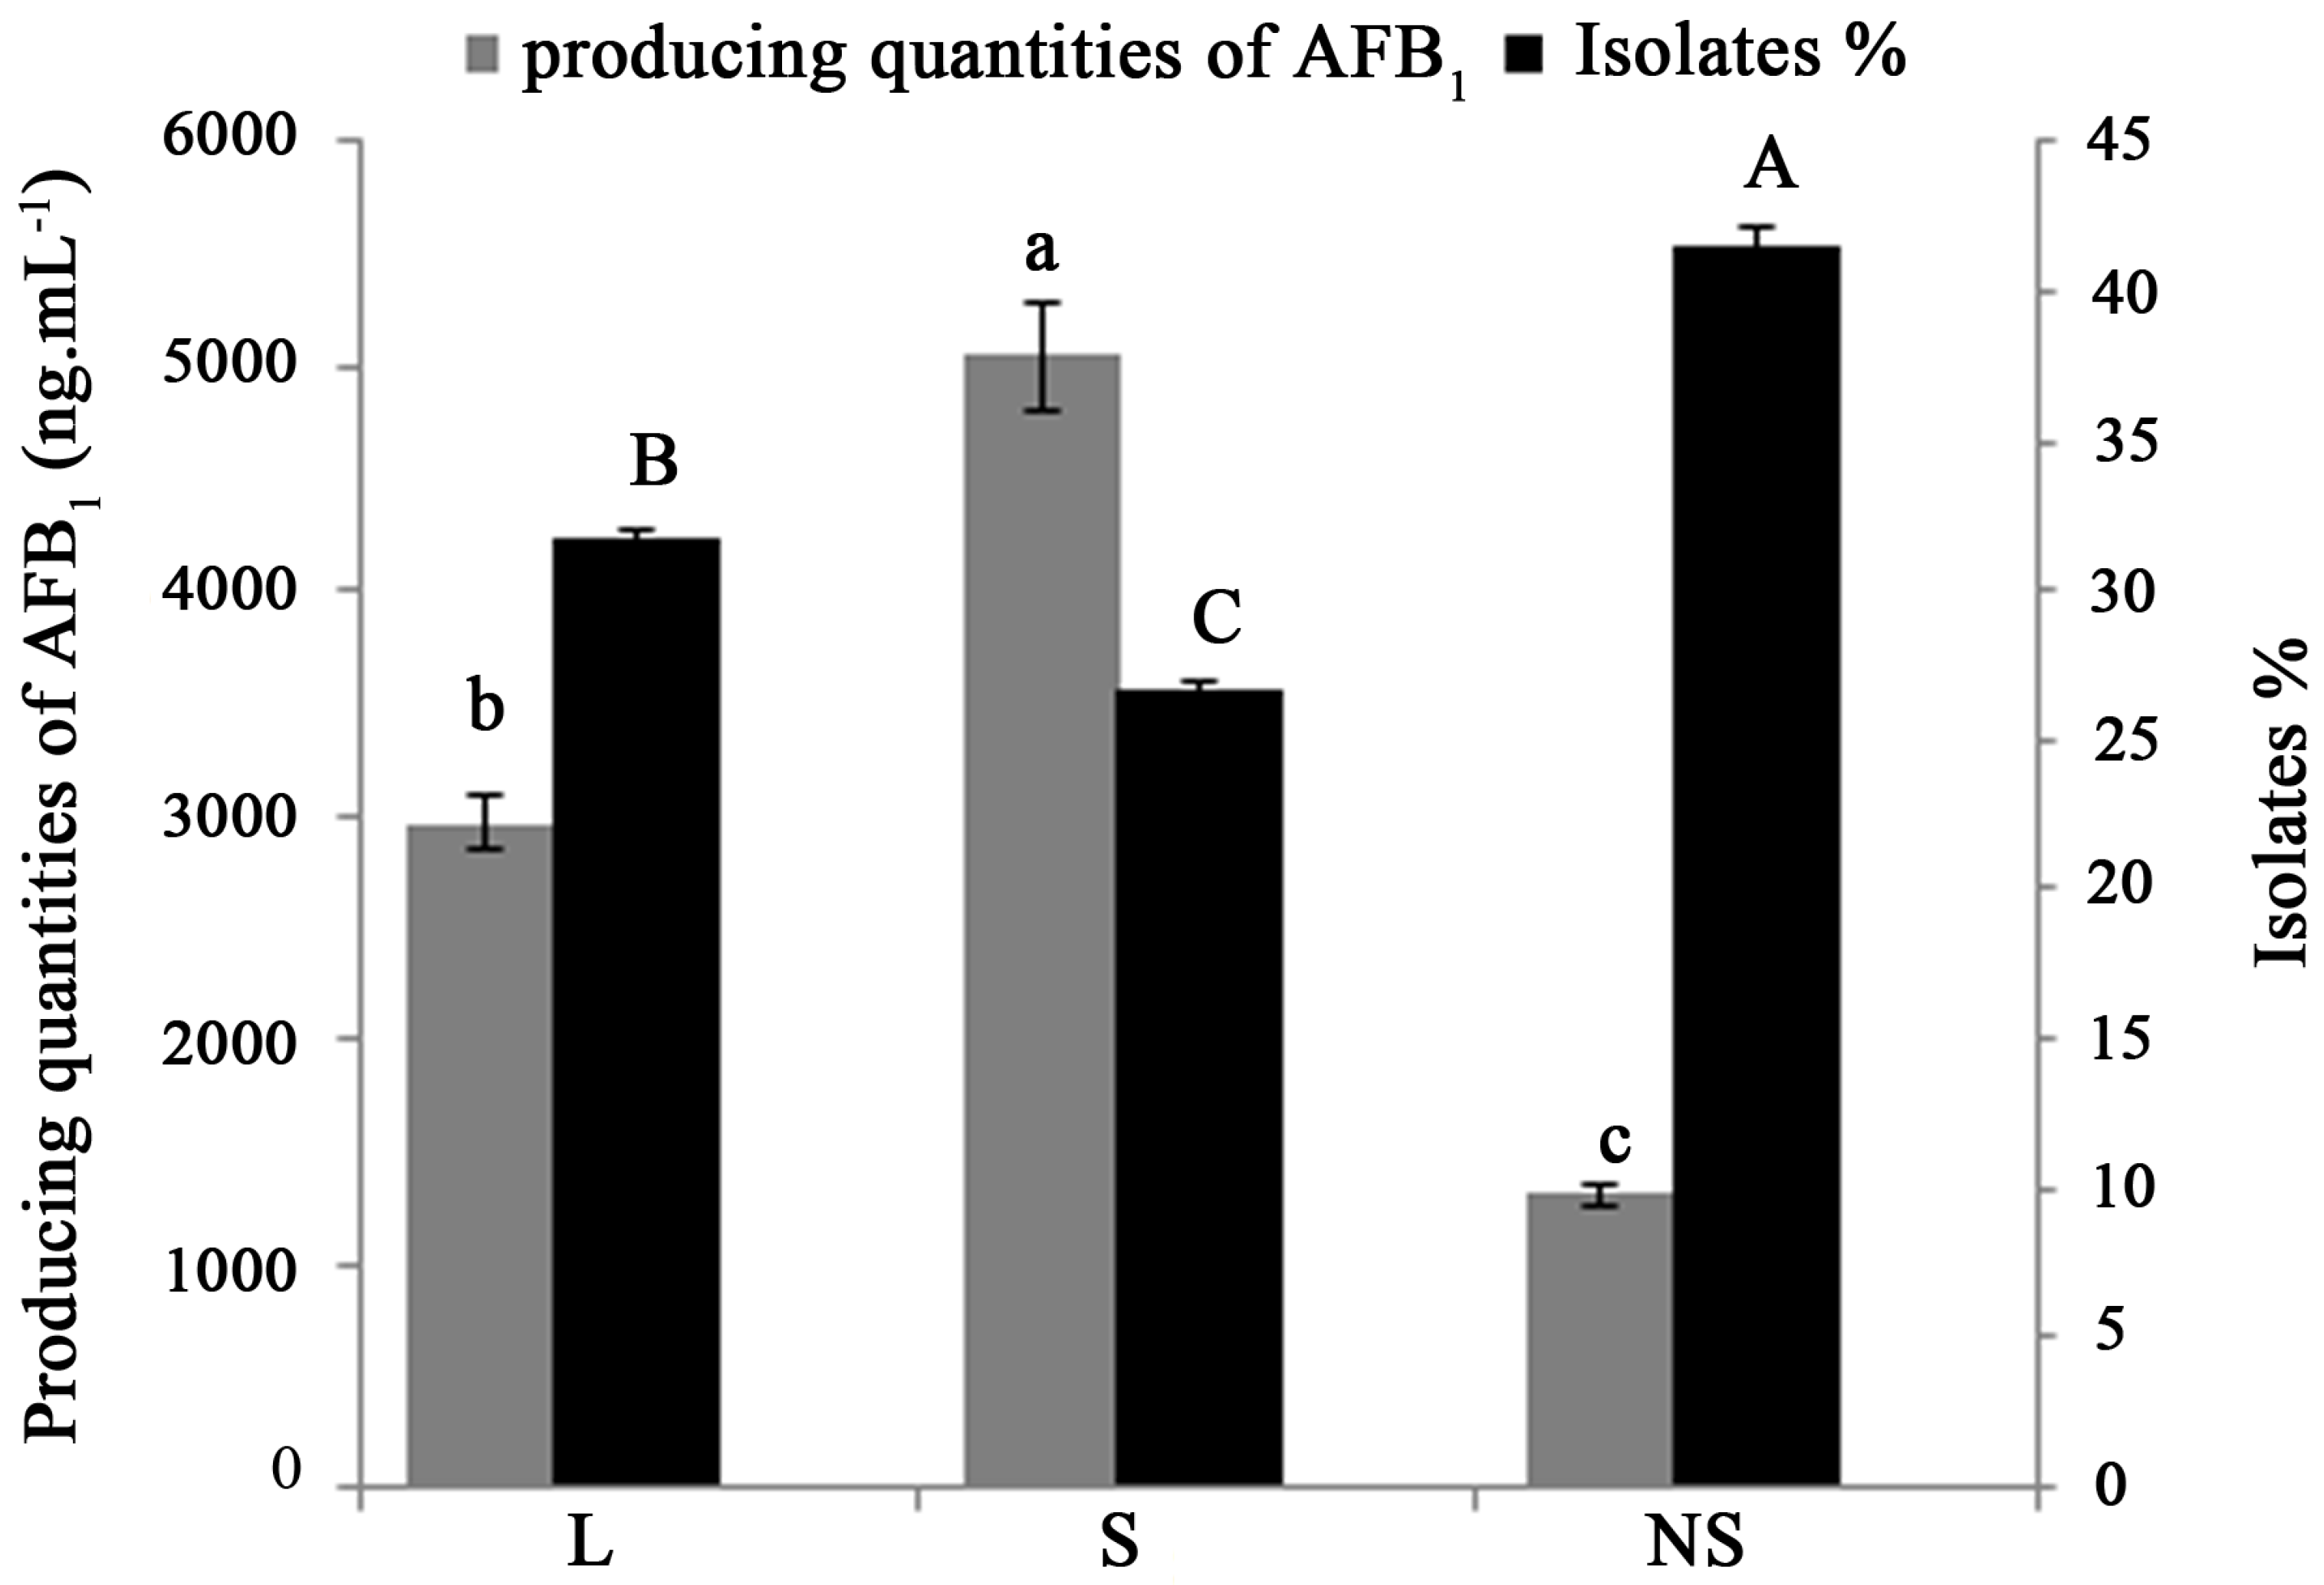
2.2. Distribution of Aflatoxin-Producing Aspergillus Chemotypes

Frequencies of AFB1 production varied among the sampling districts (Figure 3) and agroecological zones (Figure 4). The Yantai district from YR zone had a significantly larger proportion (93.3%) of aflatoxigenic strains (>1000 ng·mL−1) with higher percentage of A. parasiticus (Table 1), compared to all the districts in all zones. The second largest population of highly aflatoxigenic isolates was seen in Yunfu district (69.4%) in SEC zone. Xinzhou and Xiangzhou districts in YZR zone recorded the lowest aflatoxigenic populations with 4.3% and 3.1%, respectively. Among the four agroecological zones, the highest proportion of isolates producing >1000 ng·mL−1 level of aflatoxin was observed in SEC zone (55.4%) which was 5.4 times higher than other zones. The YZR zone had the lowest percentage of isolates (10.2%) producing >1000 ng·mL−1 of aflatoxin.
Aflatoxin-producing potential varied among isolates, species, districts, and agroecological zones (Table 2). All the tested A. parasiticus isolates produced AFB1. The average production of AFB1 by the A. flavus isolates was 3420 ng·mL−1 (range: 0–82,083 ng·mL−1), which was significantly lower than AFB1 production of A. parasiticus isolates with an average of 14,780 ng·mL−1 (range: 5.8–61,899 ng·mL−1). A. flavus contributed the most to the average aflatoxin-producing potential in fungal community resident in twelve districts (Table 2). A. parasiticus made a greater contribution to the aflatoxin-producing potential of fungal communities in the districts of Zhanjiang, Qingdao, and Yantai, and in NE zone. According to Pearson’s correlation analysis (Table 3), there was a significant positive correlation between the average aflatoxin-producing potential of fungal communities and percentage of the isolates which produced high levels of AFB1 (>1000 ng·mL−1) (r = 0.87, p = 0.01).
The average AFB1 producing potential varied widely among the zones. Average AFB1 producing potential of Aspergillus isolates in the SCE zone (5795 ng·mL−1) showed higher significance than the YZR zone (1566 ng·mL−1), but not much of a significant difference from the YR zone (5453 ng·mL−1). The average AFB1-producing potential of Aspergillus isolates in the NE zone (1886 ng·mL−1) was the least significant compared to other zones. Within the zones, the highest average of AFB1 concentration was observed in Yantai district (18,784 ng·mL−1) from YR zone, and the least in Xinzhou district (73 ng·mL−1) from YZR zone (Table 2).
The potential risk areas with respect to aflatoxigenic Aspergillus sp. and their AFB1 production varied among four agroecological zones (Table 4). Based on the AFB1 production, its highest level was seen in SEC zone, where the average production from the isolates taken from 1 gram of soil was 5795 ng·mL−1 (Table 4). The second was YR zone, with an average AFB1 production of 5453 ng·mL−1. The least were NE and YZR zones, where the average aflatoxin production level was lower in isolated strains. As soil is the main reservoir of aflatoxin-producing Aspergillus inoculums and aflatoxin contamination in peanuts, the survey of Aspergillus sp. and their aflatoxin production from 1 gram of soil could reflect the potential risk of contamination. The potential peanut production can be at a higher risk of AFB1 contamination in YZR zone based on the survey, as no isolates in 1 gram of soil were reported as the highest, and least in the NE zone.

3. Discussion

This study provided the first comprehensive documentation of the potential risk of aflatoxin contamination on peanuts by aflatoxigenic Aspergillus sp. in soils from the major peanut producing regions of China. Although aflatoxigenic Aspergillus strains have been reported from various crops and agricultural commodities, agricultural soil serves as the main reservoir of these fungi all over the world [15,16,17,18]. In the present study, A. flavus was the dominant species of Aspergillus fungal population in peanut soil of all districts, which was 94.2% of all strains. Aflatoxin-producing Aspergillus sp. was seen in all districts. In Brazil, A. flavus was the most frequent species of the genus Aspergillus in soil samples from four peanut production regions (13.4%) [19]. In Argentina, the Aspergillus population recovered from peanut seeds showed A. flavus as the most frequently isolated (79%) strain [20]. Not only in peanuts, A. flavus is the predominant species in the soils and vegetables of corn, cotton and other crops [7,21,22,23,24]. Also A. flavus was widely seen reported in temperate and tropical regions [25,26].
The aflatoxin-producing Aspergillus present in all fields, as estimates from dilution plating showed that the population ranged from 1.1 to 2749.315 cfu·g−1 (315 cfu·g−1), which was higher than the population reported from soil in Argentina’s peanut-growing region(212 cfu·g−1) [4], but lower than the Aspergillus population from soil in Nigeria’s maize-growing region (1150 cfu·g−1) [27] and soil of Lowa’s corn-growing region (1231 cfu·g−1) [28].
A. parasiticus was isolated in all four agroecological regions. A. parasiticus is usually found reported in sugar cane, grapes or cassava from tropical and subtropical regions. In SEC zone, which is a tropical and subtropical region, A. parasiticus strains had been isolated from Zhanjiang (Sugar cane as rotating crop) and Yunfu districts (Cassava as rotating crop), which was consistent with the previous studies. But A. parasiticus isolated in the field soils of Yicheng district from YZR zone, Qingdao, Yantai, and Weifang districts from YR zone and Fuxin, and Shenyang from NE zone had maize as the rotating crop. We speculate that A. parasiticus may have had a transmission route with corn as the medium, and the transmission extended from tropical and subtropical to the warm temperate zone and temperate zones.
Sclerotia have been demonstrated to be the survival structure for many fungi. Because sclerotia of aflatoxin-producing Aspergillus can germinate sporogenically, they could be a potential source of primary inoculums. In this study, nearly 60% of the isolates produced sclerotia, which suggest that it is essential for the survival of aflatoxigenic Aspergillus in the peanut ecosystem in China, together with mycelia and conidia. These results are similar to previous studies [4,29].
From the soil samples of China’s peanut-growing region, the NS-strains were isolated in the highest percentage and the S-strains with the lowest percentage. Barros [4] reported the isolation of L-strains in highest percentage from soil samples of peanut-growing region in Argentina. Soil isolates of A. flavus along a transect within the United States were identified as members of either the L-strains (n = 774), or the S-strains (n = 309) [13]. Orum [30] reported ranges of S strain incidence from less than 5% to more than 90%, and the association with cotton cultivation in the southern United States. In Arizona, incidence of S strains is inversely correlated with elevation [31].
So far, researchers have done some research on the effect of crop rotation on A. flavus types. Nesci and Etcheverry [32] recovered only A. flavus L phenotype from insects, soil and debris samples from corn fields alternately cropped with peanuts and soybeans from the same region. In our study, the isolation frequency of the L-strains within the aflatoxin-producing Aspergillus was higher. The L phenotype was recovered in the highest percentage in the districts of Guangzhou, Shaoguan, Huanggang, Yicheng, Qingdao and Liaocheng, and the crop rotation in these six districts were either rice and corn (rice, rice, corn, corn, corn, and corn respectively), so the rotation between corn or rice towards peanut was conducive to the growth and reproduction of the L phenotype. On the other hand, Horn et al. [33] and Cotty et al. 12 found that the S strain was widely distributed in cotton-producing areas in the United States. The condition responsible for the S strains distribution appeared to be complex. In the fields along a transect through the peanut-growing region of the USA described by Horn and Donner 13, the S strain was highly prevalent in west central Texas and Louisiana, where cotton is grown extensively. These studies and our results suggest that the crop could be selecting the phenotype found, as was reported by Garber [3] and Barros [4].
The soil type, landform and rainfall had a greater influence on the growth of aflatoxin-producing Aspergillus in different agroecological zones. In SEC zone, the top three districts with a higher population density of aflatoxigenic Aspergillus sp. and positive rate were Yunfu (481.1 cfu·g−1, 66.7%), Shaoguan (258.6 cfu·g−1, 46.7%) and Zhanjiang (170 cfu·g−1, 56.7%), and the soil types of these districts were all arid hillside, and the least was observed in Guangzhou (27.8cfu·g−1, the positive rate 36.7%) and Shantou (19.9 cfu·g−1, the positive rate 36.7%) where the soil type was paddy soil. The rainfall in the southeast coastal region is more due to the subtropical monsoon climate, and paddy soil has poor drainage, resulting in soil with high water content which is not conducive to the growth of aflatoxigenic Aspergillus. However, the hillside had good drainage and water retention, which produced suitable soil moisture for the growth of A. flavus. In YZR zone, the district with the highest population density and positive rate was Xiangzhou (2749.3 cfu·g−1, 90%), the second was Huanggang district (1920 cfu·g−1,100%), and the least was observed in Xiaogan (55.5 cfu·g−1, 33.3%). High temperatures and a drought period with very little rainfall were observed before two months of peanut harvest in the YZR zone. Meanwhile, the agrotype of Xiangzhou was clay loam and the landform of Huanggang district was plains, which were beneficial to maintaining soil moisture for the growth of aflatoxin-producing Aspergillus. In Xiaogan, the agrotype was sandyloam and the landform was arid hillside, which all were detrimental to water retention, so soil moisture in Xiaogan was too low to inhibit the growth of aflatoxin-producing Aspergillus sp.
The majority of aflatoxin-producing Aspergillus isolates from peanut soil across the four agro-ecological zones was aflatoxigenic. In previous studies, the average aflatoxin-producing potential of fungal communities highly varied. In the southern USA [13,34] and in Argentina’s peanut the majority of Aspergillus isolates produced aflatoxins [35]. While in Iran, only 27.5% of aflatoxin-producing Aspergillus isolates from corn soil were toxigenic [36], and in Nigeria [27], 44% of aflatoxin-producing Aspergillus isolates were aflatoxigenic. Different results of aflatoxigencity among Aspergillus section Flavi population may be attributed to differences in prevailing climatic conditions, the cultivar grown, and local agricultural practices.
We observed a positive association between aflatoxin production and sclerotia phenotype in A. flavus isolates from China peanut soil since the S strains produce higher levels of aflatoxin than the L strain isolates and similar results were found in Argentina [4,37]. These results are supported by previous studies that showed an evident interrelationship between regulation, biosynthesis and sclerotia morphogenesis [4,38].
Orum et al. [30] postulated that temperature, soil condition, day length, crop sequence history, insect levels, rainfall frequency and management practice may influence aflatoxin-producing Aspergillus communities. All these factors and many other micro-climatic factors are different between these four agroecological zones of China. In the present study, the population density had a significant positive correlation with positive rate (r = 0.65). Positive rate of Aspergillus sp. had a significant positive correlation with temperature (r = 0.61), and a significant negative correlation with longitude (r = −0.71), had positive correlation with pH (r = 0.48). The incidences of the L-strain had significant positive correlation with soil pH and had a negative correlation with latitude. In Nigeria, the incidences of the L-strain also had a significant negative correlation with latitude [27].
The AFB1 producing potential isolates in field soils significantly varied among the four peanut production areas. YZR had the largest number of AFB1 producing potential isolates, while the least was NE. Ding [39] researched the distribution of AFB1 contamination in post-harvest peanut in China, and the highest was observed in the Yangtze River ecological region and the lowest in NE. In our present study, the Yangtze River ecological region had the largest AFB1-producing potential isolates in 1 g soil, and AFB1 contamination in post-harvest peanut in this region was also reported to be higher. Meanwhile, NE had the least AFB1 producing potential isolates in 1 g soil, and AFB1 contamination in post-harvest peanut in this region was also lowest. AFB1 contamination in post-harvest peanuts was closely related to the AFB1 producing potential of peanut fields. Therefore, we drew the conclusion that AFB1 contamination risk mainly came from aflatoxin-producing Aspergillus sp. in peanut field soils. We can predict that the highest risk zone for AFB1 contamination in peanuts is YZR zone, followed by SEC and YR zone. However, NE zone tends to be highly safe for peanut cultivation.
The potential risk of AFB1 contamination in peanuts will increase with an increase in population density and positive rate of aflatoxin-producing Aspergillus strains in peanut field soils. YZR had the higher population density and positive rate of aflatoxin-producing Aspergillus strains (1039.3 cfu·g−1, 80.7%), the next highest were SEC (191.5 cfu·g−1, 48.7%) and YR (26.5 cfu·g−1, 22.7%), and the last was NE (2.4 cfu·g−1, 6.6%). These results suggest that the reduction in the number of aflatoxin-producing Aspergillus strains in field soil is crucial for controlling AFB1 contamination in peanuts. Novel biological control technology has been developed in recent years that can prevent AFB1 contamination in peanuts. The application of non-toxigenic A. flavus strains to the peanut crop seems to be one of the most efficient strategies [40,41].

4. Conclusions

This study has shown that A. flavus is the dominant species in peanut soil fungal population in all the agroecological zones, with widespread aflatoxigentic strains. The YZR zone is highly prone to AFB1 contamination risk in peanuts, as the study has shown that it has the highest Aspergillus sp. population density with a positive rate of aflatoxin production. However, the number of A. parasiticus identified was lower compared to A. flavus, though, their presence should not be overlooked, as they indicate the possibility of high-risk exposure due to their high level of AFB1 production. The influence of AFB1 through peanuts on human populations in China over the past decade demonstrates a clear need for tools to manage contamination of locally produced peanuts. Given the widespread nature of AFB1- producing strains, any control strategy should include field interventions.

5. Materials and Methods

5.1. Survey Sites

Soil samples were collected from peanut fields across four agroecological zones: Southeast coastal (SEC), the Yangtze River (YZR), the Yellow River (YR), and the Northeast (NE). Five districts were selected for study sites within each agroecological zones, and these which districts were separated geographically by at least 50 km. Field ecology information for each sampling region are shown in Table 5.

5.2. Survey Methods

Six hundred soil samples from fifteen districts (30 from each district) were collected at harvest time. Each soil sample (100 g) consisted of a pool of five subsamples taken with a trowel from the top 5 cm of soil at 5–10 m intervals. The samples were placed in plastic bags with pinholes for gas exchange and transferred to the laboratory and stored at 4–5 °C for further assay [4].

5.3. Strain Isolation and Identification

Ten grams of soil from each of the total 600 soil samples were diluted with 90 mL of 0.1% (w/v) peptone water and kept at room temperature (25 ± 2°C) for 20 min on a thermostatic shaker (Hunan Xiangyi Instrument Co., Ltd, Changsha, China. This mixture was decimally diluted and a 0.1 mL aliquot was spread on dichloran-18% glycerol (DG18) at appropriate dilution to allow collection of isolates from plates with fewer than 10 colonies. The plates were incubated in the dark for 5–7 days at 30 °C. At the end of the incubation period, the average number of duplicate colonies was determined and the results were expressed as colony-forming units per gram (cfu·g−1) of soil. Isolates were sub-cultured at 30 °C on malt extract agar (MEA).
All isolates were preliminarily identified based on their characteristic growth patterns on AFPA (A. flavus and A. parasiticus agar) [43] and CYA (Czapek yeast autolysis) [44]. The identities of the strains were further confirmed by molecular analysis, which involved sequencing of their calmodulin genes [44]. The calmodulin gene in each isolate was amplified using the primers CL1 (GARTWCAAGGAGGCCTTCTC) and CL2A (TTTTTGCATCATGAGTTGGAC).

5.4. Classification of Aflatoxin-Producing Aspergillus morphotypes

To induce the production of sclerotia, the strains were incubated in Czaper medium, in triplicate, and maintained in darkness at 30 °C for 14 days. Following this period, Tween 20 (100 μL/L, 5 mL) was added, and the surface was scraped so that the mycelia could be filtered through Whatman No.2 filter paper. The sclerotia were washed in distilled water and placed in microtubes until further analysis [37]. To measure the mean diameter of the sclerotia for each strain, 10 sclerotia from each replicate were randomly selected and the arithmetic mean was calculated.

5.5. Mycotoxin Analyses

The liquid fermentation method used by Barros [4] was modified and used for qualitative determination of AFB1 production by aflatoxin-producing Aspergillus. The strains were induced to sporulate on MEA slants at 28 °C for 5 days. After incubation, 5 mL of Sterilized distilled water was added to the slant followed by vigorous agitation to obtain a spore suspension. The spore concentration was measured using a cell counting plate and adjusted to 106 spores mL−1. Approximately 105 spores were used to inoculate 50 mL vials containing 10 mL of liquid medium made by dissolving 150 g of sucrose, 20 g of yeast extract, and 10 g of soytone, in 1 L of distilled water; the pH of the medium was adjusted to 6.0 with HCl. One vial was incubated per isolate and performed in triplicate. The cultures were incubated for 7 days at 30 °C with 200 rpm in the dark. Vial cultures were analyzed by high-performance liquid chromatography for the production of AFB1. HPLC analysis was performed using Waters 2695 (Waters Corporation, Milford, MA, USA) coupled to Waters 2475 fluorescence detector (λ exc 360 nm; λ em 440 nm) and a post-column derivation system, and an Agilent TC-C18 column (250 × 4.6 mm, 5 μm particle size). The mobile phase (water:methanol:acetonitrile, 4:1:1) was pumped at a flow rate of 0.5 mL/min. AFB1 procured from Sigma-Aldrich (St. Louis, MO, USA) was used as standard. The mean recovery of the method used was calculated by culture medium at different levels ranging from 0.5 to 100 ng/g of AFs and was estimated at 95.2% ± 8.4%. The lowest detection limit was 0.5 ng of AFB1 per mL [45].

5.6. Statistical Analysis

Analyses were performed with SPSS (version 18.0). Analysis of variance was performed on all data with the general linear model (GLM), suitable for unbalanced data. The GLM of SPSS uses the least-squares method to fit data to a general linear model. Tukey’s honestly significant difference (HSD) test was performed to compare treatment means at the 5% level. Pearson’s correlation coefficients were generated to assess relationships between ecological and biological variables.

Acknowledgments

This research was supported by the National Basic Research Program (973 Program) of China (2013CB127801, 2013CB127805), and the Special Fund for Agro-scientific Research in the Public Interest (201203037).

Author Contributions

Yang Liu contributed to the experimental design, analyzed the data, and provided critical feedback for the manuscript. Chushu Zhang was responsible for the experimental design, conducted the experiments, analyzed the data and wrote the manuscript. Jonathan Nimal Selvaraj and Qingli Yang provided critical feedback and approved the manuscript.

Conflicts of Interest

The authors declare no conflict of interest.

References

  1. Statistical Yearbook of China. Available online: http://www.stats.gov.cn/tjsj/ndsj/2016/indexch.htm/ (accessed on 20 September 2016).
  2. FAOSTAT: Crop. Available online: http://www.fao.org/faostat/zh/#data/QC (accessed on 20 September 2016).
  3. Yu, S.C.W. Peanut varieties and their genealogy in china; Shanghai scientific and Technical publishers: Shanghai, China, 2008. [Google Scholar]
  4. Barros, G.; Torres, A.; Chulze, S. Aspergillus flavus population isolated from soil of Argentina's peanut-growing region. Sclerotia production and toxigenic profile. J. Sci. Food Agric. 2005, 85, 2349–2353. [Google Scholar]
  5. Dorner, J.W. Managent and prevention of mycotoxins in peanuts. Food Addit. Contam.-Part A Chem. Anal. Control Exp. Risk Assess. 2008, 25, 203–208. [Google Scholar] [CrossRef] [PubMed]
  6. Torres, A.M.; Rodriguez, M.I.; Chulze, S.N. Genetic diversity within aspergillus flavus strains isolated from peanut-cropped soils in argentina. Soil Biol. Biochem. 2006, 38, 145–152. [Google Scholar]
  7. Mahgubi, A.E.; Puel, O.; Bailly, S.; Tadrist, S.; Querin, A.; Ouadia, A.; Oswald, I.P.; Bailly, J.D. Distribution and toxigenicity of aspergillus section flavi in spices marketed in Morocco. Food Control 2013, 32, 143–148. [Google Scholar] [CrossRef]
  8. Fountain, J.C.; Scully, B.T.; Chen, Z.Y.; Gold, S.E.; Glenn, A.E.; Abbas, H.K.; Lee, R.D.; Kemerait, R.C.; Guo, B. Effects of hydrogen peroxide on different toxigenic and atoxigenic isolates of aspergillus flavus. Toxins 2015, 7, 2985–2999. [Google Scholar] [CrossRef] [PubMed]
  9. Ortega-Beltran, A.; Jaime, R.; Cotty, P.J. Aflatoxin-producing fungi in maize field soils from sea level to over 2000masl: A three year study in sonora, mexico. Fungal Biol. 2015, 119, 191–200. [Google Scholar] [CrossRef] [PubMed]
  10. Kana, J.R.; Harvey, J.; Wainaina, J.; Wanjuki, I.; Skilton, R.A.; Teguia, A. Assessment of aflatoxin contamination of maize, peanut meal and poultry feed mixtures from different agroecological zones in cameroon. Toxins 2013, 5, 884–894. [Google Scholar] [CrossRef] [PubMed]
  11. Ding, X.; Li, P.; Bai, Y.; Zhou, H. Aflatoxin b 1 in post-harvest peanuts and dietary risk in china. Food Control 2012, 23, 143–148. [Google Scholar] [CrossRef]
  12. Cotty, P.J. Aflatoxin-producing potential of communities of aspergillus section flavi from cotton producing areas in the united states. Mycol. Res. 1997, 101, 698–704. [Google Scholar] [CrossRef]
  13. Horn, B.W.; Dorner, J.W. Regional differences in production of aflatoxin b1 and cyclopiazonic acid by soil isolates of aspergillus flavus along a transect within the united states. Appl. Environ. Microbiol. 1999, 65, 1444–1449. [Google Scholar] [PubMed]
  14. Williams, J.H.; Phillips, T.D.; Jolly, P.E.; Stiles, J.K.; Jolly, C.M.; Aggarwal, D. Human aflatoxicosis in developing countries: A review of toxicology, exposure, potential health consequences, and interventions. Am. J. Clin. Nutr. 2004, 80, 1106–1122. [Google Scholar] [PubMed]
  15. Tran-Dinh, N.; Kennedy, I.; Bui, T.; Carter, D. Survey of vietnamese peanuts, corn and soil for the presence of aspergillus flavus and aspergillus parasiticus. Mycopathologia 2009, 168, 257–268. [Google Scholar] [CrossRef] [PubMed]
  16. Giorni, P.; Magan, N.; Pietri, A.; Bertuzzi, T.; Battilani, P. Studies on aspergillus section flavi isolated from maize in northern italy. Int. J. Food Microbiol. 2007, 113, 330–338. [Google Scholar] [CrossRef] [PubMed]
  17. Sweany, R.R.; Damann, K.E., Jr; Kaller, M.D. Comparison of soil and corn kernel aspergillus flavus populations: Evidence for niche specialization. Phytopathology 2011, 101, 952–959. [Google Scholar] [CrossRef] [PubMed]
  18. Amani, S.; Shams-Ghahfarokhi, M.; Banasaz, M.; Razzaghi-Abyaneh, M. Mycotoxin-producing ability and chemotype diversity of aspergillus section flavi from soils of peanut-growing regions in iran. Indian J. Microbiol. 2012, 52, 551–556. [Google Scholar] [CrossRef] [PubMed]
  19. Atayde, D.D.; Reis, T.A.; Godoy, I.J.; Zorzete, P.; Reis, G.M.; Corrêa, B. Mycobiota and aflatoxins in a peanut variety grown in different regions in the state of são paulo, brazil. Crop Protect. 2012, 33, 7–12. [Google Scholar] [CrossRef]
  20. Nesci, A.; Montemarani, A.; Etcheverry, M. Assessment of mycoflora and infestation of insects, vector of aspergillus section flavi, in stored peanut from argentina. Mycotoxin Res. 2011, 27, 5–12. [Google Scholar] [CrossRef] [PubMed]
  21. Jaimegarcia, R.; Cotty, P.J. Aspergillus flavus in soils and corncobs in south texas: Implications for management of aflatoxins in corn-cotton rotations. Plant Dis. 2007, 88, 1366–1371. [Google Scholar] [CrossRef]
  22. Scarpari, M.; Bello, C.; Pietricola, C.; Zaccaria, M.; Bertocchi, L.; Angelucci, A.; Ricciardi, M.R.; Scala, V.; Parroni, A.; Fabbri, A.A. Aflatoxin control in maize by trametes versicolor. Toxins 2014, 6, 3426–3437. [Google Scholar] [CrossRef] [PubMed]
  23. Astoreca, A.; Vaamonde, G.; Dalcero, A.; Marin, S.; Ramos, A. Abiotic factors and their interactions influence on the co-production of aflatoxin b 1 and cyclopiazonic acid by aspergillus flavus isolated from corn. Food Microbiol. 2014, 38, 276–283. [Google Scholar] [CrossRef] [PubMed]
  24. Joffe, A.Z. Aflatoxin produced by 1,626 isolates of aspergillus flavus from groundnut kernels and soils in israel. Nature 1969, 221, 492. [Google Scholar] [CrossRef] [PubMed]
  25. Pinto, V.F.; Patriarca, A.; Locani, O.; Vaamonde, G. Natural co-occurrence of aflatoxin and cyclopiazonic acid in peanuts grown in argentina. Food Addit. Contam. 2001, 18, 1017–1020. [Google Scholar] [CrossRef] [PubMed]
  26. Ehrlich, K.C.; Kobbeman, K.; Montalbano, B.G.; Cotty, P.J. Aflatoxin-producing aspergillus species from thailand. Int. J. Food Microbiol. 2007, 114, 153–159. [Google Scholar] [CrossRef] [PubMed]
  27. Donner, M.; Atehnkeng, J.; Sikora, R.A.; Bandyopadhyay, R.; Cotty, P.J. Distribution of aspergillus section flavi in soils of maize fields in three agroecological zones of nigeria. Soil Biol. Biochem. 2009, 41, 37–44. [Google Scholar] [CrossRef]
  28. Shearer, J.F.; Sweets, L.E.; Baker, N.K.; Tiffany, L.H. A study of aspergillus flavus/parasiticus in iowa crop fields: 1988–1990. Plant Dis. 1992, 76, 19–22. [Google Scholar] [CrossRef]
  29. Zorzete, P.; Reis, T.A.; Felício, J.D.; Baquião, A.C.; Makimoto, P.; Corrêa, B. Fungi, mycotoxins and phytoalexin in peanut varieties, during plant growth in the field. Food Chem. 2011, 129, 957–964. [Google Scholar] [CrossRef] [PubMed]
  30. Orum, T.V.; Bigelow, D.M.; Nelson, M.R.; Howell, D.R.; Cotty, P.J. Spatial and temporal patterns of aspergillus flavus strain composition and propagule density in yuma county, arizona, soils. Plant Dis. 2007, 81, 911–916. [Google Scholar] [CrossRef]
  31. Antilla, L.; Cotty, P. The ars-acrpc partnership to control aflatoxin in arizona cotton: Current status. Mycopathologia 2002, 155, 64. [Google Scholar]
  32. Nesci, A.; Etcheverry, M. Aspergillus section flavi populations from field maize in argentina. Lett. Appl. Microbiol. 2002, 34, 343–348. [Google Scholar] [CrossRef] [PubMed]
  33. Horn, B.; Dorner, J. Soil populations of aspergillus species from section flavi along a transect through peanut-growing regions of the united states. Mycologia 1998, 767–776. [Google Scholar] [CrossRef]
  34. Garber, R.K.; Cotty, P.J. Formation of sclerotia and aflatoxins in developing cotton bolls infected by the s strain of aspergillus flavus and potential for biocontrol with an atoxigenic strain. Phytopathology 1997, 87, 940–945. [Google Scholar] [CrossRef] [PubMed]
  35. Pildain, M.B.; Vaamonde, G.; Cabral, D. Analysis of population structure of aspergillus flavus from peanut based on vegetative compatibility, geographic origin, mycotoxin and sclerotia production. Int. J. Food Microbiol. 2004, 93, 31–40. [Google Scholar] [CrossRef] [PubMed]
  36. Razzaghi-Abyaneh, M.; Shams-Ghahfarokhi, M.; Allameh, A.; Kazeroon-Shiri, A.; Ranjbar-Bahadori, S.; Mirzahoseini, H.; Rezaee, M.B. A survey on distribution of aspergillus section flavi in corn field soils in iran: Population patterns based on aflatoxins, cyclopiazonic acid and sclerotia production. Mycopathologia 2006, 161, 183–192. [Google Scholar] [CrossRef] [PubMed]
  37. Novas, M.V.; Cabral, D. Association of mycotoxin and sclerotia production with compatibility groups in aspergillus flavus from peanut in argentina. Plant Dis. 2002, 86, 215–219. [Google Scholar] [CrossRef]
  38. Okoth, S.; Nyongesa, B.; Ayugi, V.; Kang’Ethe, E.; Korhonen, H.; Joutsjoki, V. Toxigenic potential of aspergillus species occurring on maize kernels from two agro-ecological zones in kenya. Toxins 2012, 4, 991–1007. [Google Scholar] [CrossRef] [PubMed] [Green Version]
  39. Ding, X.; Wu, L.; Li, P.; Zhang, Z.; Zhou, H.; Bai, Y.; Chen, X.; Jiang, J. Risk assessment on dietary exposure to aflatoxin b₁ in post-harvest peanuts in the yangtze river ecological region. Toxins 2014, 7, 4157–4174. [Google Scholar] [CrossRef] [PubMed]
  40. Mylroie, J.E.; Ozkan, S.; Shivaji, R.; Windham, G.L.; Alpe, M.N.; Williams, W.P. Identification and quantification of a toxigenic and non-toxigenic aspergillus flavus strain in contaminated maize using quantitative real-time pcr. Toxins 2016, 8. [Google Scholar] [CrossRef] [PubMed]
  41. Yin, Y.; Lou, T.; Yan, L.; Michailides, T.J.; Ma, Z. Molecular characterization of toxigenic and atoxigenic aspergillus flavus isolates, collected from peanut fields in china. J. Appl. Microbiol. 2009, 107, 1857–1865. [Google Scholar] [CrossRef] [PubMed]
  42. Weather History. Available online: http://lishi.tianqi.com/ (accessed on 25 September 2016).
  43. Cotty, D.P.J. Comparison of four media for the isolation of aspergillus flavus group fungi. Mycopathologia 1994, 125, 157–162. [Google Scholar] [CrossRef] [PubMed]
  44. Rodrigues, P.; Santos, C.; Venâncio, A.; Lima, N. Species identification of aspergillus section flavi isolates from portuguese almonds using phenotypic, including maldi-tof icms, and molecular approaches. J. Appl. Microbiol. 2011, 111, 877–892. [Google Scholar] [CrossRef] [PubMed]
  45. Horn, B.W.; Layton, R.C. Association of morphology and mycotoxin production with vegetative compatibility groups in aspergillus flavus, a. Parasiticus, and a. Tamarii. Mycologia 1996, 88, 574–587. [Google Scholar] [CrossRef]
Figure 1. Distribution and producing quantities of AFB1 of different phenotype of aflatoxin-producing Aspergillus in peanut fields of China. For each bar, vertical lines represent the standard error of the mean; means not sharing a common letter are significantly different according to Tukey’s HSD test (p = 0.05).
Toxins 09 00040 g001
Figure 2. Distribution of different phenotype of aflatoxin-producing Aspergillus sp. among districts.
Toxins 09 00040 g002
Figure 3. Variation of among districts in the percent of aflatoxin-producing Aspergillus isolates producing quantities of AFB1. ND, none AFB1 detected; 0–100, producing of AFB1 by isolates was 0–100 ng·mL−1; 100–1000, producing of AFB1 by isolates was 100–1000 ng·mL−1; >1000, production of AFB1 by isolates was >1000 ng·mL−1; lines not sharing a common letter are significantly different (p ≤ 0.05) according to Tukey’s HSD test on ranks of AFB1 concentrations.
Toxins 09 00040 g003
Figure 4. Variation of among four agroecological zones in the percent of aflatoxin-producing Aspergillus isolates producing quantities of AFB1 in China. ND, none AFB1 detected; 0–100, production of AFB1 by isolates was 0–100 ng·mL−1; 100–1000, producing of AFB1 by isolates was 100–1000 ng·mL−1; >1000, producing of AFB1 by isolates was >1000 ng·mL−1; a line not sharing a common letter is significantly different (p ≤ 0.05) according to Turkey’s HSD test on ranks of AFB1 concentrations.
Toxins 09 00040 g004
Table 1. Distribution of aflatoxin-producing Aspergillus in peanut fields from four agroecological zones of China a.
AZE bDistrict%A.f c%A.p dNumber of Isolatescfu·g−1 SoilPositive Rate (%) eSoil pHSoil Moisture (%)
RangeMean
SECGuangzhou1000200–399.627.8f36.7h6.2821.08
Zhanjiang946320–1666.7170e56.7e5.1315.35
Yunfu946330–5667.7481.1c66.7d5.3618.05
Shantou1000130–133.319.9f36.7h6.1220.15
shaoguan1000170–2333.3258.6d46.7f6.3214.06
YZRHuanggang10002933.3–66601920b100a6.8619.20
Xinzhou1000320–1000174.3e83.3c5.6617.53
Xiaogan1000140–666.755.5f33.3j4.957.30
Yicheng973290–1000297.5d96.7a6.7911.29
Xiangzhou1000230–16,6652749.3a90b6.5512.57
YRQingdao928240–30052.2f30.0i4.787.84
Yantai4753150–233.316.7f23.3j5.3014.52
Linyi100060–66.75.7f16.7k5.2118.41
Weifang9010210–20024.4f40.0gh5.905.90
Liaocheng1000190–166.733.7f43.3fg7.187.18
NEDalian100010–33.31.1f3.3l5.5013.90
Jinzhou100040–33.32.2f6.7l6.385.31
Fuxin010010–66.73.3f6.7l5.535.11
Shenyang505020–33.31.1f3.3l5.422.50
Tieling100030–33.34.4f13.2k4.713.24
a Means determined by Tukey’s HSD test (α = 0.05); values in a column followed by a different letter are significantly different; b SEC, Southeast coastal zone; YZR, the Yangtze River zone; YR, the Yellow River zone; and NE, the Northeast zone; c %A.f was the percentage of A. flavus in all isolates; d %A.p was the percentage of A. parasiticus in all isolates; e Positive rate (%) was the percentage of the soils which can isolate A. flavus in 30 soil sample of each district.
Table 2. Quantities of AFB1 produced by aflatoxin-producing Aspergillus isolated among four agroecological zones of China a.
AZE bDistrictAflatoxin B1 (ng·mL−1)
A. flavusA. parasiticusAverage c
RangeMeanRangeMean
SECGuangzhou0–25,3008473a--8473b
Zhanjiang0–25,8125536d238–20,17210,324b5788d
Yunfu0–82,0836493c70–1380725c6173cd
Shantou0–16,5014178f--4178e
shaoguan0–26,2933092h--3092f
Total 5805A-5465C5795A
YZRHuanggang0–17,5121220j--1220gh
Xinzhou0–108973m--73i
Xiaogan0–28,9707611b--7611bc
Yicheng0–34,8701803i5.85.8c1741g
Xiangzhou0–2662147m--147i
Total 1579C-5.8D1566D
YRQingdao0–30,5883493g4154–13,9239039b3955ef
Yantai0–23,2258343a7111–61,89927,920a18784a
Linyi0–2312392l--392hi
Weifang0–60,3313734f14.6–57.536c3381ef
Liaocheng0–8640710k--710ghi
Total 3041B-20,125A5453B
NENE0–3278366159–17,29387261886
Total0–3278366D15917,2938726B1886C
a Means with by Turkey’s HSD test (α = 0.05); in a column followed by a different letter are significantly different; b SEC, Southeast coastal zone; YZR, the Yangtze River zone; YR, the Yellow River zone and NE, the Northeast zone; c Mean aflatoxin of all isolates.
Table 3. Pearson’s correlation coefficients of relationships among the quantity of AFB1 producing Aspergillus in soil (cfu·g1), positive rate %, the proportion of Aspergillus isolates with AFB1 producing ability ˃1000 ng·mL1, 100–1000 ng·mL−1, 0–100 ng·mL1 , the proportion of L-stain, S-strain and NS-strain, the average AFB1 quantification, the potential risk of AFB1 contamination (ng·mL1/g soil), average temperature (TEM), the longitude (LONG), latitude (LAT), pH and soil moisture (%).
cfu·g−1%Positive Rate% ˃ 1000 %100–1000 %0–100AFB1AFB1 Risk%L%S%NSTEM%LONG%LATpH% Moisture
cfu·g−11.00
%Positive rate0.65 **1.00
% ˃ 1000−0.34 −0.26 1.00
%100–10000.13 0.37 −0.40 1.00
%0–1000.17 0.10 −0.51 0.21 1.00
%L0.07 0.23 −0.20 0.23 0.14 1.00
%S−0.06 −0.18 0.04 −0.07 −0.21 −0.31 1.00
* NS−0.03 −0.11 0.17 −0.17 0.00 −0.78 **−0.35 1.00
AFB1−0.31 −0.32 0.87**−0.41 −0.36 −0.25 −0.31 0.45 1.00
AFB1 risk0.39 0.50 *0.29 0.18 0.08 0.08 0.15 −0.18 0.05 1.00
TEM0.33 0.61 *−0.06 0.15 0.19 0.24 −0.22 −0.09 −0.01 0.42 1.00
%LONG−0.06 −0.38 −0.33 −0.01 0.03 −0.26 −0.23 0.40 −0.08 −0.46 −0.64 1.00
%LAT−0.36 −0.71 **0.03 −0.14 −0.21 −0.30 −0.10 0.36 0.18 −0.48 −0.76 **0.78 **1.00
pH0.42 0.48 −0.41 0.43 0.30 0.49 −0.20 −0.35 −0.39 0.06 0.21 −0.06 −0.28 1.00
%moisture0.15 0.35 0.27 −0.02 −0.34 0.11 0.15 −0.20 0.10 0.36 0.42 −0.64 **−0.29 0.09 1.00
Correlation significance,* 0.01 < p < 0.05 ,** p < 0.01; n = 16.
Table 4. Variation among agroecological zones of China for colony-forming units of aflatoxin-producing Aspergillus, positive rate, the mean quantities of producing AFB1 of isolated strains, potential producing AFB1 ability in soil a.
AEZNo. of FieldsCFU/g Soil%Positive Rate%Af b%Ap bNo. of Tested IsolatesAflatoxin B1c(ng·mL−1)
SEC5191.5b48.7b96.6a3.4c1215795a
YZR51039.3a80.7a99.1a0.9d1271566c
YR526.5c22.7c85.9b14.1b855453d
NE52.4d6.6d81.8b18.2a111886b
a Means with by Tukey’s HSD test (α = 0.05); values in a column followed by a different letter are significantly different; b Af% means the proportion of Aspergillus flavus; Ap% the proportion of Aspergillus parasiticus; c Mean aflatoxin of all isolates.
Table 5. Eco-environmental information of peanut fields.
AEZ aDistrictLatitude (N)Longitude (E)Temp bAgrotypeLandformAlternative Crop
SECGuangzhou23.158029113.27316527.81Sandy loamPaddy soilRice
Zhanjiang21.377219110.2501727.94Sandy loamArid hillsideSugarcane
Yunfu22.768595111.57001128.08Sandy loamArid hillsideSweet potato
Shantou23.285832116.72648126.62Sandy loamPaddy soilRice
Shaoguan24.682728113.60454926.88Sandy loamPaddy soilRice
YZRHuanggang30.64299114.87286628.69Sandy loamPlainCotton
Xinzhou30.841401114.80125928.65Sandy loamPlainCotton
Xiaogan31.562299114.12809728.40Sandy loamArid hillsideSweet potato
Yicheng31.719806112.25778826.74Sandy loamPlainMaize
Xiangzhou32.087779112.21177227.69Clay loamMoundMaize
YRQingdao35.79045118.62791825.02Sandy loamArid hillsideMaize
Yantai37.387331121.6004925.47Sandy loamArid hillsideMaize
Linyi35.8725120.0464325.70Sandy loamArid hillsideSweet potato
Weifang36.706945118.82991426.44Sandy loamArid hillsideMaize
Liaocheng36.866062116.23147826.38Sandy loamArid hillsideMaize
NEDalian38.950245121.56587322Sandy loamArid hillsideVegetable
Jinzhou41.117250121.12832321Sandy loamArid hillsideMaize
Fuxin42.065175121.75790119.5Sandy loamArid hillsideMaize
Shenyang42.74995123.35351920Sandy loamArid hillsideMaize
Tieling42.785798124.11109820Sandy loamArid hillsideMaize
a SEC, Southeast coastal zone; YZR, the Yangtze River zone; YR, the Yellow River zone; and NE, the Northeast zone; b Temp was the average temperature for 60 days before harvest; the temperature of everyday was obtained from the historical weather of weather network [42].

