Article

Molecular Surveillance of Viral Processes Using Silicon Nitride Membranes

by
Brian L. Gilmore
1,†,
Justin R. Tanner
1,†,
Allison O. McKell
1,
Crystal E. Boudreaux
1,
Madeline J. Dukes
2,
Sarah M. McDonald
1 and
Deborah F. Kelly
1,*
1
Virginia Tech Carilion Research Institute, 2 Riverside Circle, Roanoke, VA 24016, USA
2
Protochips, Inc., 616 Hutton Street, Raleigh, NC 27606, USA
*
Author to whom correspondence should be addressed.
These authors contributed equally to this work.
Micromachines 2013, 4(1), 90-102; https://doi.org/10.3390/mi4010090
Submission received: 5 November 2012 / Revised: 18 December 2012 / Accepted: 5 March 2013 / Published: 14 March 2013
(This article belongs to the Special Issue Micromachined Tools for Nanoscale Science and Technology)

Abstract

:
Here we present new applications for silicon nitride (SiN) membranes to evaluate biological processes. We determined that 50-nanometer thin films of SiN produced from silicon wafers were sufficiently durable to bind active rotavirus assemblies. A direct comparison of SiN microchips with conventional carbon support films indicated that SiN performs equivalent to the traditional substrate to prepare samples for Electron Microscopy (EM) imaging. Likewise, SiN films coated with Ni-NTA affinity layers concentrated rotavirus particles similarly to affinity-coated carbon films. However, affinity-coated SiN membranes outperformed glow-discharged conventional carbon films 5-fold as indicated by the number of viral particles quantified in EM images. In addition, we were able to recapitulate viral uncoating and transcription mechanisms directed onto the microchip surfaces. EM images of these processes revealed the production of RNA transcripts emerging from active rotavirus complexes. These results were confirmed by the functional incorporation of radiolabeled nucleotides into the nascent RNA transcripts. Collectively, we demonstrate new uses for SiN membranes to perform molecular surveillance on life processes in real-time.

Graphical Abstract

1. Introduction

Experiments performed at the level of individual cells and molecules have the capacity to shed new light on elusive biological processes. Microscale devices are currently being used to capture rare cells from whole blood [1], to lyse cells [2], to screen for drug candidates [3] and to immobilize living microorganisms [4]. Fluidic chambers composed of silicon nitride (SiN)-based microchips with nanometer-thin windows provide new tools to view the progression of chemical processes using electron microscopy [5,6]. Although these devices are currently being used to evaluate properties of hard materials [7,8], they are not as widely utilized to assess biological polymers.
Amorphous carbon is the conventional support material used to prepare biological specimens for transmission electron microscopy (EM) imaging. Micron-sized holes engineered into carbon films provide a transparent background, ideal for imaging weak-phase objects such as protein machinery suspended in vitreous ice (reviewed by Taylor and Glaeser, 2008) [9]. One inherent limitation with the use of these support films is the beam-induced movement that is generated from illuminating the specimen suspended in the holes. Alternatives support films have been recently introduced to mitigate this effect. They include conductive materials composed of titanium-silicon metal glass (Ti88Si12) [10] and silicon carbide (cryomesh) [11]. Both of these materials exhibited less movement due to charging effects in recorded images of frozen-hydrated specimens. Importantly, results from these studies showed new support materials could greatly improve our capacity to view biological entities beyond what is achievable with conventional carbon substrates.
In our present work, we use SiN support films as active visualization platforms for on-chip experiments. Here, SiN microchips play an interactive role in hosting microscale biological reactions. The concept of utilizing support films as active devices builds upon our previously developed Affinity Capture technology [12,13]. Affinity Capture devices are SiN microchips coated with a biofilm containing Nickel-nitrilotriacetic acid (Ni-NTA). These “affinity-coated” chips are used to recruit tagged macromolecules specifically to the chip surface for EM structural studies. A major advantage in the design of the devices is the impermeable 50-nm SiN window that exhibits a low degree of electron scattering and allows researchers to examine biological machinery at the molecular level [12]. Our current work demonstrates that virus assemblies typically produced on graphitized carbon support films may instead be produced on SiN microchips. A direct comparison of the two substrates indicated microchips provided a better surface for functionalizing and capturing active viral particles.
Understanding the mechanisms by which viruses infect and replicate within host cells is critical for the design of pharmacological inhibitors and vaccines to prevent viral-induced diseases. For rotaviruses, important pediatric gastrointestinal pathogens, it is known that the first steps in the viral lifecycle entail (i) uncoating of virions to create double-layered particles (DLPs) and (ii) induction of DLPs to transcribe viral RNAs [14]. Here we show that rotavirus uncoating and transcription can be recapitulated in vitro on SiN chips and directly visualized by EM. These reactions require incubation steps under conditions that are incompatible with conventional carbon support films but can be easily performed on the impermeable SiN surfaces. Thus, SiN chips can serve as a versatile microscale bioreactor to follow the mechanistic progression of the first steps of the rotavirus lifecycle as would occur in host cells. Overall, we anticipate the use of these devices will allow researchers in the nanotechnology community to study life processes in greater detail and in a manner that is biologically significant.

2. Materials and Methods

2.1. Preparation of Viral Complexes

Approximately 1 × 10⁹ monkey kidney (MA104) cells were infected with trypsin-activated rotavirus (strain SA11-4F) at a high multiplicity of infection as described previously [15]. Infected cells were subjected to three rounds of freeze-thaw, and the culture supernatant was clarified by centrifugation at 1500 × g for 10 min. Triple-layered particles (TLPs) in the supernatant were then pelleted through a 35% (w/v) sucrose cushion in TNC buffer (20 mM Tris-HCl pH 8.0, 100 mM NaCl, 1 mM CaCl) at 133,000 × g for 90 min. TLPs were purified by isopycnic centrifugation in CsCl (density of 1.36 g/cm3) at 137,000 × g for 16 h. Purified TLPs were collected in a 500-μL fraction, dialyzed exhaustively against TNC buffer, and stored at 4 °C.
Rotavirus DLPs were created by treating TLPs with 20 mM EDTA followed by purification using isopycnic centrifugation in CsCl (density of 1.38 g/cm3). Purified DLPs were collected in a 500-μL fraction, dialyzed exhaustively against TNE buffer (20 mM Tris-HCl pH 7.5, 50 mM NaCl, 2 mM EDTA) and stored at 4 °C.

2.2. In vitro Transcription Reactions

For gel analysis, TLPs were either untreated or treated with 2 mM EDTA for 2 min at 37 °C prior to being used for in vitro transcription reactions. Each 50-μL reaction contained 1 μg TLPs, 100 mM Tris-HCl pH 7.5, 6 mM MgAc, 4 mM DTT, 2 mM each of ATP, GTP, CTP, and UTP, 1 μL RNasin (Promega) and 1 μCi of [α-32P] UTP (3000 Ci/mmol) and proceeded for 30 minutes at 37 °C. The nucleic acid was deproteinated by phenol:chloroform:isoamyl alcohol extraction and single-stranded RNA transcripts were resolved in a 5% polyacrylamide TBE-urea gel (BioRad Criterion). The gel was dried onto filter paper and visualized using a GE Storm 860 phosphorimager.

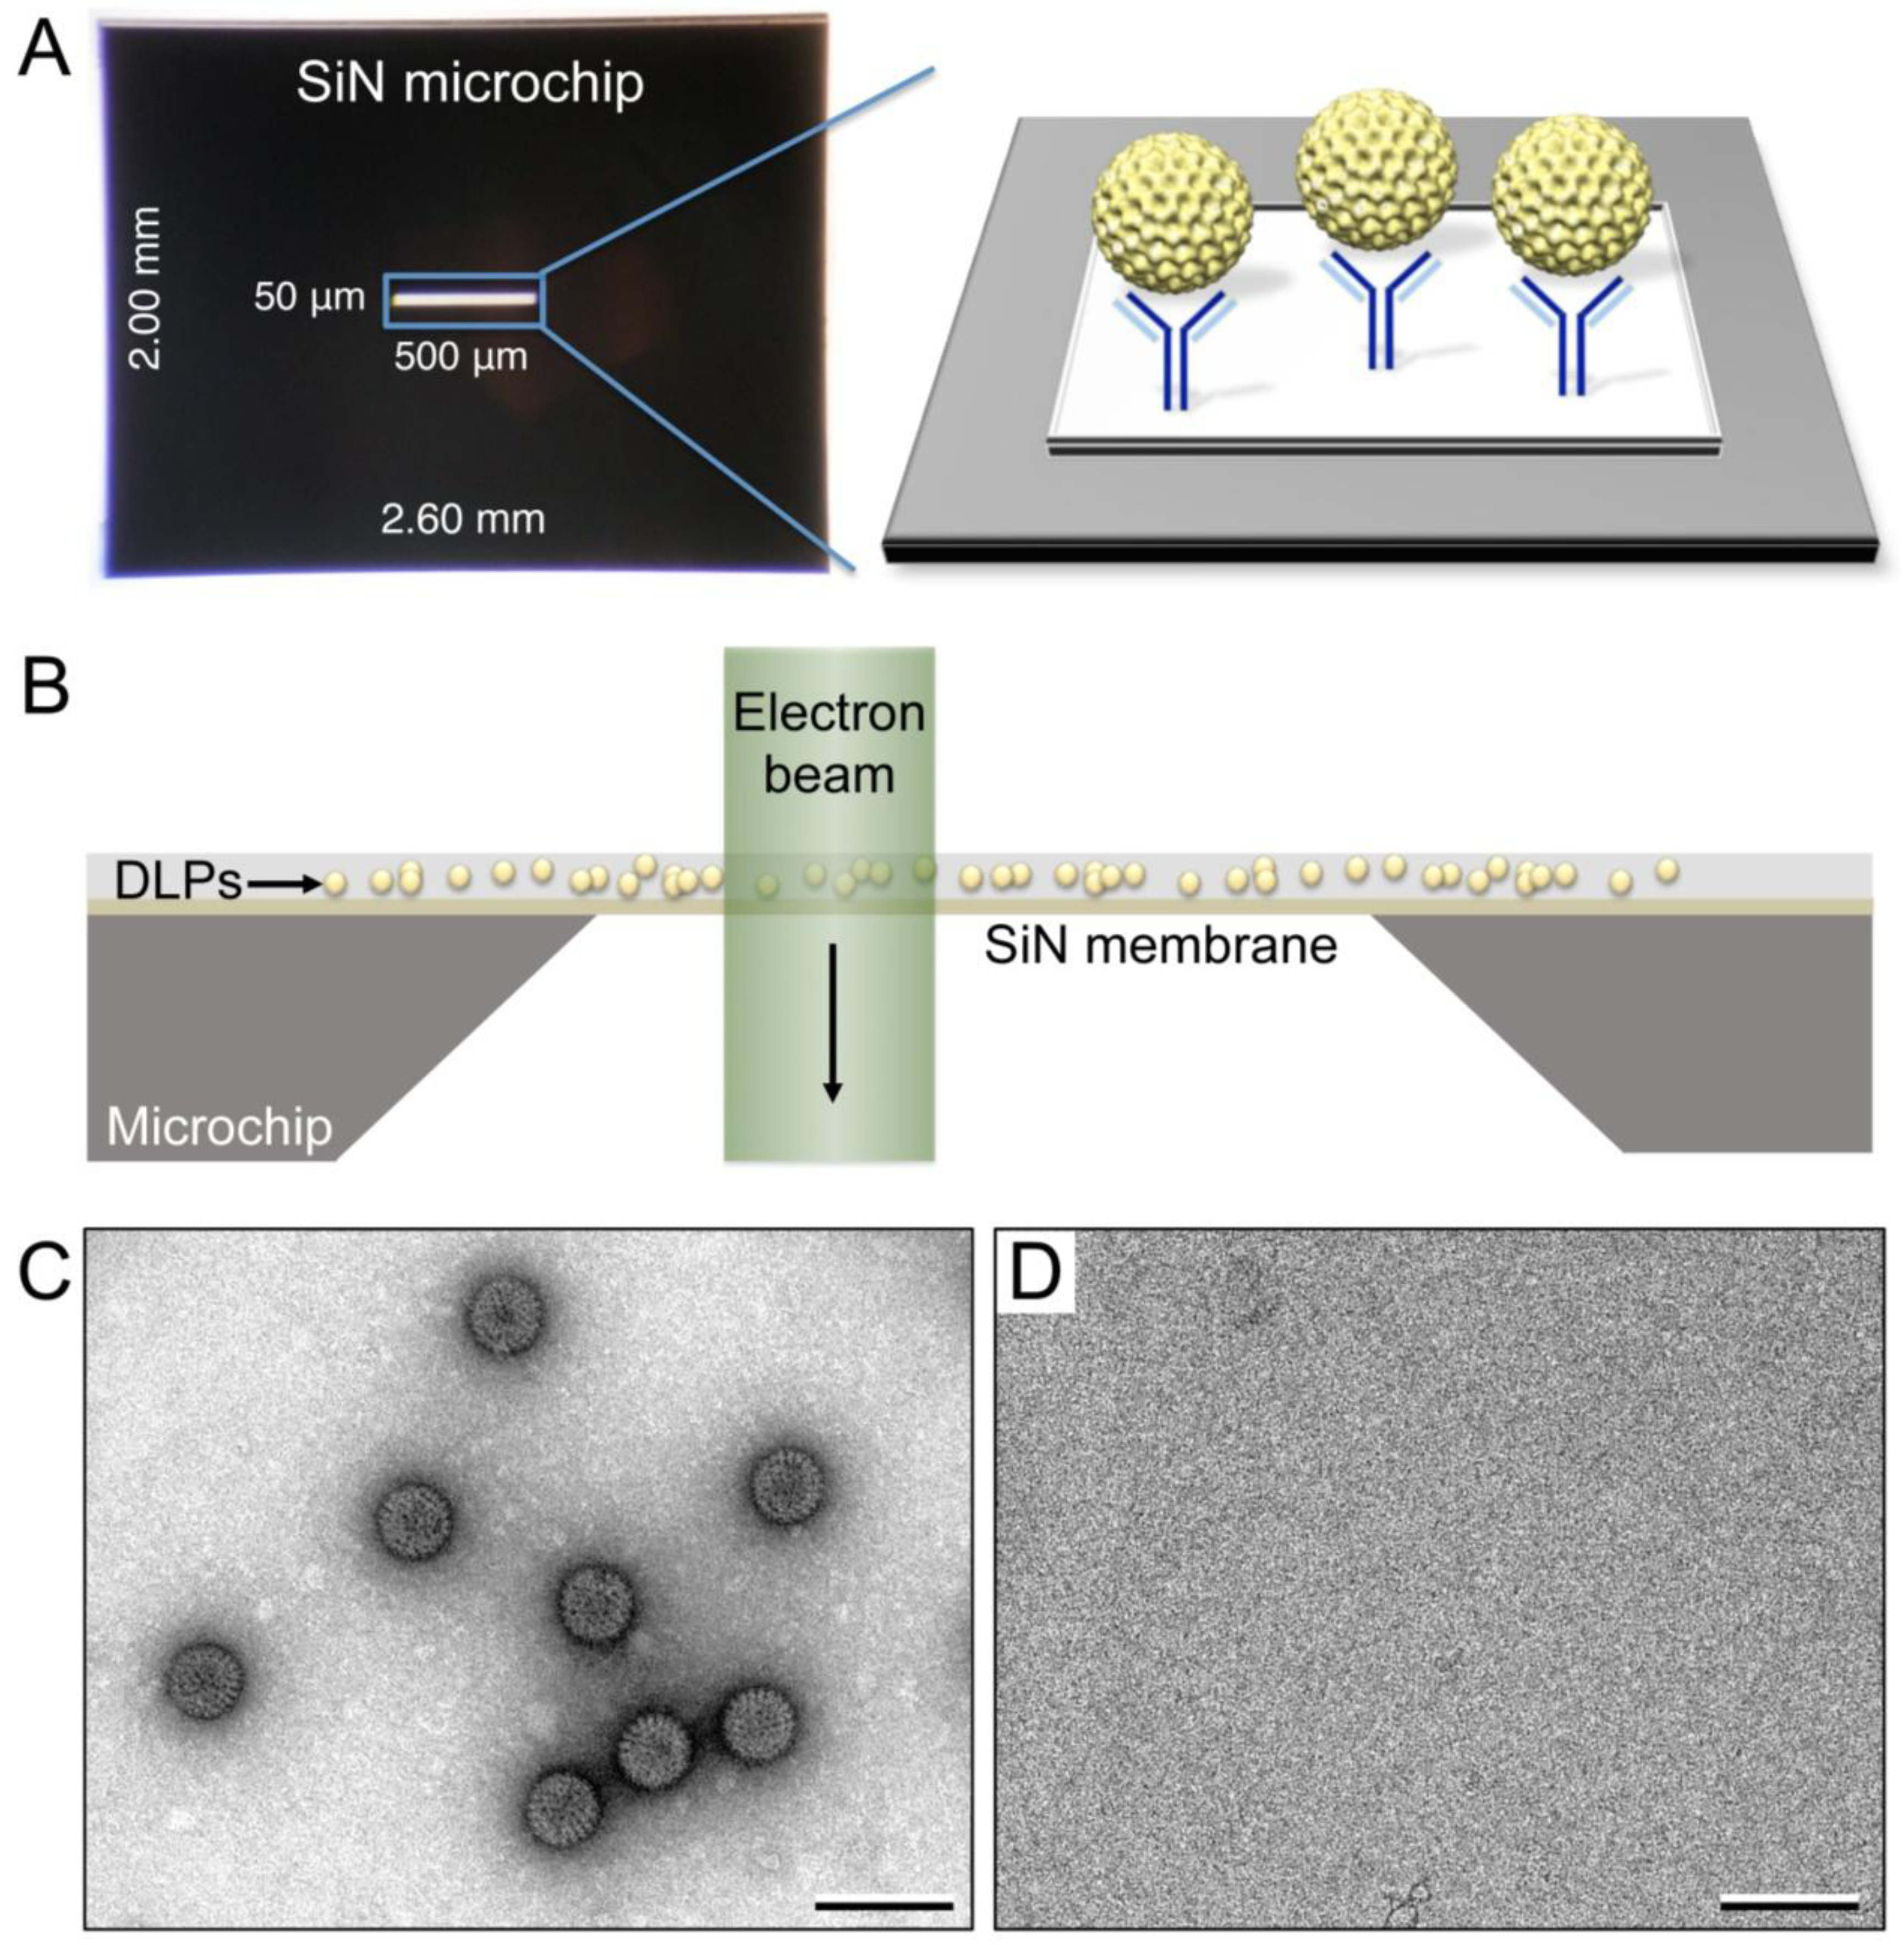
2.3. Functionalization of SiN Microchips

SiN microchips (Protochips, Inc., Raleigh, NC) were produced according to previously published methods [16]. The microchips were manufactured from 300-μm-thick, n-type Si(100) wafers and their final dimensions were 2.6 mm × 2.00 mm in length with a central transparent window (50-nm thick) having dimensions of 500 μm × 50 μm (Figure 1A). Microchips were cleaned prior to use by soaking in 50 mL of acetone for 2 min followed by 50 mL of methanol for 2 min and air-drying. Lipid monolayers doped with Nickel-nitrilotriacetic acid (Ni-NTA)-containing polar head groups were produced over 15-μL aliquots of Milli-Q water placed on parafilm and sealed in a humid petri dish as previously described [13]. After incubating on ice for 60 min, non-glow-discharged, hydrophobic SiN chips were placed on the monolayer surface for 1 min then gently removed using teflon-tipped forceps.
Figure 1. (A) Silicon nitride (SiN) microchips containing 50-nm thick imaging window were functionalized and decorated with Protein A and IgG antibodies (blue) used to recruit viral complexes (yellow). (B) Cross-sectional view of a SiN microchip decorated with double-layered particles (DLPs) and oriented with respect to the electron beam. (C) Representative electron microscopy (EM) images indicated that rotavirus DLPs bind specifically to functionalized microchips decorated with antibodies and little to no DLPs bind to chips lacking antibodies (D). Scale bars are 150 nm at a magnification of 30,000×.
Micromachines 04 00090 g001

2.4. Recruitment of Viral Complexes to Microchips

Aliquots (3-μL) of His-tagged Protein A (0.01 mg/mL) (Abcam, Cambridge, MA, USA) in buffer solution containing 50 mM Hepes, pH 7.5, 150 mM NaCl, 10 mM MgCl2 and 10 mM CaCl2 were incubated for 1 min on each chip containing the lipid layer. The excess solution was blotted away and 3-μL aliquots of VP6-specific guinea pig polyclonal antisera (#53963) (0.01 mg/mL in the same buffer as Protein A) were added to Protein A labeled chips. Following a 1-min incubation, the excess antibody solution was gently removed using a Hamilton syringe and purified viral complexes (ranging from 0.01 to 0.1 mg/mL in TNC buffer) were added to the chips for a 2-min incubation step. Chips were washed with Milli-Q water and stained with 0.2% uranyl formate as previously described [17].

2.5. EM Imaging and Computing

EM specimens were examined using a FEI Spirit BioTwin TEM (FEI Company, Hillsboro, OR) equipped with a LaB6 filament operating at 120 kV under low-dose conditions (~ 3 electrons/Å2). For averaging routines, images were recorded on a FEI Eagle 2k HS CCD camera having a pixel size of 30-μm at a nominal magnification of 30,000× with a final sampling of 10 Å per pixel. We used a defocus value of −1.5 μm and collected 70 images of negatively stained specimens. We selected 537 individual particles from the images using the SPIDER software package [18] (i.e., 537 × 60-fold symmetry for icosahedral particles, equates to 32,220 particles lacking symmetry). Selected particles were aligned and averaged as described in the Results and Discussion section. Particle images were imported into the RELION software package [19] that was used to calculate a 3D reconstruction. A reference map for the DLP structure [20] was downloaded from the website of the Grigorieff laboratory [21]. Refinement parameters included a pixel size of 10 Å, an initial model low-pass filtered to 80 Å and a regularisation parameter of T = 2 while enforcing icosahedral symmetry over an angular search space of 7.5 degrees.

3. Results and Discussion

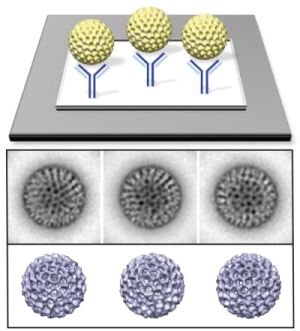
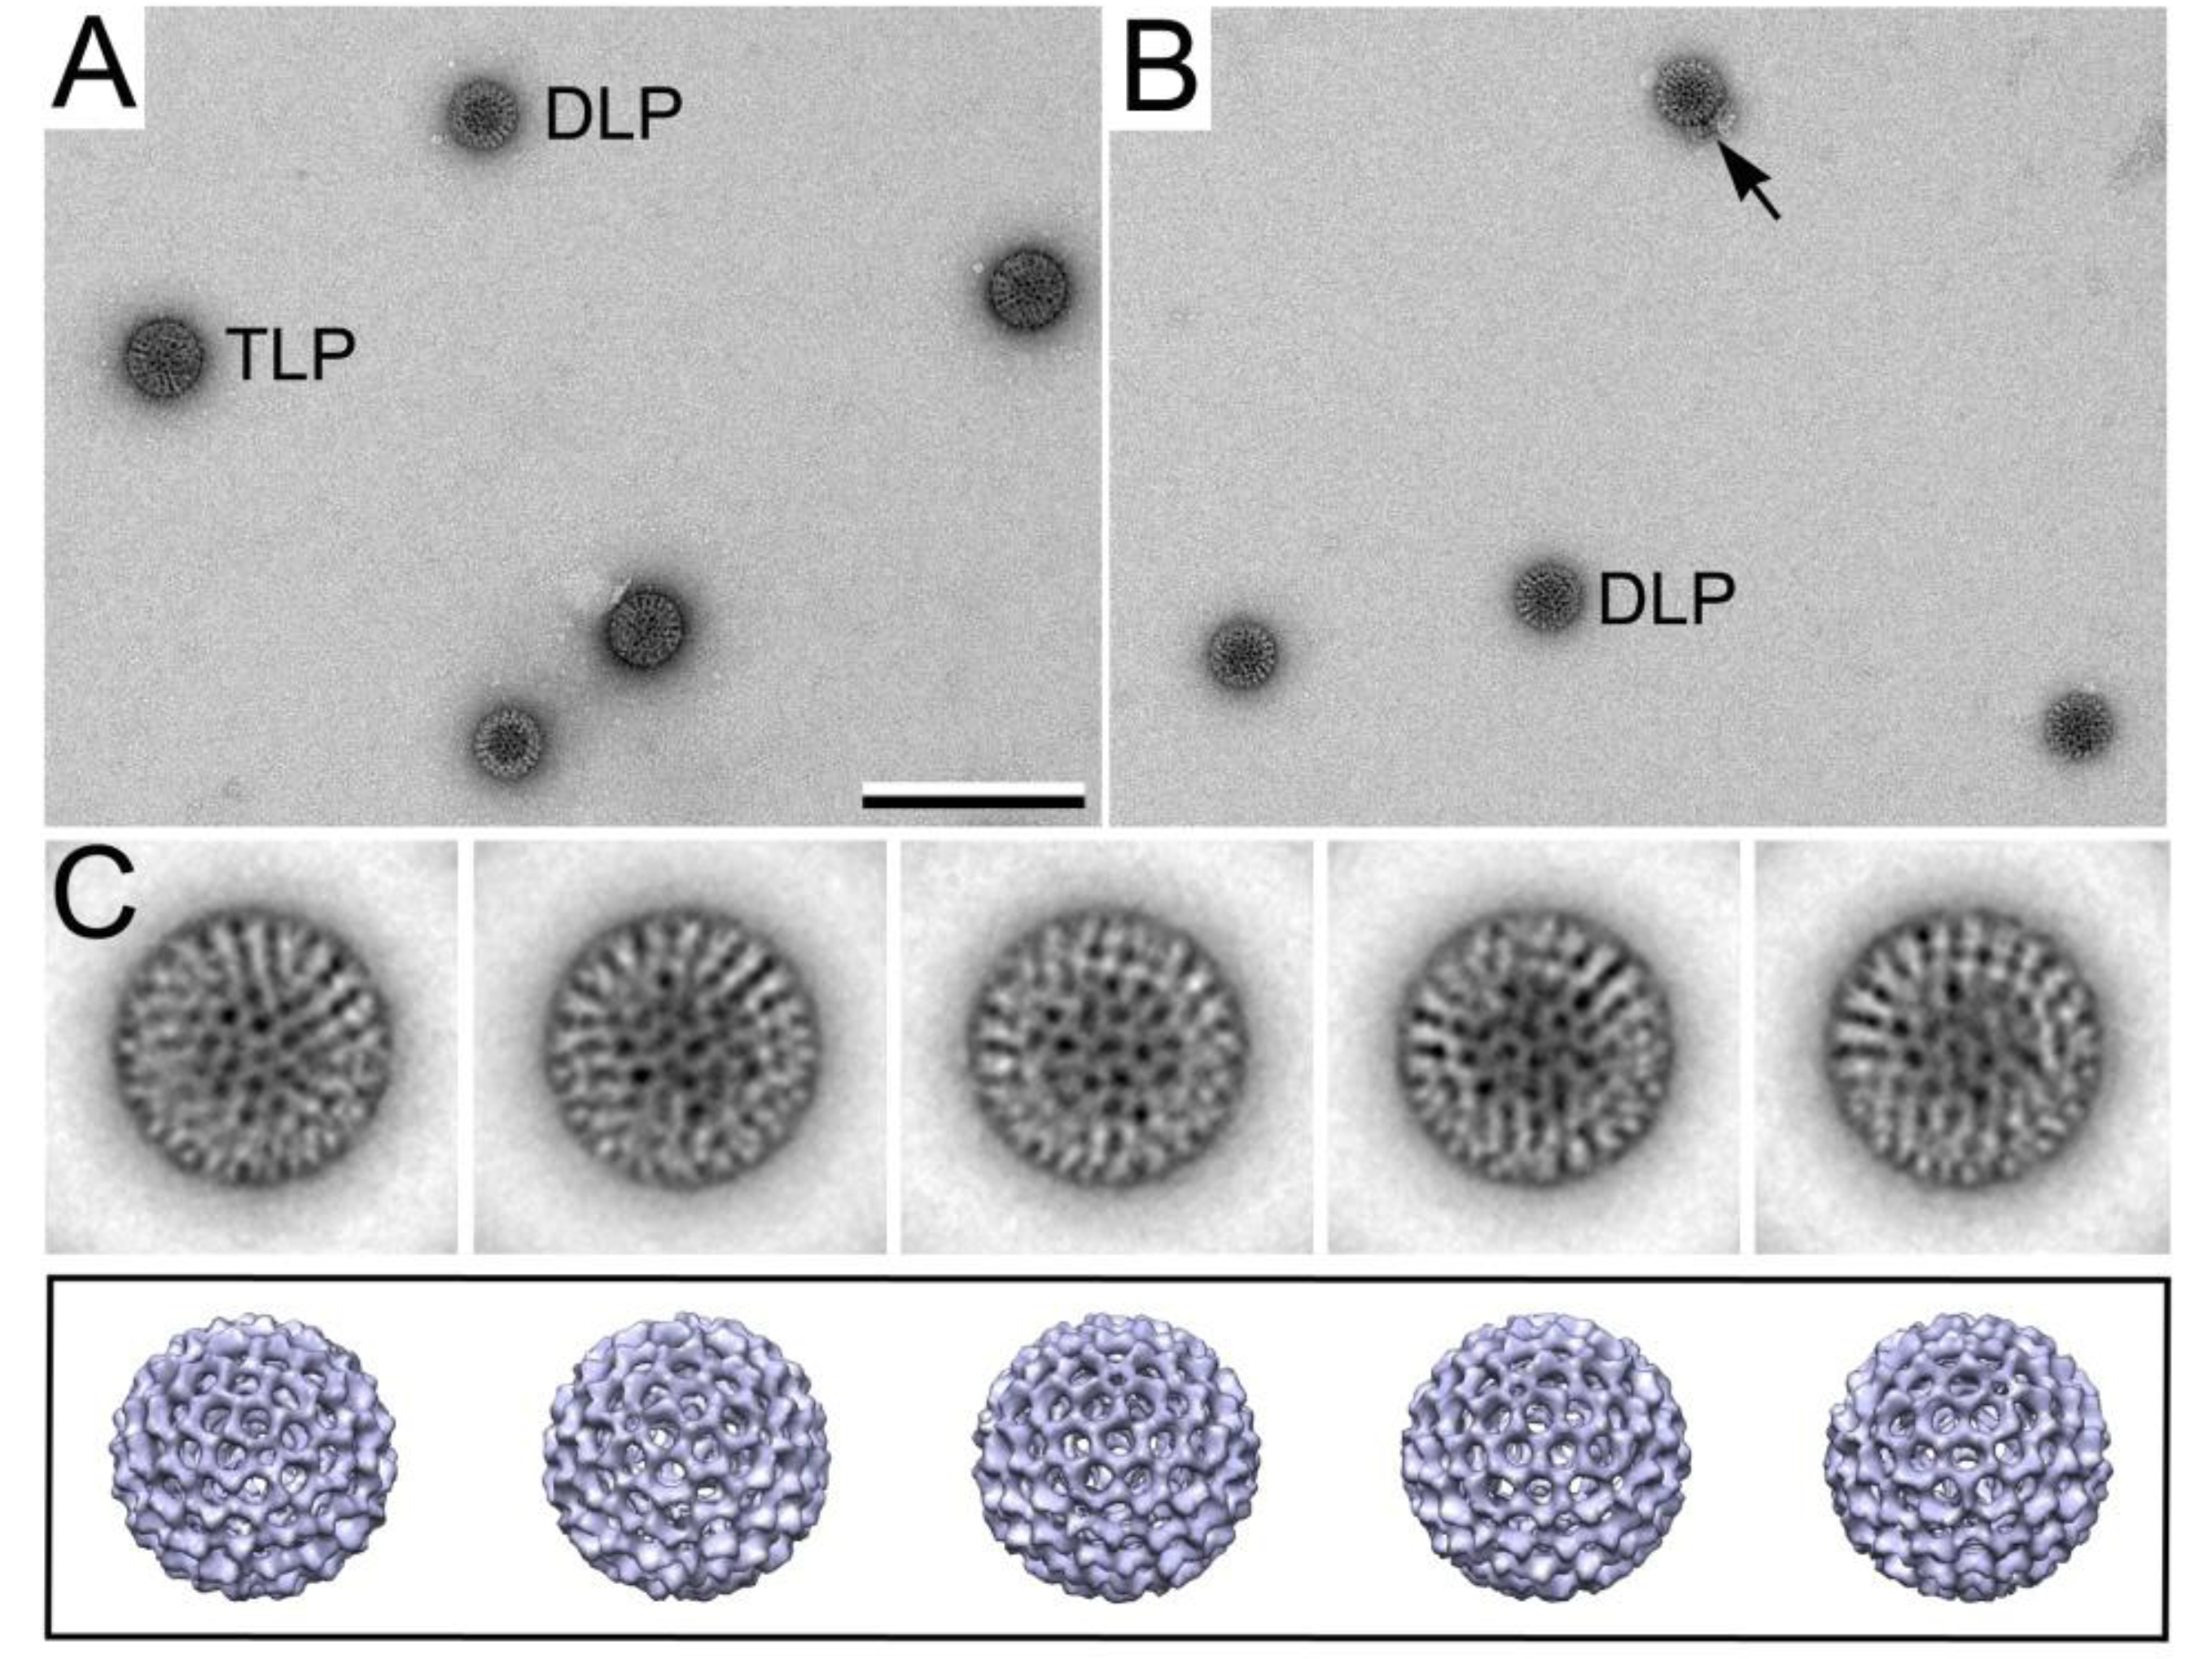
3.1. Functionalized Microchips Recruit Viral Complexes

We tested the use of SiN microchips for biological applications using rotavirus transcription complexes (i.e., DLPs) as a model system (Figure 1A). DLPs provide an ideal macromolecular sample to visually assess microchip specimens by single particle EM. Similar to carbon support films, non-glow-discharged SiN chips do not adsorb proteins well but do favorably interact with lipid monolayers. Non-glow-discharged, hydrophobic microchips were coated with Ni-NTA lipid layers and incubated with His-tagged Protein A, followed by antibodies specific for the DLP outer capsid protein, VP6. The antibody-labeled chips were then incubated with purified DLPs containing the exposed VP6 epitope. The decorated microchips had sufficient specificity to recruit the rotavirus transcription complexes as determined by negative stain transmission EM (Figure 1B). Recruited DLPs were ~80–90 nm in diameter (Figure 1C) and were distributed over a majority of the chip. In parallel, we also tested whether non-glow-discharged chips lacking molecular adaptors could possibly exhibit non-specific binding to the lipid-coated chips. We did not initially visualize DLPs on the microchips in the absence of Protein A or antibodies, indicating that both of these components are essential elements of the recruitment system. A representative image of microchips lacking antibodies is shown in Figure 1D.
To further explore the issue of non-specific binding, we decorated Ni-NTA functionalized SiN chips with Protein A (0.01 mg/mL) and then added 3-μL aliquots of either polyclonal antibodies (0.01 mg/mL) or buffer solution lacking antibodies. Various concentrations of rotavirus DLPs ranging from 0.1 mg/mL to 0.01 mg/mL were added in parallel to each of the grids containing or lacking the antibodies. Each sample was examined in randomly different regions and representative images in each region were recorded. We recorded 32 images of the specimens, half of which contained antibodies and half of which lacked antibodies. The number of DLPs recruited in each grid was quantified and averaged. The results are summarized in Figure 2 and showed that DLPs do not readily bind to microchips in the absence of IgG adaptors up to 0.1 mg/mL. At 0.1 mg/mL a small degree of non-specific binding was detected. Samples were not utilized at concentrations greater than 0.1 mg/mL as they have the potential to interact with each other, making it difficult to process the images.
Figure 2. DLP specimens prepared on SiN chips in the presence of Protein A/antibodies (blue line) and lacking antibodies (red line) were examined using negative stain EM and quantified. The number of DLPs bound to antibody-decorated SiN chips varied with sample concentration. Specimens containing antibodies exhibited high specificity up to 0.1 mg/mL in comparison to specimens lacking antibodies (red line). At 0.1 mg/mL a small degree of non-specific binding was detected.
Micromachines 04 00090 g002

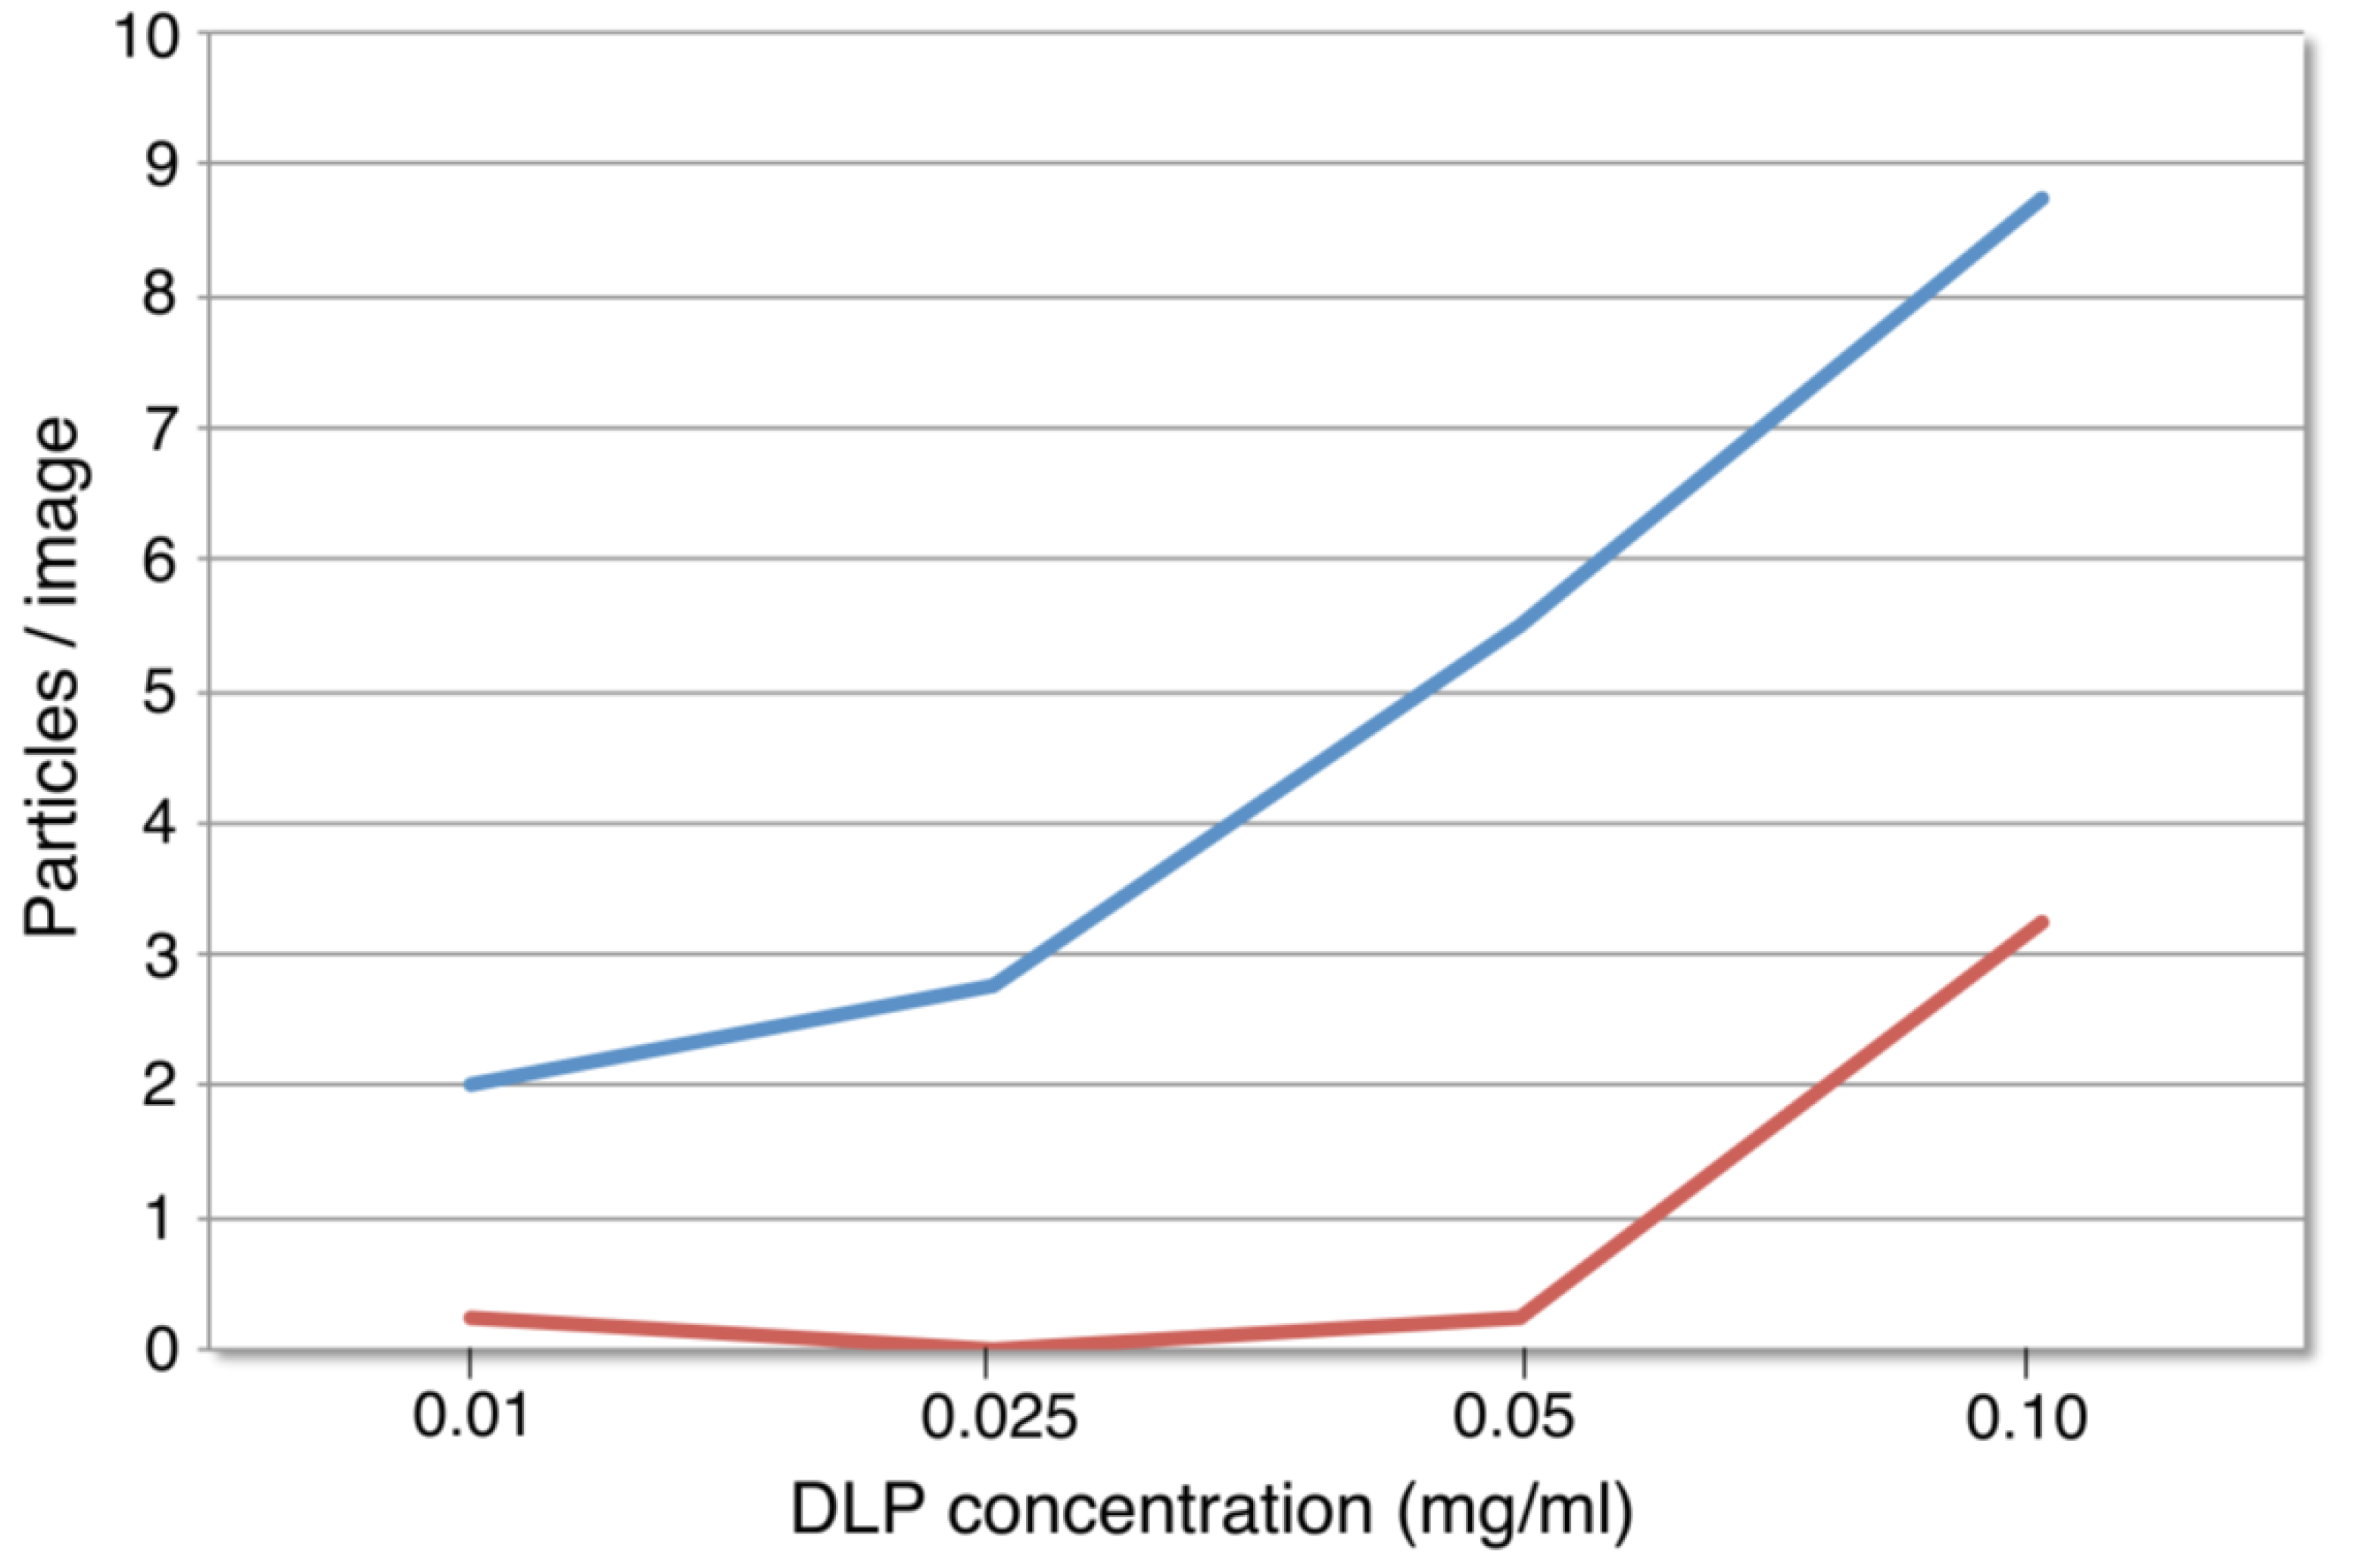
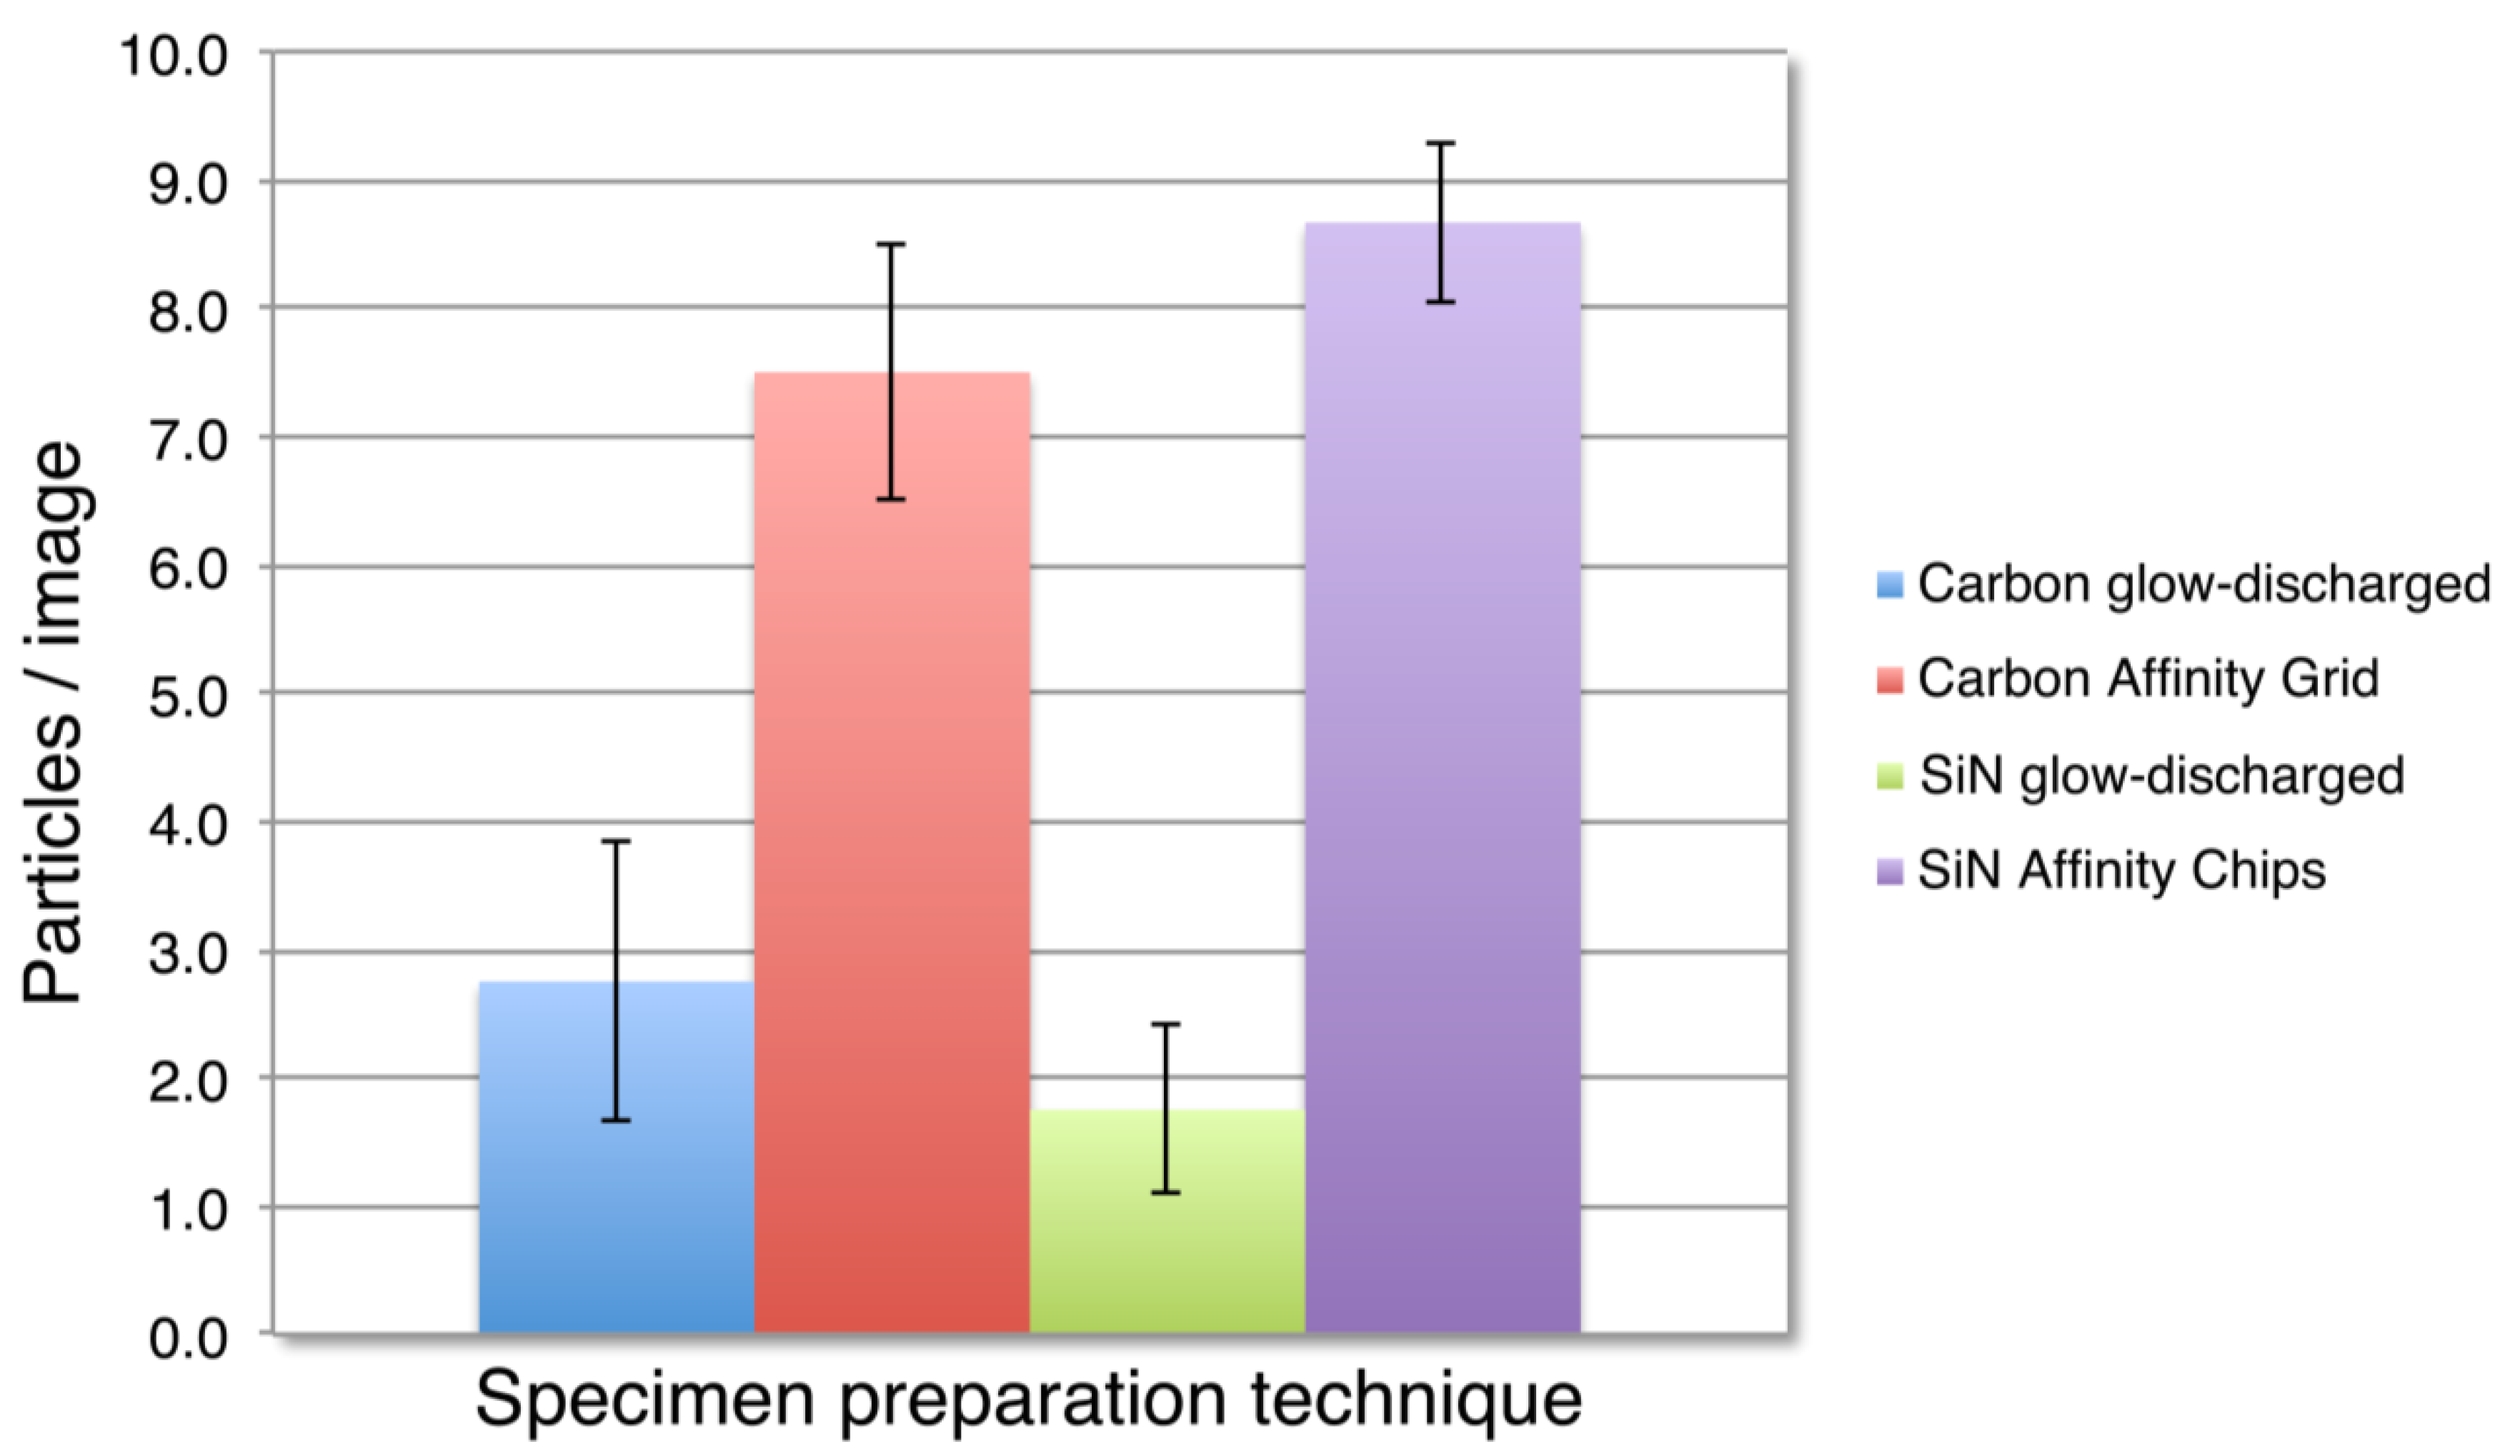
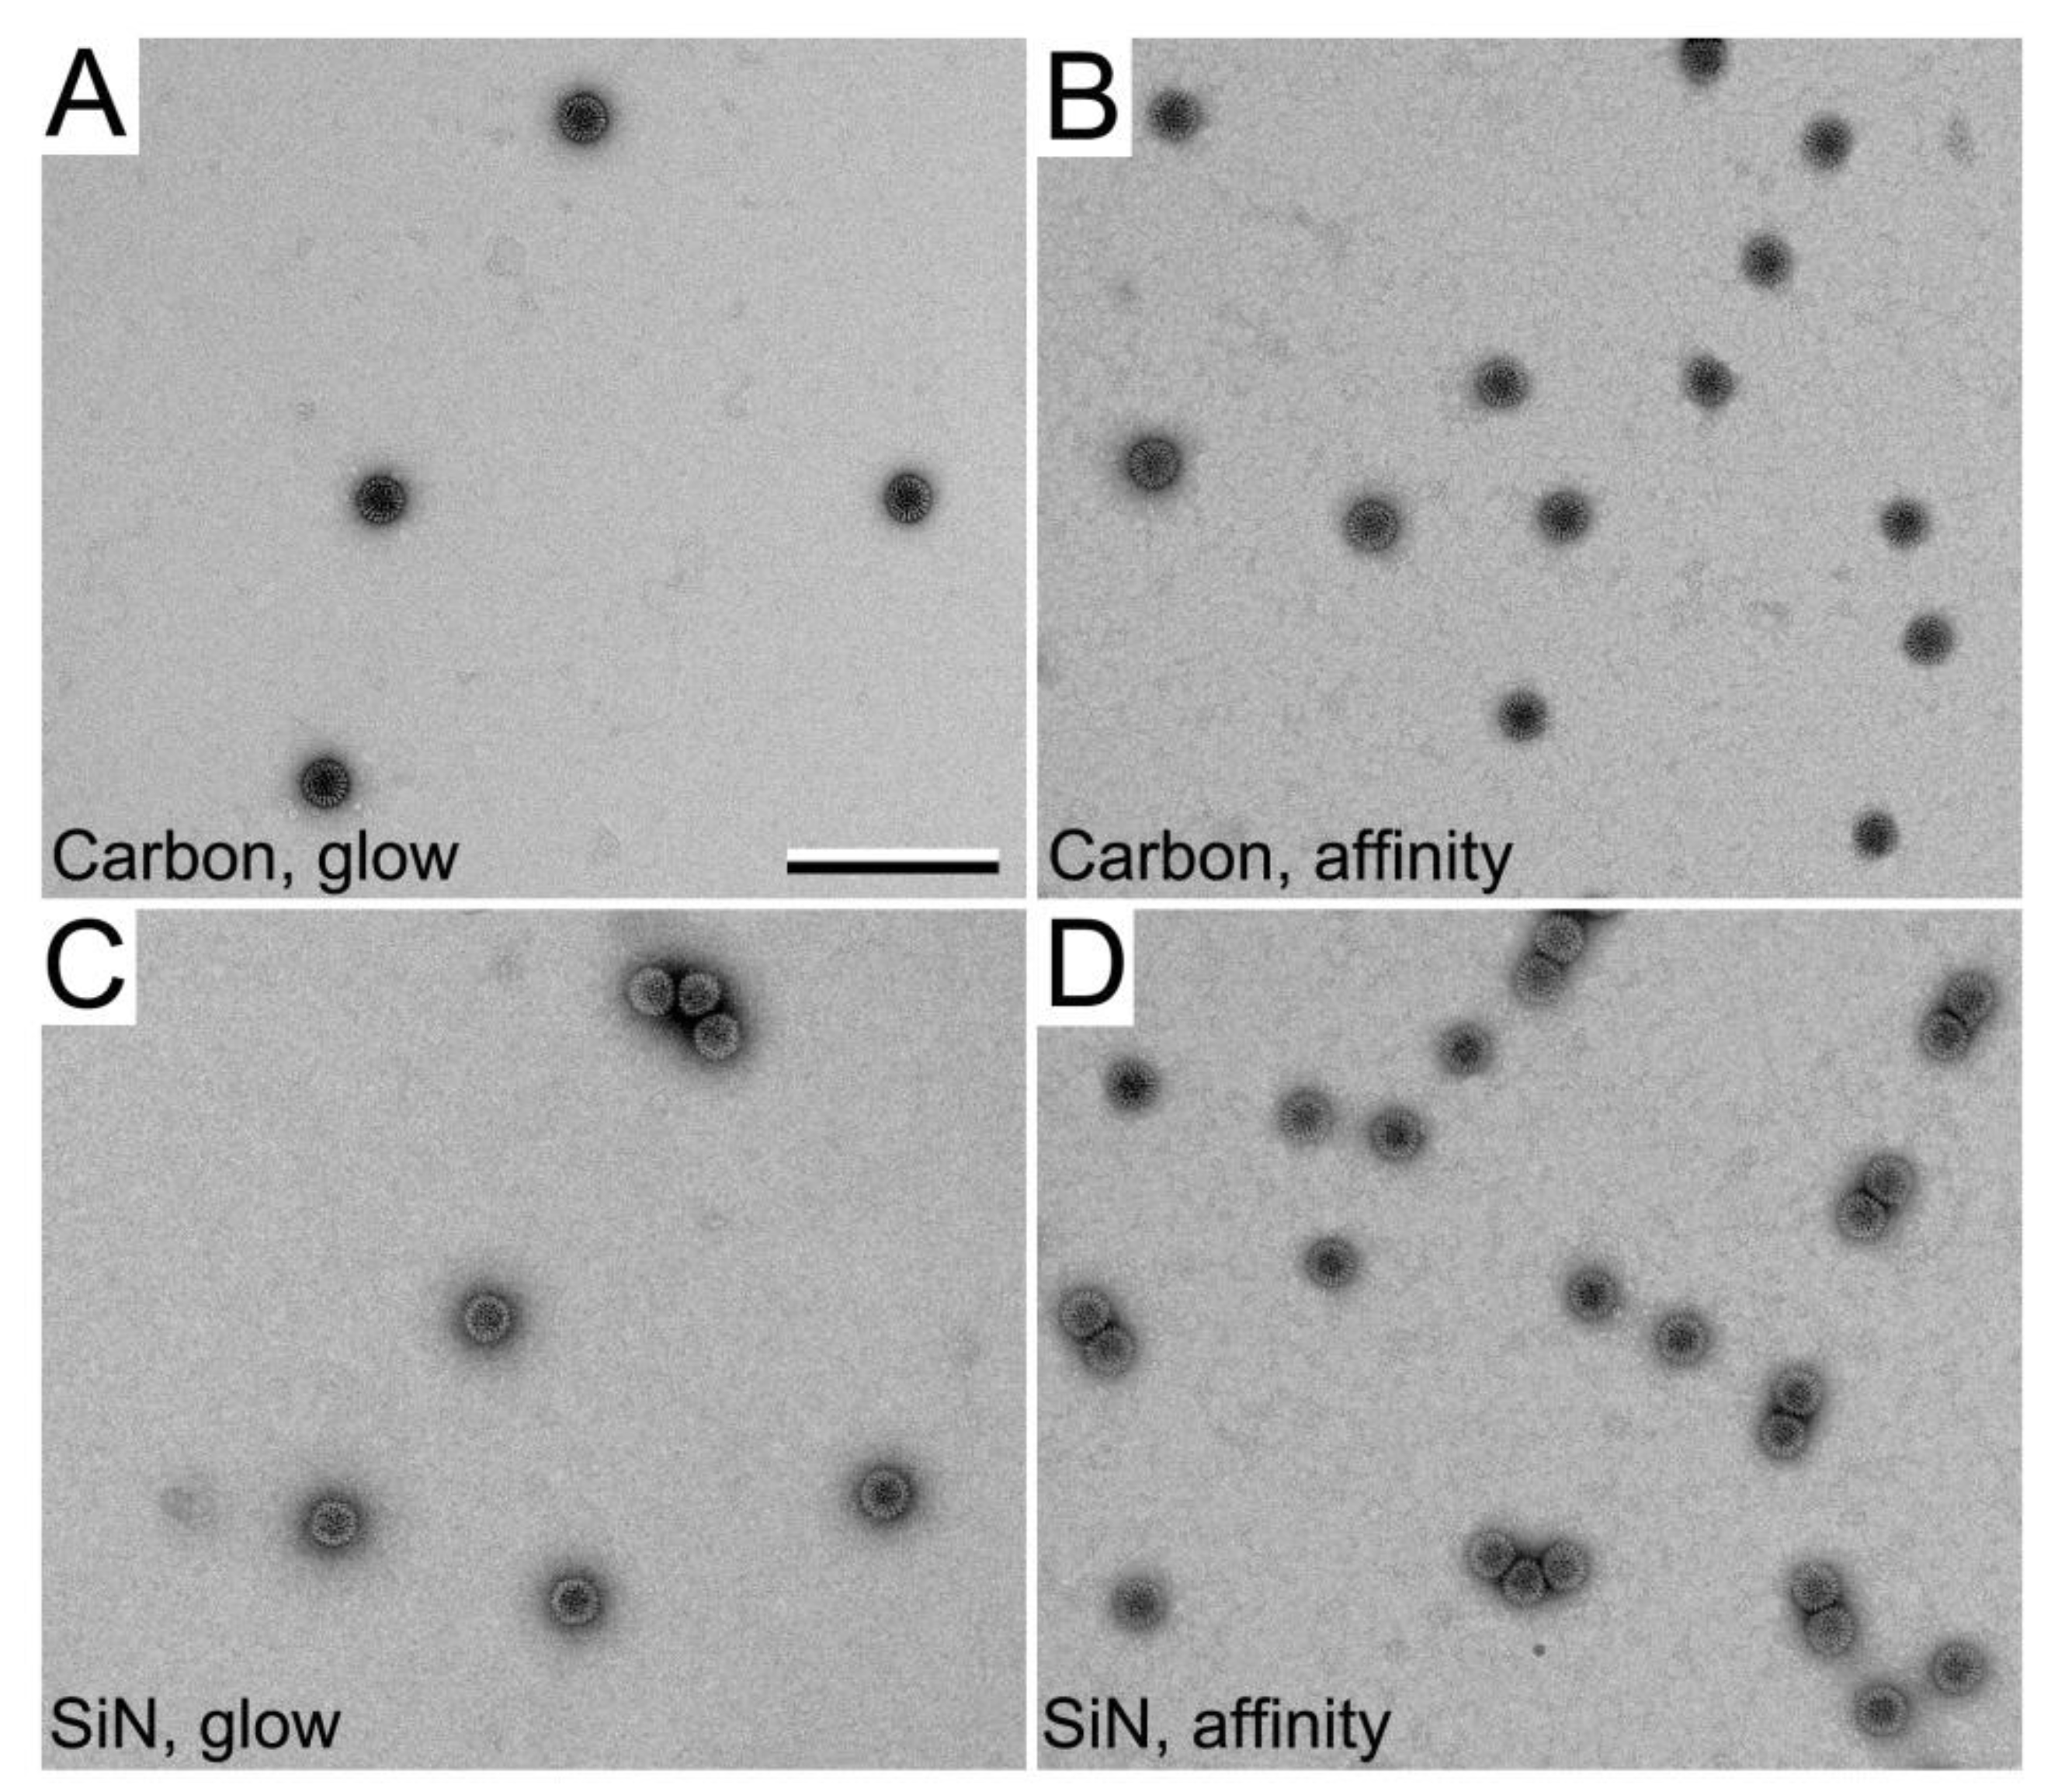
3.2. SiN versus Conventional Carbon Substrates

The potential use of transparent SiN microchips to prepare biological assemblies for imaging purposes is widely attractive due to their consistent manufacture. As there can be large variations in the production of carbon support films, having devices that are consistently flat with impermeable surfaces devoid of imperfections would greatly benefit the nanotechnology community. We tested the use of SiN microchips as a suitable substrate to capture macromolecules in comparison to conventional carbon support films produced on 400-mesh copper grids (Ted Pella, Inc., Redding, CA, USA). Purified DLPs and negative stain transmission EM were used to assess samples prepared on carbon films and on SiN chips in parallel. SiN chips and carbon films were glow-discharged using a PELCO easiGlow (Ted Pella, Inc., Redding, CA, USA) for 1 min using negative polarity. This step renders surfaces more hydrophilic and improves wettability when applying aqueous samples. However, chips or grids used to prepare affinity-decorated samples were not glow-discharged as charged devices with hydrophilic surfaces disrupt the hydrophobic chains of the lipid layers. We examined and quantified how EM samples varied with grid preparation by producing 3 samples for each of the following: (1) glow-discharged carbon film; (2) affinity decorated carbon film (using molecular adaptors); (3) glow-discharged SiN and (4) affinity decorated SiN (using molecular adaptors). Each of the 12 samples was examined in randomly different regions and representative images were recorded. We acquired 48 images and assessed the number of DLPs present in the images. The results are summarized in Figure 3, Figure 4.
Figure 3. Glow-discharged carbon grids (blue) adsorbed less DLPs than nickel-nitrilotriacetic acid (Ni-NTA) coated carbon Affinity Grids (red). Glow-discharged SiN chips (green) recruited DLPs in very similar quantities to glow-discharged carbon film (blue). Ni-NTA coated SiN Affinity chips (purple) recruited the greatest number of DLPs and outperformed glow-discharged conventional carbon films by ~5-fold.
Micromachines 04 00090 g003
Figure 4. (A) Representative low-magnification images (13,000×) of negatively stained EM specimens indicated less DLPs adhered to glow-discharged carbon support films than to Affinity Grids coated with Ni-NTA and decorated with molecular adaptors (B). DLPs adhered similarly to glow-discharged SiN microchips (C) and to glow-discharged carbon films. (D) SiN Affinity chips coated with Ni-NTA and decorated with molecular adaptors recruited the greatest number of DLPs using equivalent amounts of material. Scale bar is 300 nm.
Micromachines 04 00090 g004
Glow-discharged SiN microchips (Figure 3, green; Figure 4C) performed very similar to glow-discharged carbon films (Figure 3, blue; Figure 4A) as indicated by the number of DLPs that were adsorbed to the substrate surfaces. We further compared functionalized Protein A/antibody-labeled carbon films to similarly prepared SiN microchips. Microchips decorated with the protein adaptors (Figure 3, purple; Figure 4D) performed equivalent to similarly prepared carbon support films (Figure 3, red; Figure 4B) as indicated by the number of DLPs captured within a 2-min incubation step. Importantly, affinity-decorated SiN microchips (Figure 3, purple; Figure 4D) recruited approximately 5-times the number of viral complexes as glow-discharged carbon films (Figure 3, blue; Figure 4A), which is the standard way to prepare EM specimens of macromolecules.

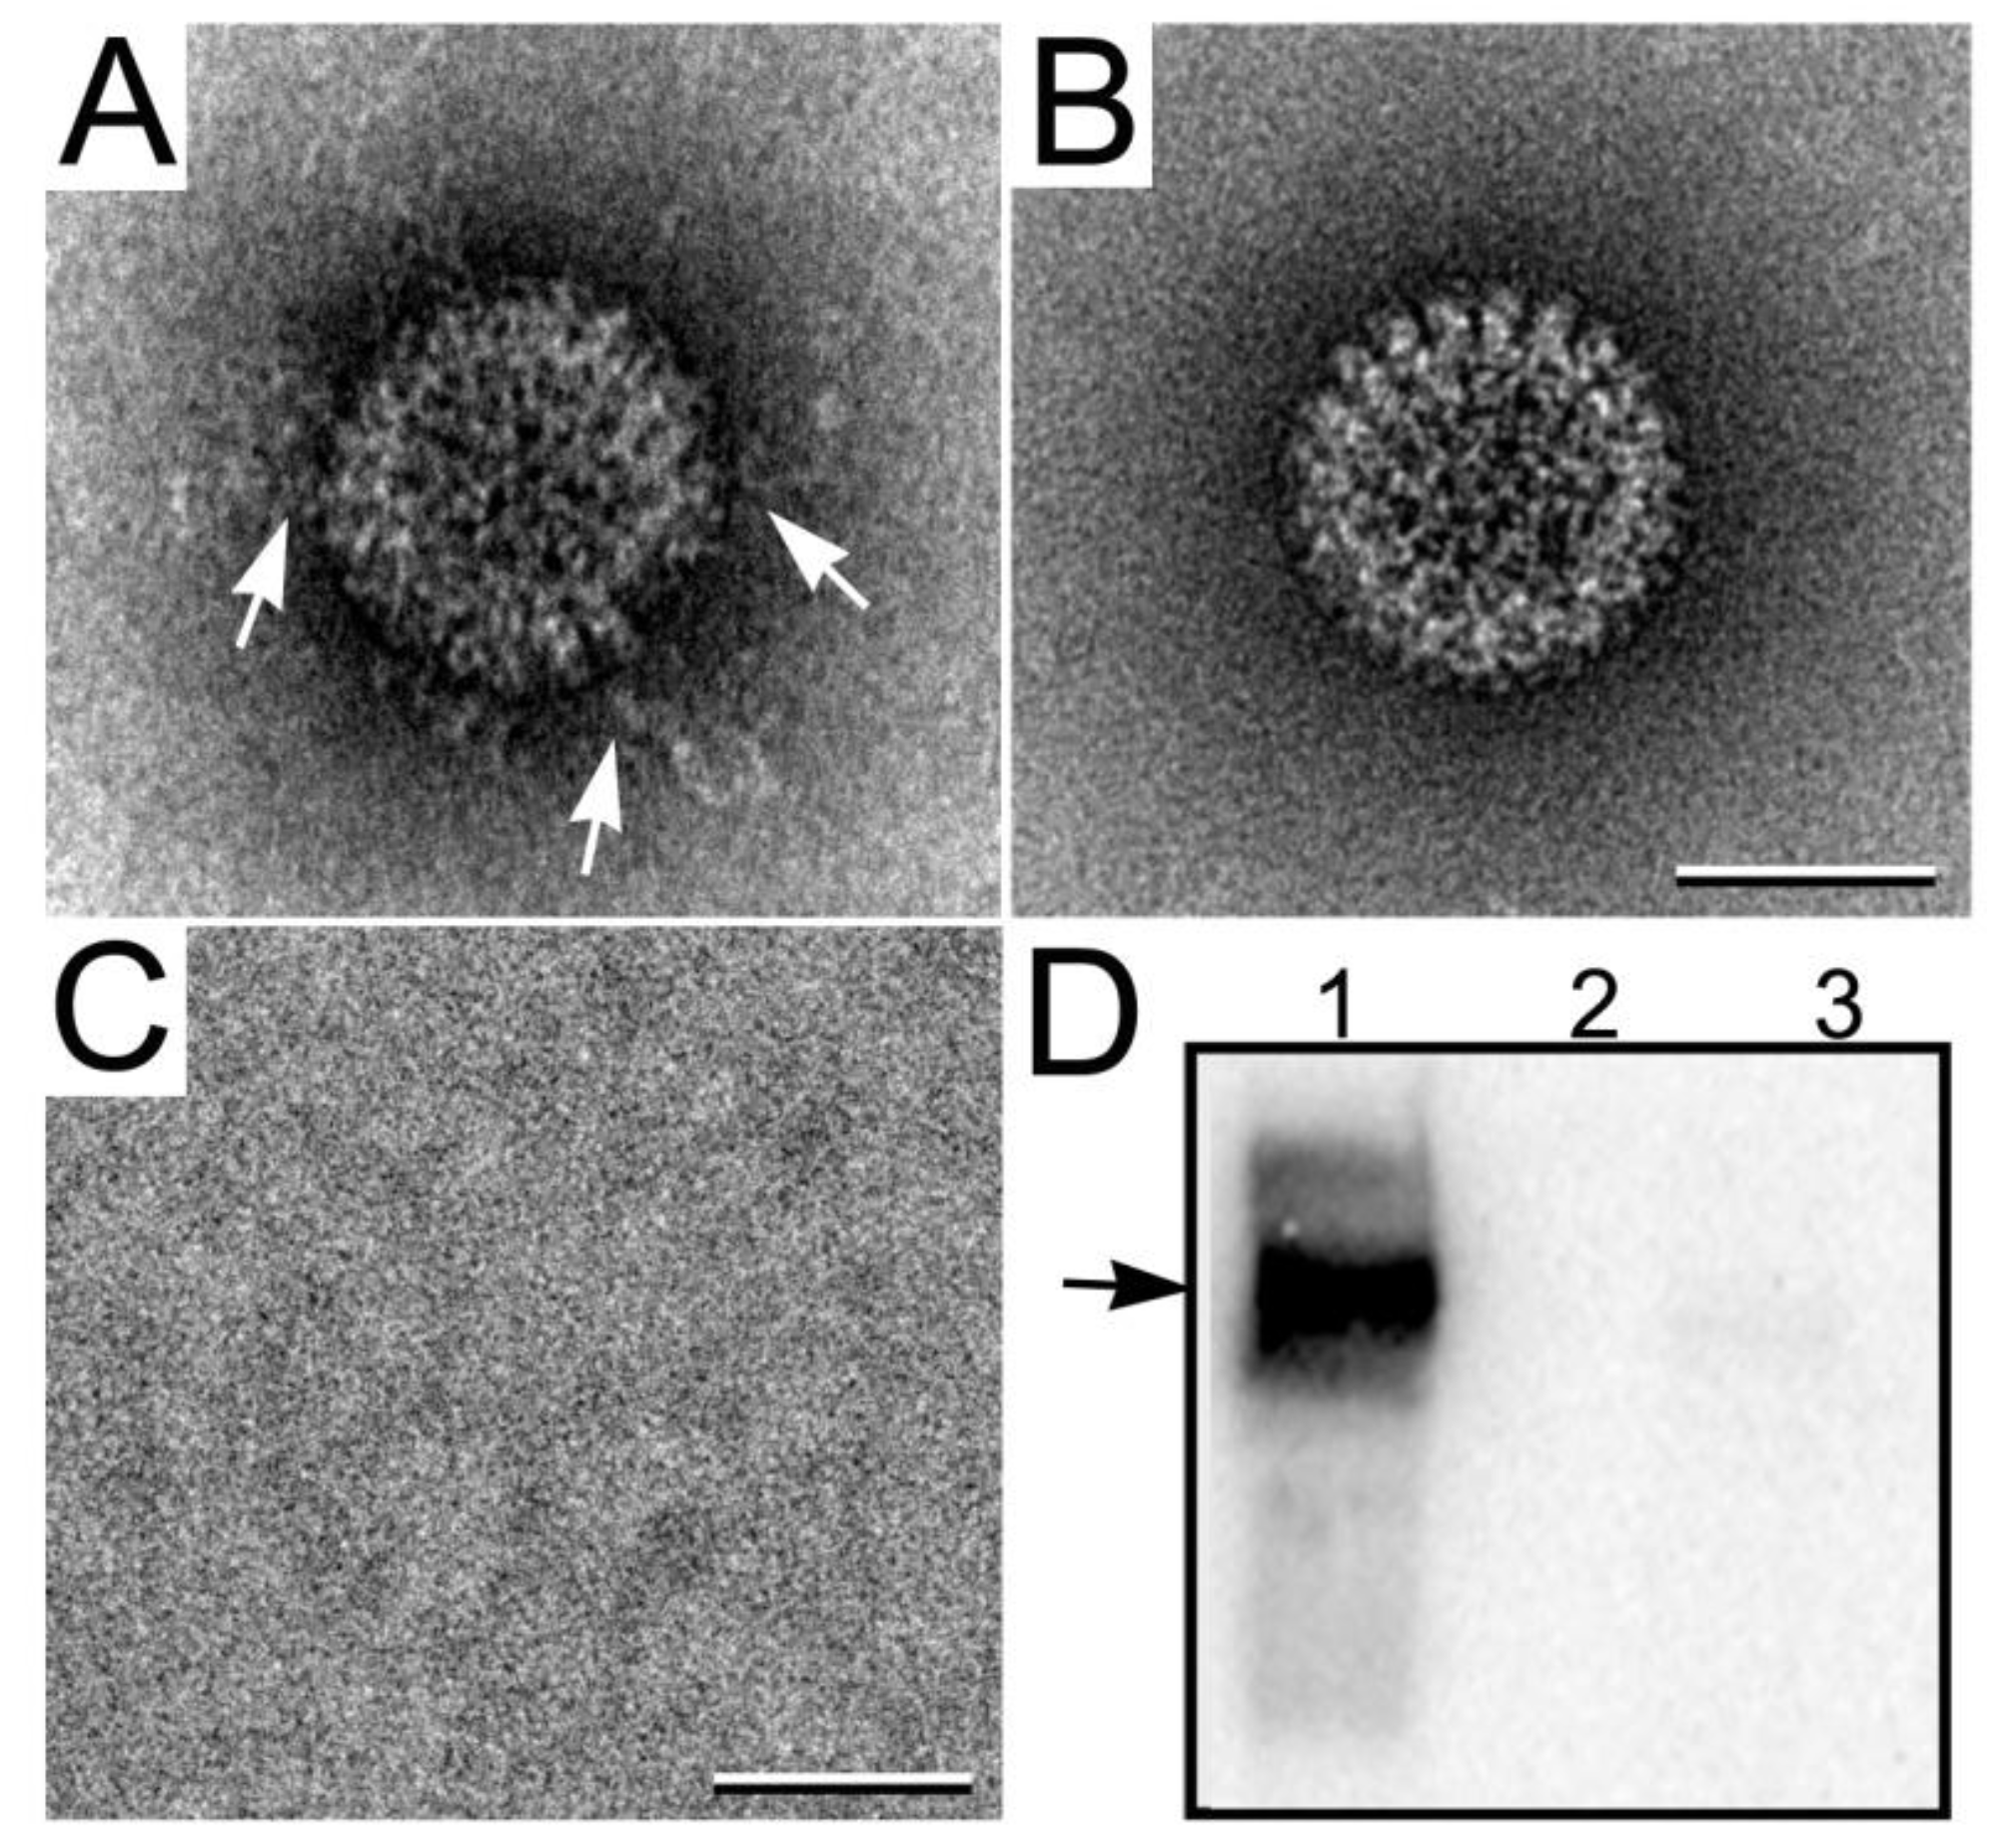
3.3. Monitoring Viral Mechanisms

3.3.1. Converting TLPs to DLPs

The advantage of performing microscale reactions in conjunction with EM imaging experiments is the direct visual readout of processes as they occur. We evaluated the extent to which biological reactions could be directly performed upon SiN microchips using intact, rotavirus TLPs. The first step in the rotavirus infection cycle, upon entering a host cell, is to shed its outer capsid proteins that are stabilized in the presence of calcium. In doing so, larger TLPs are converted into smaller DLPs. To recapitulate this viral uncoating process on our microchips, we added TLPs (0.1 mg/mL) in TNC buffer directly to glow-discharged microchips in the presence of 1 mM EDTA or 2 mM EDTA for 2-min incubation steps at 37 °C. At the end of the incubation, chips were assessed using EM. Upon the addition of 1 mM EDTA, we observed a mixed population of both TLP and DLP particles (Figure 5A). In the presence of 2 mM EDTA, there appeared to be only DLPs present on the microchips (Figure 5B). A small number of DLPs had extra globular proteins attributed to the remains of their outer capsid shell (Figure 5B, black arrow). Comparatively, carbon films incubated for 2-min at 37 °C did not yield useful specimens. The sample adsorbed to the carbon surface, leaked through the film to the back-side of the grid and began to evaporate. Thus, carbon films were not suitable to perform such experiments. These problems did not occur with the impermeable SiN chips.
Figure 5. (A) EM images of viral triple-layered particles (TLPs) and DLPs adsorbed to glow-discharged SiN microchips in the presence of 1 mM EDTA and (B) 2 mM EDTA. Some globular outer capsid proteins remained on the DLPs during the conversion step (black arrow, B). Scale bar is 200 nm. (C) Class averages (top panel) and 3D reconstructions (bottom panel) of samples treated with 2 mM EDTA indicated a statistically significant population of particles were converted to DLPs. Panel length is 140 nm. The approximate diameter of the reconstructions is 80 nm.
Micromachines 04 00090 g005
To determine the population distribution of newly-formed DLPs versus TLPs present in buffer containing 2 mM EDTA on the microchips, we recorded 70 images under low-dose conditions (~3 electrons/Å2) and selected 537 particles from the images using the SPIDER software package [18] By comparison, 537 × 60-fold symmetry for icosahedral particles equates to 32,220 particles lacking symmetry. The selected particles were subjected to 10 cycles of multi-reference alignment followed by principal component analysis and K-means classification, outputting 5 classes (Figure 5C, top panel). The classes revealed only a single statistically significant population of DLPs. The particles images were then imported into the RELION software package [19] and used to calculate a low-resolution 3D reconstruction (Figure 5C, bottom panel) that was in good agreement with the DLP reference model. The 3D reconstruction also indicated a single significant population of DLPs was present in the EDTA-treated samples. Our findings are consistent with previous light scattering measurements that showed a complete conversion of TLPs to DLPs in vitro within 2 min in the presence of 2 mM EDTA [22].

3.3.2. Viewing RNA Transcript Production

The second step in the viral infection cycle within the host cell involves transcribing the viral genome and the release of single-stranded RNA transcripts from the DLP. To recapitulate this process on our microchips, we functionalized the chips with Ni-NTA affinity layers and decorated them with Protein A/antibodies as described in Section 3.2. Aliquots of TLPs (2-μL of 0.1 mg/mL) were added simultaneously to the decorated chips and to eppendorf tubes to perform functional assays upon the addition and in the absence of EDTA. In the presence of EDTA, as TLPs shed their outer capsid proteins to form DLPs, the VP6 epitope became exposed allowing newly-formed DLPs to bind to the antibody decorated microchips. Transcription reaction solution was subsequently added to the microchips (~10 μL) as well as to the tubes and incubated for 30 min at 37 °C. To the reaction tubes, we also included radiolabeled [α-32P] UTP to monitor nucleotide incorporation into single-stranded RNA transcripts. An additional control was performed on both the chips and the tubes using transcription solution lacking ATP. This served to halt the reaction at the initial requirement for ATP, thus inhibiting transcription. On the chips, the transcription reaction was quenched by the addition of uranyl formate.
Strands of RNA transcripts were visible in images of EDTA-treated TLPs (i.e., nascent DLPs) in complete reaction solution (Figure 6A, white arrows). No RNA transcripts could be identified in EM images of EDTA-treated particles lacking ATP (Figure 6B). TLPs lacking EDTA did not adhere to the chips (Figure 6C). This was an expected result since the outer protein layer must be shed to reveal the epitope required for binding to the antibody-labeled chips. Overall, the imaging results suggested that the incubation of TLPs with EDTA, followed by the addition of the complete reaction mixture is required for successful transcription to occur. For the parallel reactions performed in tubes, functionality was monitored by the successful incorporation of [α-32P] UTP. TLPs incubated with EDTA for 2 min followed by the addition of the complete transcription mixture produced a radiolabel signal that was detected on a 5% polyacrylamide-TBE-urea gel and visualized using a GE Storm 860 phosphorimager (Figure 6A, lane 1). EDTA-treated TLPs contained in reaction solution lacking ATP did not show [α-32P] UTP incorporation (Figure 6A, lane 2). Likewise, TLPs lacking EDTA upon the addition of the transcription solution did not show [α-32P] UTP incorporation (Figure 6A, lane 3). Collectively, this indicated that only EDTA-treated virions contained in the complete reaction mixture were capable of transcribing the viral genome. Thus, our functional results are consistent with our EM findings.
Figure 6. (A) Representative image of a transcriptionally active rotavirus DLP producing thin strands of RNA transcripts (white arrows). (B) Representative image of an assembly lacking ATP in the transcription mixture that failed to produce visible strands of RNA. (C) Antibody-decorated SiN microchips did not recruit TLPs that were untreated with EDTA. Scale bars are 50 nm. (D) 5% polyacrylamide-TBE-urea gel indicating a detectable signal for the incorporation of [α-32P] UTP into RNA transcripts produced by EDTA-treatedvirions in complete reaction solution (lane 1). TLPs treated with EDTA but contained in transcription solution lacking ATP failed to produce detectable RNA transcripts (lane 2). TLPs that were not treated with EDTA also failed to produce detectable transcripts (lane 3).
Micromachines 04 00090 g006

4. Conclusions

We have presented new applications for SiN microchips to visually assess biological reactions. These microchips provide flat, impermeable surfaces to harbor processes that are not directly observable using other microscale devices. We performed a direct comparison of SiN surfaces with graphitized carbon films, which are the most common substrate used in electron microscopy. Our findings indicated that glow-discharged SiN microchips performed equivalent to charged carbon substrates in their capacity to bind to individual virions using the same amount of starting material. We also determined that SiN microchips coated with Ni-NTA affinity layers concentrated viral particles for EM assessments similarly to affinity-coated conventional carbon films. Overall, in comparison to conventional glow-discharged carbon film, functionalized SiN chips decorated with molecular adaptors showed at least a 5-fold improvement in the total number of viral assemblies recruited to the microchips.
We further demonstrated that SiN microchips readily serve as microscale surveillance devices to monitor viral processes in a way that mimics the early stages in the host infection cycle. We were able to recapitulate the first two steps of rotavirus infectivity directly upon SiN microchips. These microchip samples could be quantified and used for single particle averaging routines. However, it was not technically possible to perform these experiments using conventional carbon support films due to natural imperfections in the carbon substrate. Therefore, SiN microchips appeared to have an advantage over amorphous carbon films when conducting experiments at physiological temperatures directly upon the substrate.
Viral uncoating and transcription mechanisms were performed directly upon SiN membranes as part of an in vitro reconstitution system that was visualized using single particle EM. We obtained a single statically significant population of rotavirus DLPs within 2-min of treating intact virions (i.e., TLPs) with 2 mM EDTA. EM images and computational routines confirmed this observation. SiN microchips were also capable of capturing actively transcribing DLPs in a manner that is functionally relevant.
Collectively, we demonstrate that thin SiN membranes can be used as microscale bioreactors with the added benefit of visualizing structural details at nanometer resolution. Broader applications for SiN microchips may include isolating cancer cells or stem cells at particular stages in development based on the presence of uniquely expressed cell surface markers. SiN chip-based ex situ devices may be manufactured to perform these functions in correlation with confocal or other forms of light microscopy. Overall, we envision that new biological applications for SiN microchips could greatly contribute to a deeper understanding of life processes at the molecular level and beyond.

Acknowledgments

The authors thank Michael Friedlander, Director of the Virginia Tech Carilion Research Institute, for supporting our research endeavors and John Patton of the National Institute of Allergy and Infectious Diseases at NIH for generously providing the VP6 antisera used in these studies.

References

  1. Pratt, E.D.; Huang, C.; Hawkins, B.G.; Gleghorn, J.P.; Kirby, B.J. Rare Cell Capture in Microfluidic Devices. Chem. Eng. Sci. 2011, 66, 1508–1522. [Google Scholar] [CrossRef]
  2. Mernier, G.; Majocchi, S.; Mermod, N.; Renaud, P. In situ evaluation of single-cell lysis by cytosol extraction observation through fluorescence decay and dielectrophoretic trapping time. Sensor Actuat. B 2012, 166, 907–912. [Google Scholar] [CrossRef]
  3. Maguire, T.J.; Novik, E.; Chao, P.; Barminko, J.; Nahmias, Y.; Yarmush, M.L.; Cheng, K.C. Design and application of microfluidic systems for in vitro pharmacokinetic evaluation of drug candidates. Curr. Drug. MeTable 2009, 10, 1192–1199. [Google Scholar] [CrossRef]
  4. Akagi, J.; Khoshmanesh, K.; Evans, B.; Hall, C.J.; Crosier, K.E.; Cooper, J.M.; Crosier, P.S.; Wlodkowic, D. Miniaturized Embryo Array for Automated Trapping, Immobilization and Microperfusion of Zebrafish Embryos. PLoS One 2012, 7. [Google Scholar] [CrossRef]
  5. Ring, E.A.; de Jonge, N. Microfluidic system for transmission electron microscopy. Microsc. Microanal. 2010, 16, 622–629. [Google Scholar] [CrossRef]
  6. Klein, K.L.; Anderson, I.M.; de Jonge, N. Transmission electron microscopy with a liquid flow cell. J. Microsc. 2011, 242, 117–123. [Google Scholar] [CrossRef]
  7. Ramachandra, R.; Demers, H.; de Jonge, N. Atomic-resolution scanning transmission electron microscopy through 50-nm-thick silicon nitride membranes. Appl. Phys. Lett. 2011, 98. [Google Scholar] [CrossRef]
  8. Yuk, J.M.; Park, J.; Ercius, P.; Kim, K.; Hellebusch, D.J.; Crommie, M.F.; Lee, J.Y.; Zettl, A.; Alivisatos, A.P. High-resolution EM of colloidal nanocrystal growth using graphene liquid cells. Science 2012, 336, 61–64. [Google Scholar] [CrossRef]
  9. Taylor, K.A.; Glaeser, R.M. Retrospective on the early development of cryoelectron microscopy of macromolecules and a prospective on opportunities for the future. J. Struct. Biol. 2008, 163, 214–223. [Google Scholar] [CrossRef]
  10. Rhinow, D.; Kuhlbrandt, W. Electron cryo-microscopy of biological specimens on conductive titanium-silicon metal glass films. Ultramicroscopy 2008, 108, 698–705. [Google Scholar] [CrossRef]
  11. Yoshioka, C.; Carragher, B.; Potter, C.S. Cryomesh: A new substrate for cryo-electron microscopy. Microsc. Microanal. 2010, 16, 43–53. [Google Scholar] [CrossRef]
  12. Degen, K.; Dukes, M.; Tanner, J.R.; Kelly, D.F. The development of affinity capture devices—a nanoscale purification platform for biological in situ transmission electron microscopy. Rsc. Adv. 2012, 2, 2408–2412. [Google Scholar] [CrossRef]
  13. Gilmore, B.L.; Showalter, S.P.; Dukes, M.J.; Tanner, J.R.; Demmert, A.C.; McDonald, S.M.; Kelly, D.F. Visualizing viral assemblies in a nanoscale biosphere. Lab Chip 2013, 13, 216–219. [Google Scholar] [CrossRef]
  14. Trask, S.D.; McDonald, S.M.; Patton, J.T. Structural insights into the coupling of virion assembly and rotavirus replication. Nat. Rev. Microbiol. 2012, 10, 165–177. [Google Scholar] [CrossRef]
  15. Arnold, M.M.; Patton, J.T. Rotavirus antagonism of the innate immune response. Viruses 2009, 1, 1035–1056. [Google Scholar] [CrossRef]
  16. Ring, E.A.; Peckys, D.B.; Dukes, M.J.; Baudoin, J.P.; de Jonge, N. Silicon nitride windowsfor electron microscopy of whole cells. J. Microsc-Oxford 2011, 243, 273–283. [Google Scholar] [CrossRef]
  17. Ohi, M.; Li, Y.; Cheng, Y.; Walz, T. Negative staining and image classification—powerful tools in modern electron microscopy. Biol. Proced. Online 2004, 6, 23–34. [Google Scholar] [CrossRef]
  18. Frank, J.; Radermacher, M.; Penczek, P.; Zhu, J.; Li, Y.; Ladjadj, M.; Leith, A. SPIDER and WEB: Processing and visualization of images in 3D electron microscopy and related fields. J. Struct. Biol. 1996, 116, 190–199. [Google Scholar] [CrossRef]
  19. Scheres, S.H. A Bayesian view on cryo-EM structure determination. J. Mol. Biol. 2012, 415, 406–418. [Google Scholar] [CrossRef]
  20. Zhang, X.; Settembre, E.; Xu, C.; Dormitzer, P.R.; Bellamy, R.; Harrison, S.C.; Grigorieff, N. Near-atomic resolution using electron cryomicroscopy and single-particle reconstruction. Proc. Natl. Acad. Sci. USA 2008, 105, 1867–1872. [Google Scholar]
  21. Grigorieff Laboratory website. Available online: http://emlab.rose2.brandeis.edu/rotavirusdlp (accessed on 18 April 2012).
  22. Mellado, M.C.; Mena, J.A.; Lopes, A.; Ramirez, O.T.; Carrondo, M.J.; Palomares, L.A.; Alves, P.M. Impact of physicochemical parameters on in vitro assembly and disassembly kinetics of recombinant triple-layered rotavirus-like particles. Biotechnol. Bioeng. 2009, 104, 674–686. [Google Scholar]

