Article

Hydrodynamic Cell Trapping for High Throughput Single-Cell Applications

by
Amin Abbaszadeh Banaeiyan
*,
Doryaneh Ahmadpour
,
Caroline Beck Adiels
and
Mattias Goksör
Department of Physics, University of Gothenburg, Gothenburg, SE-412 96, Sweden
*
Author to whom correspondence should be addressed.
Micromachines 2013, 4(4), 414-430; https://doi.org/10.3390/mi4040414
Submission received: 31 August 2013 / Revised: 15 November 2013 / Accepted: 25 November 2013 / Published: 3 December 2013
(This article belongs to the Special Issue Micro/Nanofluidic Devices for Single Cell Analysis)

Abstract

:
The possibility to conduct complete cell assays under a precisely controlled environment while consuming minor amounts of chemicals and precious drugs have made microfluidics an interesting candidate for quantitative single-cell studies. Here, we present an application-specific microfluidic device, cellcomb, capable of conducting high-throughput single-cell experiments. The system employs pure hydrodynamic forces for easy cell trapping and is readily fabricated in polydimethylsiloxane (PDMS) using soft lithography techniques. The cell-trapping array consists of V-shaped pockets designed to accommodate up to six Saccharomyces cerevisiae (yeast cells) with the average diameter of 4 μm. We used this platform to monitor the impact of flow rate modulation on the arsenite (As(III)) uptake in yeast. Redistribution of a green fluorescent protein (GFP)-tagged version of the heat shock protein Hsp104 was followed over time as read out. Results showed a clear reverse correlation between the arsenite uptake and three different adjusted low = 25 nL min−1, moderate = 50 nL min−1, and high = 100 nL min−1 flow rates. We consider the presented device as the first building block of a future integrated application-specific cell-trapping array that can be used to conduct complete single cell experiments on different cell types.

1. Introduction

Single cell analysis techniques emerging in the past decade have proposed numerous novel and fascinating prospects in the area of life sciences. This involves not only biologists but also scientists from the fields of engineering, physics, and chemistry to join forces in resolving some of the sophisticated and fundamental problems of stochastic cellular behavior. This would have not been possible without the creation and development of some clever and state-of-the-art platforms forming the foundations of the research. Lab-on-Chip devices [1,2,3] for example have been one of the main tools employed to realize such possibilities. No doubts, these systems have brought about the potential of studying individual cells in such detail that for instance our knowledge have penetrated into the covert voids of—as it seems—totally stochastic fluctuations of gene expression [4,5]. Investigating such heterogeneities in clonal cell populations has provided invaluable information about intracellular signaling events and cell-to-cell communication phenomena, which was not possible to obtain through the traditional, well established biological techniques, such as Western blotting [6] and real time PCR [7]. Briefly, single cell analysis approaches have offered the possibility to extract detailed information on inherent cell-to-cell variations in large populations thus providing a deeper understanding of cell dynamics and producing high-quality statistical data for modeling and systems biology resolutions [8,9].
Numerous microfluidic devices have been developed to provide a controlled environment where single cells can be captured, immobilized, cultured, exposed to selected stimuli, and specific intracellular events can be detected by time-lapse microscopy techniques [10]. For example, techniques employing gravity forces have been reported to capture cells in microwell arrays [11,12,13]. Although the throughput of such devices is high and many cells can be trapped in an array-based format, precise geometrical optimizations are required in designing the microwells to achieve a high trapping efficiency [12]. In this method cells are not actively held inside the traps and the following chemical rinsing step may remove the cells from the bottom of the microwells. Several other methods have also been coupled with microfluidics for cell immobilization and conducting controlled, complete cell assays. Flow-based active cell trapping by using control valves [14,15], non-invasive optical trapping [16,17,18], dielectrophoresis [19,20,21], surface chemistry modification techniques [22,23], arrays of physical barriers [24], cell trapping by negative pressure [25,26], and hydrodynamic methods [27,28,29] are some of these successfully established techniques.
In our previous work, we developed an experimental platform combining a microfluidic chamber with optical tweezers and advanced time-lapse microscopy [17,30,31], which has vastly been used to identify the underlying mechanisms of different signaling pathways in Saccharomyces cerevisiae (budding yeast) cells. Cells were trapped by the optical tweezers and positioned precisely in an array format at the bottom of the microfluidic chamber. Prior to the experiments, the microfluidic system was treated with a concanavalin A solution to immobilize the cells when pressed to the bottom surface. Thereafter, immobilized cells were exposed to the specific concentrations of intended solutions. The great potential of this system in changing the cellular environment rapidly and reversibly provided a pronounced understanding of the single cell dynamics. However, a limitation with this system was that precise cell positioning with optical tweezers demanded careful measures and thus, the number of the cells that could be trapped and positioned in an appropriate time period was limited. In addition, due to the limited number of cells in each experimental run, the information extracted lacked the statistical significance. Under the ideal experiment conditions the maximum number of cells that could be positioned in an array was constricted to 25–50 cells. To address the need for an easy-to-operate system capable of providing high-throughput single cell data with substantial statistical relevance we designed and fabricated a versatile and reliable platform, being referred to as cellcomb. Our device exploited hydrodynamic forces to direct the cells into a trapping area where single cells were held steadily inside V-shaped pockets by streamlines of the flow. After a successful cell-trapping step, controlled extracellular environmental changes were applied using a minute amount of intended stimuli and the intracellular events could be followed over time by means of time-lapse bright field and fluorescence microscopy. By employing the cellcomb platform we could conduct single cell experiments with up to 624 cells per run without forfeiting the spatial and temporal resolutions.
We demonstrated the functionality of this device for trapping yeast cells and showed that the device could successfully be used for single-cell applications. We optimized the flow rates in the system to actively modulate the uptake of arsenite (As(III)) in yeast. Sodium arsenite and YNB (Yeast Nitrogen Base) were infused into the microchannels and redistribution of a green fluorescent protein (GFP)-tagged version of the heat shock protein Hsp104 was recorded over time as readout. Arsenite promotes protein misfolding, causing protein aggregations. Hsp104, which is otherwise evenly distributed in cytosol co-sediments with arsenite induced protein, aggregates and therefore relocalizes to distinct foci (aggregates) [32]. The Hsp104-GFP relocalization occurs in an arsenite concentration dependent manner [32] and here was employed as readout indicating the cellular arsenite uptake. As described by Jacobsson et al. [32], the formation of aggregates is somewhat a slow response and once formed, it requires about three hours until cells can clear the cytosol from protein aggregates. This therefore, provides a suitable temporal resolution for all the filled pockets along the device to be sequentially imaged. Moreover, the arsenite-induced aggregates can be precisely quantified with the single cytosolic Hsp104-GFP reporter without a need for introducing further reporters.

2. Experimental Procedure

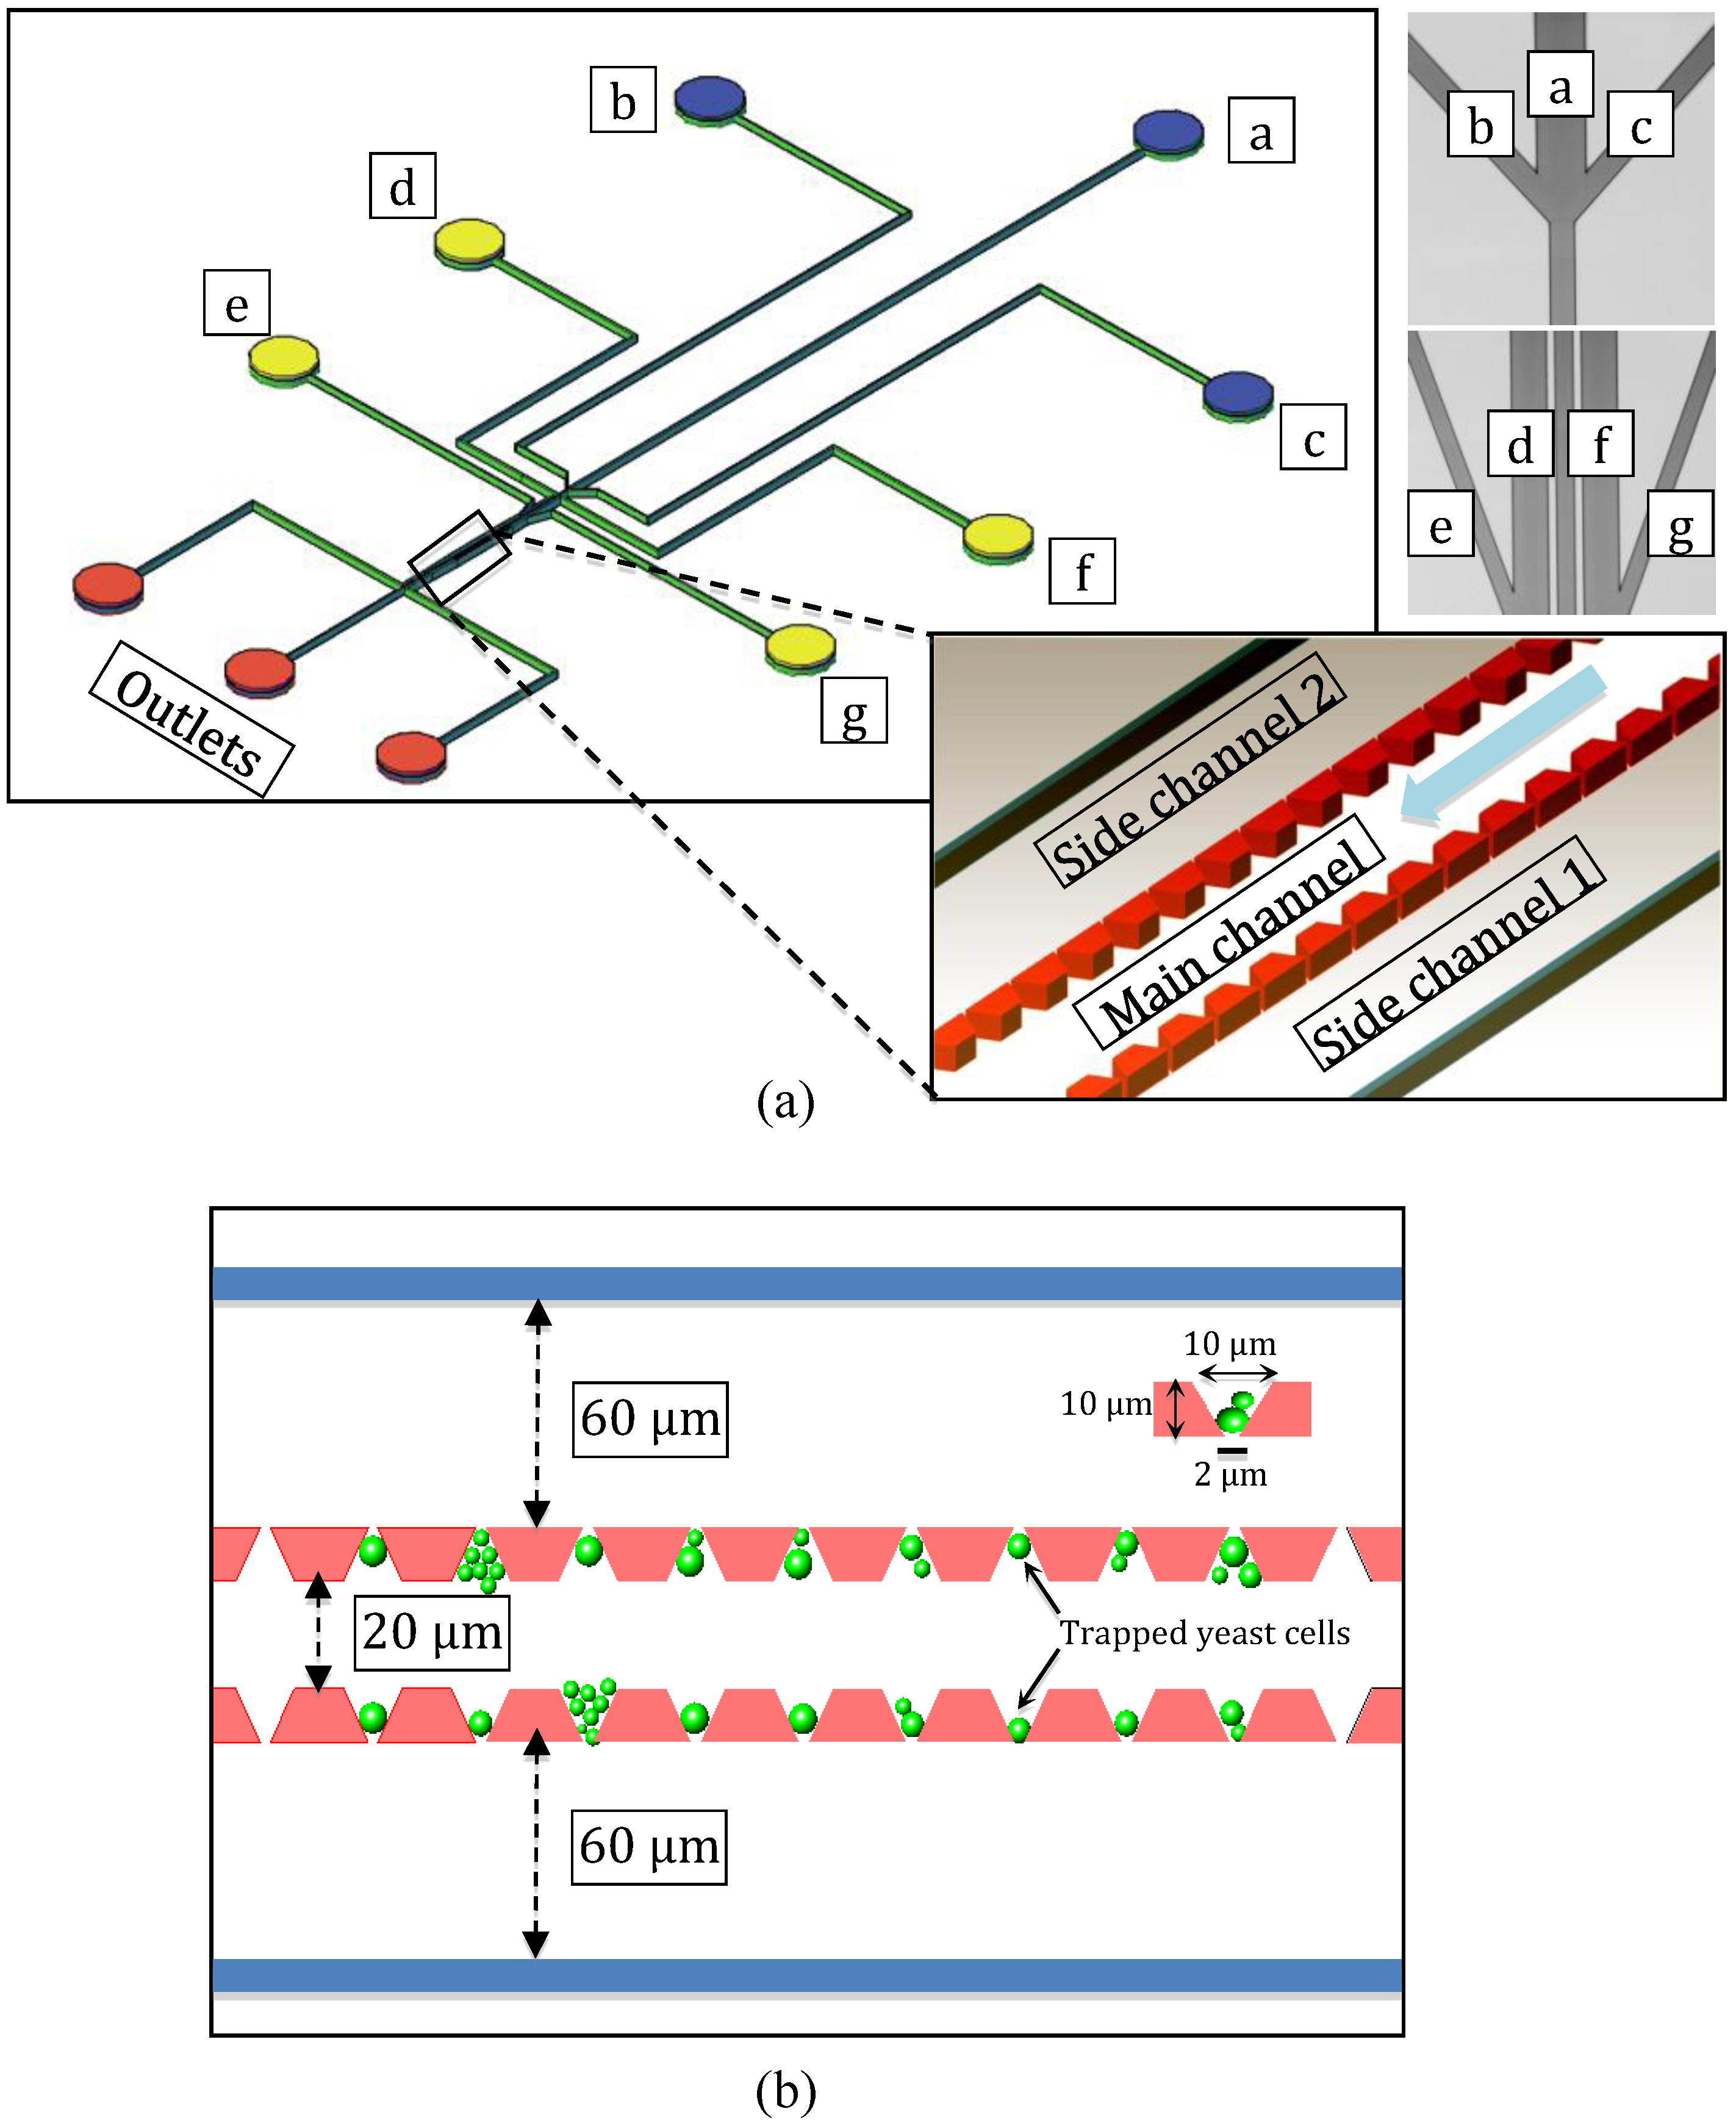
2.1. Microfluidic System Design and Fabrication

Our microfluidic device was designed to hydrodynamically trap cells in a high throughput manner and keep them in position for the subsequent chemical exposure step. The cellular responses to the imposed perturbations could then be followed over time by fluorescence microscopy imaging. Figure 1a shows the overview of the device with cell inlets, reagent inlets and the outlets. The device comprised three adjacent channels, referred to as the main channel and the two side channels. The main channel was 20 μm wide and included the trapping zone of the chip. Cells were loaded into the device from the inlets “b” and “c” and inlet “a” was used to introduce the intended stress substance to the system. Inlets “d” and “f” are the main side inlets used for the cell loading step or introduction of stimuli via the side channels. Inlets “e” and “g” can be used as sheath flow inlets or to introduce additional reagents in the side channels. The two 60 μm-wide side channels were connected to the main channel via the V-shaped pockets with the dimensions of 10 μm × 10 μm and confinement openings with the width of 2 μm as shown in Figure 1b. The pockets were designed to trap up to six yeast cells with an average diameter of 4 μm. The entire system had a height profile of 4.8 μm to realize a single layer cell accommodation. The 2-μm openings acted like flow nuzzles and created a jet flow at the bottom of the confinement openings. A fraction of the fluid drawn into the pockets dragged the floating cells with it and confined them inside the traps consequently. Microfluidic devices were designed in a CAD program (AutoCAD 2012, Autodesk Inc., San Francisco, CA, USA) and photomasks were fabricated with e-beam lithography. SU8 (MicroChem Corp., Newton, MA, USA) was used as the negative photoresist and the pattern of the microchannels was transferred from the photomasks to the silicon substrates in a photolithography step. PDMS was then cast onto the SU8 masters to fabricate the microfluidic chips. SU8-5 was spin-coated on a 3-inch (100) silicon wafer at 3000 rpm, for 30 s, to achieve a film thickness of 5 μm according to the photoresist manufacturer data sheet. The thickness of the photoresist film was verified by using Dektak 150 surface profiler (Veeco instruments Inc., Plainview, NY, USA). The measured height of the microchannels was 4.8 μm (surface profiler data not shown). Photoresist-coated wafers were soft-baked on a hot plate for 2 min at 65 °C and 5 min at 95 °C, and then were exposed to the UV light with the dose of 6 mJ/s cm2 for 18 seconds in a conventional mask aligner (KS MJB3-DUV, SussMicrotech, Garching, Germany). A post exposure bake (PEB) was applied according to the instructions from the resist manufacturer for 1 min at 65 °C and 3 min at 95 °C. Wafers were developed in mr-Dev 600 (Micro resist technology GmbH, Berlin, Germany) for 7 min to dissolve the unexposed photoresist. Patterned wafers were then hard-baked in a closed-cover hotplate at 160 °C for 10 min. A 10:1 PDMS (polydimethylsiloxane) and curing agent mix was cast onto the masters and cured in the oven at 90 °C for 2 h. Microfluidic chips were cut and gently released from the masters, inlet and outlet holes were punched and PDMS replicas were irreversibly bonded on coverslips (Thickness no. 1.5 (0.16 to 0.19 mm), VWR, Stockholm, Sweden) by oxygen plasma treatment (PDC-32G/32G-2 (115/230V), Harrick Plasma, Ithaca, NY, USA) at 18 W RF power for 30 s. To increase the surface wettability and reduce the risk of bubble formation inside the channels, sealed microfluidic devices underwent an extended oxygen plasma treatment step for 5 min before performing the experiments [33]. Detailed fabrication procedure has been described by Sott et al. [34].

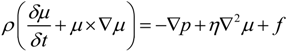
2.2. Numerical Simulations Using COMSOL Multiphysics

A series of fluid dynamic simulations were performed in COMSOL Multiphysics (COMSOL Inc., Burlington, MA, USA) to identify the fluid flow inside the individual traps. Microfluidics module was used with the single-phase, laminar flow approximations and the simulations were built upon stationary incompressible Navier-Stokes equations and the continuity equation, under the assumption of the constant fluid density and the mass conservation:
Micromachines 04 00414 i001
μ = 0
Here, μ is the flow velocity, ρ and η are the density and the dynamic viscosity of the fluid, respectively. p is the pressure and f denotes the other body forces e.g., gravity or magnetic forces. Simulations were performed under the condition of body forces equal to “zero”. Flows were assumed to be Newtonian and incompressible i.e., the viscosity of the fluid (η) being independent of the flow velocity and the density of the fluid (ρ) independent of the pressure. No-slip boundary condition (flow velocity at all solid boundaries is “zero”) was selected for the channel walls and shallow-channel approximation applied for all three channels with the height of 4.8 μm. More details of the simulations can be found in [17], as described by Eriksson et al. [17].
Figure 1. (a) Overview of the microfluidic device with inlets and outlets. Inlets “a”, “b”, and “c” were connected to the main channel and used to inject the cells and stress substances into the device. Inlets “d” and “f” were used as the side inlets for hydrodynamic cell loading and reagent injection into the side channels. Inlets “e” and “g” were sheath flow inlets. Close-up view shows the trapping zone of the device and the flow direction in the main channel. (b) Device dimensions engineered for experiments with yeast cells.
Micromachines 04 00414 g001

2.3. Cell Preparation

The Saccharomyces cerevisiae (yeast cells) strain used in this study is HSP104-GFP in BY4741 background. The cells were grown on filtered minimal SC (synthetic complete) medium (0.67% yeast nitrogen base) supplemented with auxotrophic requirements and 2% glucose as carbon source, at 30 °C on a shaker (220 rpm). The cells were then collected at OD600 = 0.5–1.0, and were diluted in the same filtered medium to obtain the desired cell densities prior to the experiments.

2.4. Sodium Arsenite Solution Preparation

Sodium arsenite (NaAsO2) was dissolved in mili-Q water. A 10 mM solution was prepared and was diluted to achieve the final concentration of 0.5 mM.

3. Experimental Setup, Data Acquisition and Analysis

3.1. Microfluidic System Operation

The microfluidic chips were adapted to be used with an inverted epifluorescence microscope stage (DMI 6000B, Leica Microsystems, Wetzlar, Germany). Microfluidic chips were set on the motorized XYZ stage and time-lapse microscopy was exploited to gather the cell response data, e.g., subcellular relocation or aggregation of a reporter protein upon stimuli exposure. Before preparation of each experiment, microfluidic systems were treated with oxygen plasma and flushed with culture medium to maintain the hydrophilicity before starting the cell experiments and to remove air bubbles or PDMS residues in the microchannels. The intended solutions were injected into the microfluidic chips via 250 μL glass syringes that were connected to the channel inlets by needles and polytetrafluoroethylene (PTFE) tubing (Cole-Parmer, Vernon Hills, IL, USA). The syringes were mounted on conventional syringe pumps (CMA 400, CMA Microdialysis, Solna, Sweden) and all flow rates were manually set to 2.5 nL min−1 before starting the automated image acquisition and pump control software. Bright field and fluorescence images were obtained by using an EM-CCD camera (C9100-12, Hamamatsu Photonics, Shizuoka, Japan) and a HCX plan fluotar 100× oil immersion objective with a numerical aperture of 1.3 (Leica Microsystems). We used a 15 W high-pressure mercury lamp (EL6000, Leica Microsystems) with 200 ms exposure time for fluorescence excitation. All equipment were controlled automatically by the multifunction imaging software OpenLab (PerkinElmer, Waltham, MA, USA). After preparing the syringes with the intended solutions, the microfluidic system was fixed on a metallic holder and positioned firmly on the microscope stage. Tubing were connected to the inlet channels and the cells were loaded into the device with fast pulses of the syringe pumps. The cell-loading step was easy and quick and the system could be flushed several times through the side channels in case cell loading was not successful or if cells or air bubbles clogged the microchannels. After this rinsing step, the cell loading was repeated. The cell concentrations were experimentally optimized (starting OD = 0.6, diluted twice in YNB) to make the cell loading as facile as possible and so that the microchannels will not be jammed by excessive cell accumulation.

3.2. Image Acquisition and Analysis

The microfluidic system was divided in 13 segments lengthways, with each segment containing eight V-shaped pockets, which fitted in one field of view of the microscope. All segments of the trapping zone were imaged in sequence and the stage was moved to the next segment until all of the filled traps were imaged. Bright field images were taken first to follow the cells in time and to control the focus of the imaging and compensate for the drift in the axial direction. In order to cover the whole volume of the cells, 9 stacks of bright field images were taken in z direction. The imaging state was then switched to fluorescence and 9 stacks of fluorescent images were taken. The whole experiment time was set to 45 min and images were captured in time intervals of 30 s between each two neighboring segments. All imaging data was transferred to the open source image analysis custom software for single cell analysis CellStress [35] for processing. Captured images of all fields of view of the microscope were cropped and prepared so that the software could identify and find the cell contours. After the cells were distinguished from the background, the fluorescent images for each segment were analyzed. The aggregates were found based on an algorithm to pinpoint the areas with higher intensities amongst all the image layers in all time points during the whole experiment period.

4. Results and Discussion

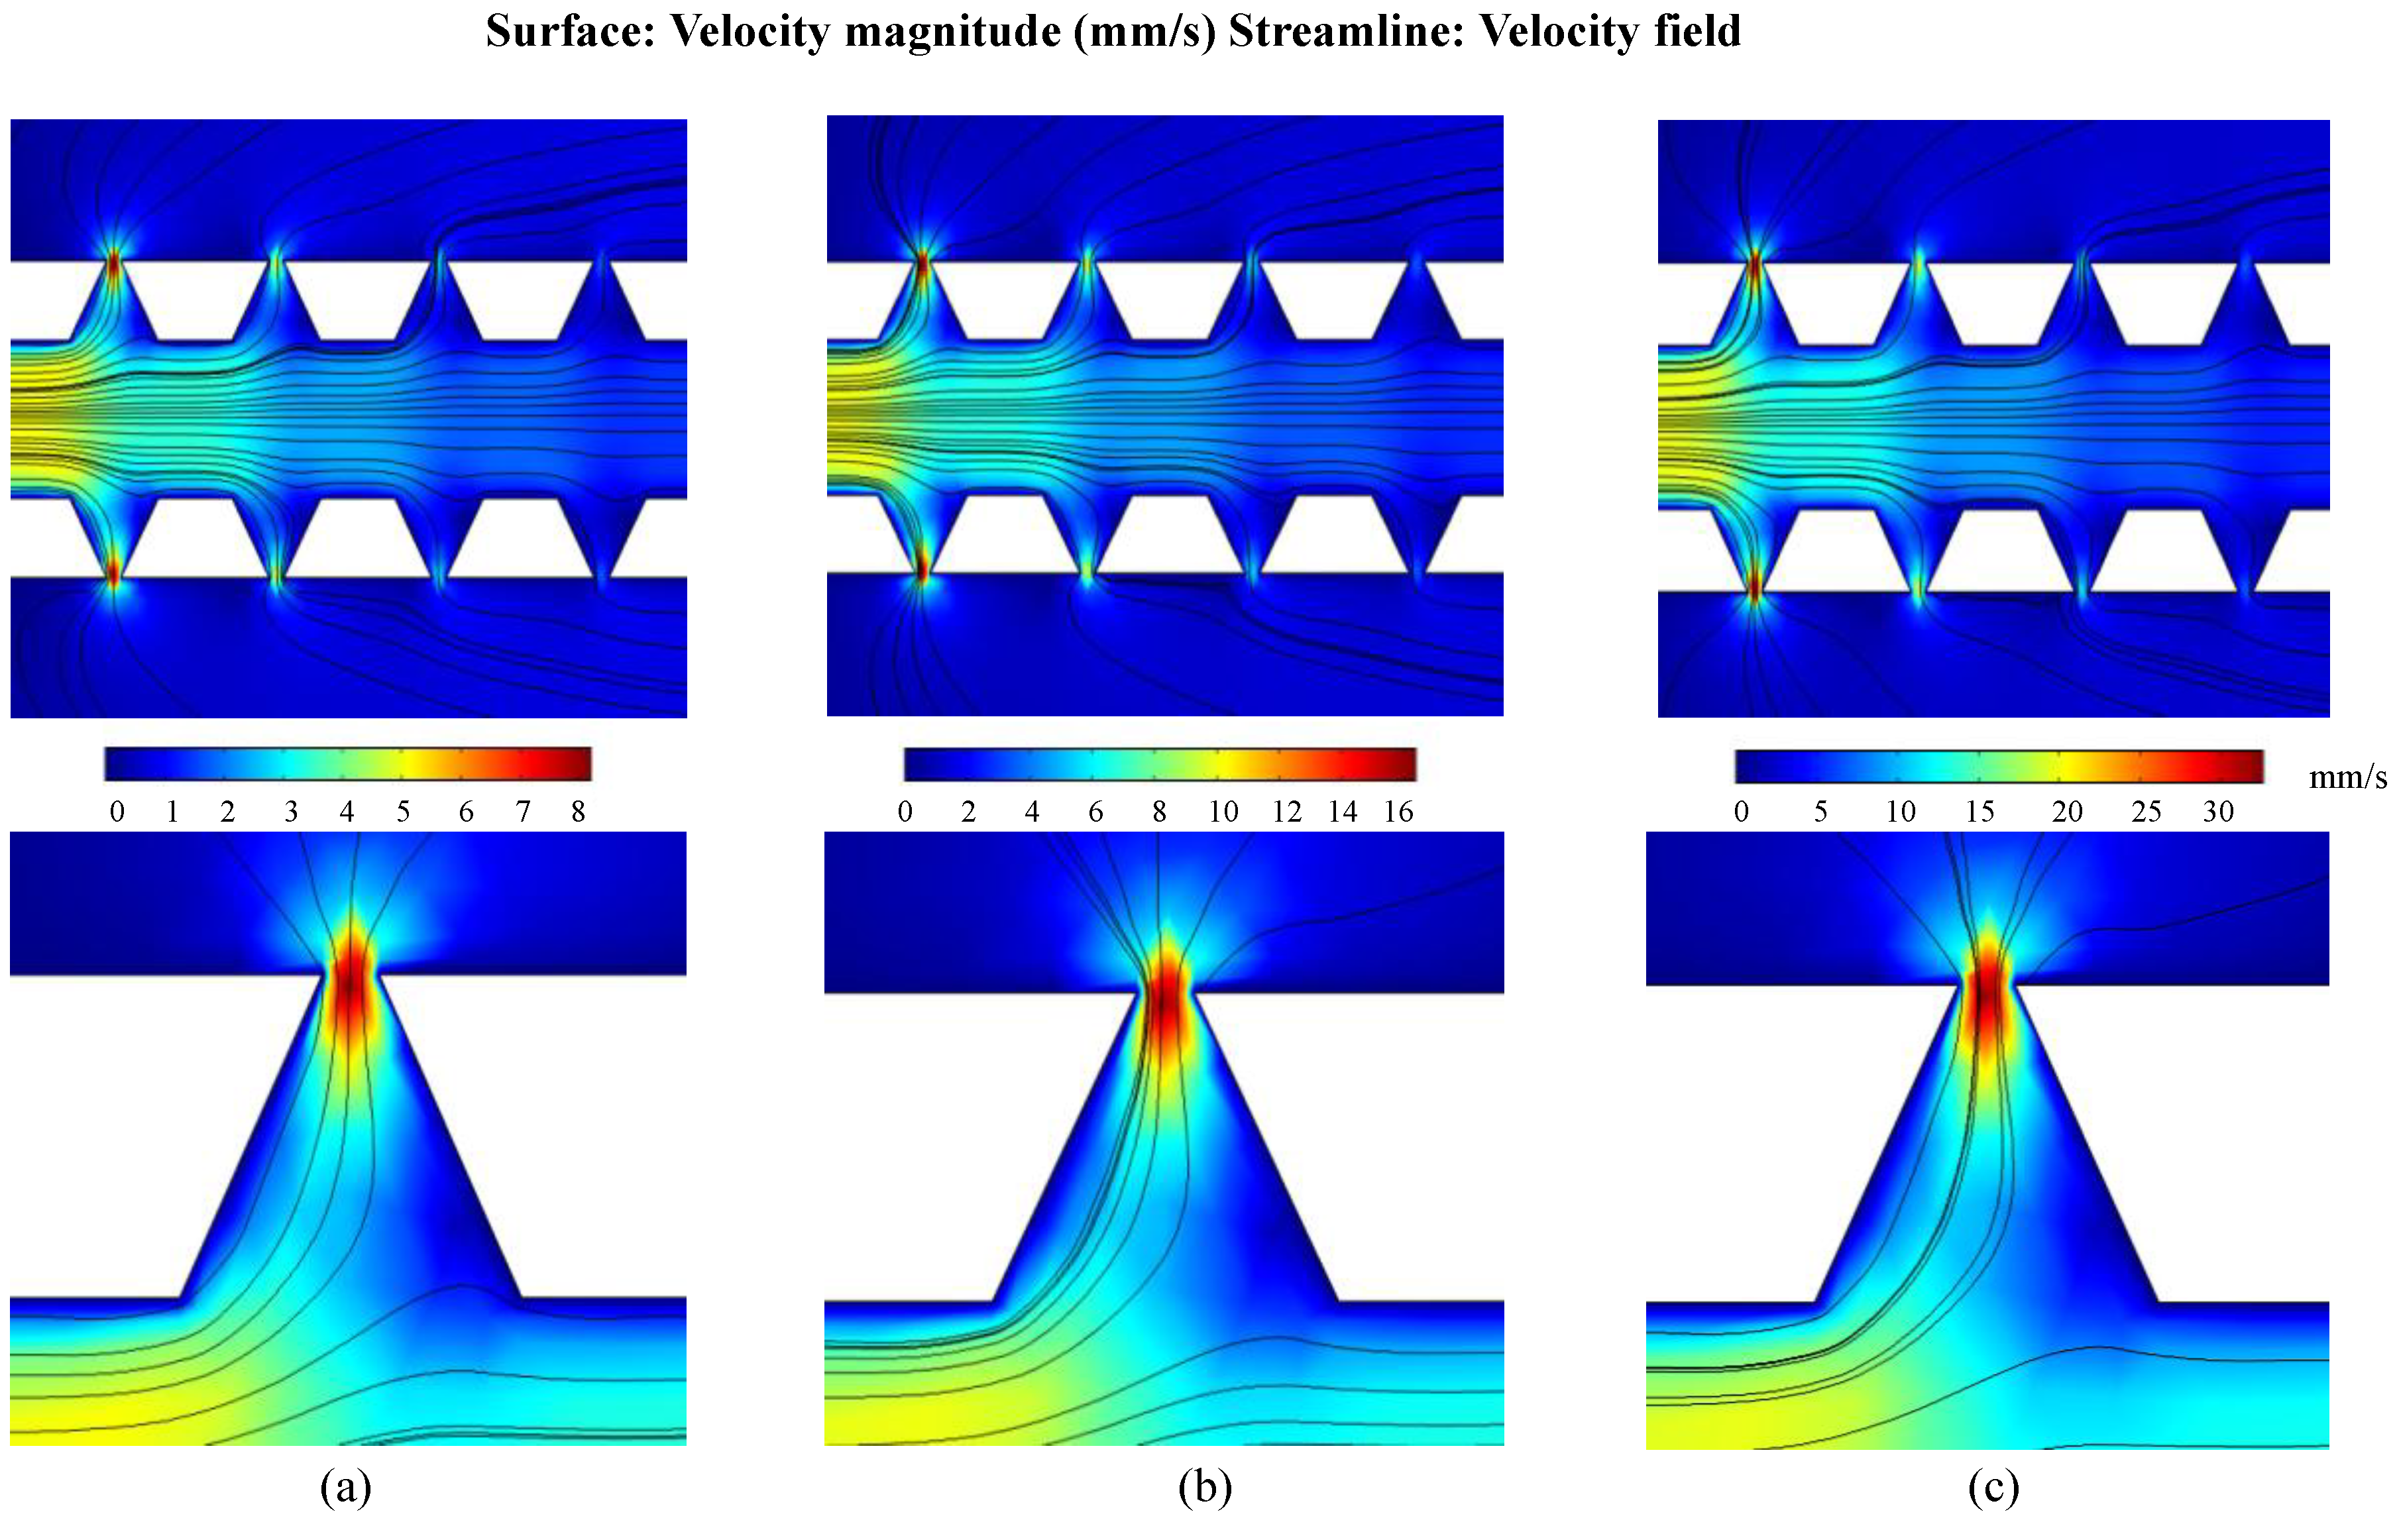
4.1. Velocity Field Simulations

The velocity field inside the microchannels was simulated for three different flow rate settings in the main channel. In all simulations the flow rates in the two side channels were kept at 5 nL min−1 and the low, moderate and high flow rates in the main channel were set to 25 nL min−1, 50 nL min−1, and 100 nL min−1, respectively. Laminar flow boundary conditions were applied for the inlet nodes. The outlet nodes were set to pressure, no viscous stress (p0 = 0 Pa) boundary conditions. Results of the simulations are shown in Figure 2. It can be seen that in all three flow rate settings a portion of the flow in the main channel was diverged into the V-shaped pockets and created a jet flow at the confinement openings. Streamlines of the flow denote that floating cells will be dragged into the traps at high flow velocities and kept at the bottom of the confinement openings as long as the high flow rate conditions are maintained in the main channel. The velocity field reached its maximum at the confinement openings of the two first traps and decreased while moving downstream the channels due to the flow escape to the side channels according to the laws of physics. In the actual experiments the trapped cells blocked the confinement openings and the high-velocity zone shifted alongside the channels.

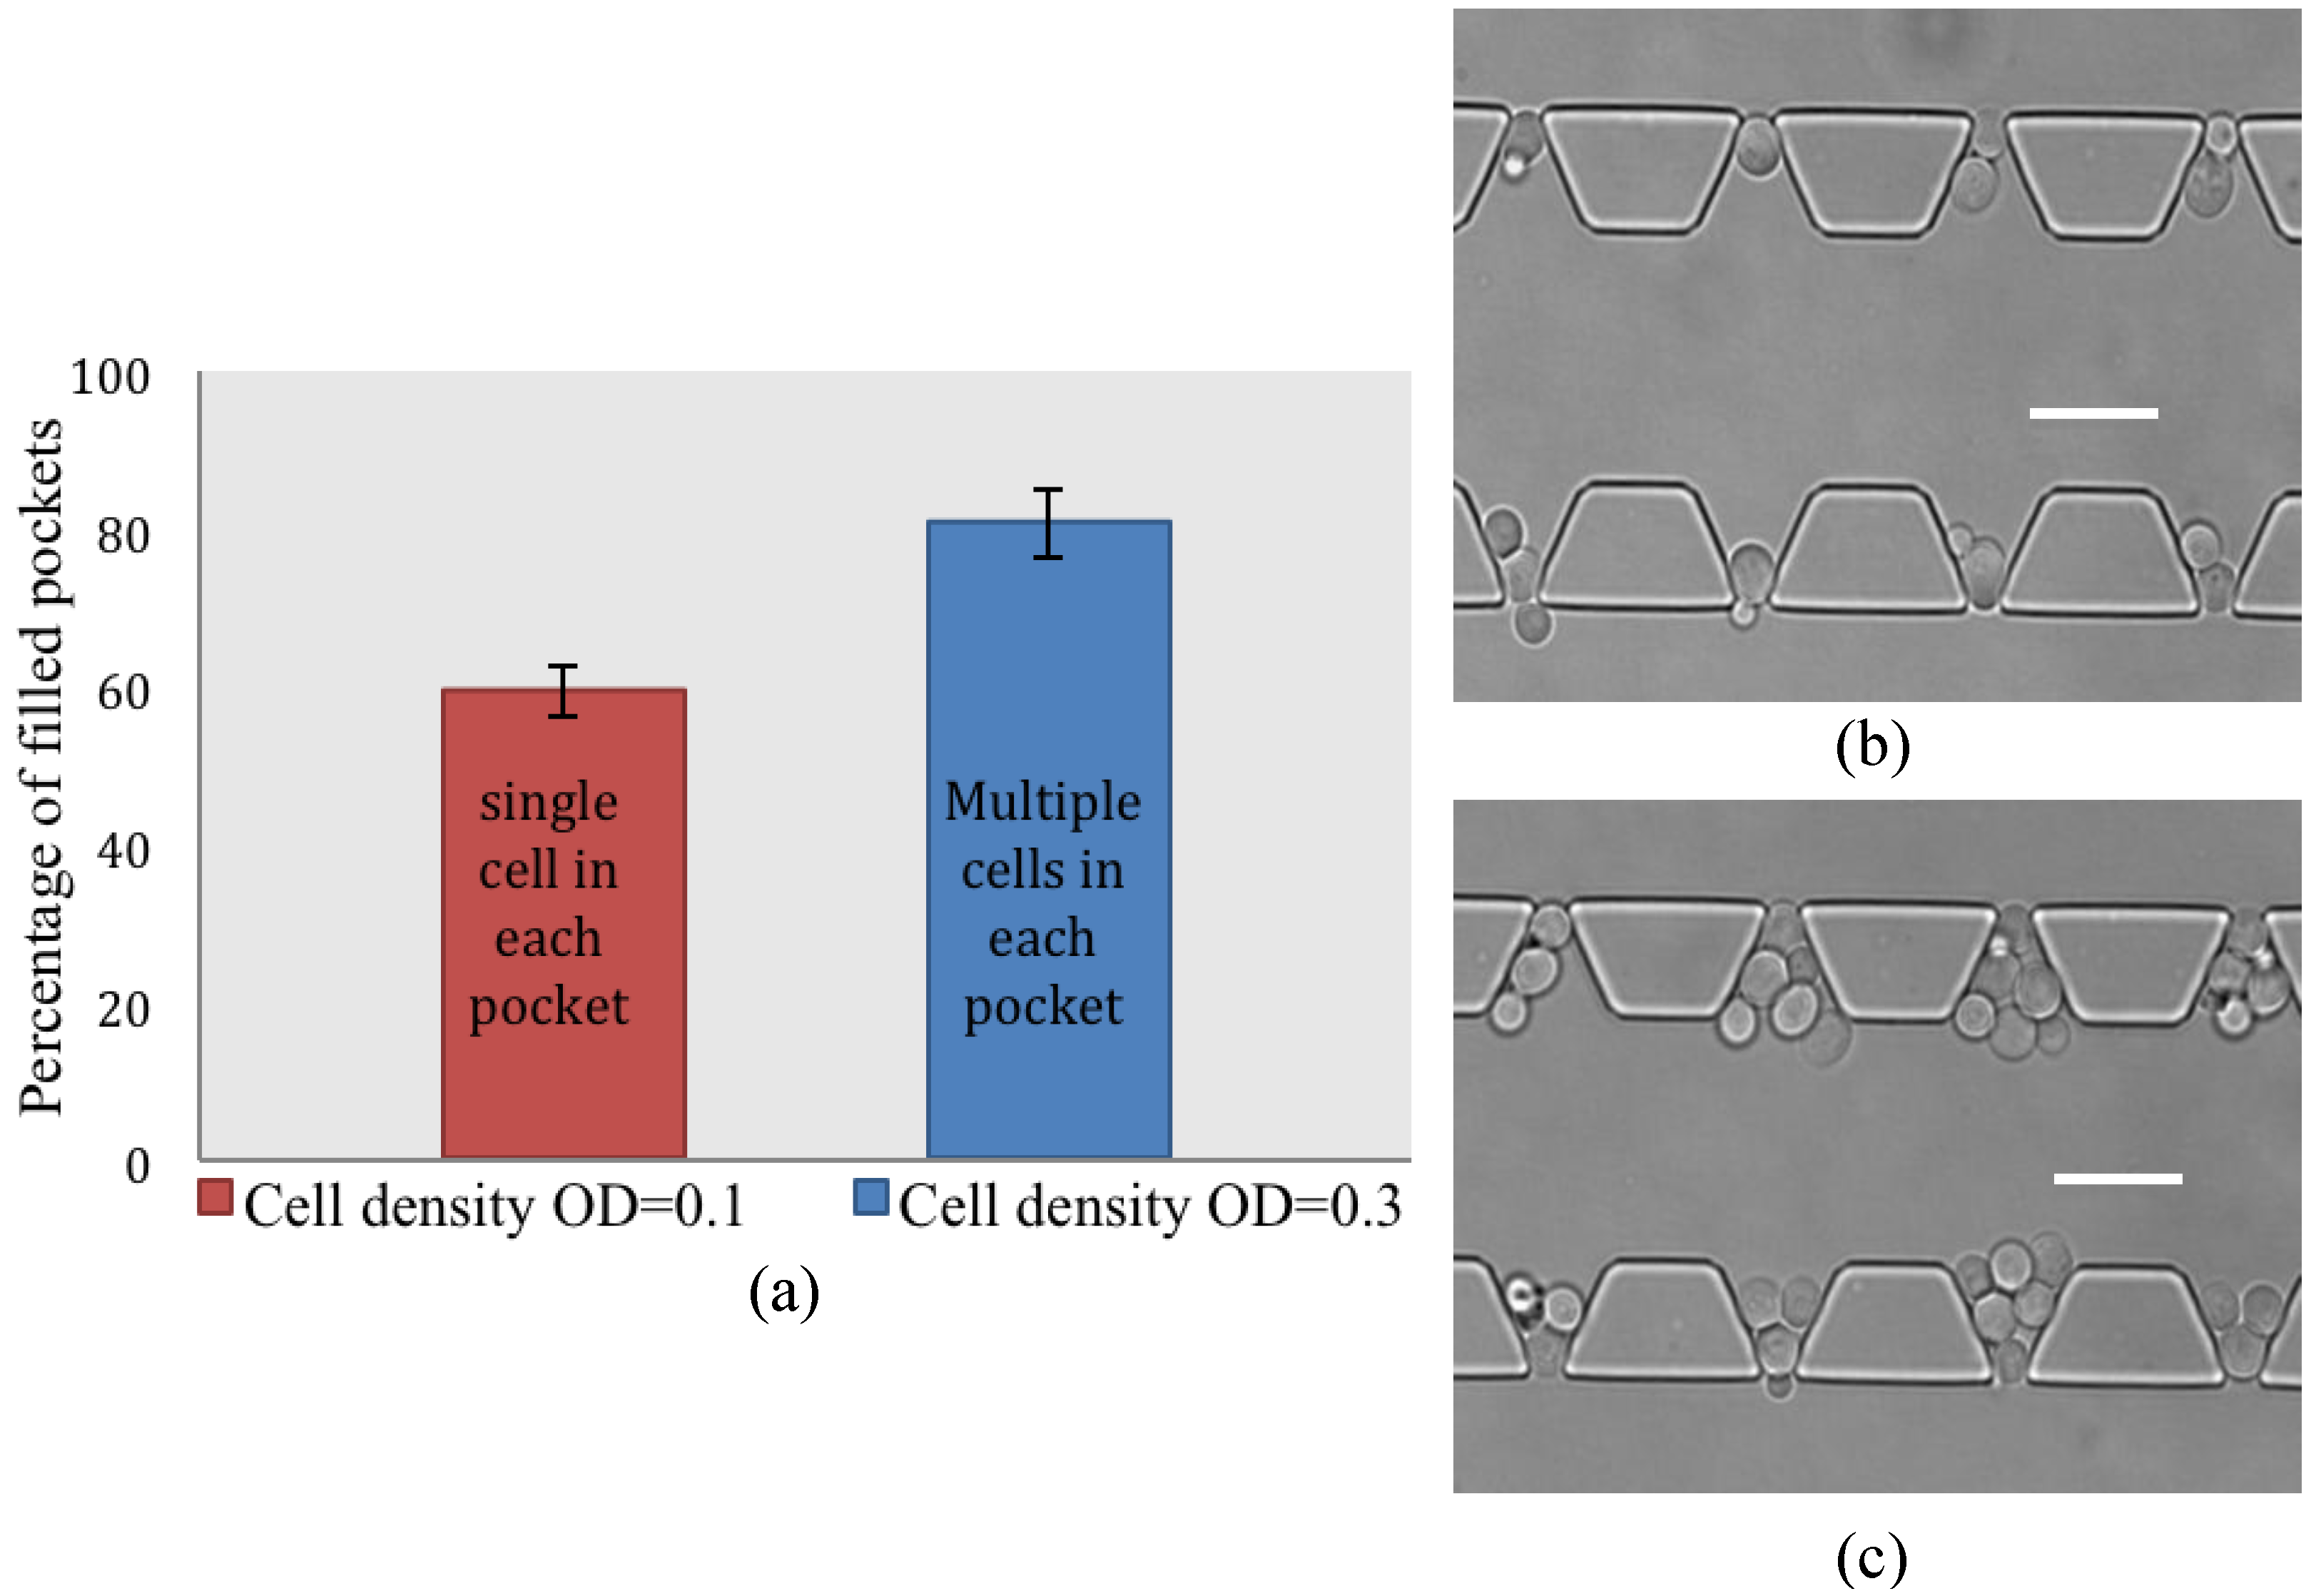
4.2. Cell Loading Efficiency

One of the main advantages of our device is that for the cell-loading there is no need for precise control on the flow rates. As the cells are sucked into the pockets based on the pressure difference between the two sides of the confinement openings, the only requirement is to fill the side channels with YNB to avoid bubble formation and then infuse the cells into the main channel with fast pulses of the syringe pump. The loading process takes less than 30 s, and we wait for 5 min to allow the system to return to its equilibrium before starting the experiments. The pockets were designed to accommodate a single layer of up to six yeast cells with the average diameter of 4 μm. Cells were collected at an OD of 0.6 and were diluted to different concentrations to decide the final cell densities. To investigate the single-cell trapping efficiency, freshly harvested Hsp104-GFP cells were loaded into the device with the final OD of 0.1. We observed that at this cell concentration single yeast cells occupied close to 60% (±3%) of the pockets (Figure 3a,b). We also observed that cell concentrations higher than OD = 0.1 will lead to multiple cells inside the pockets. For concentrations lower than OD = 0.1 the cell loading turned out not to be successful. To employ the full capacity of the system we optimized the cell density to have an OD of 0.3 and infused the cells into the device. We managed to successfully fill 80% (±4%) of the pockets with one to six yeast cells without clogging the main channel (Figure 3a,c). We did not detect any significant differences in cell trapping efficiency for cell densities higher than OD = 0.3. Infusing the device with the initial cell concentration (OD = 0.6) resulted in cell clogging in the main channel.

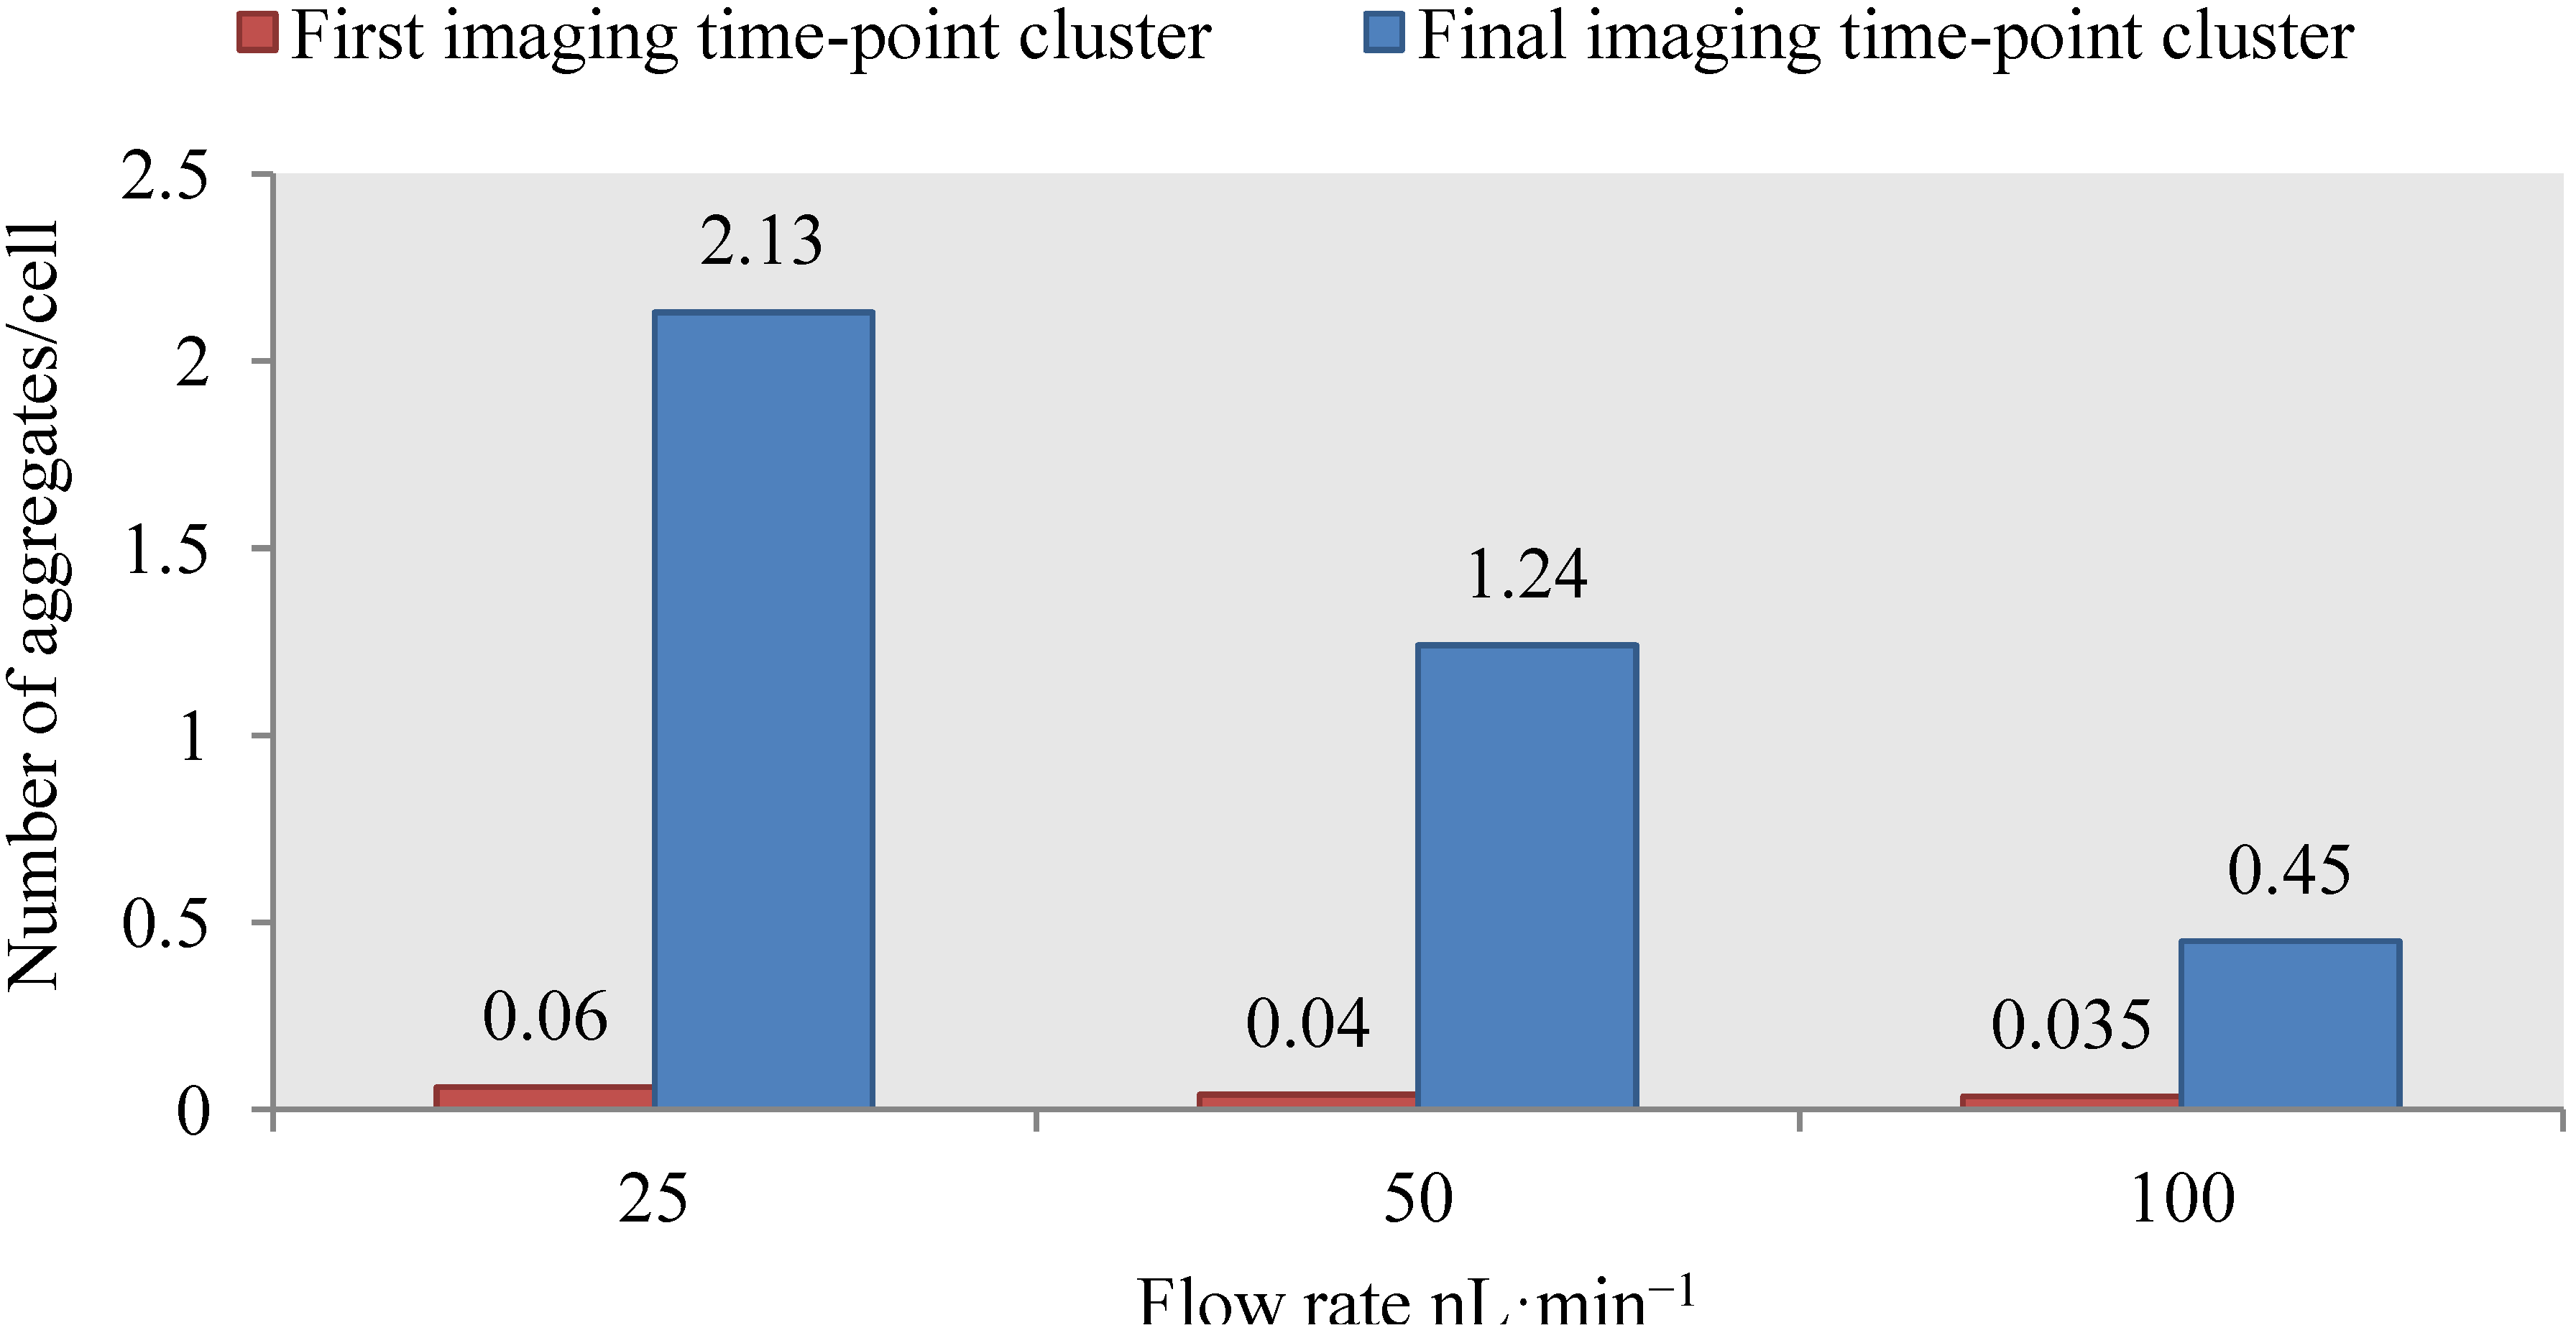
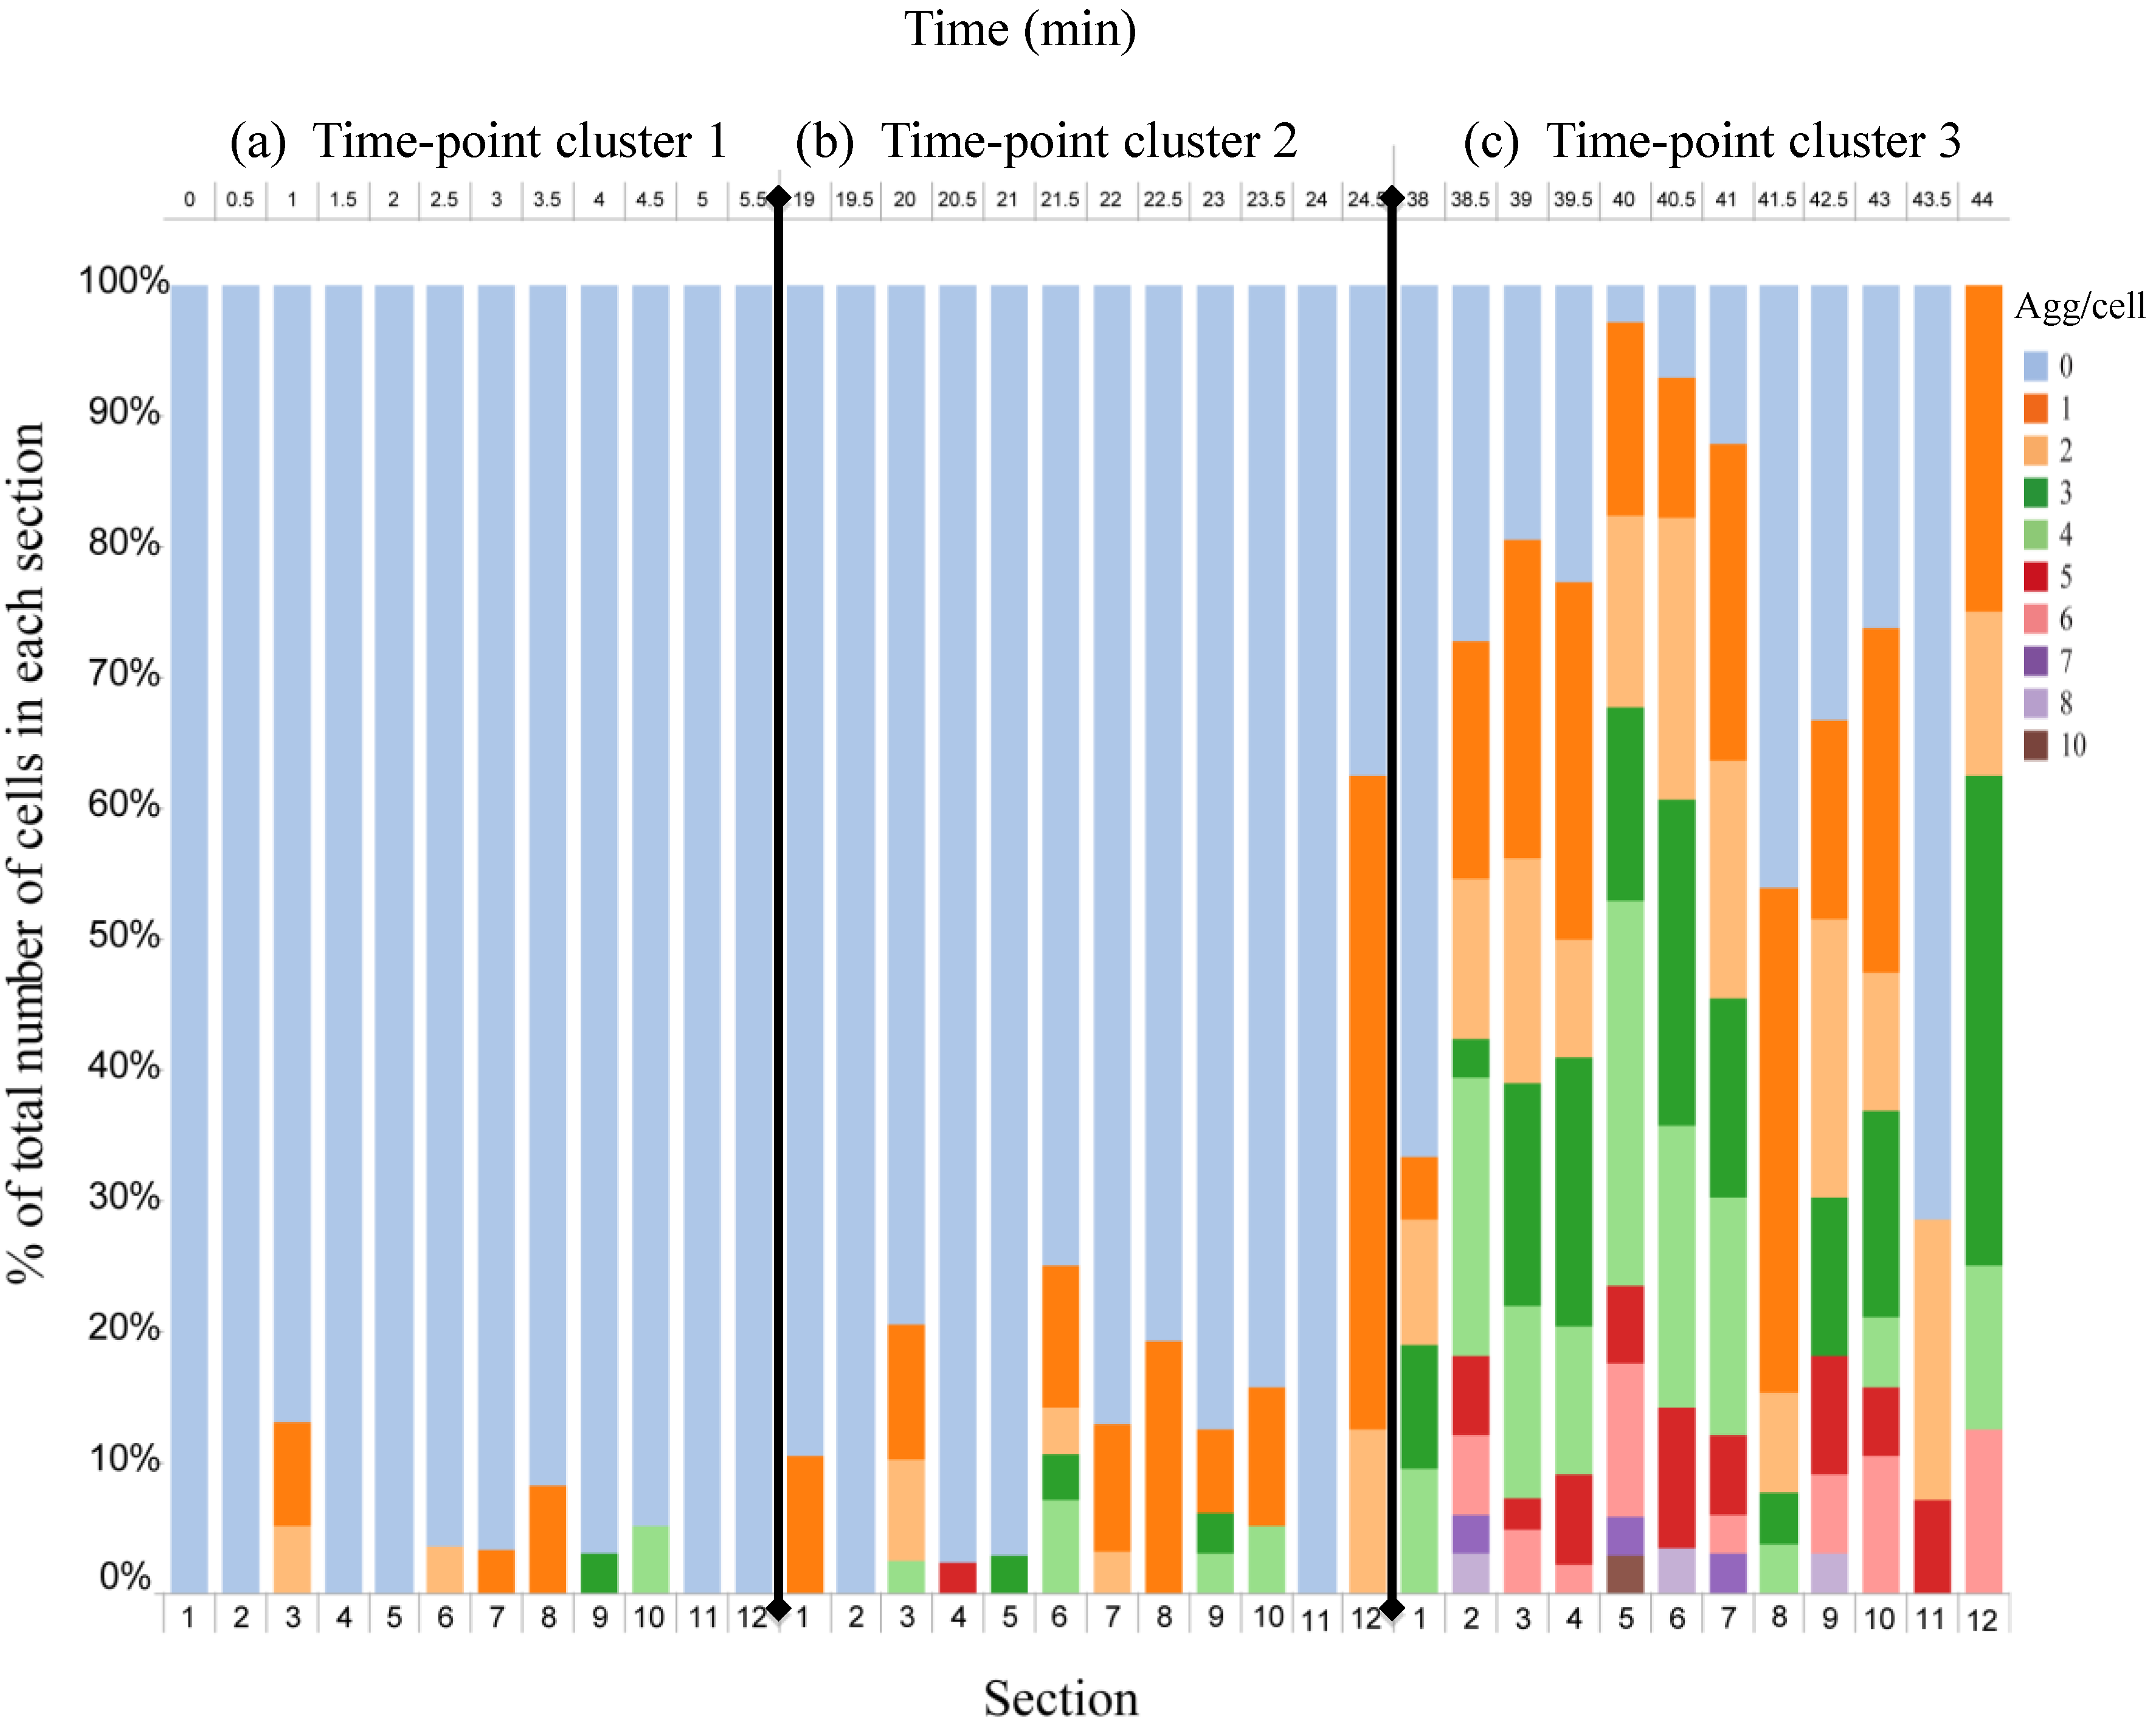
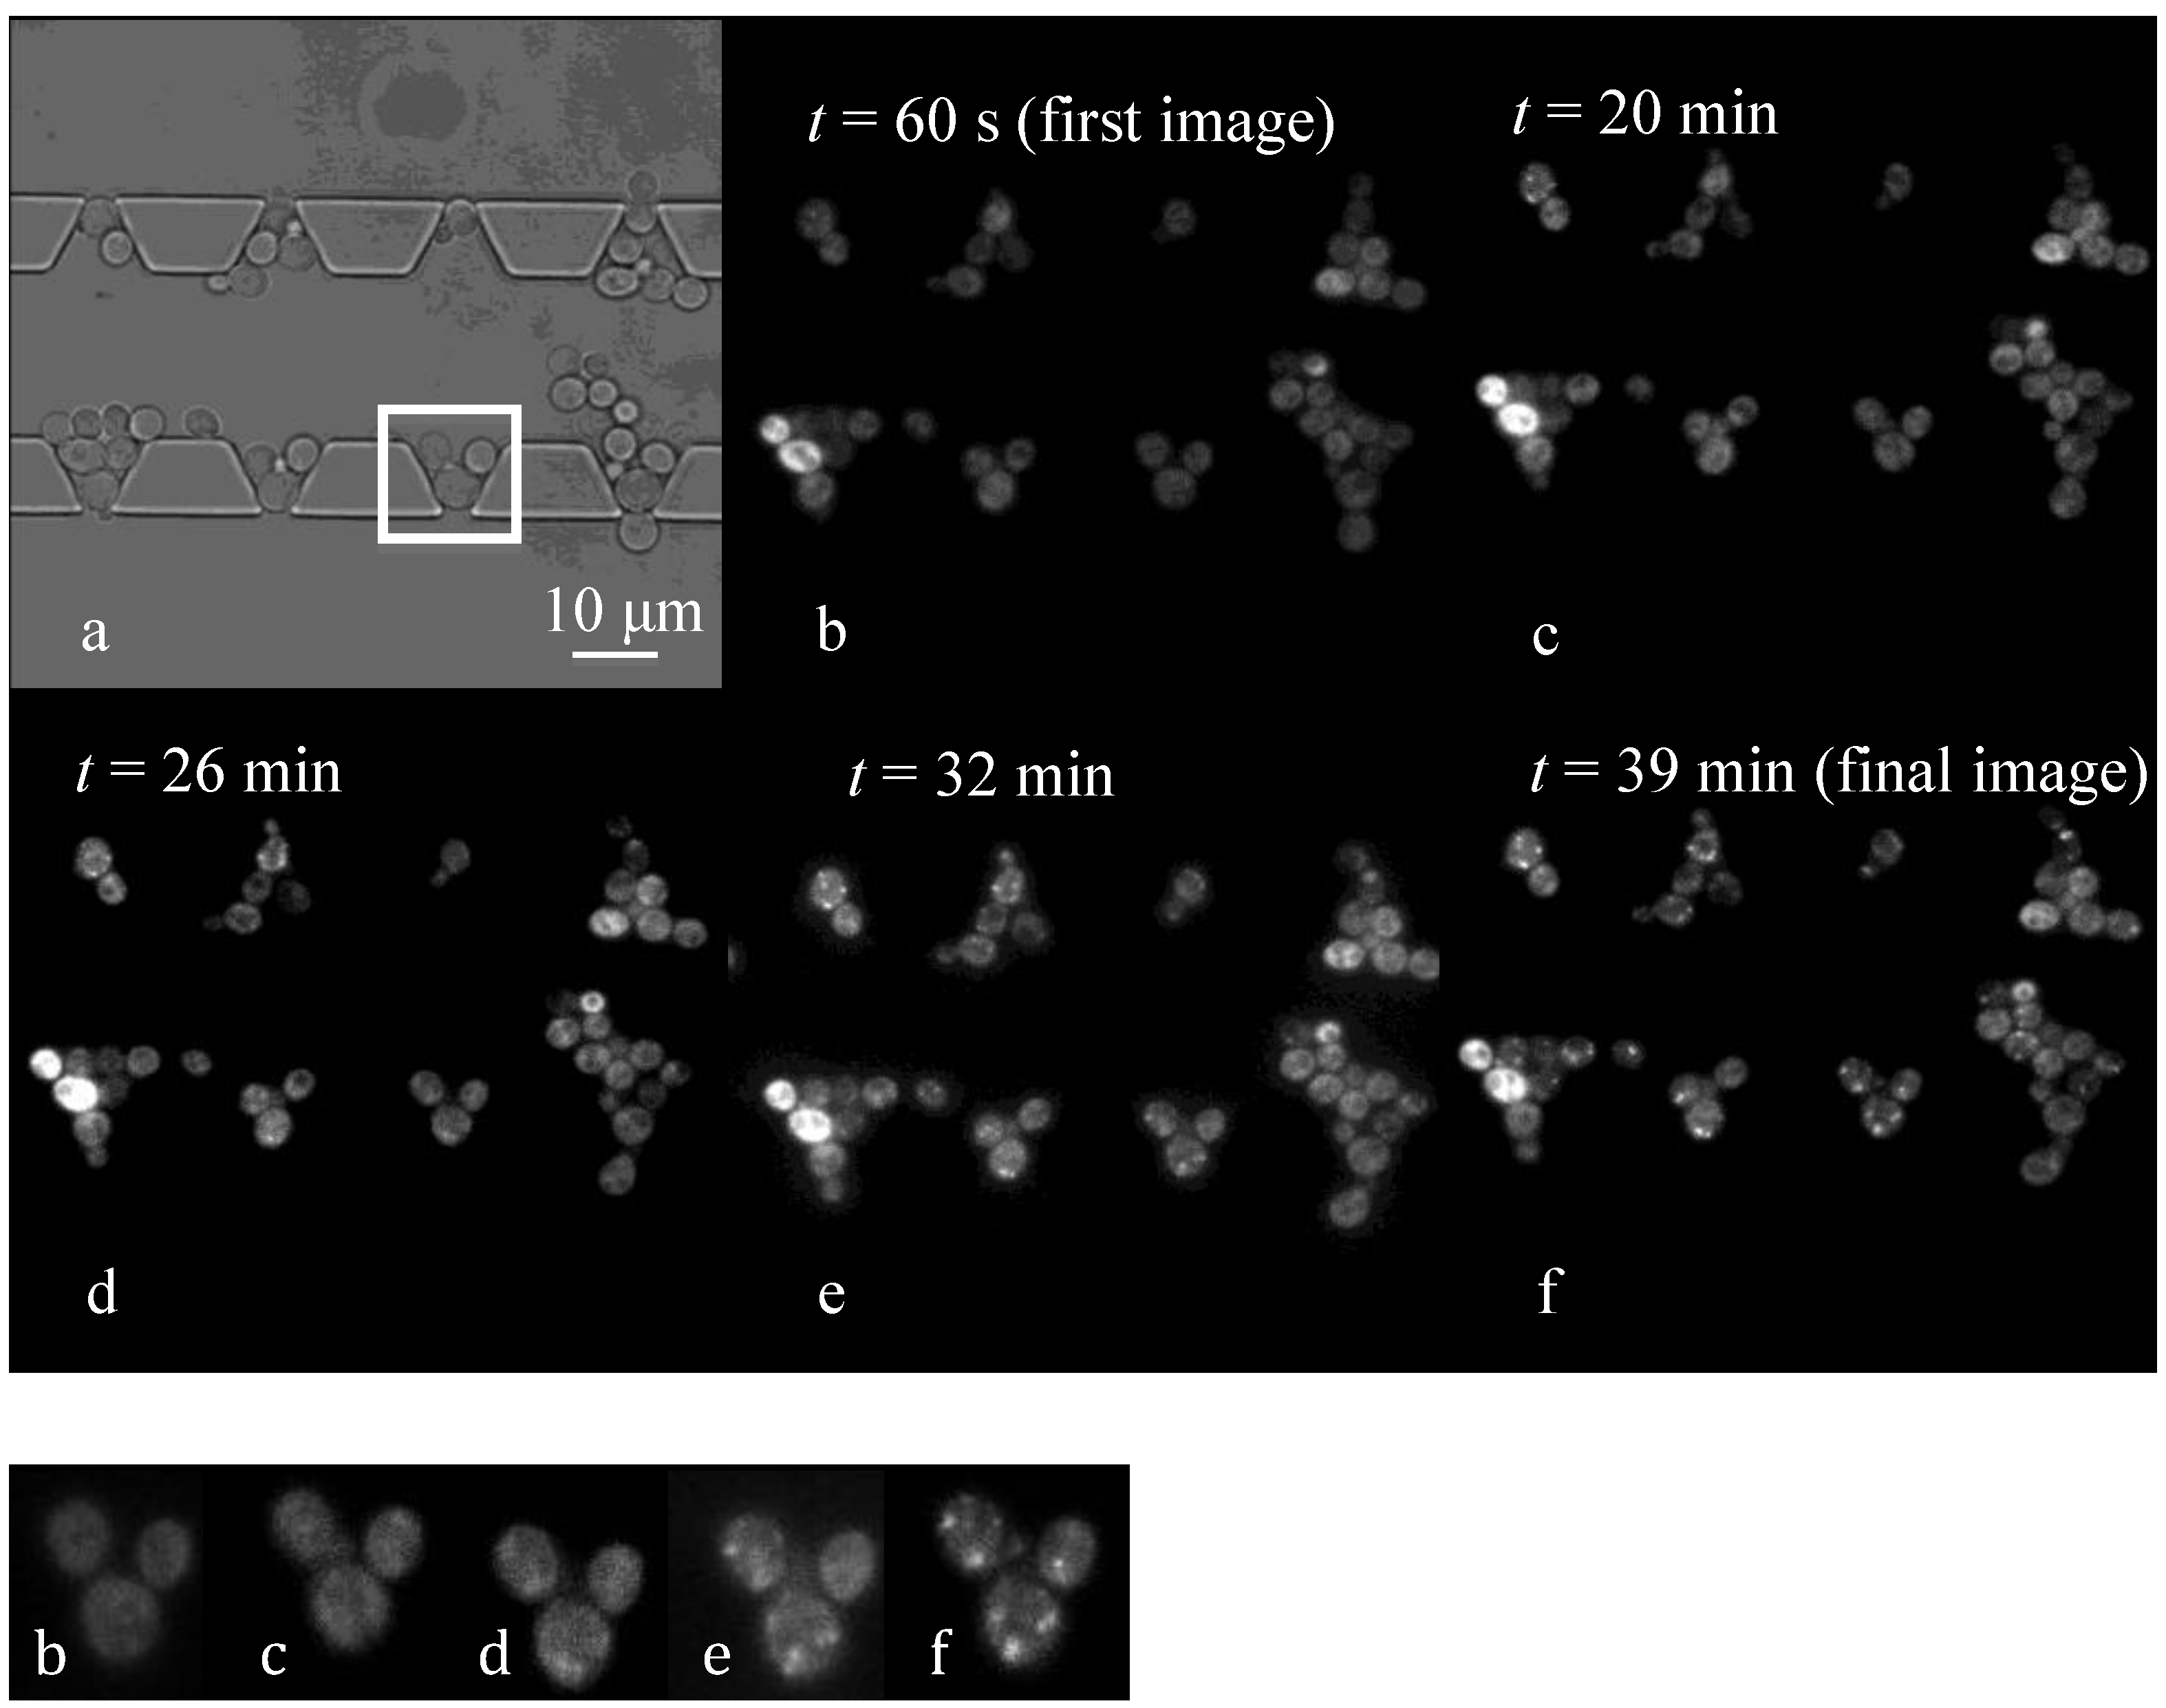
4.3. Effect of Flow Rate Modulation on Arsenite Uptake in Yeast

We conducted several experiments with GFP tagged HSP104 yeast cells to follow the redistribution of Hsp104-GFP in the cytosol upon the exposure to sodium arsenite.
For accurately imaging of the trapping zone, the height of the device was tailored precisely to accommodate a single layer of cells inside the traps. By preventing the cells from stacking on top of each other a clear single-cell signal could be read from the trapped cells. With the engineered dimensions of the traps, cells with a diameter larger than 3 μm got trapped in the trapping zone while smaller buds were guided to the waste chambers of the system. Prior to the experiments the plasma treated devices were primed with YNB and mounted on the microscope stage.
Figure 2. Simulation results for the velocity field under the three different main flow rate conditions. The side flow rates in all cases were kept at 5 nL·min−1. Jet flows were formed at the bottom of the flow nozzles. The flow velocity reached its maximum at the bottom of trap 1 and trap 2 and decreases along the channel due to the partial leakage of the flow to the side channels. Streamlines of the velocity field show the portion of the flow diverged from the main channel to the side channels. (a) The flow rate in the main channel was 25 nL min−1 and the maximum flow velocity was 8.2 mm/s; (b) the flow rate in the main channel was 50 nL min−1 and the maximum flow velocity was 16.4 mm/s; and (c) the flow rate in the main channel was 100 nL·min−1 and the maximum flow velocity was 32.5 mm/s.
Micromachines 04 00414 g002
Figure 3. Trapping efficiency in cellcomb microfluidic system. (a) Percentage of occupied pockets with two experimentally adjusted cell concentrations. Results indicate that by changing the cell density from OD = 0.1 to OD = 0.3, trapping efficiency increases significantly; (b) at lower cell density (OD = 0.1) single cells occupy 60% of the traps; and (c) in higher cell concentration (OD = 0.3) multiple cells are trapped in ca. 80% of the pockets. Scale bar is 10 μm.
Micromachines 04 00414 g003
The prepared cell syringes were connected to the inlets “b” and “c” and cells were loaded into the device by several fast pulses of the syringe pumps. As control, we first monitored the cells under the normal condition while YNB was flowed over the trapped cells for 45 min. YNB was infused from inlet “a” in the main channel and the trapping area was scanned and imaged as described earlier. Our data showed no Hsp104-GFP redistribution (aggregate formation) under this experiment condition. To investigate the effect of different arsenite flow rates on the single yeast cells we defined a scenario where we performed separate experiments in separate microfluidic devices. We modulated the stimulus flow rates in the main channel from 100 to 50 nL min−1 and 25 nL min−1 as high, moderate, and low flow rates, respectively. In each case, the cells were exposed to the final concentration of 0.5 mM sodium arsenite. Interestingly, we found that both the time of aggregate formation and the number of aggregates in the studied cells were affected by the change of the flow rates. Our data clearly showed that when the flow rate was decreased from 100 to 25 nL min−1 Hsp104-GFP aggregates appeared earlier and the total number of induced aggregates increased significantly. The uptake of arsenite in the presence of glucose into the yeast cells is mediated by a plasma membrane protein, Fps1 [36]. Fps1 is an aquaglyceroporin and facilitates passive diffusion of arsenite down the concentration gradient into the yeast cells [37,38]. Therefore, it is expected that arsenite passive diffusion occurs more efficiently in the condition of lower flow rate in which cells are in closer and longer contact with the arsenite molecules. Figure 4 demonstrates the comparison of the mean number of aggregates per cell for the three different arsenite flow rates. The values were obtained by averaging the total number of aggregates over the total number of trapped viable cells. Total numbers of aggregates were counted separately in all occupied segments of the device for both the first and last time points. As described earlier in microfluidic system operation, images from subsequent trapping segments were acquired in 30 s time intervals from the adjacent segments. Each imaging time point we have referred to, consisted of images for all occupied segments during one whole scanning of the trapping zone. For example the data shown for the 25 nL min−1 arsenite flow rate was obtained for 12 occupied segments, thus, the first time-point cluster included images taken at time points t = 0–5.5 min. The final time-point cluster included images at time points t = 38–44 min. The ratios are shown for the first and the final time-point clusters of each experiment (Figure 4).
Figure 4. Effect of the flow rate modulation on arsenite uptake by yeast cells in the microfluidic system. Three different flow rates of 25, 50 and 100 nL min−1 were investigated. To determine the arsenite exposure effect on relocalization of the Hsp 104-GFP protein and for the sake of comparison “number of aggregates per cell” measure was calculated in the three different cases. The number of aggregates/cell values in the first imaging time-point cluster (when the arsenite treatment is initiated) are 0.06, 0.04 and 0.035 while these values in the last imaging time-point cluster increase to 2.13, 1.24 and 0.45 for the 25, 50 and 100 nL·min−1 flow rates, respectively (44 min of arsenite treatment).
Micromachines 04 00414 g004
Localization of Hsp104-GFP is demonstrated in one field of view of the device under the 25 nL min−1 flow rate condition. As seen in Figure 5, the number of aggregates increased during the experiment time.
In order to show the stochasticicity in the behavior of the individual cells we used software, “Tableau” (Tableau Software Inc., Seattle, WA, USA) to plot the single-cell data. We chose the data from the experiment with the 25 nL min−1 arsenite flow rate where we got the maximum number of aggregates in the cells. Total number of viable trapped cells was 312 at the beginning of the experiment and 334 at the final time point (new buds were considered in cell counting). We demonstrated the single-cell data for three time-point clusters of the experiment with the most significant changes observed:
The initial time-point cluster (time points t = 0–5.5 min), the middle time-point cluster (time points t = 19–24.5 min), and the final time-point cluster (time points t = 38–44 min).
Figure 5. Trapped cells were exposed to the 25 nL min−1 flow rate of arsenite. (a) Bright field microscope image of one trapping segment; (b) first fluorescence image of the segment at the treatment initiation at t = 60 s; images (cf) were taken from the same field of view at different time points with 6-minute time intervals; image (f) was the last image taken at the final time point. The increase in the number of aggregates is clearly shown in the image sequence. The image sequence at the bottom from the same image series (bf) shows the aggregate formation for the cells trapped in one of the pockets [pocket in image (a) inside the white rectangle].
Micromachines 04 00414 g005
Results are illustrated in Figure 6, with the three time-point clusters being separated by solid black lines. Data is shown for all 12 occupied segments of the device. To increase the readability of the data, individual cells are grouped together based on the number of aggregates. The color bars in the figure denote the percentage out of all trapped cells in each segment having a certain number of aggregates. Monitoring the cellular responses in time revealed that the formation of aggregates in individual cells followed a totally random pattern with some of the cells being disturbed drastically while other groups showing a trivial affection or not responding to the treatment at all. Data also clearly showed an increasing trend in the number of aggregates with time.
Figure 6. Single-cell responses to the arsenite stress under the 25 nL min−1 flow rate condition. Results represent the formation of Hsp 104-GFP aggregates in individual cells in three significant time-point clusters during the experiment. The time-point clusters (ac) are separated by black solid lines. A clear increase in the number of aggregates under the influence of the treatment was observed in exposed cells. The color code designates the number of aggregates per cell. Color bars in the figure denote the percentage out of all trapped cells in each segment having a certain number of aggregates. For instance, in segment 3, cluster (a), around 8% of the cells have one, 5% have two and the rest show no aggregates. In cluster (b) these values increase to 10.3% of the cells with one, 8% with two, 2.6% with four and the rest with zero aggregates. Number of aggregates per cells in cluster (c) climbs up to 24.4% with one, 17% with two, 17% with three, 14.6% with four, 2.5% with five, 5% with six, and the rest with no aggregates.
Micromachines 04 00414 g006

4.4. Discussion

The microfluidic platform that we presented in this work was employed to obtain high quality quantitative data on the single cell basis. The special design of the device allowed for trapping hundreds of cells inside V-shaped pockets that were fully covered and exposed to selected stress substances. The flow behavior inside the microchannels was simulated to ensure the predicted functionality of the device, especially to discover the direction of the flow at the confinement openings of the trapping zone. Simulation results indicated that a jet flow was created at the 2-μm wide confinement openings of the device, which could act as the force to trap and immobilize the cells inside the pockets. We showed, as an example, that how the arsenite flow rate modulation could affect the substance uptake by yeast cells. We monitored the relocalization of GFP-tagged Hsp104 protein in individual yeast cells upon continuous exposure to sodium arsenite. Intracellular responses were followed by means of bright field and fluorescence time-lapse microscopy. The data revealed that the arsenite uptake increased noticeably at lower flow rates of the stimulus. This can be attributed to a more efficient passive diffusion of arsenite molecules due to the closer and longer contact with the cells. The experiment time was set to 45 min in this case as the clear effect of the arsenite on Hsp104-GFP aggregate formation was observed in this time period. However the system can be used to conduct long-term experiments for hours or days depending on the specific requirements of the study. It is also worth mentioning that the automatic flow rate control, image acquisition, and microscope stage drive provides a sustainable experimental platform, which is robust, easy to use, and flexible for different experimental conditions. The 60 μm-wide side channels were mainly intended for creating the low-pressure region in the device to drag the floating cells into the traps. Buds smaller than the size of the confinement openings passed to the side channels and were guided to the waste chambers of the device. Additionally, the platform can be used for studying cell-to-cell communication events, thanks to the special design of the device. The two side channels can be employed to reach the trapped cells from the confinement openings and locally expose the cells to the selected stimuli. This way it will be possible to follow the intercellular signaling amongst the cell clusters sitting tightly together.
The device was sensitive to the flow rates in the side channels and flow variations were automatically controlled to maintain the symmetrical behavior of the device. The main advantage of the device for the cell-loading step is that no precise flow rate control is needed. Cells can be infused into the channels by rapid pulses of the syringe pump in less than 30 s. However the density of the cell suspension had to be controlled carefully as it played a major role in the cell-loading step. In order to capture single yeast cells in each pocket we diluted the cell suspension with the initial OD of 0.6, 6 times and infused the device. At this concentration, single cells occupied nearly 60% (±3%) of the pockets. To achieve the full trapping capacity of the device we increased the cell density and managed to successfully fill ca. 80% (±4%) of the traps with one to six cells without blocking the main channel at the OD = 0.3. High cell densities (OD > 0.6) blocked the 20-μm-wide mid-channel of the device and a huge mass of cells could be flushed out of the channel with difficulty. The empty trapping sites were found at the downstream of the device. Cells tended to pass the pockets and continue with the flow towards the outlets. We attribute this phenomenon to the pressure drop along the main channel, which leads to the change in the behavior of the flow inside the V-shaped pockets and results in a decreased fraction of the flow passing through the traps. Prior to the experiments or to reuse the system, microchannels were flushed and rinsed with buffer solution or YNB via the side channels. Rapid flushing pulses in the side channels effectively removed the dirt and bubbles in all channels. The height of the system was adjusted to be in the order of the average diameter of a single yeast cell. This feature of the device was of a great significance since it prevented the trapped cells from assembling on top of each other and a clear fluorescent read out signal could be detected from a single layer of cells.

5. Conclusions

Here, we present an application-specific microfluidic platform, cellcomb, for high-throughput single-cell applications. The device is intended for cell capturing, chemical exposure and time-lapse imaging. Cell capturing mechanism is based on hydrodynamic forces imposed on suspended cells inside the microchannels, resulting in cell immobilization in the tailored trapping zone of the device. The trapping zone consists of 104 V-shaped pockets with the dimensions of 10 μm × 10 μm and confinement openings with the width of 2 μm. The pockets are designed to accommodate up to six yeast cells with the average diameter of 4 μm. In a fully operational device, 624 cells can be trapped and undergo various extracellular environmental changes and chemical exposures. Dynamic cellular responses, such as specific reporter protein migrations or aggregations, can be followed over time by bright field and fluorescence microscopy imaging. Compared to previous designs, our new platform allows for conducting single-cell experiments with noticeably increased number of cells, providing valuable statistical data with a high spatiotemporal resolution. We have exploited the power of this system to investigate the effect of flow rate modulations on arsenite uptake in Saccharomyces cerevisiae cells. By experimentally optimizing the flow rates we demonstrated that arsenite uptake by the cells increased significantly as we lowered the flow rate from 100 to 25 nL min−1. We foresee that this robust, easy-to-operate, and flexible platform will be used for several applications. Cell signaling pathways are particularly of a great interest and this device can provide the opportunity of experimentally studying their modes of function and regulation. Intercellular communication events are also considered a suitable target area where our system can offer a great deal of opportunities. Another point of strength is that the device is adaptable for different cell types and can be employed, for instance, to run experiments with mammalian cells. From the initial tests with NIH/3T3 cells we expect that the device can be used for long-term on-chip cell proliferation under the controlled gas and temperature conditions. Subsequent investigations, such as drug screening in cancer cells or studying signaling pathways can be performed accordingly.

Acknowledgments

Authors acknowledge the financial support from Swedish Research Council (VR), Carl Trygger foundation for Scientific Research and the European Commission program UNICELLSYS.
We would like to acknowledge Markus J. Tamás, Stefan Hohmann and Peter Dahl for kindly providing the yeast cell strain. We thank Fraunhofer Chalmers Research Center Industrial Mathematics (Gothenburg, Sweden) for the Cellstat software. We also thank Martin Adiels (Mathematical Sciences, Chalmers University of Technology, Gothenburg, Sweden) for the precious assistance with organizing and demonstration of single-cell data in “Tableau” software.

Conflicts of Interest

The authors declare no conflict of interest.

References

  1. Figeys, D.; Pinto, D. Lab-on-a-chip: A revolution in biological and medical sciences. Anal. Chem. 2000, 72, 330A–335A. [Google Scholar]
  2. Haeberle, S.; Zengerle, R. Microfluidic platforms for lab-on-a-chip applications. Lab Chip 2007, 7, 1094–1110. [Google Scholar] [CrossRef]
  3. Squires, T.M.; Quake, S.R. Microfluidics: Fluid physics at the nanoliter scale. Rev. Mod. Phys. 2005, 77, 977–1026. [Google Scholar] [CrossRef]
  4. Elowitz, M.B.; Levine, A.J.; Siggia, E.D.; Swain, P.S. Stochastic gene expression in a single cell. Sci. Signal. 2002, 297, 1183–1186. [Google Scholar]
  5. Kærn, M.; Elston, T.C.; Blake, W.J.; Collins, J.J. Stochasticity in gene expression: From theories to phenotypes. Nat. Rev. Genet. 2005, 6, 451–464. [Google Scholar] [CrossRef]
  6. Burnette, W.N. “Western blotting”: Electrophoretic transfer of proteins from sodium dodecyl sulfate-polyacrylamide gels to unmodified nitrocellulose and radiographic detection with antibody and radioiodinated protein a. Anal. Biochem. 1981, 112, 195–203. [Google Scholar] [CrossRef]
  7. Dorak, M.T. Real-Time PCR; Taylor & Francis: New York, NY, USA, 2006. [Google Scholar]
  8. Svahn, H.A.; van den Berg, A. Single cells or large populations? Lab Chip 2007, 7, 544–546. [Google Scholar] [CrossRef]
  9. Breslauer, D.N.; Lee, P.J.; Lee, L.P. Microfluidics-based systems biology. Mol. Biosyst. 2006, 2, 97–112. [Google Scholar] [CrossRef]
  10. Muzzey, D.; van Oudenaarden, A. Quantitative time-lapse fluorescence microscopy in single cells. Ann. Rev. Cell Dev. Biol. 2009, 25, 301–327. [Google Scholar] [CrossRef]
  11. Jen, C.-P.; Hsiao, J.-H.; Maslov, N.A. Single-cell chemical lysis on microfluidic chips with arrays of microwells. Sensors 2011, 12, 347–358. [Google Scholar] [CrossRef]
  12. Rettig, J.R.; Folch, A. Large-scale single-cell trapping and imaging using microwell arrays. Anal. Chem. 2005, 77, 5628–5634. [Google Scholar] [CrossRef]
  13. Yamamura, S.; Kishi, H.; Tokimitsu, Y.; Kondo, S.; Honda, R.; Rao, S.R.; Omori, M.; Tamiya, E.; Muraguchi, A. Single-cell microarray for analyzing cellular response. Anal. Chem. 2005, 77, 8050–8056. [Google Scholar] [CrossRef]
  14. Irimia, D.; Toner, M. Cell handling using microstructured membranes. Lab Chip 2006, 6, 345–352. [Google Scholar] [CrossRef]
  15. Wheeler, A.R.; Throndset, W.R.; Whelan, R.J.; Leach, A.M.; Zare, R.N.; Liao, Y.H.; Farrell, K.; Manger, I.D.; Daridon, A. Microfluidic device for single-cell analysis. Anal. Chem. 2003, 75, 3581–3586. [Google Scholar] [CrossRef]
  16. Ashkin, A.; Dziedzic, J.; Yamane, T. Optical trapping and manipulation of single cells using infrared laser beams. Nature 1987, 330, 769–771. [Google Scholar] [CrossRef]
  17. Eriksson, E.; Scrimgeour, J.; Graneli, A.; Ramser, K.; Wellander, R.; Enger, J.; Hanstorp, D.; Goksör, M. Optical manipulation and microfluidics for studies of single cell dynamics. J. Opt. A Pure Appl. Opt. 2007, 9, S113. [Google Scholar] [CrossRef]
  18. Ramser, K.; Hanstorp, D. Optical manipulation for single-cell studies. J. Biophotonics 2010, 3, 187–206. [Google Scholar] [CrossRef]
  19. Taff, B.M.; Voldman, J. A scalable addressable positive-dielectrophoretic cell-sorting array. Anal. Chem. 2005, 77, 7976–7983. [Google Scholar] [CrossRef]
  20. Gascoyne, P.; Mahidol, C.; Ruchirawat, M.; Satayavivad, J.; Watcharasit, P.; Becker, F.F. Microsample preparation by dielectrophoresis: Isolation of malaria. Lab Chip 2002, 2, 70–75. [Google Scholar] [CrossRef]
  21. Gagnon, Z.R. Cellular dielectrophoresis: Applications to the characterization, manipulation, separation and patterning of cells. Electrophoresis 2011, 32, 2466–2487. [Google Scholar] [CrossRef]
  22. Falconnet, D.; Csucs, G.; Michelle Grandin, H.; Textor, M. Surface engineering approaches to micropattern surfaces for cell-based assays. Biomaterials 2006, 27, 3044–3063. [Google Scholar] [CrossRef]
  23. Lim, J.Y.; Donahue, H.J. Cell sensing and response to micro-and nanostructured surfaces produced by chemical and topographic patterning. Tissue Eng. 2007, 13, 1879–1891. [Google Scholar] [CrossRef]
  24. Di Carlo, D.; Wu, L.Y.; Lee, L.P. Dynamic single cell culture array. Lab Chip 2006, 6, 1445–1449. [Google Scholar] [CrossRef]
  25. Zhu, Z.; Frey, O.; Ottoz, D.S.; Rudolf, F.; Hierlemann, A. Microfluidic single-cell cultivation chip with controllable immobilization and selective release of yeast cells. Lab Chip 2012, 12, 906–915. [Google Scholar] [CrossRef]
  26. Van den Brink, F.T.; Gool, E.; Frimat, J.P.; Bomer, J.; van den Berg, A.; le Gac, S. Parallel single-cell analysis microfluidic platform. Electrophoresis 2011, 32, 3094–3100. [Google Scholar] [CrossRef]
  27. Tan, W.-H.; Takeuchi, S. A trap-and-release integrated microfluidic system for dynamic microarray applications. Proc. Natl. Acad. Sci. USA 2007, 104, 1146–1151. [Google Scholar] [CrossRef]
  28. Kobel, S.; Valero, A.; Latt, J.; Renaud, P.; Lutolf, M. Optimization of microfluidic single cell trapping for long-term on-chip culture. Lab Chip 2010, 10, 857–863. [Google Scholar] [CrossRef]
  29. Chung, K.; Rivet, C.A.; Kemp, M.L.; Lu, H. Imaging single-cell signaling dynamics with a deterministic high-density single-cell trap array. Anal. Chem. 2011, 83, 7044–7052. [Google Scholar] [CrossRef]
  30. Eriksson, E.; Enger, J.; Nordlander, B.; Erjavec, N.; Ramser, K.; Goksör, M.; Hohmann, S.; Nyström, T.; Hanstorp, D. A microfluidic system in combination with optical tweezers for analyzing rapid and reversible cytological alterations in single cells upon environmental changes. Lab Chip 2006, 7, 71–76. [Google Scholar]
  31. Eriksson, E.; Sott, K.; Lundqvist, F.; Sveningsson, M.; Scrimgeour, J.; Hanstorp, D.; Goksör, M.; Granéli, A. A microfluidic device for reversible environmental changes around single cells using optical tweezers for cell selection and positioning. Lab Chip 2010, 10, 617–625. [Google Scholar] [CrossRef]
  32. Jacobson, T.; Navarrete, C.; Sharma, S.K.; Sideri, T.C.; Ibstedt, S.; Priya, S.; Grant, C.M.; Christen, P.; Goloubinoff, P.; Tamás, M.J. Arsenite interferes with protein folding and triggers formation of protein aggregates in yeast. J. Cell Sci. 2012, 125, 5073–5083. [Google Scholar] [CrossRef] [Green Version]
  33. Tan, S.H.; Nguyen, N.-T.; Chua, Y.C.; Kang, T.G. Oxygen plasma treatment for reducing hydrophobicity of a sealed polydimethylsiloxane microchannel. Biomicrofluidics 2010, 4, 32204. [Google Scholar] [CrossRef]
  34. Sott, K.; Eriksson, E.; Goksör, M. Acquisition of Single Cell Data in an Optical Microscope. In Lab on a Chip Technology: Biomolecular Separation and Analysis; Caister Academic Press: Norfolk, UK, 2009; pp. 151–166. [Google Scholar]
  35. Smedh, M.; Beck, C.; Sott, K.; Goksör, M. Cellstress-Open Source Image Analysis Program for Single-Cell Analysis. In Proceedings of SPIE 7762, Optical Trapping and Optical Micromanipulation VII, 77622N, San Diego, CA, USA, 27 August 2010; International Society for Optics and Photonics: Bellingham, WA, USA, 2010. [Google Scholar] [CrossRef]
  36. Wysocki, R.; Chéry, C.C.; Wawrzycka, D.; van Hulle, M.; Cornelis, R.; Thevelein, J.M.; Tamás, M.J. The glycerol channel fps1p mediates the uptake of arsenite and antimonite in Saccharomyces cerevisiae. Mol. Microbiol. 2001, 40, 1391–1401. [Google Scholar] [CrossRef]
  37. Tamás, M.J.; Karlgren, S.; Bill, R.M.; Hedfalk, K.; Allegri, L.; Ferreira, M.; Thevelein, J.M.; Rydström, J.; Mullins, J.G.; Hohmann, S. A short regulatory domain restricts glycerol transport through yeast fps1p. J. Biol. Chem. 2003, 278, 6337–6345. [Google Scholar] [CrossRef]
  38. Maciaszczyk-Dziubinska, E.; Migdal, I.; Migocka, M.; Bocer, T.; Wysocki, R. The yeast aquaglyceroporin Fps1p is a bidirectional arsenite channel. FEBS Lett. 2010, 584, 726–732. [Google Scholar] [CrossRef]

