Article

Optimizing Polymer Lab-on-Chip Platforms for Ultrasonic Manipulation: Influence of the Substrate

1
Group of Ultrasonic Resonators, Institute of Physical Technologies and Information, Spanish National Research Council CSIC, Serrano 144, 28006 Madrid, Spain
2
Department of Microsystems, IKERLAN, Jose Maria Arizmendiarreta 2, 20500 Mondragón, Spain
3
Group of Microfludics, Politechnical University of Mondragón, Goiru Kalea, 20500 Mondragón, Spain
4
Group of Molecular Biology, Fundación Hospital General Universitario de Elche, Camino de la Almazara 11, 03203 Elche, Alicante, Spain
*
Author to whom correspondence should be addressed.
Micromachines 2015, 6(5), 574-591; https://doi.org/10.3390/mi6050574
Submission received: 10 February 2015 / Revised: 28 April 2015 / Accepted: 29 April 2015 / Published: 7 May 2015
(This article belongs to the Collection Lab-on-a-Chip)

Abstract

:
The choice of substrate material in a chip that combines ultrasound with microfluidics for handling biological and synthetic microparticles can have a profound effect on the performance of the device. This is due to the high surface-to-volume ratio that exists within such small structures and acquires particular relevance in polymer-based resonators with 3D standing waves. This paper presents three chips developed to perform particle flow-through separation by ultrasound based on a polymeric SU-8 layer containing channelization over three different substrates: Polymethyl methacrylate (PMMA); Pyrex; and a cracked PMMA composite-like structure. Through direct observations of polystyrene microbeads inside the channel, the three checked chips exhibit their potential as disposable continuous concentration devices with different spatial pressure patterns at frequencies of resonance close to 1 Mhz. Chips with Pyrex and cracked PMMA substrates show restrictions on the number of pressure nodes established in the channel associated with the inhibition of 3D modes in the solid structure. The glass-substrate chip presents some advantages associated with lower energy requirements to collect particles. According to the results, the use of polymer-based chips with rigid substrates can be advantageous for applications that require short treatment times (clinical tests handling human samples) and low-cost fabrication.

1. Introduction

This paper presents an experimental study of the influence that selected materials can exert as chip substrates to perform ultrasonic particle manipulation on flowing samples.
Combining microfluidic systems with different readout techniques has produced powerful tools in the emerging area of the on-chip controlled handling and monitoring of biological and synthetic microparticles and nanoparticles, with especially great impact on biotechnology and environmental topics, such as hydrodynamic forces [1,2,3,4,5,6,7,8,9,10,11,12,13,14,15,16,17,18,19,20], optical methods [21,22], electric fields and dielectrophoresis [23,24,25,26,27] or acoustic fields [28,29,30,31,32,33,34,35,36,37,38,39,40,41,42,43,44,45,46,47,48], either isolated or combined with other fields.
It is apparent that the choice of substrate material can have a profound effect on the eventual performance of a microfluidic device, due mostly to the high surface-to-volume ratio that exists within such small structures. In particular, apparent effects could be expected in ultrasonic resonators that combine acoustic waves with microfluidics for sensing or actuation applications. In these devices the effect is dominated by the acoustic properties (density and impedance) of the materials in combination with the channel geometries of the device.
The selection of the substrate has not been a focus of interest in the development of most of these devices, mostly built up on silicon, metal or glass substrates, based in the concept of cavities strongly resonant with highly rigid sidewalls, where the resonance can be easily excited even with a poorly coupled ultrasonic actuator. However, their use for rapid prototyping is strongly limited due to the need for clean room equipment and facilities and the high cost involved in processing and the material itself. Additionally, glass micromachining processes are technically demanding and time consuming. For high throughput applications, the fabrication processes should be simple, cost-effective and enable mass production.
Polymeric materials are targeting markets that need low cost disposable microfluidic analytical chips with enhanced functionality and decreased dimensions. They are the focus of a growing community of researchers from academia and industry. In particular, polymeric micro-resonators actuated by ultrasounds offer a real alternative to glass and silicon chips for prototyping micro-separators, as demonstrated by the authors of this work for particle separation [45] and tumour cell extraction from peripheral blood samples [46] and other authors also tested in later experiments [47,48]. These microfluidic devices admit structural changes into their designs for their performance optimization.
This is exactly the aim of the work presented in this paper. Three chips with different substrates have been developed and tested at diverse frequencies close to 1 MHz to find optimal resonance conditions to perform particle separation according to their different structural properties and volume/surface ratios.
Optimal acoustic conditions refer to those frequencies that generate acoustic pressure nodes within the channel where the highest number of particles collect to be extracted and separated from their host sample path. These frequencies provide the highest efficiency levels of particle separation with minimal energy requirements for the particle collection.
In these devices the whole structure is involved in their resonances. The substrate is at least two times the thickness of the polymeric upper layer containing the channelization. Accordingly, the choice of a suitable substrate material should undoubtedly play a large role in the acoustic performance, with important considerations which should include acoustic compatibility to perform suitable resonance conditions, ease and reproducibility.
3D standing waves assumed in these structures at different frequencies are expected to provide different acoustic pressure patterns inside the channel of treatment where the samples flow.
This paper presents three chips with polymethyl methacrylate (PMMA), Pyrex and a cracked PMMA composite-like structure used as substrates under study. Direct observations of the particles inside the channel of the three chips under the acoustic application have been made for the analysis. Different particle behaviors following spatial pressure patterns are expected in the channel of treatment of the chips, which should be generated by specific vibration 3D modes established within each polymeric structure at each frequency of resonance close to 1 MHz.
The working principle of the acoustic technique is based on the action of a radiation force acoustically induced on the individual particles in suspension during the application of the ultrasounds. It is a hydrodynamic steady force produced by a nonlinear interaction between the incident and scattered acoustic waves acting on each single particle through the liquid medium.
Equation (1) defines the radiation force FR exerted on a particle with density ρp, compressibility βp and a volume Vp much smaller than the wavelength λ of the acoustic incident wave applied with a pressure amplitude P0:
F R = π P 0 2 V p β 0 2 λ φ sin ( 4 π x λ )
where φ = 5 ρ p 2 ρ 0 2 ρ p + ρ 0 β p β 0 is known as the acoustic contrast factor, ρ0 and compressibility β0 the density and compressibility coefficient of the liquid phase of the suspension and “x” the distance from the particle to the nearest node of pressure. This expression was derived by Gor’kov [49] in 1962 for a plane standing wave. According to this equation, the particles collect in parallel bands perpendicular to the sound wave direction separated by a half wavelength distance. The sign of ϕ indicates the motion of the particles either toward the nodes (ϕ > 0) or to the antinodes in the standing wave (ϕ < 0).
This force exploits difference of size, density or compressibility between different particles to perform selective drift motion among them. It allows discriminated effects associated to slightly different sized particles, even of few microns. The time required by the particles to reach the pressure node or antinode from any distance inside the resonating cavity where the standing wave is established and can be numerically derived from Equation (1) as a function of all the parameters involved in this equation.
To calculate the motion of a particle of mass mp, the force terms are summed to give accelerations along the two dimensions of the channel cross section:
d u p x d t = F x m p = F D x + F R x m p
d u p y d t = F y m p = F D y + F R y + F B m p
where u p x and u p y refer to the particle velocity components, FRx and FRy are the radiation force components acoustically induced on the x and y-dimensions of the resonant cavity, F D x and F D y the fluid drag forces and FB the buoyancy force exerted opposite to the gravitational force. F D x and F D y are defined along the x and y-directions respectively as:
F D x = 6 π η R p ( u p x u f x )
F D y = 6 π η R p ( u p y u f y )
for low Reynolds numbers Re < 0.2, with η the dynamic viscosity coefficient and u f x and u f y are the x and y-components of the laminar flow velocity of the fluid associated to the parabolic profile within a microfluidic channel:
u f x = 6 U ¯ h 2 ( h y y 2 )
u f y = 6 U ¯ w 2 ( w x x 2 )
being “h” and “w” the channel height and width respectively which depend on the x or y-position within the channel.
A numerical resolution of Equations (2a) and (2b) provides particle trajectories from any distance to the nearest pressure node and the time required to reach the pressure node, depending on the different parameters involved the equations of particle motion. The 4th order Runge-Kutta method is a suitable tool for the numerical solver.
A suitable combination of the channel length and flow velocity keeps the particles circulating along the channel a long enough time to reach the pressure node from any distance. Higher flow rates elongate the drift particle trajectories, requiring longer channels to give enough time for the particles to reach the pressure node. This implies a compromise between hydrodynamic and acoustic conditions (flow rate/frequency and pressure amplitude) taking into account the particle properties of the particles together with those of the host fluid (size, density and compressibility ratios as well as the fluid viscosity).

2. Experimental Section

Three different chips with different substrates were developed from a first polymeric prototype of the literature developed in 2010 by the authors [45] and tested to determine their different ultrasonic actuation on flowing samples. The new devices incorporate common geometrical and structural modifications concerning to the channel/chip lengths, variations in the geometry and number of inlets and outlet junctions, as well as the introduction of a closed cavity with air parallel to the channel of treatment to prevent undesired vibrations within the chip structure, described in the following.

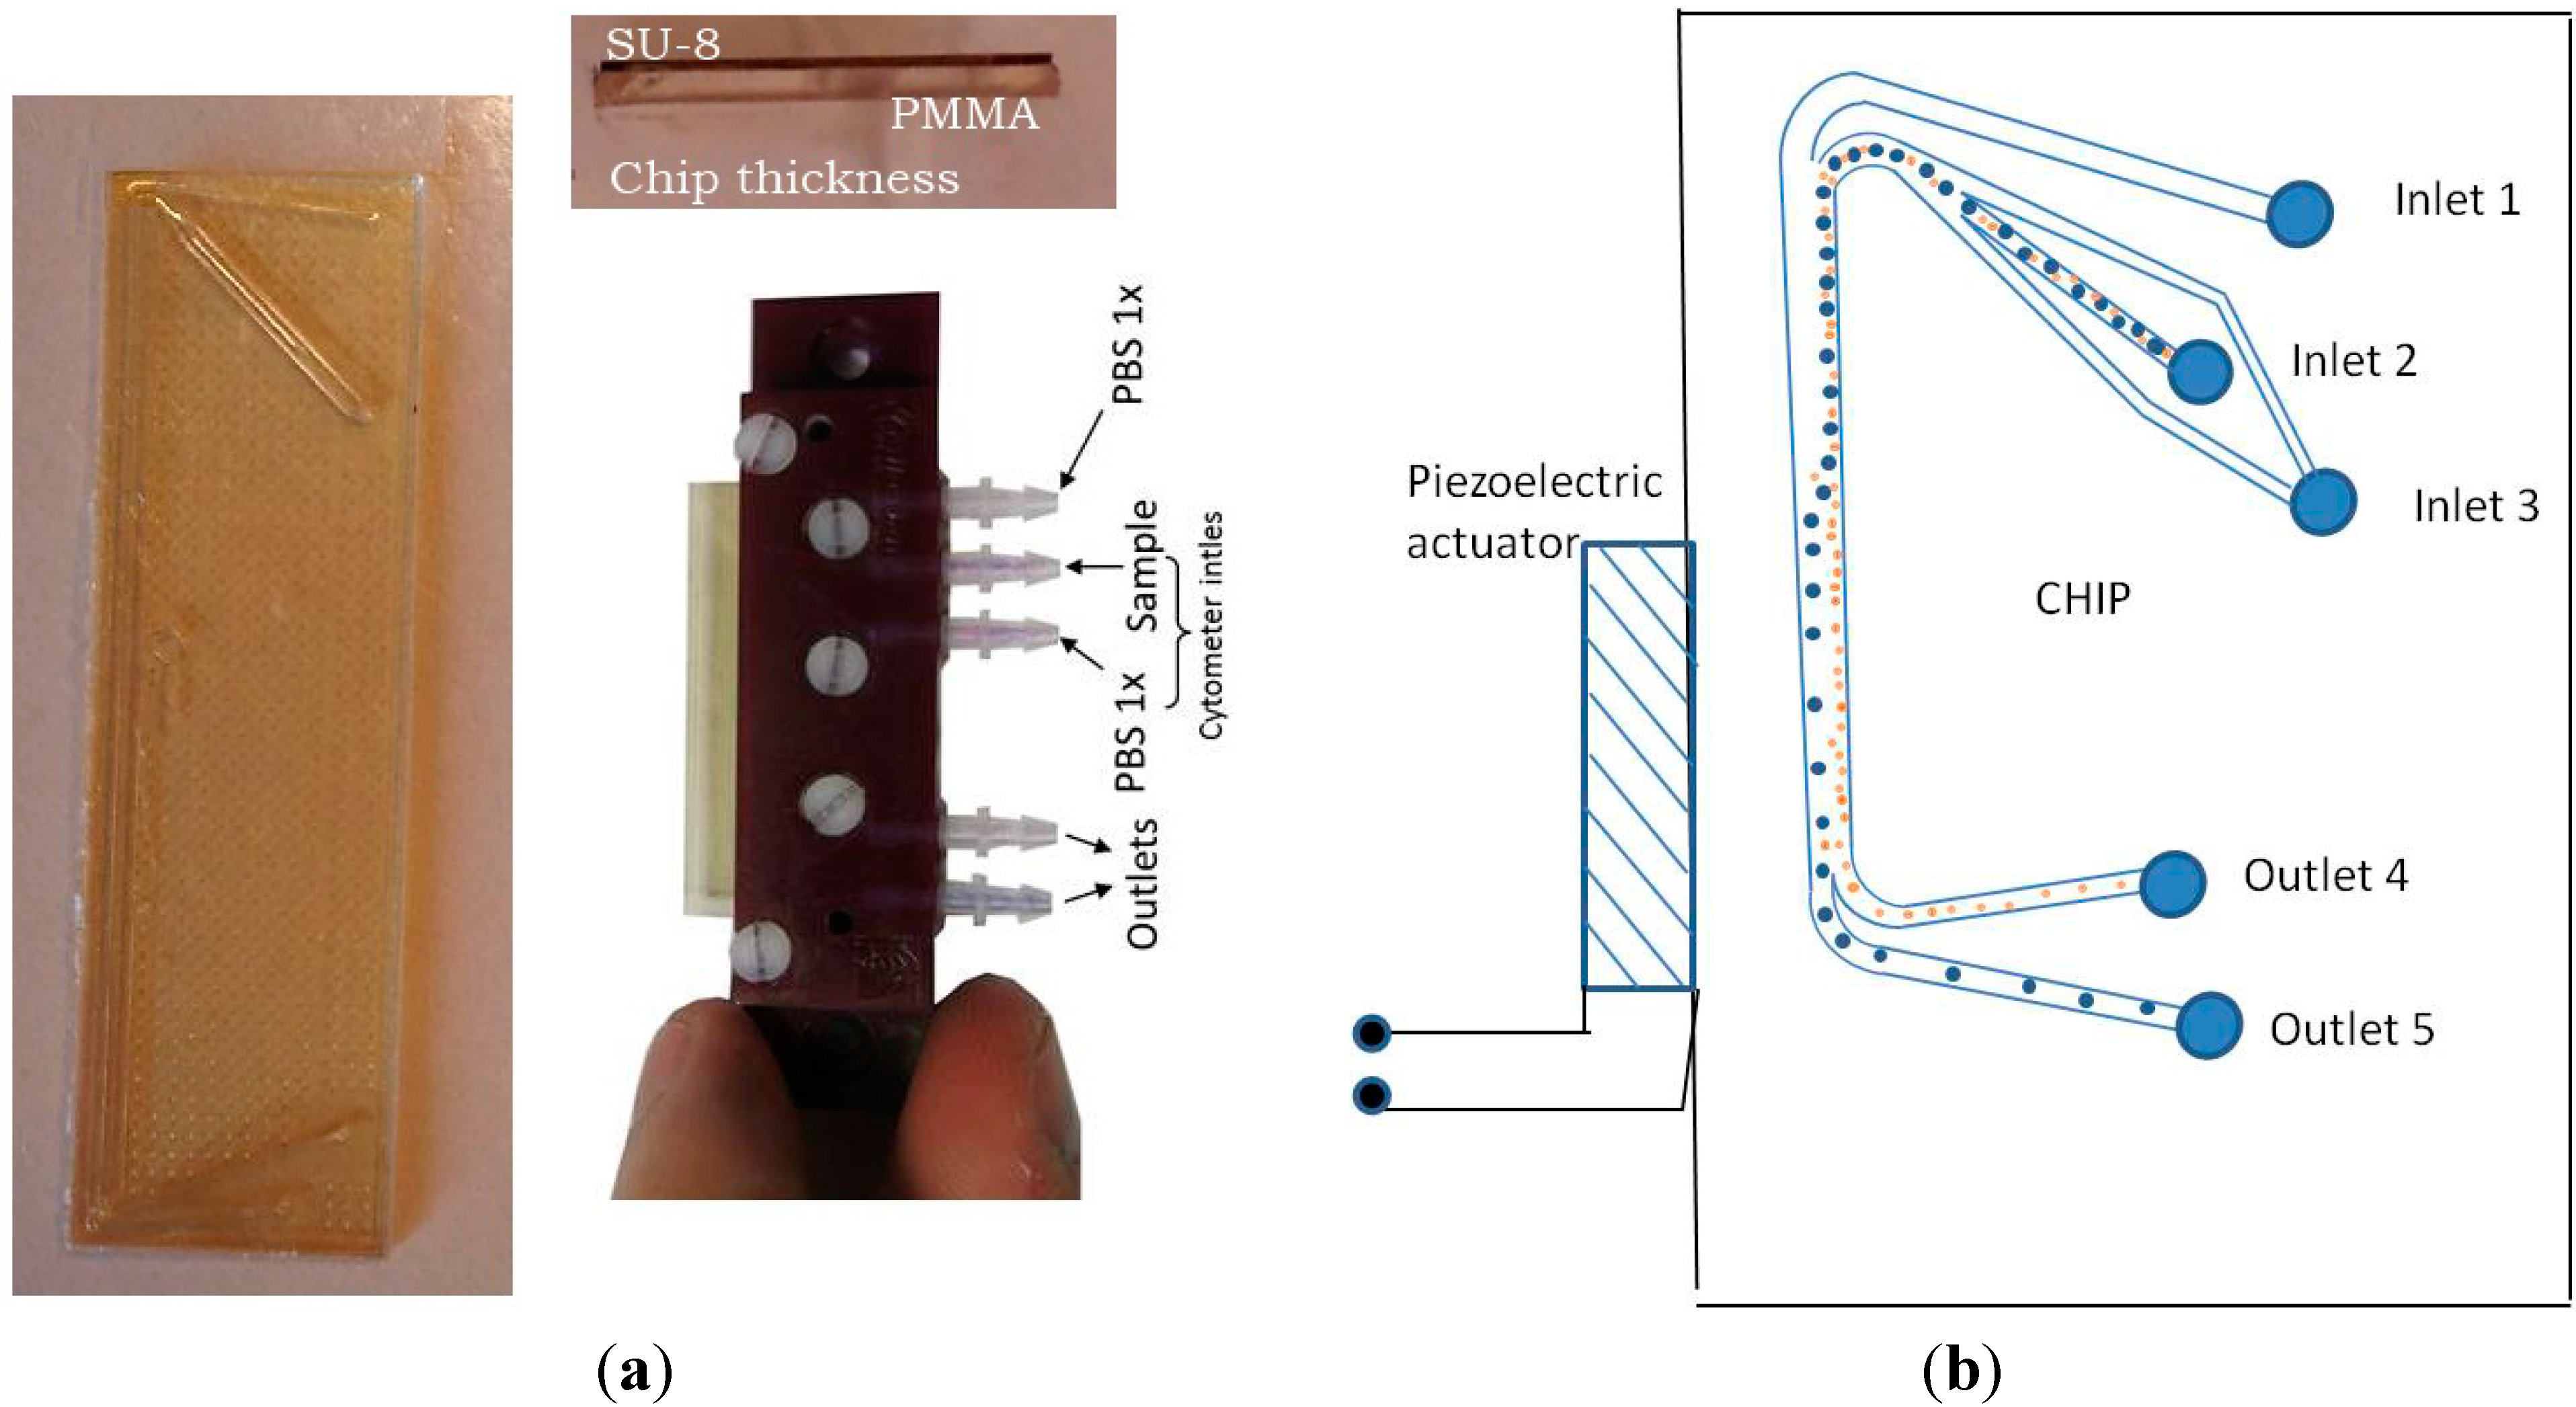
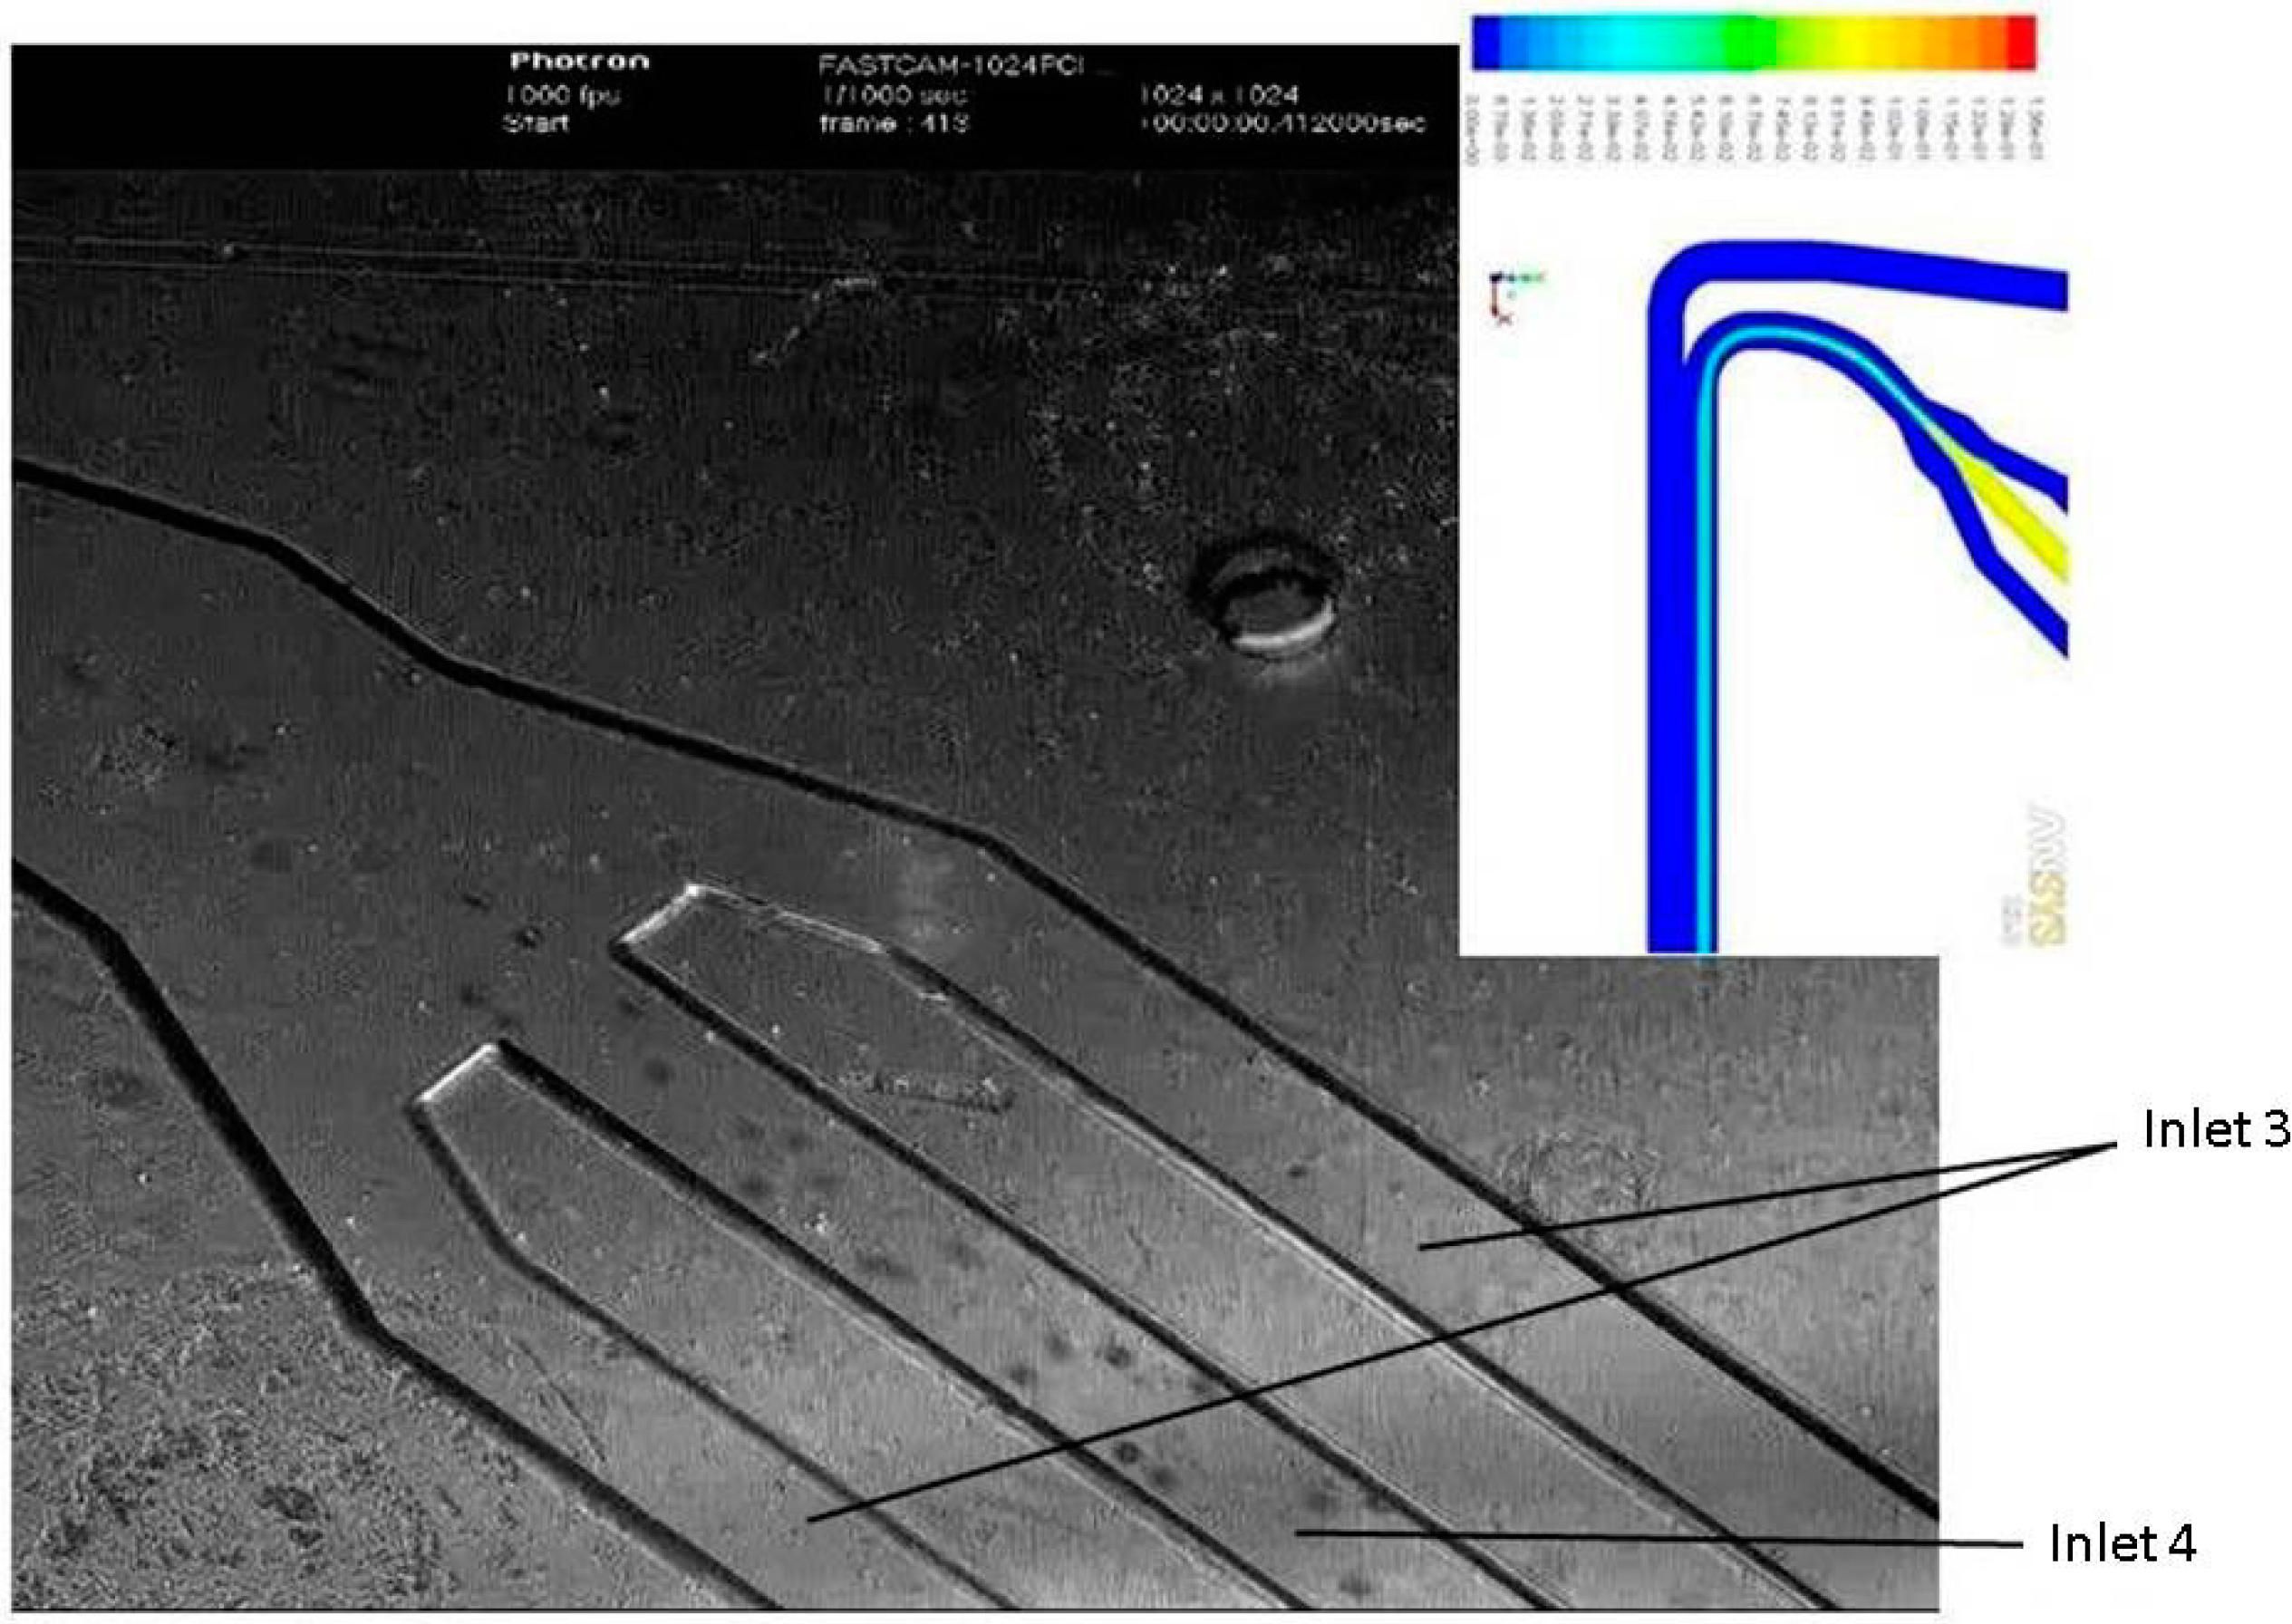
Acoustophoresis Chip

The three chips were made up of a rectangular SU-8 piece (10 mm × 32 mm) with a thickness of 300 µm containing the channelization layered on a substrate of another material—PMMA, Pyrex and a composite-like structure made of regularly cracked PMMA, respectively—whose thickness was approximately three times that of the top layer. A significant percentage of the 3D standing waves are expected within the substrate, which should exert a noticeable influence on the pressure pattern established inside the channel. Different substrates were tested in this work to verify this assumption, not proved up to now with polymer-based resonators.
The basic design of these chips was based on another one previously published, developed by the authors to perform a mass transfer process on a parallel flow motion of the sample containing the target particles to be collected for their later separation and a collector fluid (Figure 1), as will be described in the following.
Figure 1. (a) Polymeric chip (SU-8 layered on a PMMA substrate) attached to a piezoelectric actuator (pz26 ceramic); (b) scheme of the chip whose actuation is based on a particle drift due to the acoustic radiation force toward the pressure node inside the channel of treatment; the target particles cross the fluid interface to collect within the collector fluid path.
Micromachines 06 00574 g001
The channel along which the samples flowed had a rectangular cross sectional surface (width w = 400 μm, depth h = 200 μm) in the three chips, something larger than λ/4 at the frequencies selected close to 1 MHz.
In the current designs, one of the inlets was replaced by a system of two concentric inlets to confine the sample containing the particles during their flow motion before the application of the acoustic field. Implementation of a cell prealignment system enhanced the discriminatory capacity of the device. The sample containing the particles was infused through the sample inlet 2 and hydrodynamically focused by the focusing buffer side from inlet 3. A detail of this part of the chip is shown in Figure 2.
Figure 2. Details of the hydrodynamic particle confinement setup incorporated to one of the inlets. The particles infused through inlet 2 become confined, surrounded by the buffer injected through the inlet 3. The resulting pre-aligned particles flow in parallel with buffer injected from inlet 1 along the channel of treatment.
Micromachines 06 00574 g002
Once it reached the inlet T-junction, the sample flowed while confined close to the right sidewall in parallel with the buffer injected through the left inlet 1, keeping the particles aligned along the channel of treatment (32 mm-length) and close to the right sidewall for the flow rates used in the experiments before the application of the ultrasounds, over 2 μL/min and below 200 μL/min.
At the end of the channel the flow is split in a 1:1 ratio between two outlets that allowed the extraction separated of the host sample and a fluid with the particles collected during the acoustic treatment (scheme of Figure 1b).
Uncontrolled streaming effects in the flow motion associated with the formation of vortices in the inlets/outlets junctions were prevented by replacing the square elbows of the first polymeric prototype with rounded corners.
The microchannel structures were etched in SU-8 using soft photolithography. This material was selected for its benefits in microfluidics [50,51]. It is a very viscous polymer, highly transparent in the ultraviolet region, which allows fabrication of relatively thick (hundreds of micrometers) structures with nearly vertical side walls. The high epoxy content promotes strong SU-8 adhesion to many types of substrates and makes the material highly sensitive to UV exposure. From a microfluidic point of view, it presents a strong adhesion to the substrate and chemical inertness of the SU-8. Different substrates were used to spin on this SU-8, both PMMA and Pyrex. A standard photolithography processing was described in Gonzalez et al. [45] for the chip with a PMMA substrate. When using the Pyrex substrate, similar protocols but different times and baking temperatures of SU-8 were employed. In this case another Pyrex wafer covered with a Kapton film was use as top wafer, over which a 40 μm thick layer of SU-8 was then spun and soft baked. Both Pyrex wafers were put into contact and heated up to 90 °C subjected to a pressure of 3 bar during 30 min. The low adherence between SU-8 and Kapton allowed a later Pyrex wafer lamination, releasing the chips for packaging and testing.
Table 1 shows key dimensions concerning to lengths and widths that are common to the three chips.
Table 1. Geometrical specifications of the three chips.
ChipChip lengthChannel lengthChannel widthChannel depthChip width
Rectangular Chip35 mm32.8 mm400 μm200 μm10 mm
The chips were activated by an ultrasonic actuator, a small piezoelectric ceramic Ferroperm pz26 of rectangular area (30 mm × 5 mm × 1.5 mm) resonant at 1 MHz glued to a lateral edge of the chip parallel to the channel. It was actuated using a function generator (Agilent 33220A, Agilent Technologies Inc., Santa Clara, CA, USA) equipped with a power amplifier (E&I RF linear broad Amplifier 240 L, Research Blvd. Rochester, NY, USA), and the voltage over each transducer was measured using an oscilloscope (Tektronix TDS 3034B, Tektronix UK Ltd., Bracknell, UK).
Different 3D standing waves were established within the substrates of the three chips every few Hertz within the range of frequencies considered between 800 kHz and 1200 kHz around a central value of 1 MHz defined by the thickness resonance of the piezoelectric element (tpz = 1.5 mm). These vibrations generated complex acoustic pressure patterns inside the channel of treatment, some of which included 2D-shape nodes parallel to the sidewalls within the path of the collector fluid, close to the left sidewall, strategically suitable to perform the particle separation processes. According to the well known fact that any discontinuity in a structure provides changes and partial inhibition of the established waves, the three chips incorporated a closed long air filled cavity parallel to the channel of treatment to produce wave reflections at the air-polymer interface based on the different impedances of both media. In it, uncontrolled vibrations established across the plastic structure beyond the area of interest could be partially inhibited.
Polystyrene microspheres with diameters of 6 and 20 μm respectively (Dynoseeds Co. TS20 and CA6 Microbeads AS, Skedsmokorset, Norway) were suspended in dilutions of deionized distilled water (Cv ~ 0.01%). These suspensions contained 50% of each size beads (Cv6 ~ 0.005% and Cv20 ~ 0.005%) for particle separation procedures.
Three syringes (ICO plus 3, Novico Médica, S.A., Barcelona, Spain) mounted on a syringe pump (Kd Scientific Syringe Pump, Holliston, MA, USA) infused 2 mL of particle-free buffer solution (distilled deionized water) to the 200 µm-width inlet 1. Two 1-mL syringes injected the particle-suspension and free buffer through the two 100 µm-width inlets inlet 2 and inlet 3, respectively, as shown in Figure 2, which converged in a common 200 µm-width inlet before the T-junction to the channel of treatment. They infused and kept the particles confined, flowing aligned, parallel and close to the right sidewall along the channel before the application of the acoustic field. The combined flow rates of the three syringes determined total flow rates across the channel of treatment varying from 20 µL/min up to 100 µL/min during the experiments, hence with an inlet rate of the bead suspension of 5 to 25 µL/min.

3. Results and Discussion

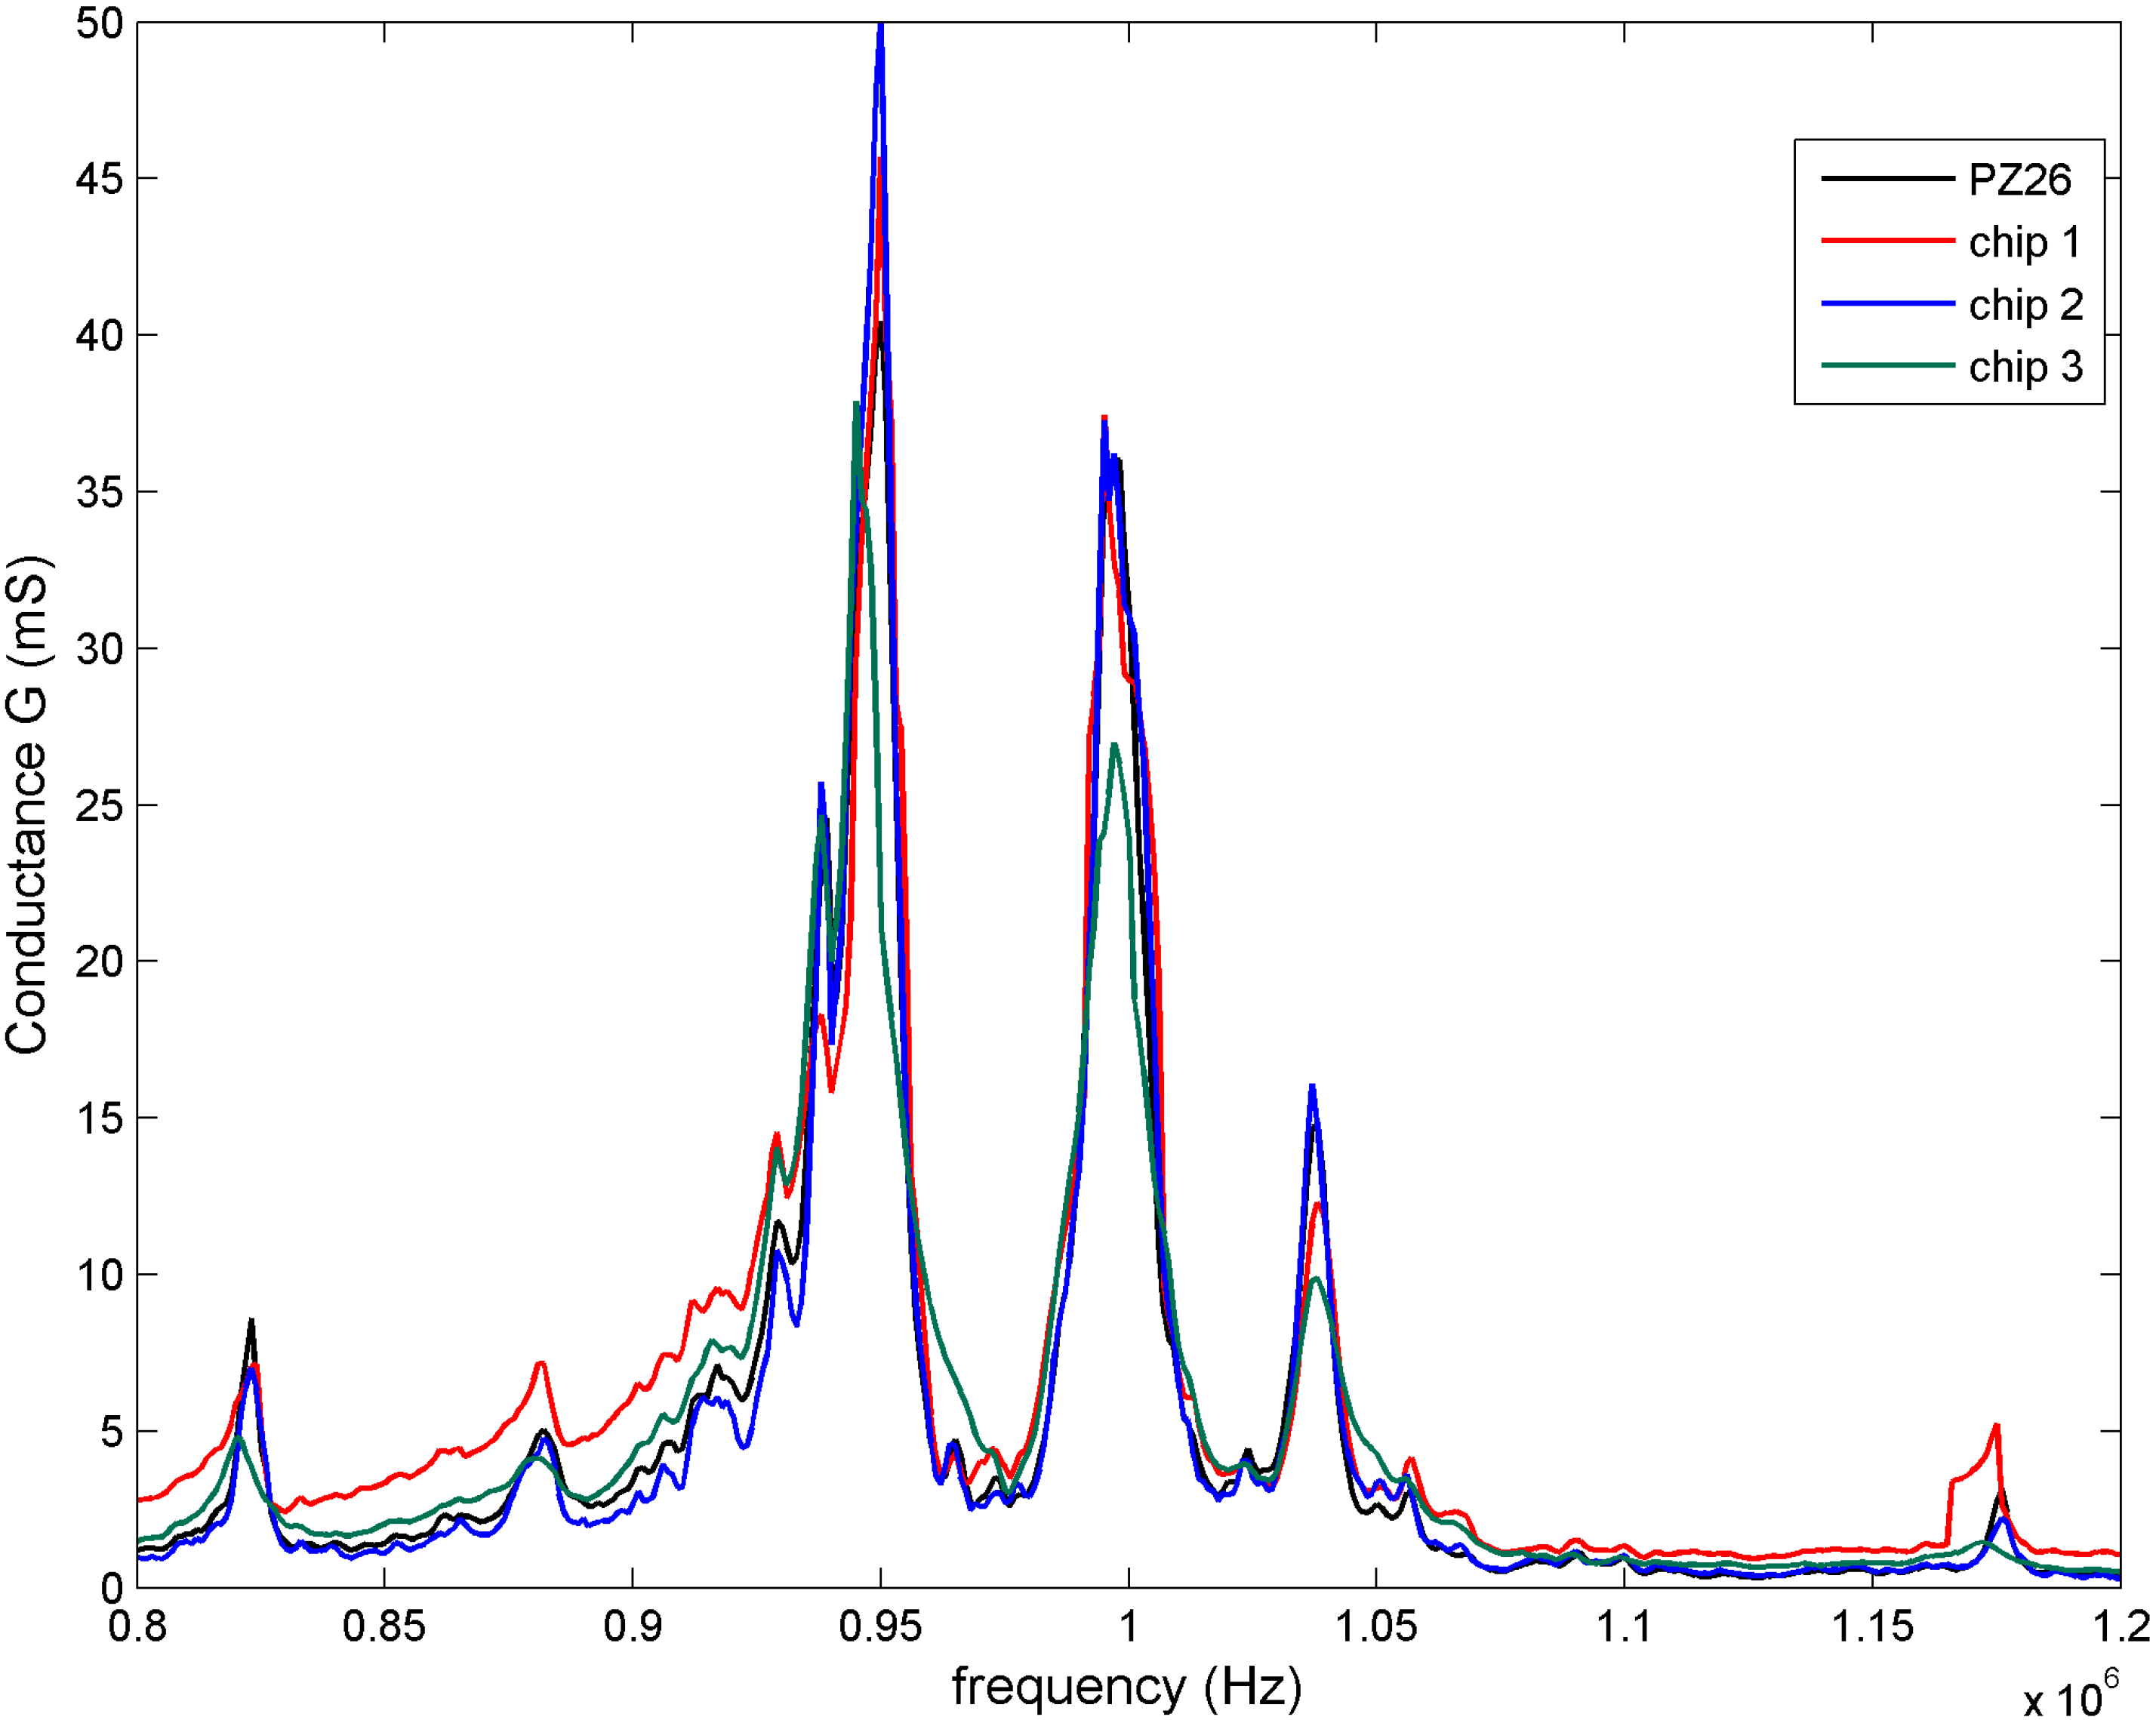
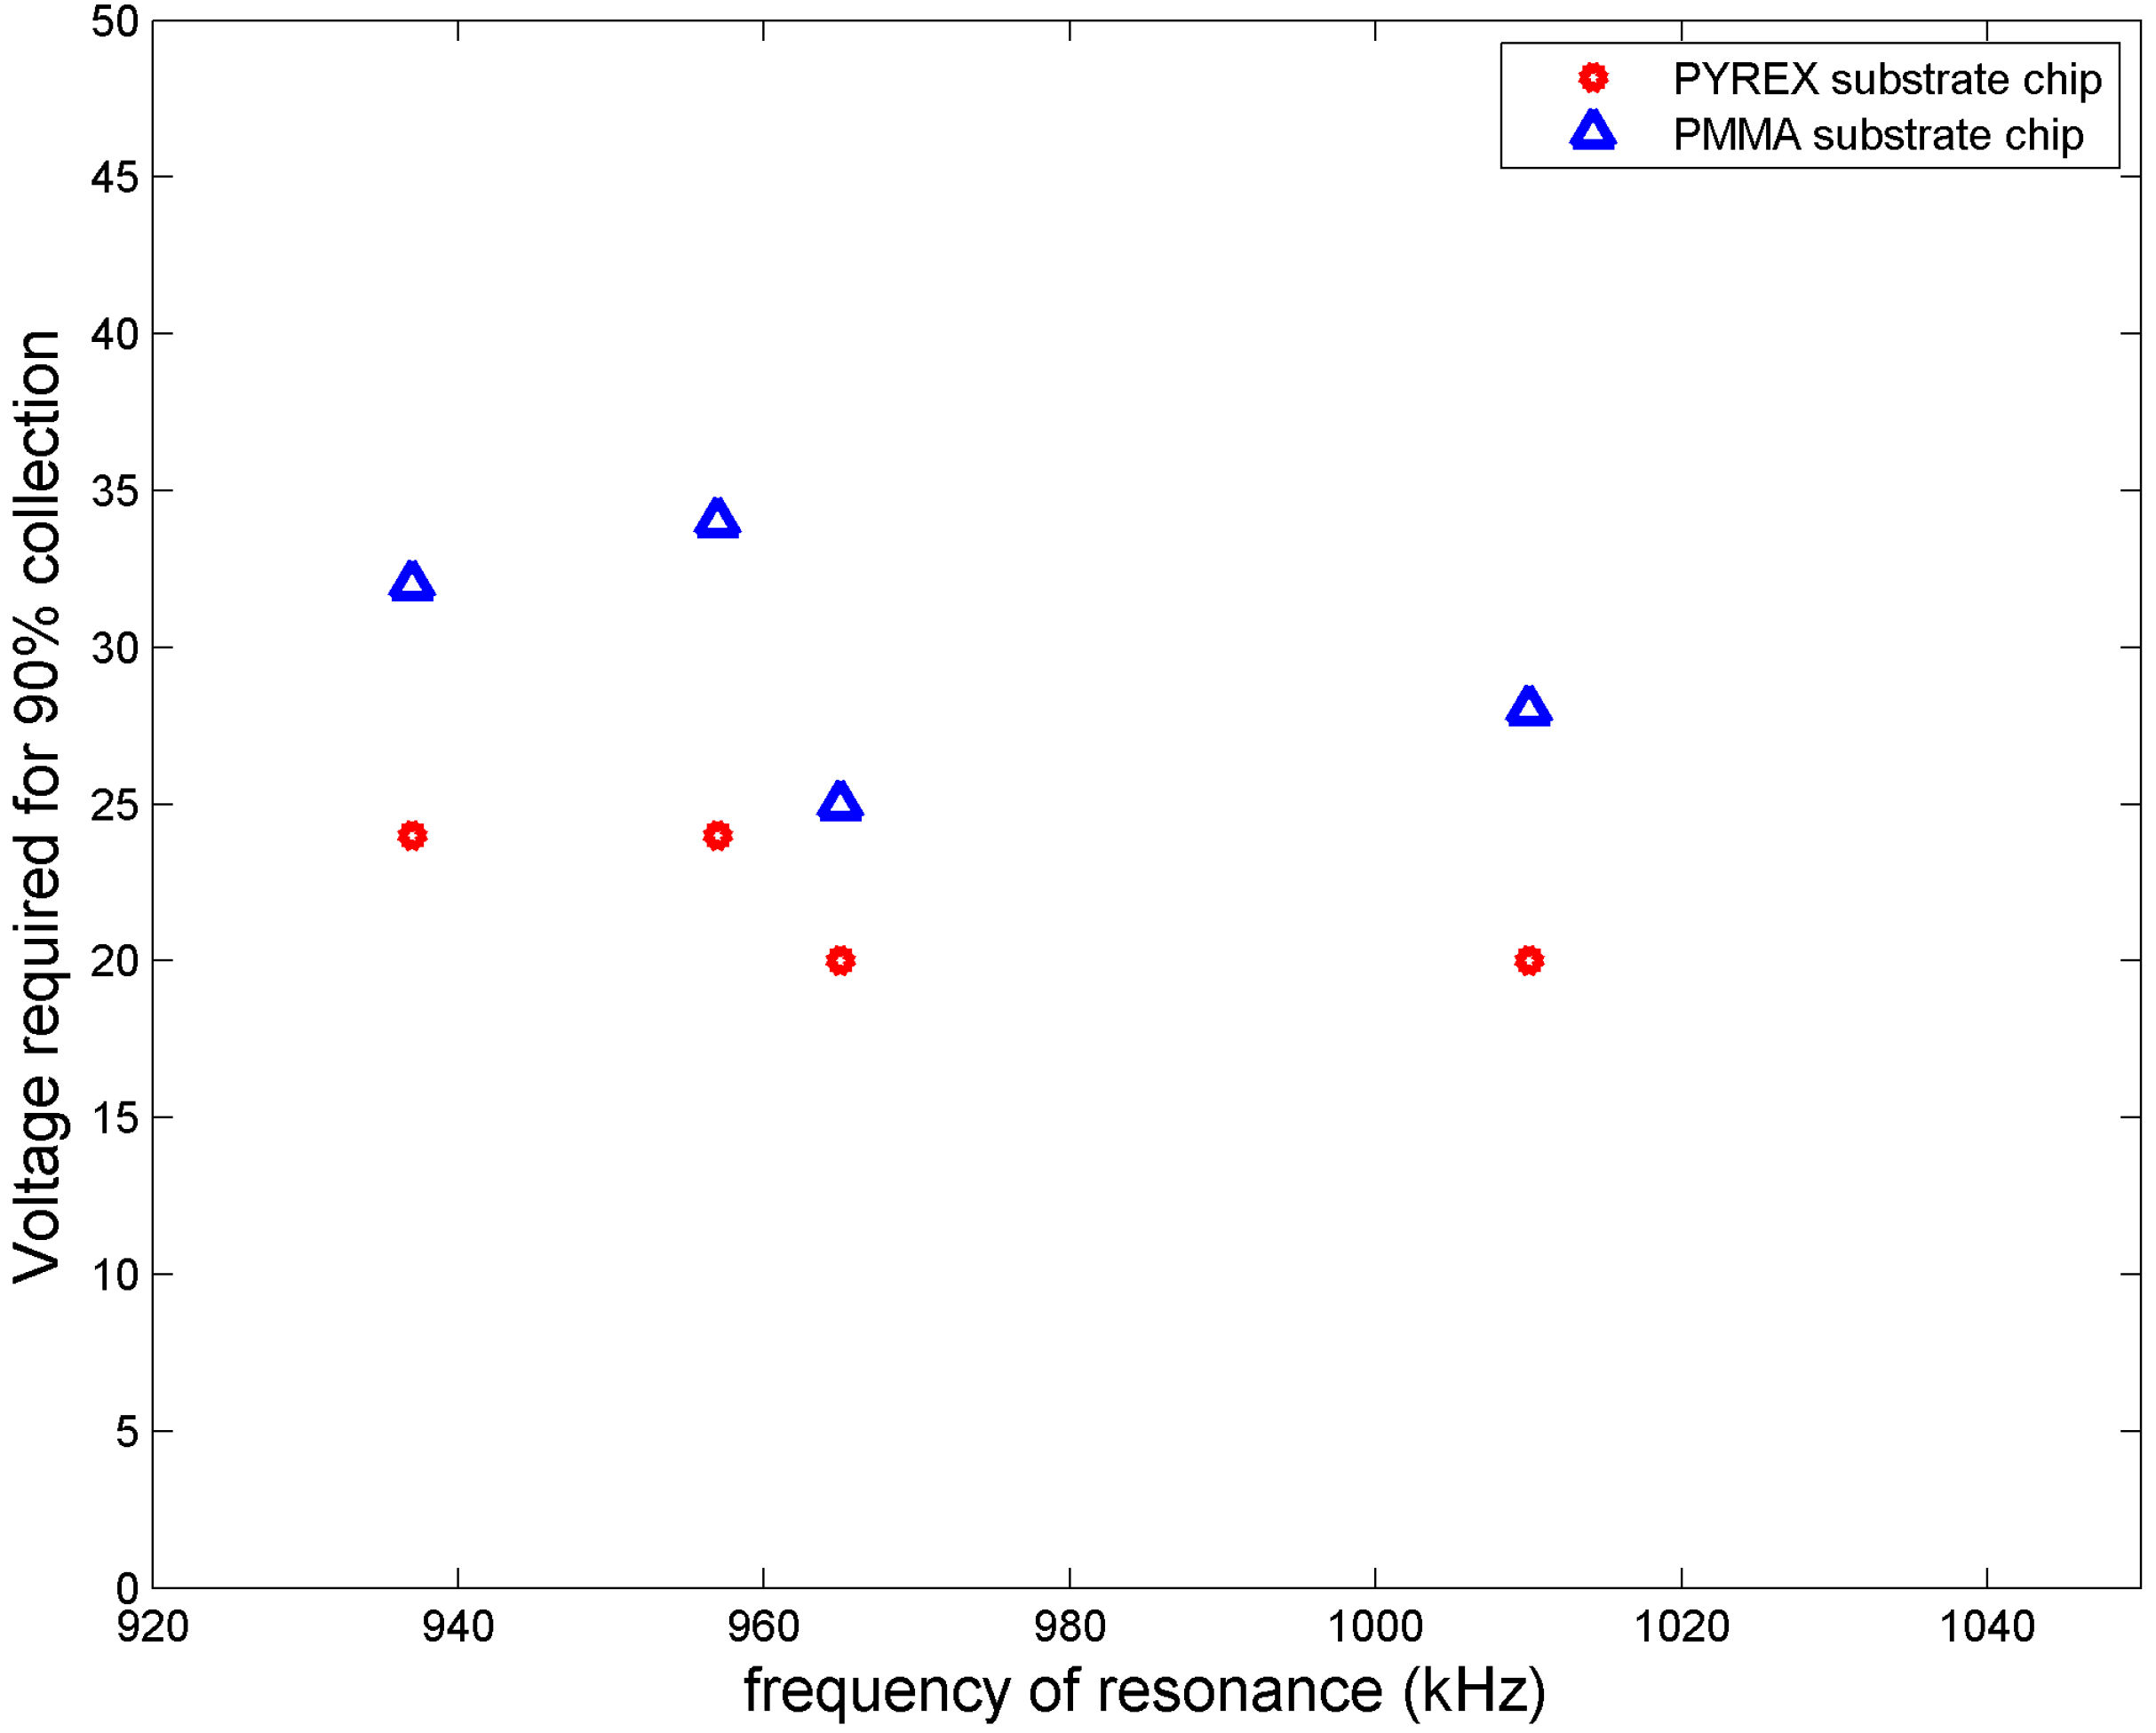
3.1 Electrical Characterization of the Chips

The three devices attached to the piezoelectric actuator were electrically characterized to identify their respective resonances in the range of frequencies selected to perform the particle separation, between 800 and 1200 kHz. A HP4194 impedance analyzer (Hewlett-Packard Company, Palo Alto, CA, USA) was used to measure their conductance, shown in Figure 3 through the G-measurements of the red, green and blue curves corresponding to those of Chip1, Chip2 and Chip3 respectively. They were compared to the piezoelectric element (black curve) but do not show remarkable variations on the G-values.
The three devices showed their most prominent G-peaks of conductance at 950, 1000 and 1040 kHz according to the piezoelectric actuator. From these results it was not possible to extract detailed information of the specific resonances associated with the chip structures, demanding a detailed analysis of the sample behavior inside the channel at different frequencies in the range of frequencies where the curves showed more irregularities, probably associated with their specific characteristics.
Figure 3. Measurement of electrical conductance of the three chips attached to the piezoelectric actuator: G-amplitudes provided by Chip1, Chip2 and Chip3 within a frequency range between 0.8 MHz and 1.2 MHz.
Micromachines 06 00574 g003

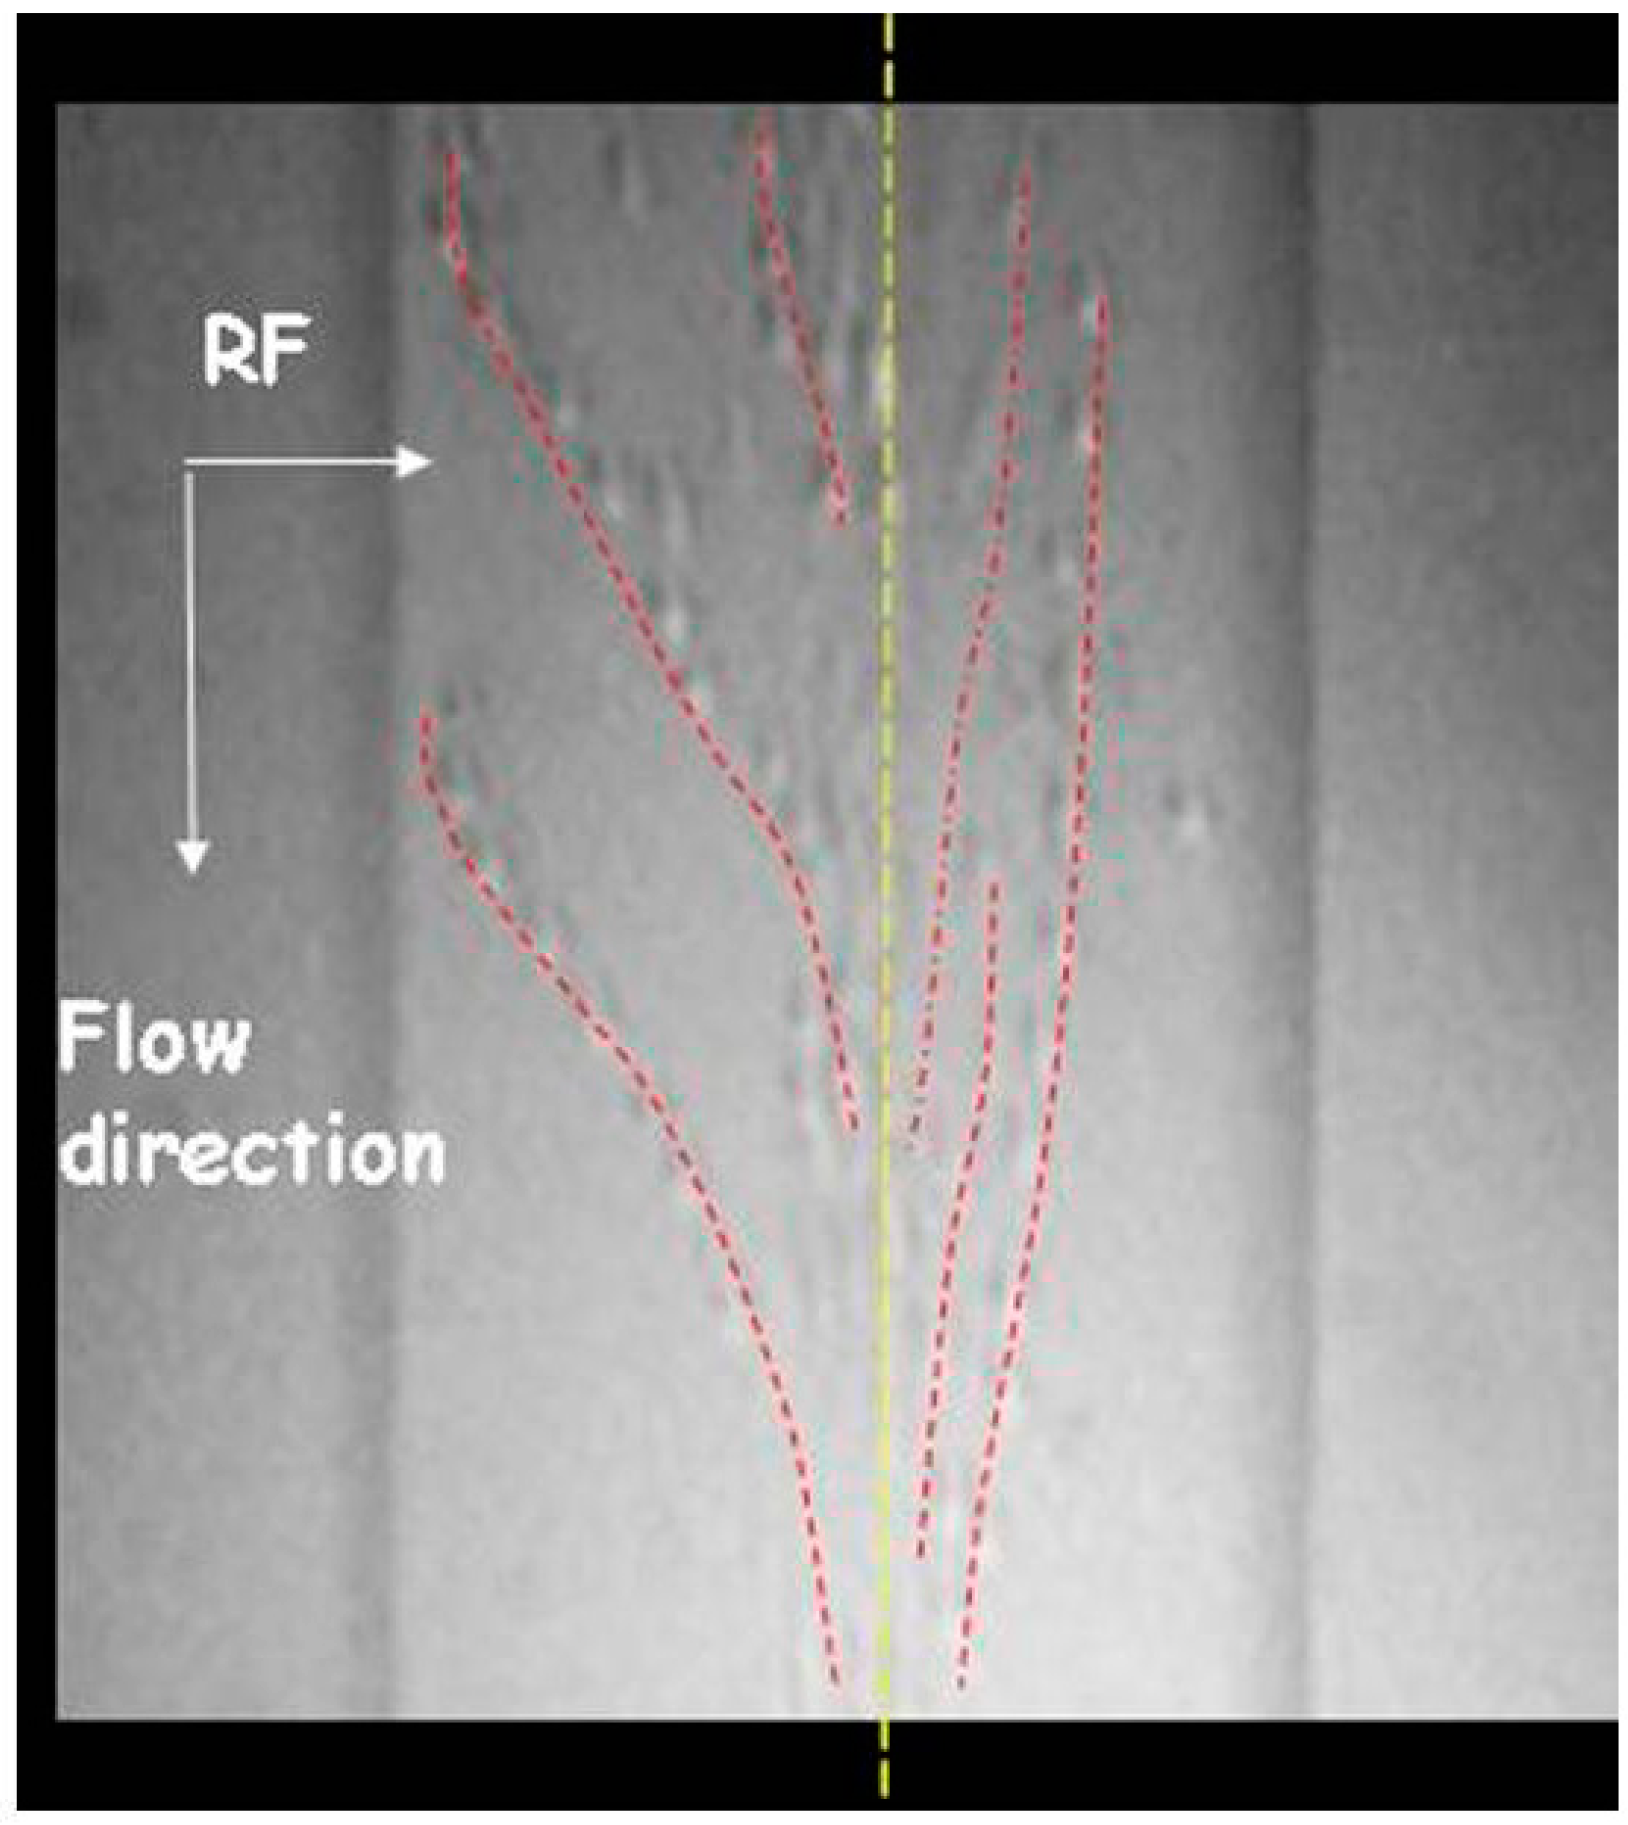
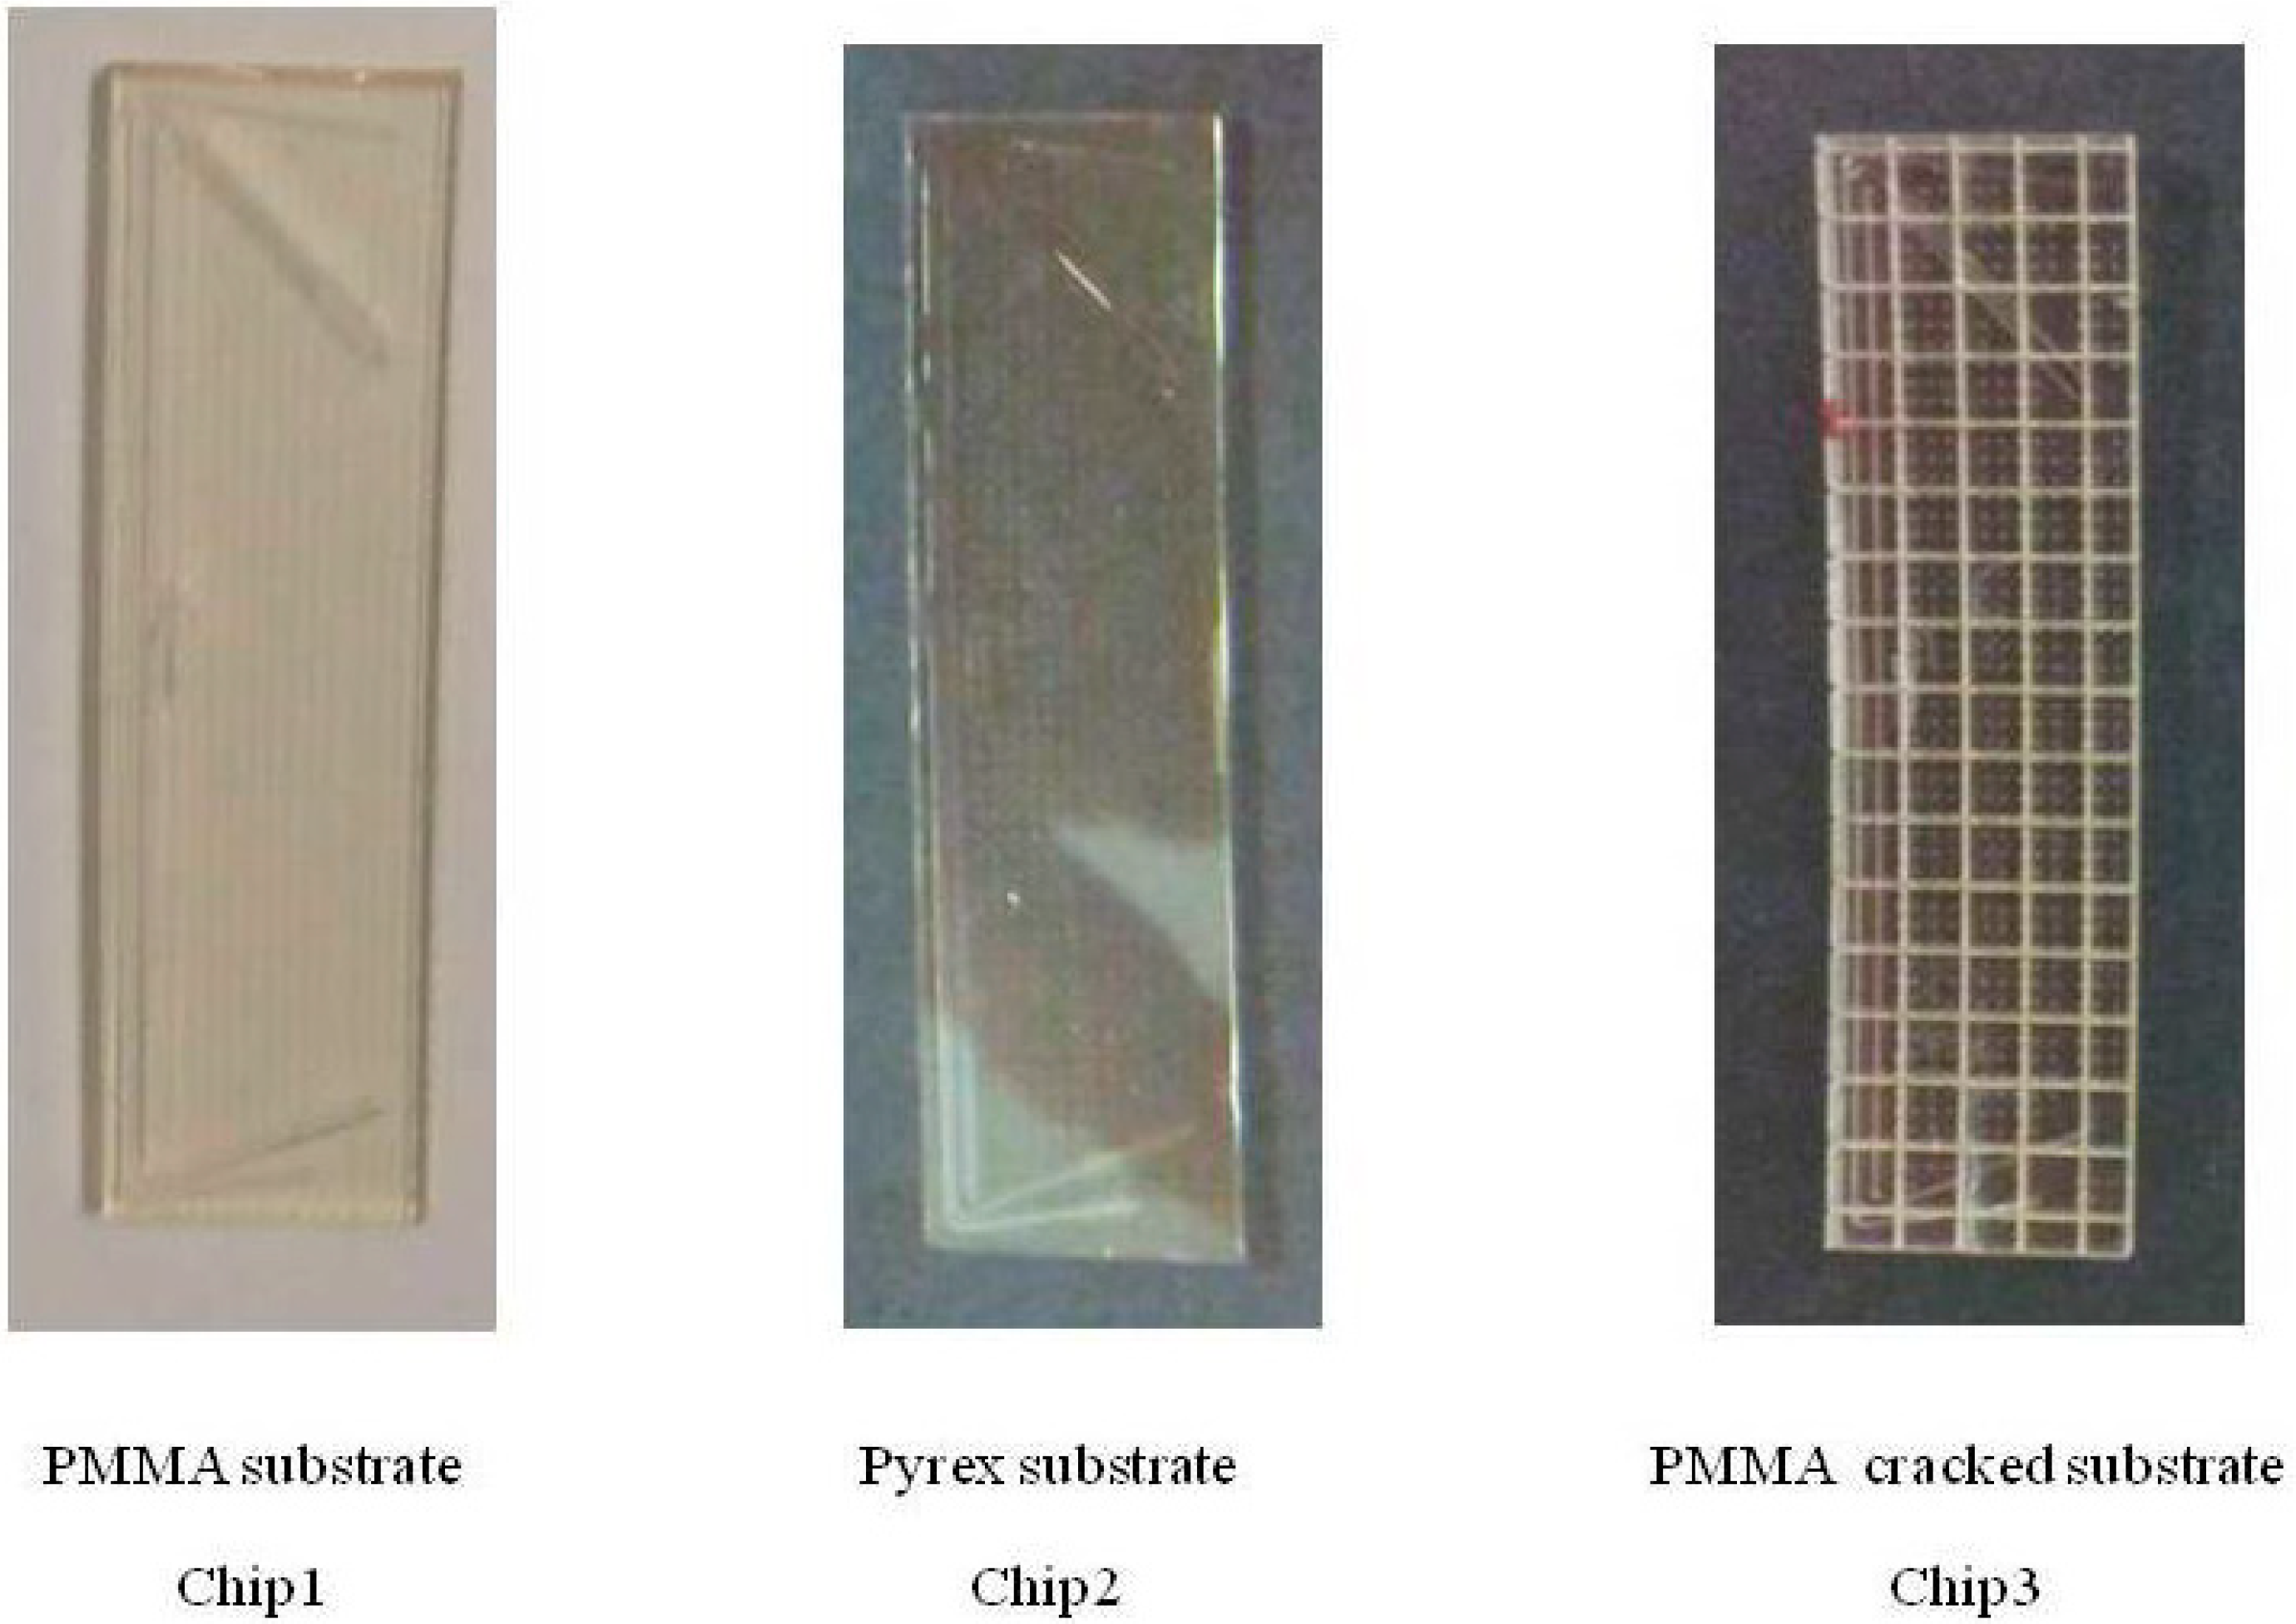
3.2. Mechanical Tests on the Chips

Experiments were performed with the hydrodynamic pre-alignment of the inlets. The samples were filmed during their flow motion along the channel of treatment subjected to the acoustic waves at the different frequencies of resonance produced around 1 MHz in each device. The particle analysis was conducted by tracking the individual microbeads during their acoustic motion toward the node inside the channel and their dynamics along it once collected. It was monitored using a Photron CCD camera attached to a Scope A1 Zeiss transmission microscope and connected to a computer running a Photron Fastcam Viewer 3 software for the capture, control and processing of the filmed images. High speed film was taken to reconstruct the particle trajectories during their flow motion subjected to the acoustic waves. Figure 4 shows six approach processes developed by the particles toward the pressure node due to the radiation force. They were reconstructed by cutting and pasting the single particle images from consecutive filmed frames.
Once collected, the particles continued their flow motion aligned along the pressure node until the end of the channel, leaving it through different outlets, either outlet 4 or outlet 5 depending on the location (outlet 4 in the filmed frame of Figure 5, with 20 μm-sized beads).
Figure 4. Reconstruction of 20 µm-sized polystyrene particle trajectories filmed inside the channel approaching the pressure node during their flow motion due to the radiation force, mainly perpendicular to it. The particles collect at the pressure node (yellow line).
Micromachines 06 00574 g004
Figure 5. Flow motion of 20 μm-sized polystyrene particles once collected at the pressure node flowing at a flow rate Q = 10 μL/min (500 frames/s).
Micromachines 06 00574 g005
Each chip provides diverse locations for collecting particles at different frequencies due to its multiple resonances in a short range, as shown in Figure 6 for Chip1 at 1000, 1080 and 1130 kHz with particle collection at w/2, 2w/3 and w respectively (being w = the channel width). This is a specific feature of polymeric devices that exhibit multiple resonances, providing versatility to choose a suitable position for particle removal depending on the desired application. It refers to positions close to the left sidewall in the current paper.
Figure 6. Lateral displacement of the particle collector with the resonance frequency from the left side of the channel at (a) f1 = 930 kHz toward the right sidewall at (d) f4 = 1130 kHz through an intermediate positions at (b) f2 = 1000 kHz and (c) f3 = 1080 kHz.
Micromachines 06 00574 g006
Some of the frequencies of resonance electrically found around 1 MHz turned out to be suitable to perform particle separation as they provided particle collectors close to the left sidewall, within the path of the pure fluid flowing in parallel to the sample, inducing the mass transfer process.
The strategy to perform the particle separation is based on two steps, the first of which concerns the search for certain acoustic frequencies that generated pressure nodes inside the channel of treatment within the path of the collector fluid and close to the left channel sidewall, far from the confined particle flow motion. Once localized, these positions were necessary to find voltage levels high enough to generate a radiation force able to drive the target particles toward the pressure node, but low enough to prevent drift motion of the small particles and nonlinear effects. This is a selective mass transfer on which is based the particle separation. Different voltages were applied to the piezoceramic actuator to determine the ability of each acoustophoretic device to separate the microbeads with different diameters, high enough to collect the 20 μm-sized particles but too low to prevent the drift motion of the small particles (6 μm) toward the node (partially helped by the particle pre-alignment close to the right sidewall).
The efficiency of separation was determined as the 20 μm-sized particles transferred to the collector fluid, leaving the channel of treatment through a different outlet than during their initial suspension (which contained the smaller 6 μm-sized particles), compared with the total number of particles injected at the inlet of the device.
η = N o u t l e t ( 20 μm ) N i n l e t ( 6 μm + 20 μm )
The proportions of microbeads of each size collected from the outlets were counted using a Z1 Beckmann Coulter Counter (Beckman Coulter, Inc., Brea, CA, USA). Figure 7 shows a graphic of quantified results of the proportion of beads collected in the left outlet to the total number of beads collected after the acoustic treatment in Chip1, with the PMMA substrate. It can be seen that the larger particles required lower voltages than the small ones. For a voltage VP-P = 15 V most of the larger beads were collected at the left outlet at a frequency f = 952 kHz, unlike the smaller beads that exited through the right outlet following their path. The bead suspension, initially containing a mixture of 50% of each bead size, could be separated into one right side outlet fraction containing 6-μm beads and one left side outlet fraction with 20 μm-beads, with a mean purity of 95.0% ± 2.0%.
As mentioned at the beginning of this section, the SU-8 layer had a thickness approximately a third of that of the PMMA substrate which was layered in Chip1 (Figure 8a). It can be anticipated that a significant percentage of the 3D standing waves were generated within the substrate volume, with a loss of energy. Consequently, any change introduced in the substrate should influence the whole vibration of the structure, and with it the pressure pattern generated inside the channel of treatment.
Figure 7. Acoustic enrichment proportion of 6 μm and 20 μm microbeads in the channel of Chip1 (with PMMA substrate): efficiency of particle collection vs. voltages applied at f = 956 kHz.
Micromachines 06 00574 g007
Figure 8. Cross section scheme of Chip1 with a PMMA substrate approximately three times thicker than the upper SU-8 layer containing the channels, (a) continuous substrate piece, (b) including cut outs in the chip substrate.
Micromachines 06 00574 g008
To verify this assumption, the PMMA was replaced by Pyrex in Chip2, a material more rigid with an acoustic impedance approximately 4 times higher than that of the polymer (ZPYREX = 12.6 MRayls, ZPMMA = 2.93 MRayls). It should provide a high wave reflection at the Pyrex/SU-8 interface with a major confinement of the standing waves inside the polymeric upper layer, from which would be transmitted toward the liquid phase inside the channel. Taking into account that the thickness of the SU-8 layer over the channel (100 µm) was much smaller than the acoustic wavelength in this material at f = 1 MHz (λSU-8 = 1838 µm), the acoustic waves established in this upper polymeric layer could approach to a 2D configuration and allow better control of the pressure patterns established inside the channel and a reduction of the energy loss within the solid structure.
In consequence, fewer modes of vibrations were expected in the new structure, with a restriction in the number of pressure nodes inside the channel of treatment.
Chip2 provided an electrical conductance close to that of Chip1 (Figure 4), with slight discrepancies in the G-measured values. However, strong discrepancies of particle behavior were observed inside the channel at each of the tested frequencies in the experiments, with a notable decrease in the number of pressure nodes, evidencing different acoustic patterns associated to the change of substrate. It demonstrated the uniqueness of each chip as a resonator system at each acoustic frequency. Chip1 and Chip2 presented coincident particle collectors at four singular frequencies: f1 = 936 kHz, f2 = 960 kHz, f3 = 965 kHz and f4 = 1006 kHz, respectively. Among them, f1 provided pressure nodes collecting the particles close to the left sidewall, suitable for the particle separation. At each of these frequencies Chip2 required lower voltages than Chip1 to collect the particles for a fixed flow rate Q = 20 μL/min, as shown by the measured values presented in Figure 9. This could refer to lower energy losses in the Pyrex substrate, more rigid than PMMA.
Figure 9. Voltages required by Chip1 ( ) and Chip2 ( ) to achieve a 90% particle collection at four coincident resonance frequencies f1 = 936 kHz, f2 = 960 kHz, f3 = 965 kHz and f4 = 1006 kHz, respectively.
Micromachines 06 00574 g009
Another chip was developed and tested, to analyze the influence of structural changes introduced on the PMMA substrate. Chip3 was developed making multiple parallel cuts on the PMMA substrate of Chip1 in perpendicular directions with a depth of approximately 700 µm and separated a distance of 1.87 mm, somewhat else than 3λ/2 (Figure 8b). This new structure corresponded to a composite PMMA-air with 2-0 connectivity (the cuts do not cross fully the substrate thickness of 700 µm). Figure 10 shows images of the three chips developed.
Figure 10. Chip1 (with PMMA substrate), Chip2 (Pyrex substrate) and Chip3 (discontinuous PMMA substrate) with the same geometrical configuration.
Micromachines 06 00574 g010
Apparent differences were observed the particle behavior inside the channel of Chip3 with respect to the other chips, showing again the uniqueness of each chip configuration behaving as a singular resonator system. It provided fewer particle collectors inside the channel in the range of frequencies analyzed, probably due to the inhibition of several modes of vibration in this partially discontinuous structure, which could approach a pseudo-2D pattern under the channel bottom.
At two of the three most prominent frequencies of resonance governed by the piezoelectric actuator Chip3 generated pressure nodes with planar shapes parallel to the channel sidewalls: f2 = 952–956 kHz, f3 = 1002–1006 kHz. Another pressure node collecting particles was established in this chip at a lower frequency, f5 = 878 kHz, with a G-value one order of magnitude smaller than the others. However, this frequency turned out to be very suitable as it required lower voltages than most of the other frequencies to collect the particles.
The various results of particle collection obtained in the three chips at the coincident resonance frequencies within the range considered are recorded in Table 2, which also presents the pressure node locations that were found in at least two of the three chips. Chip1 and Chip2 provided coincident pressure nodes closer to the left sidewall at 928 kHz and 936 kHz, suitable for separation applications.
Chip1 and Chip3 provided coincident particle collection at f = 952 kHz, also suitable to perform particle separation.
The results of the study carried out with the three different substrates demonstrate that a reduction of the 3D modes of vibration established within the substrate seems to optimize the actuation of the chips regarding to energy requirements. It is coherent with an inhibition of modes expected in the substrates made of rigid or discontinuous materials.
Table 2. Pressure node locations x0 found at different frequencies of resonance coincident at least for two chips, w being the channel width.
Frequency (kHz)Chipx0 (P = 0)
878 kHzChip1x0 ~ 2w/3
Chip2No node
Chip3x0 ~ w/3
928 kHzChip1x0 ~ w/3
Chip2x0 ~ w/3
Chip3No node
936 kHzChip1x0 ~ w/3
Chip2x0 ~ w/3
Chip3No node
952 kHzChip1x0 ~ w/3
Chip2x0 ~ 2w/3
Chip3x0 ~ w/3
956 kHzChip1w/3 <x0 < w/2
Chip2w/2 < x0 < 2w/3
Chip3x0 ~ w/3
960 kHzChip1w/2 < x0 < 2w/3
Chip2w/2 < x0 < 2w/3
Chip3No node
965 kHzChip1w/2 < x0 < 2w/3
Chip2w/2 < x0 < 2w/3
Chip3No node
980 kHzChip1x0 ~ w/2
Chip2No node
Chip3No node
1002 kHzChip1w/2 < x0 < 2w/3
Chip2No node
Chip3x0 ~ w/3
1006 kHzChip1w/2 < x0 < 2w/3
Chip2w/2 < x0 < 2w/3
Chip3w/3 <x0 < w/2

4. Conclusions

The aim of this work was to explore the possibility of optimizing polymer-based resonators to perform particle separation/sorting processes through changes to their substrate structures, to keep their low-cost etching processes of channelization for industrial/clinical applications.
The experiments have demonstrated the uniqueness of each chip tested as a whole 3D resonator generating diverse resonance frequencies within the range selected, each of which provided specific acoustic patterns with different particle collectors for each chip configuration, evidencing their different structural vibrations. Each chip configuration provides different pressure patterns at the same acoustic conditions associated with 3D modes specifically established in each solid structure.
Their efficiency of separation is defined by the establishment of those acoustic pressure patterns inside the channel of treatment located closer to the left sidewall with minimal energy requirements for particle collection. Both parameters must be taken into account for the optimization of the chips.
The experimental results of this study have shown for the first time in the literature that a replacement of a polymeric substrate by other materials/structures, partially inhibiting some 3D modes of vibration, can be advantageous for the desired application.
The three different substrates under the SU-8 layer containing the channelization provide different acoustic particle collectors at similar acoustic conditions with different voltage requirements. The use of rigid substrates seems to be advantageous given the lower energy requirements to collect the particles at the pressure nodes. According to the results of this study, discontinuities in acoustically soft materials like polymers do not present specific advantages in the search for suitable substrates to generate optimal conditions for particle or cell separation processes.

Acknowledgments

The study has been performed in the framework of two Spanish National Research Project BIO2011-30535-C04-01,02,03, “Development of a high throughput for isolation of tumor cells circulating in peripheral blood”.

Author Contributions

María Tijero, Javier Berganzo, Alain Martin, Mounir M. Bouali, Itziar González and Victor Acosta conceived and designed the experiments, Itziar González, Victor Acosta, Alain Martin, Adela Castillejo and Jose Luis Soto performed the experiments, Itziar González, María Tijero and Javier Berganzo analyzed the experiments, Victor Acosta, Mounir M. Bouali and Alain Martin contributed analysis tools. Itziar González wrote several sections of the paper but the rest of co-authors contributed in different parts of it. Every author reviewed the whole article.

Supplementary Materials

Three movies show the particle collecting at different locations within the channel cross section at 1000, 1080 and 1130 kHz respectively. Unlike conventional microseparators based on the resonance of the liquid phase (with the establishment of a standing wave between the channel sidewalls) polymer-based devices offer the possibility of several positions of acoustic equilibrium to handle the samples. Supplementary materials can be accessed at: https://www.mdpi.com/2072-666X/6/5/574/s1.

Conflicts of Interest

The authors declare no conflict of interest.

References

  1. Yamada, M.; Nakashima, M.; Seki, M. Pinched flow fractionation: Continuous size separation of particles utilizing a laminar flow profile in a pinched microchannel. Anal. Chem. 2004, 15, 5465–5471. [Google Scholar] [CrossRef]
  2. Huang, L.R.; Cox, E.C.; Austin, R.T.H.; Sturm, C. Continuous Particle Separation through Deterministic Lateral Displacement. Science 2004, 304, 987–990. [Google Scholar] [CrossRef] [PubMed]
  3. Yamada, M.; Seki, M. Hydrodynamic filtration for on-chip particle concentration and classification utilizing microfluidics. Lab Chip 2005, 5, 1233–1239. [Google Scholar] [CrossRef] [PubMed]
  4. Shevkoplyas, S.S.; Yoshida, T.; Munn, L.L.; Bitensky, M.W. Biomimetic designs of microfluidic device for auto-separation of leukocytes from the whole blood. Anal. Chem. 2005, 77, 933. [Google Scholar] [CrossRef] [PubMed]
  5. Toner, M.; Irimia, D. Blood on a chip. Rev. Annu. Biomed. Eng. 2005, 7, 77–103. [Google Scholar] [CrossRef]
  6. Berthier, J.; Silberzan, P. Microfluidics for Biotechnology; Artech House: Boston, MA, USA, 2010. [Google Scholar]
  7. Yi, C.; Li, C.; Ji, S.; Yang, M. Microfluidics technology for manipulation and analysis of biological cells. Anal. Chim. Acta 2006, 560, 1–23. [Google Scholar] [CrossRef]
  8. Pamme, N. Continuous flow separations in microfluidic devices. Lab Chip 2007, 7, 1644–1659. [Google Scholar] [CrossRef] [PubMed]
  9. Sai, Y.; Yamada, M.; Yasuda, M.; Seki, M. Continuous separation of particles using a microfluidic device equipped with flow rate control valves. J. Chromatogr. A 2006, 1127, 214–220. [Google Scholar] [CrossRef] [PubMed]
  10. Chen, X.; Cui, D.; Liu, C.; Li, H.; Chen, J. Continuous flow microfluidic device for cell separation, cell lysis and DNA purification. Anal. Chim. Acta 2007, 584, 237–243. [Google Scholar] [CrossRef] [PubMed]
  11. Nagrath, S.; Sequist, L.V.; Maheswaran, S.; Bell, D.W.; Irimia, D.; Ulkus, L.; Smith, M.R.; Kwak, E.L.; Digumarthy, S.; Muzikansky, A.; Ryan, P.; Balis, U.J.; Tompkins, R.G.; Haber, D.A.; Toner, M. Isolation of rare circulating tumour cells in cancer patients by microchip technology. Nat. Lett. 2007, 450. [Google Scholar] [CrossRef]
  12. Tan, S.J.; Yobas, L.; Lee, G.Y.H.; Ong, C.N.; Lim, C.T. Microdevice for the isolation and enumeration of cancer cells from blood. Biomed. Microdevices 2009, 11, 883–892. [Google Scholar] [CrossRef] [PubMed]
  13. Gossett, D.R.; Weaver, W.M.; Mach, A.J.; Hur, S.C.; Tse, H.T.K.; Lee, W.; Amini, H.; Di Carlo, D. Label-free cell separation and sorting in microfluidic systems. Anal. Bioanal. Chem. 2010, 397, 3249–3267. [Google Scholar] [CrossRef] [PubMed]
  14. Bhagat, A.A.; Bow, H.; Wei Hou, H.; Tan, S.J.; Han, J.; Lim, C.T. Microfluidics for cell separation. Med. Biol. Eng. Comput. 2010, 48, 999–1014. [Google Scholar] [CrossRef] [PubMed]
  15. Hou, H.W.; Bhagat, A.A.; Lee, W.C.; Huang, S.; Han, J.; Lim, C.T. Microfluidic Devices for Blood Fractionation. Micromachines 2011, 2, 319–343. [Google Scholar] [CrossRef]
  16. Quek, R.; Le, D.V.; Chiam, K.-H. Separation of deformable particles in deterministic lateral displacement devices. Phys. Rev. E 2011, 83, 056301. [Google Scholar] [CrossRef]
  17. Yu, M.; Stott, S.; Toner, M.; Maheswaran, S.; Haber, D.A. Circulating tumor cells: Approaches to isolation and characterization. J. Cell Biol. 2011, 192, 373–382. [Google Scholar] [CrossRef] [PubMed]
  18. Chen, X.; Cui, D.F.; Liu, C.C.; Li, H. Microfluidic Devices for Blood cell separation and collection based on crosflow filtration. Sens. Actuators B Chem. 2008, 130, 216–221. [Google Scholar] [CrossRef]
  19. Yu, L.; Ng, S.R.; Xu, Y.; Dong, H.; Wang, Y.J.; Li, C.M. Advances of lab-on-a-chip in isolation, detection and post-processing of circulating tumour cells. Lab Chip 2013, 13, 3163–3182. [Google Scholar] [CrossRef] [PubMed]
  20. MacDonald, M.P.; Spalding, G.C.; Dholakia, K. Microfluidic sorting in an optical lattice. Nature 2003, 426, 421. [Google Scholar] [CrossRef] [PubMed]
  21. Schmidt, B.S.; Yang, A.H.J.; Erickson, D.; Lipson, M. Optofluidic trapping and transport on solid core waveguides within a microfluidic device. Opt. Express 2007, 15, 14322–14334. [Google Scholar] [CrossRef] [PubMed]
  22. Lapizco-Encinas, B.H.; Simmons, B.A.; Cummings, E.B.; Fintschenko, Y. Dielectrophoretic Concentration and Separation of Live and Dead Bacteria in an Array of Insulators. Anal. Chem. 2004, 76, 1571–1579. [Google Scholar] [CrossRef] [PubMed]
  23. Kang, K.H.; Kang, Y.J.; Xuan, X.C.; Li, D.Q. Continuous separation of microparticles by size with Direct current-dielectrophoresis. Electrophoresis 2006, 27, 694–702. [Google Scholar] [CrossRef] [PubMed]
  24. Zhang, L.; Tatar, F.; Turmezei, P.; Bastemeijer, J.; Mollinger, J.R.; Piciu, O.; Bossche, A. Continuous Electrodeless Dielectrophoretic Separation in a Circular Channel. J. Phys. 2006, 34, 527–532. [Google Scholar]
  25. Pysher, M.D.; Hayes, M.A. Electrophoretic and Dielectrophoretic Field Gradient Technique for Separating Bioparticles. Anal. Chem. 2007, 79, 4552–4557. [Google Scholar] [CrossRef] [PubMed]
  26. Gascoyne, P.R.C.; Gascoyne, P.R.; Noshari, J.; Anderson, T.J.; Becker, F.F. Isolation of rare cells from cell mixtures by Dielectrophoresis. Electrophoresis 2009, 30, 1388–1398. [Google Scholar] [CrossRef] [PubMed]
  27. Coakley, W.T.; Whitworth, G.; Grundy, M.A.; Gould, R.K.; Allman, R. Ultrasonic manipulation of particles and cells. Bioseparation 1994, 4, 73–83. [Google Scholar] [PubMed]
  28. Cousins, C.M.; Holownia, P.; Hawkes, J.J.; Limaye, M.S.; Price, C.P. Plasma preparation from whole blood using ultrasound. Ultrasound Med. Biol. 2000, 26, 881–888. [Google Scholar] [CrossRef] [PubMed]
  29. Hawkes, J.; Coakley, W.T. Force field particle filter combining ultrasound standing waves and laminar flow. Sens. Actuators B Chem. 2001, 75, 213. [Google Scholar] [CrossRef]
  30. Petersson, F.; Nilsson, A.; Jonsson, H.; Laurell, T. Carrier Medium Exchange through Ultrasonic Particle Switching in Microfluidic Channels. Anal. Chem. 2005, 77, 1216–1221. [Google Scholar] [CrossRef] [PubMed]
  31. Haake, A.; Neild, A.; Kim, D.; Ihm, J.; Sun, Y.; Dual, J.; Ju, B. Manipulation of cells using an ultrasonic pressure field. Ultrasound Med. Biol. 2005, 31, 857–864. [Google Scholar] [CrossRef] [PubMed]
  32. Neild, A.; Oberti, S.; Beyeler, F.; Dual, J.; Nelson, B.J. A micro-particle positioning technique combining an ultrasonic manipulator and a microgripper. J. Micromech. Microeng. 2006, 16, 1562–1570. [Google Scholar] [CrossRef]
  33. Kapishnikov, S.; Kantsler, V.; Steinberg, V. Continuous particle size separation and size sorting using ultrasound in a Microchannel. J. Stat. Mech. Theory Exp. 2006, 2006, P01012. [Google Scholar] [CrossRef]
  34. Wiklund, M.; Günther, C.; Jäger, M.; Fuhr, G.; Hertz, H.M. Ultrasonic standing wave manipulation technology integrated into a dielectrophoretic chip. Lab Chip 2006, 6, 1537–1544. [Google Scholar] [CrossRef] [PubMed]
  35. Laurell, T.; Petersson, F.; Nilsson, A. Chip integrated strategies for acoustic separation and manipulation of cells and particles. Chem. Soc. Rev. 2007, 36, 492–506. [Google Scholar] [CrossRef] [PubMed]
  36. Milne, G.; Rhodes, D.; MacDonald, M.; Dholakia, K. Fractionation of polydisperse colloid with acousto-optically generated potential energy landscapes. Opt. Lett. 2007, 32, 1144–1146. [Google Scholar] [CrossRef] [PubMed]
  37. Townsend, R.J.; Hill, M.; Harris, N.R.; McDonnell, M.B. Performance of a quarter-wavelength particle concentrator. Ultrasonics 2008, 48, 515–520. [Google Scholar] [CrossRef] [PubMed]
  38. Oberti, S.; Moeller, D.; Neild, A.; Dual, J.; Beyeler, F.; Nelson, B.; Gutmann, S. Strategies for single particle manipulation using acoustic and flow fields. Ultrasonics 2010, 50, 247–257. [Google Scholar] [CrossRef] [PubMed]
  39. Courtney, C.; Drinkwater, O.C.; Wilcox, B.W.; Demore, C.; Cochran, S.; Hill, M. Manipulation of microparticles using phase-controllable ultrasonic standing wave. J. Acoust. Soc. Am. 2010, 128, EL195–EL199. [Google Scholar] [CrossRef] [PubMed]
  40. Franke, T. Surface acoustic wave actuated cell sorting (SAWACS). Lab Chip 2010, 10, 789–794. [Google Scholar] [CrossRef] [PubMed]
  41. Thalhammer, G.; Steiger, R.; Meinschad, M.; Hill, M.; Bernet, S.; Ritsch-Marte, M. Combined acoustic and optical trapping. Biomed. Opt. Express 2011, 2, 2859. [Google Scholar] [CrossRef] [PubMed]
  42. Bazou, D.; Castro, A.; Hoyos, M. Controlled Cell aggregation in a pulsed acoustic field. Ultrasonics 2012, 52, 842–850. [Google Scholar] [CrossRef] [PubMed]
  43. Ding, X.; Lin, S.-C.S.; Kraly, B.; Yue, H.; Li, S.; Chiang, I.-K.; Shi, J.; Benkovic, S.; Huang, T. On-chip manipulation of single microparticles, cells, and organisms using surface acoustic waves. Proc. Nat. Acad. Sci. USA 2012, 109, 11105–11109. [Google Scholar] [CrossRef] [PubMed]
  44. Glynne-Jones, P.; Hill, M. Acoustic Manipulation combined with other force fields. Lab Chip 2013, 13, 1003–1010. [Google Scholar] [CrossRef] [PubMed]
  45. González, I.; Fernandez, L.J.; Gomez, T.; Berganzo, J.; Soto, J.L.; Carrato, A. A polymeric chip for micromanipulation and particle sorting by ultrasounds based on a multilayer configuration. Sens. Actuators B Chem. 2010, 144, 310–317. [Google Scholar] [CrossRef]
  46. González, I.; Fernandez, L.J.; Gomez, T.; Soto, J.L.; Martin, A.; Berganzo, J. Ultrasonic extraction of circulating tumor cells from peripheral blood- a noninvasive method to keep the cells viable for later biomolecular analysis. In Proceedings of the 2011 6th International Conference on Microtechnologies in Medicine and Biology (MMB2011), Luzern, Switzerland, 3–5 April 2011; pp. 60–61.
  47. Harris, N.; Hill, M.; Keating, A.; Baylac-Choulet, P. A lateral mode flow-through PMMA ultrasonic separator. Int. J. Appl. Biomed. Eng. 2012, 5, 8. [Google Scholar]
  48. Mueller, A.; Lever, A.; Nguyen, T.V.; Comolli, J.; Fiering, J. Continuous acoustic separation in a thermoplastic microchannel. J. Micromech. Microeng. 2013, 23, 125006. [Google Scholar] [CrossRef]
  49. Gor’kov, L.P. On the forces acting on a small particle in an acoustical field in an ideal fluid. Sov. Phys. Dokl. 1962, 6, 773–775. [Google Scholar]
  50. Martinez-Duarte, R.; Madou, M.J. SU-Photolithography and Its Impact on Microfluidics. In Microfluidics and Nanofluidics Handbook; Mitra, S.K., Chakraborty, S., Eds.; CRC Press: Boca Raton, FL, USA, 2012; Chapter 8; pp. 231–268. [Google Scholar]
  51. SU-8 2000. Available online: http://www.microchem.com/pdf/SU-82000DataSheet2000_5thru2015Ver4.pdf (accessed on 21 July 2011).

