Recent Progress toward Microfluidic Quality Control Testing of Radiopharmaceuticals


1
Department of Bioengineering, Henry Samueli School of Engineering and Applied Science, University of California Los Angeles, Los Angeles, CA 90095, USA
2
Crump Institute for Molecular Imaging and Department of Molecular and Medical Pharmacology, David Geffen School of Medicine, University of California Los Angeles, Los Angeles, CA 90095, USA
*
Author to whom correspondence should be addressed.
Micromachines 2017, 8(11), 337; https://doi.org/10.3390/mi8110337
Submission received: 27 September 2017
/
Revised: 8 November 2017
/
Accepted: 18 November 2017
/
Published: 21 November 2017
(This article belongs to the Special Issue Integrated Microfluidics for Chemical Synthesis and Analysis)
Abstract
:Radiopharmaceuticals labeled with short-lived positron-emitting or gamma-emitting isotopes are injected into patients just prior to performing positron emission tomography (PET) or single photon emission tomography (SPECT) scans, respectively. These imaging modalities are widely used in clinical care, as well as in the development and evaluation of new therapies in clinical research. Prior to injection, these radiopharmaceuticals (tracers) must undergo quality control (QC) testing to ensure product purity, identity, and safety for human use. Quality tests can be broadly categorized as (i) pharmaceutical tests, needed to ensure molecular identity, physiological compatibility and that no microbiological, pyrogenic, chemical, or particulate contamination is present in the final preparation; and (ii) radioactive tests, needed to ensure proper dosing and that there are no radiochemical and radionuclidic impurities that could interfere with the biodistribution or imaging. Performing the required QC tests is cumbersome and time-consuming, and requires an array of expensive analytical chemistry equipment and significant dedicated lab space. Calibrations, day of use tests, and documentation create an additional burden. Furthermore, in contrast to ordinary pharmaceuticals, each batch of short-lived radiopharmaceuticals must be manufactured and tested within a short period of time to avoid significant losses due to radioactive decay. To meet these challenges, several efforts are underway to develop integrated QC testing instruments that automatically perform and document all of the required tests. More recently, microfluidic quality control systems have been gaining increasing attention due to vastly reduced sample and reagent consumption, shorter analysis times, higher detection sensitivity, increased multiplexing, and reduced instrumentation size. In this review, we describe each of the required QC tests and conventional testing methods, followed by a discussion of efforts to directly miniaturize the test or examples in the literature that could be implemented for miniaturized QC testing.
1. Introduction
Positron emission tomography (PET) and single photon emission tomography (SPECT) are real-time, 3D imaging techniques that have unparalleled specificity and sensitivity for visualizing biochemical processes in living subjects [1,2]. The information from a PET or SPECT scan is used clinically in disease diagnosis, prediction of response to therapy, and monitoring of response to therapy [1,3,4,5,6,7]. PET is also an indispensable research tool for uncovering mechanisms of disease initiation and progression, developing new therapies, measuring and optimizing the pharmacokinetic properties of new therapeutic compounds, and evaluating new therapies in clinical trials [8]. PET and SPECT both rely on the injection of a radioisotope-labelled compound, known as a radiotracer or radiopharmaceutical, into the patient which targets specific receptors, enzymes, or proteins and allows their position and density/activity to be measured via radiation detectors during a PET or SPECT scan. PET employs radiotracers labelled with positron (β+)-emitting isotopes (e.g., F-18, C-11, O-15, N-13, Ga-68, Cu-64, Zr-89, etc.), which release positrons upon decay. These positrons rapidly annihilate with nearby electrons to form two anti-parallel gamma (γ) rays (511 keV each) that are detected by a ring of detectors [2]. SPECT typically utilizes radioisotopes that directly emit γ rays (e.g., Tc-99m, I-123, In-111, etc.) which are detected using a collimator and gamma camera [9]. In both cases, many decay events are detected to enable reconstruction of the three-dimensional radiotracer distribution in the body. Due to the short half-life of PET and SPECT radioisotopes, labeled tracers must be manufactured just prior to imaging (Figure 1). And because these compounds are injected into humans, there are strict regulatory requirements for performing quality control (QC) testing of the purified, formulated product of each batch that is produced, to ensure safety before they can be released for clinical use [10,11]. Specific procedures and requirements for these tests are described in regulatory documents published in each country or region (e.g., U.S. Pharmacopeia (USP) General Chapter <823> [12] and U.S. Food and Drug Administration (FDA) 21 CFR Part 212 [13]; European Pharmacopoeia (EP) [14], etc.). Procedures specific to the PET tracer 2-[18F]fluoro-2-deoxy-D-glucose ([18F]FDG) have been discussed in detail in several review articles [15,16]. In general, pharmaceutical tests (e.g., pH, color and clarity, chemical purity, residual solvents, pyrogenicity, sterility) are required to ensure physiological compatibility of the final preparation and the absence of microbiological, pyrogenic, chemical or particulate contamination. In addition, radioactive tests (e.g., radiochemical identity, radiochemical purity, radioisotope identity, radioisotope purity, and radioactivity concentration) are required to ensure there are no radioactive or radionuclidic impurities that could interfere with the biodistribution or imaging protocol and to ensure the proper patient dose [17].
Performing and documenting these required QC tests is cumbersome and time-consuming, and requires an array of expensive analytical chemistry equipment and significant dedicated lab space. In addition, for most tests, manual handling, loading, and/or visual assessment of samples leads to significant radiation exposure to personnel and operator-induced variability in the results. In particular Ferguson et al. found that QC personnel received significant radiation exposure, especially due to performing sterility (filter integrity), pH, and chemical/radiochemical purity and identity testing [18]. Furthermore, in contrast to ordinary pharmaceuticals, each batch of short-lived PET radiopharmaceuticals has to be manufactured and tested within a short period of time to prevent significant losses due to radioactive decay [17].
Several companies, including QC-1 (Munster, Germany) [19], Trace-ability (Culver City, CA, USA) [20], and ABT Molecular Imaging Inc. (Louisville, TN, USA) [21,22], have been developing QC systems that automatically perform the tests and also handle the majority of the needed equipment calibrations, performance testing, and report generation. After further development and appropriate validation, such automated QC testing systems have the potential to significantly alleviate the labor burden and decrease radiation exposure.
More recently, there have been efforts to miniaturize the instrumentation for QC testing by using microfluidics, much like the efforts to miniaturize other stages of radiotracer production (radioisotope concentration, radiosynthesis, purification, and formulation) [23,24,25,26,27]. Microfluidic QC systems could lead to significantly lower instrumentation cost and reduction of needed laboratory space. Microfluidic techniques in general also offer many other important advantages over their conventional counterparts, including vastly reduced sample and reagent consumption, shorter analysis times, higher detection sensitivity, and increased multiplexing or parallelism [26,28]. Furthermore, the fabrication and material cost of many techniques used in microfluidic QC systems can be very low, potentially enabling tests to be implemented with a disposable fluid path. These advantages could be especially helpful in conjunction with emerging technologies that produce smaller batches of PET/SPECT tracers at a time (each requiring QC testing), including dose-on-demand approaches [29].
While the field is still far from achieving a fully-integrated microscale QC testing platform, we highlight in this review the significant progress that has been made in developing microscale implementations suitable for several of the required QC tests for radiopharmaceuticals and pharmaceuticals.
2. Miniaturization of Quality Control Tests
Testing of PET and SPECT radiopharmaceuticals involves several specific measurements to ensure product purity, identity, and biological safety for human subjects [12,14]. The detailed criteria for passing each test depend on the particular radiopharmaceutical and method of preparation, but in many cases the tests are similar or identical across a broad range of radiotracers. Below, we describe each of the required tests and the conventional method(s) of performance, and then describe current efforts to directly miniaturize each test or discuss examples from the field of microfluidics that could be implemented to miniaturize the test.
2.1. pH Test
pH must be controlled to ensure both the stability of the formulated radiopharmaceutical (to ensure it does not degrade between manufacturing and injection) and its physiological compatibility with the patient. Due to the high buffer capacity of the blood and the relatively small injection volume (typically 1–10 mL), a relatively wide pH range (typically 4.5–8.5) is considered to be acceptable from a physiological point of view [17]. The requirement for stability often shrinks the acceptable range. The pH of the formulated radiotracer is most commonly measured using a calibrated electronic pH meter or pH indicator strips.
While there are a myriad of approaches and technologies developed for the measurement of pH, to the best of our knowledge, there is only one report (aside from a brief mention in a patent [30]) on application of a microscale approach to pH measurement of radiopharmaceuticals. Tarn et al. described a simple, 3-layer, glass microfluidic device, in which the sample is first combined with a universal pH indicator in an on-chip mixer, and the optical absorbance of the mixture is measured with a spectrometer connected via optical fibers to an extended flow-cell in the chip (Figure 2A) [31]. The absorption spectrum of the indicator shifts as a function of pH, and a calibration was created using reference standards to relate the pH value to the absorbance at that wavelength. With this device, the pH of small samples (<2 µL) of [18F]FDG solutions could be determined (in the pH range 1–13) within a few minutes. A second analysis method was also reported, where the absorbance was monitored at multiple wavelengths to obtain a “fingerprint” of the sample, which could be “matched” with fingerprints of standards. The flow-cell is an important part of the implementation as the small dimensions of microchannels can lead to low optical path lengths (OPL) and thus low absorbance values and low detection sensitivity. A variety of detection cell designs have been reported in the literature that incorporate (i) an extended optical path to increase absorbance by the sample; (ii) multiple passes of the illumination light through the sample to increase absorbance; or (iii) an optical resonator that is filled with the sample. These approaches were reviewed by Rushworth et al. [32].
A wide variety of other microfluidic methods for measuring sample pH have been reported [33]. These include miniaturized approaches based on traditional pH indicators or electrochemical cells, as well as approaches based on detection of physical or optical changes in pH-responsive coatings. Many of these approaches could presumably be applied to pH analysis of radiopharmaceuticals, provided they have a sufficiently wide working pH range and fast analysis time. A few examples of these approaches are discussed below.
Maruyama et al. used gel microbeads impregnated with pH indicator to measure local pH in the sample immediately surrounding the bead (Figure 2B) [34]. The gel microbeads, positioned with optical tweezers, changed color within a few seconds when in contact with sample solution indicating the local pH over the range 5.8–9.0. Maclin et al. reported a similar approach in which the indicator was contained in nanocapsules immobilized in high-porosity polyvinyl alcohol matrix [35], and demonstrated analysis of 30 µL sample volumes within 2 min spanning a pH range of 2.7 to 12.6. An advantage of these approaches is more accurate measurements (since they avoid adding the indicator into solution, which, in high quantities, can affect the pH being measured). Furthermore, because mixing is not required, the implementation can be simpler.
Other approaches for pH measurement are based on detectable changes in a pH-sensitive coating. For example, Mela et al. reported the detection of pH by modifying the internal surface of a microfluidic channel with the pH-sensitive fluorescent dye Oregon Green 514 (Figure 2C) [36]. By monitoring fluorescent emission intensity, pH in the range 2–10 could be measured in real time as an aqueous sample flowed through a 20 µm × 2 µm channel inside a polydimethylsiloxane (PDMS)/glass chip. Florea et al. described a device in which the surface of a microchannel was coated with polyaniline [37]. pH of the sample flowing through the device affects the optical properties of the polymer coating resulting from a reversible protonation/deprotonation reaction. Response could be detected over the pH range 2–12 in real time (Figure 2D).
In addition to optical changes, pH can induce changes in density, volume, and stiffness of coatings such as hydrogels that can be detected as changes in refractive index, electrical resistance, natural frequency of mechanical oscillation, etc. These approaches have been described in a comprehensive review [38]. In one example of these approaches, Trinh et al. reported a hydrogel-based piezoresistive pH sensor, in which a hydrogel was placed between a stiff, porous grate and a piezoresistive bending plate transducer [39]. pH-induced swelling of the hydrogel deflected the plate and caused a detectable resistance change, allowing detection of pH values in the range 5.5–11 within 12 min. In a similar approach, Hilt et al. [40] reported the use of a hydrogel coating on a micro-cantilever that could respond to changes in environmental pH resulting in a surface stress that deflected the cantilever (Figure 2E). By measuring the deflection with a laser beam reflecting from the cantilever surface, pH measurements in the range 2.8–6.8 were reported.
pH can also be detected via electrochemical reactions, in which the electrical potential is sensitive to the pH of the sample solution in the electrochemical cell. A wide variety of implementations of electrochemical cells have been reviewed [33,40] and a few examples of microscale cells reported for pH measurement are given below. Lin et al. developed a microfluidic continuous-flow pH measurement chip by integrating thin-film pH-sensing electrochemical electrodes into in a PDMS chip (Figure 2F) [41]. The free hydrogen atoms of the sample react with the sensing electrodes (fabricated by sputtering layers of SiO2–Li O2–BaO–Ti O2–La2O3 (SLBTLO) on platinum (Pt) electrodes) inducing a detectable change in potential with respect to the reference electrode (Ag electrode with thin coating of AgCl). pH measurements in the range pH 2 to 10 could be made using only ~0.5 µL sample volume and 200 s duration. Yamada and Suzuki developed a flow-based microfluidic pH measurement system using ion-sensitive field-effect transistor (ISFET) sensors for measurement of the proton concentration (Figure 2G) [42]. Two ISFET sensors and an Ag/AgCl pseudo reference electrode are fitted into a microfluidic Y-junction such that the reference ISFET and reference electrode are always immersed in a stream of baseline solution and the measurement ISFET is immersed in baseline solution or the sample, depending on a switchable flow. Under a continuous flow, sample solution could be measured in <120 s with a wide detection range (pH 1.68–10.0). Though the authors reported 2.0 mL sample consumption per measurement due to filling and flushing the external tubing and syringe pumps, the dimensions of the microfluidic chip suggest the detection volume was <14 µL, a value that can be compared with other papers.
2.2. Appearance Test (Optical Clarity Test)
In general, only a clear and colorless, particulate-free solution should be used for injection. Formulated PET and SPECT tracers are generally colorless due to the lack of appreciable absorbance by the tiny amounts of tracer used (e.g., pmol to nmol for a ~370 MBq (10 mCi) single patient dose of a 18F-labeled PET tracer, or nmol to µmol for a >37 GBq (>1 Ci) multi-dose batch). Any coloration would indicate a significant quantity of an impurity. Generally, the test is performed manually, via qualitative visual inspection, resulting in variability in the readout.
Using the same microfluidic device as described above for pH testing, Tarn et al. reported automation of a quantitative optical clarity test for [18F]FDG [31]. A non-clear sample could be detected when the absorbance exceeded that of a reference solution (water). Though this appears to be the only microfluidic implementation of the appearance test applied specifically to the analysis of radiopharmaceuticals, it is likely that any of the other strategies described above based on optical absorbance could also be used to implement a miniature optical clarity test based on the same principle.
2.3. Sterility Test
According to the FDA document “current good manufacturing practice for PET drugs” [43], even if care is taken to minimize microbiological contamination during synthesis, a drug is considered to be nonsterile until it is passed through a sterilizing grade filter. Generally, radiopharmaceutical production can use commercially available, pre-sterilized filters, provided that the vendor has been shown to be reliable and the filter meets certain specifications. Conventionally, sterility is assessed by inoculating the filtered sample into two types of culture media (soybean-casein digest medium (SCDM) to culture aerobic bacteria and fungi, and fluid thioglycollate medium (FTM) to culture anaerobic bacteria), incubating for ≥14 days, and then looking for formation of colonies [44]. However, because this timeframe is much longer than the half-life of SPECT and PET radioisotopes, the FDA allows a quick, short-term test to be used to enable early release of the radiotracer (though the culture test must still be completed). In the short-term test, the integrity of the filter membrane is assessed (typically via a bubble point test) after completing sterile filtration. In this test, compressed gas is applied to the inlet of the wetted filter and pressure is increased until bubbling appears at the outlet (i.e., the bubble point). If the bubble point exceeds a threshold pressure, then it can be assured that the membrane is intact and pores do not exceed the specified size. A drawback of this test is that the operator has to manually handle the filter membrane and it has been reported that this test results in the largest radiation dose to QC personnel [18].
Although not yet demonstrated specifically for the analysis of radiopharmaceuticals, microfluidics may provide a way to directly assess sterility in a much shorter time than 14 days, and potentially obviate the need for the bubble point test. In the conventional culture test, the long duration is essentially needed for amplification, i.e., to allow many cycles of growth, such that any bacterial colonies could be detected visually. This growth amplification step could be omitted for high-sensitivity microfluidic approaches that enable direct detection of individual microorganisms in liquids [45].
A large number of reports (reviewed in [45,46,47,48]) have demonstrated the detection of small numbers of bacteria (even single cells). Some strategies rely on PCR amplification of specific DNA sequences, or sensitive assays of specific surface antigens or metabolites. In one example, Jung et al. reported an integrated microfluidic device capable of detection and identification of as few as 1 colony-forming unit (CFU) in a 10 µL sample via a sandwich-type assay within 30 min [49]. In the assay, bacteria are bound by two types of particles functionalized with antibodies that target the bacteria. The magnetic particles allow the bacteria to be immobilized using a magnetic field while unbound particles were washed away, and then “barcode” DNA was released from the other particle for analysis by an electrophoretic separation and detection unit. Despite impressive sensitivity and operation speed, such methods may not be suitable for QC testing of radiopharmaceuticals because they detect only the specifically-targeted pathogens rather than all pathogens.
This can be partially addressed by incorporating certain types of “universal” PCR primers or bacterial stains that target broad classes of pathogens. For example, Lantz et al. reported a high-sensitivity microfluidic device capable of detecting diverse bacteria and fungi down to the single cell level [50]. The sample was stained with the dye BacLight Green, then a series of plugs (sample, buffer, and “blocking agent”) were injected into a capillary/channel causing aggregation of cells when electrophoretic potential was applied (Figure 3A). The concentration process, combined with fluorescence measurement over a 10 min integration time resulted in high detection sensitivity.
Rather than relying on specific biochemical markers, other rapid approaches for bacterial detection have been reported that are based on detection of physical properties such as electrical impedance of single cells (reviewed in [51,52]). In impedance-based flow cytometry, the sample solution is focused down into a narrow channel containing a detector such that at most only one cell at a time flows over a region with detection electrodes. When there is a cell within the detection region, the impedance differs from that of the buffer due to capacitance of the cell membrane and possibly differing resistance of the cell contents. Haandbæk et al. reported a resonance-enhanced microfluidic impedance cytometer for detection of single bacteria (Figure 3B) [53]. After focusing cells to the center of the channel via dielectrophoresis (DEP), bacterial cells passing over downstream electrodes were detected and characterized by frequency and phase shifts an electrical resonator. With the sample flowing at a speed of 0.5 µL/min, the system was able to detect single particles as small as 0.9 µm in diameter, as well as distinguishing different sizes and types (bacteria or polymer bead) of particles.
Though extensive validation and other work would be needed, it seems that microfluidic approaches like impedance cytometry might be capable of performing a rapid sterility test by counting the number of bacterial cells in a sample if throughput can be increased to measure a sufficiently large representative sample (e.g., 100 µL) of the radiopharmaceutical formulation without compromising detection sensitivity. If such a technique could be realized, there would potentially be no need for the filter integrity test.
2.4. Bacterial Endotoxin Test
Bacterial endotoxins, lipopolysaccharides (LPS), are toxic components of the outer membrane of gram-negative bacteria that can cause fever and possibly leukopenia in immunosuppressed patients [17]. Because endotoxins can contaminate a solution even if the bacteria have been thoroughly removed via sterile filtration, it is necessary to test radiopharmaceutical formulations for their presence. According to the USP Bacterial Endotoxins Test (General Chapter <85>) [54], the maximum allowable endotoxin level in radiopharmaceutical injections is 175 EU/V, where V is the maximum volume (mL) of drug administered at the time of expiration (1 EU = 100 pg of Escherichia coli LPS). The conventional test for bacterial endotoxins is based on a multi-step biochemical pathway leading to activation of a clotting enzyme that occurs when bacterial endotoxins are mixed with Limulus amebocyte lysate (LAL) derived from blood cells of horseshoe crabs (Limulus polyphemus or Tachypleus tridentatus) [55]. The enzyme acts on a coagulogen to create a “clot” in the test sample (“gel clot method”) or to increase its turbidity which can be optically detected (“turbidimetric method”). Alternatively, if a chromogenic substrate is added, a color change can be detected (“chromogenic method”). The timescale of clotting, turbidity increase, or color change is related to the endotoxin concentration. Several commercial reagent kits and test instruments are currently available and are routinely used in QC testing of radiopharmaceuticals [55].
One of these commercial systems (EndoSafe, Charles River Laboratories, Wilmington, MA, USA), already in widespread use in testing of radiopharmaceutical formulations, performs a small-scale version of the chromogenic assay in 15 min using disposable ~25 mm × 75 mm microfluidic cartridges pre-loaded with reagents (Figure 4A) [56]. In this system, a 25 µL sample is loaded on the cartridge, mixed with the LAL reagent and then combined with the chromogenic substrate, incubated, and finally the color intensity is measured over time via a small handheld spectrophotometer-based reader. This system can detect down to 0.005–10 EU/mL. Though not specifically applied to radiopharmaceutical analysis, one group demonstrated a similar assay in a microfluidic chip (18 mm × 62 mm) made of PDMS (Figure 4B) [57]. After mixing the sample with reagents outside the chip, a 4 µL sample was injected and result could be obtained after 10 min. To match the capabilities of the EndoSafe device, the PDMS chip would have to be modified to include analysis of a replicate as well as positive controls.
Miao et al. reported an electrochemical approach that replaced the optical readout of the standard gel clot assay with an electrical readout [58]. Millimeter-sized screen-printed electrodes were inserted in a small volume of a mixture of the sample and LAL reagent (270 µL) at 37 °C and the electrical current was monitored over time (Figure 4C). Onset of gel clotting resulted in a rapid drop in current, the timing of which could be correlated with endoxtoxin concentration. Response time was fast (<100 s) and a detection limit of 0.03 EU/mL was reported.
In addition to miniaturized versions of the standard LAL assay, there has been considerable development of new approaches, including modifications to the standard assay to improve sensitivity, as well as miniature biosensors that detect endotoxins based on binding with surface-immobilized biomolecules (recently reviewed in [55]).
For example, Noda et al. a reported a modified LAL assay in which the coagulogen was replaced with a luciferin-modified peptide (benzoyl-Leu-Gly-Arg-aminoluciferin) [59]. When this substrate becomes activated by the LAL cascade (i.e., in the presence of endotoxin), the reaction with luciferase produces luminescence, allowing very sensitive detection. A detection limit of 0.0005 EU/mL was reported in an assay time of 15 min. Though such high sensitivity is not strictly necessary, it may provide the capability to use a smaller sample volume.
Sensor-based methods rely on detection of endotoxin binding, and can produce a signal via fluorescence or luminescence assays, electrical impedance, electrochemical reactions, or mechanical resonators. Though many of the approaches require lengthy procedures to modify/derivatize the LPS prior to detection or have poor sensitivity, there are a few approaches that appear sufficiently fast and sensitive for QC testing of radiopharmacuticals. For example, Su et al. demonstrated an impedance-based readout with a detection limit of 0.05 EU/mL within 10 min [60]. The electrochemical biosensor comprised a gold electrode functionalized with an LPS-specific single stranded DNA (ssDNA) aptamer as a probe (Figure 4D). A good linear relationship between charge-transfer resistance and logarithm of LPS concentration was demonstrated over a wide dynamic range (0.01–10 EU/mL). As surface binding sensors are often prone to fouling, non-specific binding, or sensitivity to sample matrix, a thorough characterization of these factors and validation of the testing method would be required.
Finally, detection of endotoxins has also been reported using miniaturized chromatography methods. Makszin et al. used microchip electrophoresis (MCE) to separate and detect S-and R-type endotoxin components conjugated with fluorescence dyes. Separation took ~1 min and the limits of detection were 2.6 and 6.9 ng for the S- and R-type endotoxins [61]. Despite sensitive quantitation, the method required significant off-chip processing to perform the conjugation step.
To summarize, there already exist miniaturized methods validated for performing endotoxin testing of radiopharmaceutical formulations. Many other approaches have also been developed for endotoxin testing in other applications, which may offer advantages of speed, reagent cost, or convenience of readout if applied to radiopharmaceutical samples.
2.5. Chemical Purity and Identity
Chemical purity refers to absence of non-radioactive impurities in the formulated PET or SPECT tracer, including side products as well as residues of other components used in the production process. The purpose of testing is to ensure that the purification process has reduced residual amounts of impurities to safe levels (i.e., below allowed limits). The required chemical purity tests for radiopharmaceuticals depends on particular synthesis method and only needs to assess reagents added and byproducts expected for the particular synthesis route and conditions.
Though, in rare cases, a specific impurity can be determined via a simplified test (e.g., see Kryptofix test, Section 2.6), impurities are typically determined by chromatographic techniques, i.e., by performing chemical separation prior to detection. For some SPECT and PET radiopharmaceuticals that are labeled by a chelation reaction, the most significant impurity is unlabeled radioisotope, which can be detected via radio-TLC to determine (see Section 2.10). In other cases, impurities are typically quantified using high performance liquid chromatography (HPLC) combined with ultraviolet (UV) absorbance detection (HPLC/UV) or sometimes other modalities such as pulsed amperometric detection. Recently, analysis of radio-pharmaceuticals has also been performed using ultra-high performance liquid chromatography (UHPLC or UPLC), offering the advantages of faster separation times and more compact separation columns [62,63]. The identity of each peak in the detected chromatogram is determined by comparison of retention time with reference standards, and the quantity is generally determined from the peak area. For known impurities, the amount present in the sample is compared with allowed regulatory limits. For unknown impurities, so long as the impurities are below the limit of observed adverse effects in preclinical toxicology studies, they may be safe for injection. More specifically, it is not required to identify all impurities if microdosing criteria are met, i.e., their total mass is <100 μg and if the injected dose contains <1% of the pharmacologically active dose (determined using the same formulation as used in preclinical studies).
Miniaturization of HPLC is one approach that could potentially be used for microscale implementation of the chemical purity test, though it has not yet been demonstrated for radiopharmaceuticals. In “microchip HPLC”, the HPLC column, and often elements of the injection valve, are integrated into a microfluidic chip. One implementation uses trapped cylindrical plugs of polymer monolith (formed by in situ polymerization) that slide within cylindrical glass microchannels to inject samples into the on-chip polymer monolith column [64] (Figure 5A). Another implementation that has been commercialized (HPLC-chip, Agilent, Santa Clarita, CA, USA) includes an integrated micro-rotary injection valve with sample enrichment column serving as the injection loop. In this setup samples are injected into an integrated column, flowing to a downstream electrospray emitter to nebulize and transfer the sample to a mass spectrometric detector [65] (Figure 5B). A recent review discusses the wide range of available microchip HPLC systems [66]. With chip-based HPLC, sample volume and separation time are significantly reduced (usually nL to µL), as is the physical size of the separation medium. However, chip-based HPLC systems still rely on bulky instruments that house the high-pressure pumping system, injection valve actuator, and detection modules, though efforts are underway to shrink these other components as well [66,67].
Capillary electrophoresis (CE) is another separation method in which a sample is driven through a separation medium by application of an electric field. Species are separated based on electrophoretic mobility in the separation buffer, and sometimes based on additional interactions with functionalized particles within the capillary (capillary electrochromatography, CEC) or by partitioning of analytes between micelles and surrounding buffer (micellar electrokinetic chromatography, MEKC). Unlike HPLC, CE can readily be miniaturized into microfluidic chips that are simple to fabricate and operate without the need for high-pressure pumps [68,69,70]. Additionally, CE exhibits high separation resolution and can achieve high detection sensitivity, and has been employed in diverse applications such as protein separation and pharmaceutical analysis [71,72,73]. By replacing conventional HPLC methods with microchip electrophoresis (MCE), there is much potential to significantly reduce the size, cost, and complexity of chemical purity testing systems in the future. Furthermore, sample volume is generally reduced by orders of magnitude, and very short analysis times (seconds) have been reported [68,74,75].
While there are numerous examples of MCE employed for pharmaceutical analysis [73,76], there have been very few examples of CE methods, and no examples of MCE methods, applied to the analysis of radiopharmaceuticals. Separation and detection of 99mTc-labeled SPECT compounds has been performed with capillary zone electrophoresis and isotachophoresis [77,78,79,80,81], and use of CE has been suggested for analysis of PET tracers in a patent application [30]. Recently, using the PET tracers [18F]FLT and [18F]FAC as model systems, our group explored the feasibility of using micellar electrokinetic chromatography (MEKC) to separate neutral tracers from neutral impurities, and showed comparable separation and limit of detection as HPLC/UV [82]. We further showed that the system could be implemented as a hybrid MCE device (unpublished work), and that baseline separation of FLT from its known impurities and very repeatable injections could be achieved using only 4 nL of sample (Figure 5C) [74].
While our work has focused on detection via UV absorbance as a proof of concept, additional modes of detection can be implemented using techniques reported in the literature for pulsed amperometric detection [83], capacitively coupled contactless conductivity detection (C4D) [84,85,86], refractive index detection [87], or mass spectrometry [88,89]. For analysis of certain radiopharmaceuticals or impurities (e.g., with low UV absorbance), such alternative detection modes may be essential.
Efforts to miniaturize chemical purity testing for radiopharmaceuticals are just beginning, but chip-HPLC or MCE could provide a means to analyze a wide variety of PET and SPECT tracers with high sensitivity and separation resolution.
2.6. Kryptofix 2.2.2 (K222)
2,2,2-Cryptand or 4,7,13,16,21,24-hexaoxa-1,10-diazabicyclo [8.8.8]hexacosane, also known by its commercial name Kryptofix 2.2.2 (K222), is frequently used as a phase transfer catalyst in the manufacture of 18F-labeled PET tracers. Radiopharmaceutical formulations must be analyzed for residual amounts of K222 before human application due to its toxicity. The limit specified in the US Pharmacopoeia (USP) is <50 µg/mL and EP limit is 2.2 mg/V (i.e., per patient). Most commonly, residual K222 is assessed qualitatively via a TLC method in which the size and intensity of spot of K222 from the sample solution should not exceed (by visual observation) that of a spotted reference solution [90]. Another method uses a spot test in conjunction with iodoplatinate indicator, and can be completed in 5 min (compared to 30 min for the TLC test) [91]. As with any colorimetric test, there is some risk of non-specific interactions that could interfere with the test result. For example, the spot test is sensitive to tertiary amines, which may be present in the radiotracer itself or impurities, potentially leading to false positives. To avoid such issues, K222 is sometimes analyzed after chromatographic separation. Reports have shown that K222 can be detected via gas chromatography (GC) with a nitrogen detector [92], liquid chromatography with mass spectrometric (MS) detector (LC/MS [93,94] or UPLC/MS [95]) or HPLC with a UV detector (HPLC/UV) with post-column and pre-column derivatization [96].
Efforts to miniaturize indicator-based tests for radiopharmaceuticals in microfluidic chips have been reported. For example, the group at the University of Hull reported the on-chip optical absorbance-based detection of K222 by first mixing the sample with iodoplatinate reagent then loading the sample into a microchannel [97,98]. The later report indicates a limit of detection of 28 ppm. Presumably this approach could be combined with an on-chip mixer, and could leverage approaches for high-sensitivity optical detection systems (see Section 2.1) to further improve sensitivity.
Other colorimetric K222 indicator chemistries can likely be used in microfluidic devices as well. Anzellotti et al. reported an evaluation of the I2/I− indicator for testing PET radiopharmaceuticals and suggested that it could be used to test sample volumes as low as 2–25 µL [99]. Experiments showed that the color change occurred within 1–2 s, and that the indicator was unaffected by the presence of several salts or amine-containing PET tracers in the formulation.
Alternatively, the K222 test could potentially be implemented in miniaturized form using microscale chromatographic approaches. For example, we have shown, using capillary electrophoresis, that K222 could be separated from FLT and several impurities and identified and quantified in <2 min [82], though miniaturized detection in an MCE device has not yet been demonstrated.
Although initial efforts have been made to miniaturize the K222 test for radiopharmaceuticals, further development is needed to demonstrate reliability and ease of use for implementation in a radiopharmaceutical QC facility.
2.7. Residual Organic Solvents
Residual solvents in the final formulation could exhibit a variety of toxic effects and the remaining amounts of all solvents used during the synthesis and purification process must be monitored to ensure residual amounts are below safe limits. Typically this test is needed for PET tracers, but often can be omitted for SPECT tracers when produced under aqueous reaction conditions. There is clear guidance on the limits for many possible solvents [100]. For the commonly used class 2 solvents acetonitrile (MeCN), dichloromethane (DCM), and N,N-dimethylformamide (DMF), the allowed limits are 4.1 mg/day (410 ppm), 6 mg/day (600 ppm) and 8.8 mg/day (880 ppm), respectively. Class 3 solvents such as ethanol (EtOH) and dimethylsulfoxide (DMSO) have much lower toxicity, and up to 50 mg/day (5000 ppm, 50 mg/V) is allowed for each. Typically, residual solvents are assessed using gas chromatography (GC) in conjunction with a flame ionization detector. Testing can also be performed via HPLC in conjunction with a refractive index detector [21,101].
For the particular application of radiopharmaceutical analysis, a recent preliminary study suggests that residual solvent impurities might be quantified via raman spectroscopy in a glass microfluidic flow cell [102], though details of the method and its performance have not yet been published. A patent application also mentions the possibility to detect solvents in radiopharmaceuticals via a gas sensor microarray (“electronic nose”) [103] microelectromechanical systems (MEMS) device, though details are not described [104]. While, in principle, it seems possible that residual solvents could also be assessed via chip-HPLC systems [66,67] (e.g., with RI detection) or microscale GC systems [105,106], these approaches have not yet been demonstrated.
Further development is therefore needed to implement a reliable microfluidic detection method for organic solvents with the required performance for testing of radiopharmaceuticals.
2.8. Radioactivity Measurement (Radioactivity Concentration)
The concentration of radioactivity in every batch of the final drug preparation at the end of synthesis (EOS) must be measured [10]. This value is needed to determine how much volume to dispense for each individual patient dose (decay-corrected to the expected time of injection). The total amount of radioactivity in the vial containing the final drug preparation is usually measured using a calibrated dose calibrator. In order to determine the concentration, a known volume of the final drug preparation is withdrawn into a syringe, the activity of the syringe is measured, and the concentration then calculated.
To miniaturize this test, the sample can be loaded into a microfluidic channel placed in close proximity to a compact radiation detector. Taggart et al. have shown that a small array of silicon photomultipliers (SiPMs) could measure the radioactivity in a sample of PET or SPECT radiotracers ([18F]FDG, [68Ga]gallium citrate, [99mTc]pertechnetate) contained in an adjacent 40 µL serpentine microchannel after stopping the flow (Figure 6A) [107]. The effect of different microfluidic chip materials and substrate thicknesses were investigated. In their optimized device, good linearity was observed for the PET tracers over a range of ~0.01 to 100 MBq total activity, though upper and lower limits were not reported. The signal for the SPECT tracer required longer integration time to obtain a reliable reading. Convert et al. have demonstrated a miniaturized device for a slightly different application: Measuring the radioactivity concentration in the blood of a rodent model for pharmacokinetic analysis of PET and SPECT radiotracers [108]. To maximize detection efficiency, a polymeric microfluidic device with a 0.7 µL microchannel was bonded directly on top of a commercial unpackaged 300 µm thick silicon PIN photodiode, with only 9 µm separation between the sample and detector (Figure 6B). Limits of detection were not reported, but absolute detection efficiency of the microfluidic geometry was significantly higher compared to a capillary-based setup, and detection efficiencies were close to the theoretical maximum for 11C- and 18F-decay events (47% and 39%, respectively, compared to 50% theoretical maximum), due to the high efficiency of direct positron detection. Dooraghi et al. reported radiation measurement of [18F]fluoride and [18F]FDG solutions in capillary tubing or a microchannel to calibrate an automated aliquoting / dose-dispensing system [109]. The detector comprised two 3 mm × 30 mm silicon PIN diodes at different distances from the sample such that the closest detector was sensitive primarily to positron interactions, while the further detector allowed measurement and subtraction of background gamma interactions (Figure 6C). The dynamic range of detectable activity was measured to be 0.74–4400 kBq/µL (0.02–120 µCi/µL) and 0.01–105 MBq/µL (0.3–2830 µCi/µL) for the high- and low-gain electronics configurations, respectively.
Additional compact radiation detection methods have been reported for applications that require a higher degree of spatial information about the radioactivity distribution of positron-emitting samples, but presumably these could be adapted to measure the radioactivity concentration in sample of a formulated PET radiopharmaceutical.
Cho et al. reported a system in which a scintillator was placed in close proximity to a PDMS microfluidic chip and scintillation light from positron interactions was detected with a CCD camera [110,118] (Figure 6D) Preliminary studies showed that this imaging device is capable of discerning line pairs of printed [18F]FDG solution with separation as low as 300–500 µm and quantifying the activity concentration reliably down to 1.48 Bq/mm2 (40 pCi/mm2) or 13.32 Bq/mm2 (360 pCi/mm2) in 5 min with the use of CsI or plastic scintillators, respectively. Pratx et al. reported a different scintillation-based approach known as radioluminescence microscopy [119] in which the sample was placed on a thin scintillator plate, and light produced by positron decay events was measured using a high-sensitivity microscope (Figure 6E). The spatial resolution, measured using a dried droplet of [18F]FDG (370 MBq), was estimated to be 5 µm FWHM, and the minimum detectable activity density was 150 Bq/mm2 (4 nCi/mm2). The high sensitivity allowed detection of [18F]FDG uptake in single cells. The maximum detectable activity was not specified.
Cho et al. demonstrated an additional measurement technique in collaboration with our group: a sensitive CCD camera was used to detect the Cerenkov radiation emitted as energetic positrons from the sample travel through the surrounding medium [112,120] (Figure 6F). Using solutions of [18F]fluoride and [18F]FDG, the system dynamic range was found to be 7.03–2740 kBq/mm2 (0.19–742 μCi/mm2) for 5 min acquisitions, though the upper end of the dynamic range could be further improved by using a shorter camera acquisition time and a smaller lens aperture setting, if necessary. The spatial resolution of Cerenkov image was found to be ~200 µm.
Dooraghi et al. developed a system based on direct positron detection using a position-sensitive avalanche photodiode (PSAPD) (Figure 6G) [113]. In a PSAPD, the interaction of a positron creates an electron-hole pair that is amplified by an avalanche affect due to an applied bias across the device, allowing positron interactions to be easily distinguished from thermal noise. Furthermore, a 4-point detector allows localization of the detection event across the substrate. The sample is contained in a chamber on a PDMS microfluidic chip with 50 µm thick PDMS substrate separating the fluid from the detector. For 18F-containing solutions, the lower detection limit was measured to be 0.5 Bq/mm2 (~14 pCi/mm2) for a 1 min acquisition and 62 × 62 μm pixel size. The same device has been used to quantify activity in single cells [121]. The upper count rate limit was 21,000 cps (~46 kBq). The spatial resolution ranged from 0.4 mm FWHM at the center of the field of view (FOV), and 1 mm at a distance of 5 mm away from center.
Tarn et al. have demonstrated the use of the commercially available miniaturized positron sensor array (Medipix2, Medipix Collaboration) with a pixel size of 55 µm × 55 µm and overall detector size of 14 mm × 14 mm (65 k pixels) to measure activity of [68Ga]Ga-citrate solutions in Tygon tubing (709 nL detection volume, 254 µm sample to detector distance). Upper and lower detection limits were not reported but a linear response was observed over the range tested (0.05–100 MBq/mL). The detector was also used to measure the activity passing through a silica monolith (Figure 6H) [114] as described in Section 2.10. Maneuski et al. reported the use of a similar detector (Timepix) for measurement of activity in an adjacent tubing designed to measure the output of a UPLC system [122]. Though complete details of geometry were not provided, if the tubing is assumed to have a standard 1.6 mm (1/16″) outer diameter, then the distance from sample to detector is ~400 µm. Injected samples with concentration as low as 1 kBq/mL could be detected. Sensitivity was found to be much greater than several scintillation-based detectors.
Mapelli et al. have reported an interesting detector comprising a serpentine microfluidic channel filled with liquid scintillation material [115,123] (Figure 6I). Each path of the serpentine channel acts as an independent detector to convert radiation into light in one portion of the channel (via the liquid scintillator), and also as a liquid waveguide to guide this light to a distant photodetector in a non-irradiated portion of the device. The idea was to provide improved detector resolution and increased radiation resistance, while achieving efficient optical coupling throughout the system and potentially enable fabrication of low-cost, high-resolution detectors. The photoelectric yield of the chip was measured by exciting the liquid scintillator with electrons from an external collimated 90Sr source and found to be in the order of 1.65 photoelectrons per minimum ionizing particles (MIP) for 200 µm deep microchannels. Presumably this device could be used to measure the activity of radiopharmaceutical samples loaded into an adjacent microfluidic chip.
Another technique that has been used to analyze compounds labeled with C-11, Ga-68, or F-18 in microfluidic channels is autoradiography (Figure 6J) [116,117]. Laven et al. did not report the detection limit but reported good linearity in the range of ~10–180 Bq. The need to first expose then image the phosphorimaging plates could make this approach too slow and impractical for an automated QC testing system, and too bulky for microscale implementation.
The examples described here represent a wide variety of detection approaches that may be suitable for measuring radioactivity in microchannels. With further development, it is likely that several of these approaches could provide a compact means to perform radioactivity measurements for the radioactivity test (as well as some of the tests below).
2.9. Radionuclidic Purity and Identity
The radionuclidic purity is the ratio of the desired radionuclide activity to the total activity. The purpose of testing is to ensure that the radiopharmaceutical is not contaminated with other radionuclides, that could make the resulting PET/SPECT images difficult to interpret, or, in the case of long-lived isotopes, could cause harm to the patient. For example, SPECT and PET tracers labeled with generator-produced radionuclides can contain contamination by radioactive parent compounds. In general, the radionuclidic identity can be confirmed by measuring the half-life of the product, and the radionuclidic purity can be measured by a gamma spectrometer with a multichannel analyzer (e.g., based on sodium iodide scintillation detector or high-purity germanium detector). The half-life is determined by taking at least 3 radioactivity measurements of a sample using a dose calibrator (with the same geometry for each measurement), and then calculating half-life via a nonlinear fit to the radioactivity decay equation [17]. For highest accuracy, the measurements should be carried out as far apart in time as practical. The radionuclidic purity is determined by obtaining a gamma spectrum of the sample, and matching this spectrum (after background spectrum is subtracted) to the expected energy spectrum. Each radionuclide has a characteristic gamma spectrum; for example, positron-emitting isotopes in PET tracers have a peak at 0.511 MeV due to positron annihilation, plus additional peaks corresponding to other decay modes, if applicable. Since some positron emitters have a very short half-life, the USP and EP allow PET radiopharmaceuticals to be released before the radionuclidic identity test is completed on each batch, in which case periodic tests of samples prepared in the same way would be necessary.
The half-life test can be miniaturized using an integrated radiation detector to measure the radioactivity of a sample in a microchannel in a consistent geometry multiple times. Taggart et al. used their SiPM array platform to measure not only the radioactivity concentration as described above but also the half-life of microfluidic samples [107]. Accurate half-life measurements were achieved for [18F]fluoride and [18F]FDG solutions based on 5 min measurements taken over a time period of several hours, but reliable values could not be obtained for calculations based on shorter measurements (e.g., 30–60 s) taken over a more realistic 20 min timespan without constraining the exponential fit. It is possible that performance could be improved with further optimization. In addition, any of the microscale radiation detection approaches described in Section 2.8, depending on activity level and geometry of the sample, could be considered for microscale implementation of the half-life test.
To the best of our knowledge, a microscale implementation of the radiouclidic purity test has not yet been demonstrated, though perhaps a microscale gamma spectrometer could be implemented using similar technologies to those discussed in Section 2.8, provided the radiation detector has adequate energy resolution.
2.10. Radiochemical Purity and Identity
The radiochemical identity of a positron-emitting radiopharmaceutical is generally determined after chromatographic separation by determining the retention time (radio-HPLC), retardation factor (radio-TLC), or migration time (radio-CE) of the main radioactivity peak (corresponding to the radioactive product), and comparing to that of a reference standard to confirm structural identity of the radiopharmaceutical.
In addition to confirming the identity of the product, it is also necessary to ensure the absence of radioactive impurities. Radiochemical purity is defined as the ratio of the activity of the radionuclide concerned, which is present in the desired chemical form, to the total activity of that radionuclide present in the radiopharmaceutical preparation. Any radiochemical impurity can potentially affect the biodistribution of the radiopharmaceutical giving a misleading imaging result. In general, the radiochemical purity should be >95%, though in the case of [18F]FDG, USP specifies >90% as acceptable.
Typically, radiochemical identity and purity are determined via HPLC with a radiation detector positioned at the end of the column (radio-HPLC). While the same instrumentation can be used for the chemical purity test, the radiochemical identity and purity tests are often run on a sample that is spiked with a non-radioactive reference standard, while the chemical purity test is carried out on an unadulterated sample. The standard is used to confirm the radiochemical identity by matching retention times of the radiation and UV absorbance peaks in the chromatogram. In addition to radio-HPLC, analysis by radio-TLC may also be necessary for accurate determination of radiochemical purity since certain radioactive species such as [18F]fluoride can be under-represented in HPLC [124]. In the case of some PET and SPECT tracers labeled via chelation reactions, where only the product and non-chelated radionuclide are expected in the final formulation, radio-TLC may be sufficient (without radio-HPLC) for determination of purity.
Similar to the corresponding non-radioactive tests, there is interest in developing miniaturized versions of the radiochemical identity and purity tests due to the bulkiness of radio-HPLC, radio-TLC, and radio-CE systems. As discussed in Section 2.5, HPLC and CE can be miniaturized into chip-HPLC or MCE format, and potentially these techniques could be integrated with one of the compact radiation detection approaches described in Section 2.8 to measure the output of the separation column or separation channel, respectively. To the best of our knowledge, such integration has not yet been reported.
Some efforts have been made to replace traditional HPLC/UPLC radiation detectors with more compact detectors, which could be a step in this direction. For example, the Timepix detector reported by Maneuski et al. [122] was suitable for measurements at the output of a UPLC system and showed a wider dynamic range and improved sensitivity compared to a photomultiplier tube (PMT) detector with either CsF or BGO scintillator.
Tarn et al. have used a Medipix detector to detect radioactivity within a porous silica monolith embedded in tubing with the goal of real-time imaging of separation processes. The detected signal was higher for a sample of [68Ga]Ga-citrate passing through the monolith than the signal observed with a traditional radio-HPLC detector (NaI scintillator/PMT) positioned downstream in the tubing. In addition, the accumulation of activity could be measured as [68Ga]Ga3+ was trapped on the monolith, as could the reduction in activity when the monolith was eluted. Maneuski et al. also demonstrated the spatial imaging capabilities of the Timepix detector in the context of radiochemical separations. The radioactivity distribution along a conventional radio-TLC plate containing an unspecified 18F-labeled sample was measured with sub-mm resolution by placing it adjacent the detector [122]. Imaging of three parallel 18F-solution-containing tubes was also demonstrated, perhaps in anticipation of performing chromatographic separations in channels in the future. Spatially-resolved radiation detection was also mentioned in a patent by Hansteen et al. [30] to monitor separation of radiopharmaceuticals in a capillary to determine radiochemical purity, though details were not provided.
While some steps have been taken toward miniaturized implementation of radiochemical identity and purity tests, much development is still needed in this regard.
2.11. Molar Activity
Molar activity (often called “specific activity”) is a measure of the amount of radioactivity per molar amount of the radiopharmaceutical [3]. For certain radiopharmaceuticals, such as [18F]FDG, radiolabeled amino acids, or fatty acids that visualize metabolic processes, molar activity determination is not crucial since these radiotracers have natural physiologically abundant levels of nonradioactive counterparts in vivo, especially in circulation. However, for receptor-binding radiotracers, radiolabeled mAbs, and peptide hormone analogs, a relatively high molar activity is crucial. Conventionally, for most organic radiopharmaceuticals, the concentration (total number of moles per volume) is determined based on analytical HPLC after creating a calibration curve using known concentrations of an ultra-pure reference standard. If radioactivity concentration is also known, then molar activity can easily be calculated.
Though it has not been demonstrated, molar activity measurement can likely be miniaturized by combining aforementioned techniques for measuring concentration (chemical purity test, Section 2.5) and radioactivity concentration (radioactivity test, Section 2.8). High-sensitivity and accuracy will be needed to measure the concentration, as the molar amounts can be very small (e.g., pmol to nmol for 18F-labeled PET tracers).
3. Outlook
In this paper, we have reviewed various microfluidic implementations of the QC tests for PET and SPECT radiopharmaceuticals, or techniques that could potentially be implemented to perform these tests (summarized in Table 1). It is encouraging that viable approaches for ultra-compact implementation of many of the required tests have been demonstrated at least as a proof of concept. In some cases, the desired performance has already been demonstrated, and/or significant reductions in sample consumption have been reported.
However, in most cases, considerable development and optimization efforts will be needed to increase reliability, speed, sensitivity or other measures of performance up to the rigorous requirements of clinical testing. In addition, in cases where the method of detection is fundamentally changed (e.g., sterility testing based on counting of individual bacterial, assessment of chemical/radiochemical purity via new chromatographic approaches such as MCE, and detection of residual solvents via Raman spectroscopy or an “electronic nose”), extra efforts may be required to demonstrate equivalence (or superiority) to currently-accepted test methods.
Once individual tests have been perfected, efforts will be needed to integrate them into a unified system that performs all tests, data collection, and report generation in a fully-automated manner. Integrated systems with some degree of microfluidic elements have been suggested in patents and patent applications [30,104] and detailed implementations have recently been described [98,125]. One of the challenges is in forming fluidic interconnections among all devices and delivering aliquots of the sample to each one. The possibility to integrate sample distribution channels, sample channels/chambers and detectors into a single lab-on-a-chip device could minimize the overall fluidic complexity and potential failure points. Another challenge is in avoiding cross-contamination from one sample to the next, which may require extensive cleaning protocols and cleaning validation. However, because microfluidic elements can often be fabricated using very low-cost materials and methods, it may be possible to implement the tests using disposable fluid paths. Leveraging such features could eliminate the need for cleaning, and could reduce the required maintenance, further simplifying the testing process and overall QC testing platform.
If realized, integration of microscale QC tests on an automated platform would allow for unified QC system validation, eliminate operator-induced variation, significantly reduce radiation exposure to personnel, and streamline the overall workflow. As increasing numbers of the thousands of known tracers [126,127] move into the clinic, and as new technologies such as microfluidic systems enable more widespread production of tracers on demand [24,128,129,130], it will become increasingly important to have an integrate QC testing platform that simplifies and reduces the cost of QC testing.
Though we have focused on the special needs of radiopharmaceutical analysis, where sample volume and total duration are extremely limited, the methods described here could likely also be applied to the analysis of non-radioactive pharmaceuticals, and may offer significant advantages in terms of speed and cost.
Acknowledgments
Writing of this review was supported in part by the National Institute on Aging (grant R21 AG049918) and the National Cancer Institute (grant R21 CA212718).
Conflicts of Interest
The authors declare no conflict of interest.
References
- Mariani, G.; Bruselli, L.; Kuwert, T.; Kim, E.E.; Flotats, A.; Israel, O.; Dondi, M.; Watanabe, N. A review on the clinical uses of SPECT/CT. Eur. J. Nucl. Med. Mol. Imaging 2010, 37, 1959–1985. [Google Scholar] [CrossRef] [PubMed]
- Phelps, M.E. PET: Molecular Imaging and Its Biological Applications, 1st ed.; Springer Science & Business Media: Berlin, Germany, 2004; ISBN 0-387-40359-0. [Google Scholar]
- Phelps, M.E. PET: The Merging of Biology and Imaging into Molecular Imaging. J. Nucl. Med. 2000, 41, 661–681. [Google Scholar] [PubMed]
- Bansal, A.; Pandey, M.K.; Demirhan, Y.E.; Nesbitt, J.J.; Crespo-Diaz, R.J.; Terzic, A.; Behfar, A.; DeGrado, T.R. Novel 89Zr cell labeling approach for PET-based cell trafficking studies. EJNMMI Res. 2015, 5, 19. [Google Scholar] [CrossRef] [PubMed]
- Glaudemans, A.W.J.M.; de Vries, E.F.J.; Galli, F.; Dierckx, R.A.J.O.; Slart, R.H.J.A.; Signore, A. The Use of 18F-FDG-PET/CT for Diagnosis and Treatment Monitoring of Inflammatory and Infectious Diseases. Clin. Dev. Immunol. 2013, 2013, 1–14. [Google Scholar] [CrossRef] [PubMed]
- Buckingham, F.; Kirjavainen, A.K.; Forsback, S.; Krzyczmonik, A.; Keller, T.; Newington, I.M.; Glaser, M.; Luthra, S.K.; Solin, O.; Gouverneur, V. Organomediated Enantioselective 18F Fluorination for PET Applications. Angew. Chem. Int. Ed. 2015, 54, 13366–13369. [Google Scholar] [CrossRef] [PubMed]
- Bailey, D.L.; Willowson, K.P. An Evidence-Based Review of Quantitative SPECT Imaging and Potential Clinical Applications. J. Nucl. Med. 2013, 54, 83–89. [Google Scholar] [CrossRef] [PubMed]
- Jackson, I.M.; Scott, P.J.H.; Thompson, S. Clinical Applications of Radiolabeled Peptides for PET. Semin. Nucl. Med. 2017, 47, 493–523. [Google Scholar] [CrossRef] [PubMed]
- Khalil, M.M.; Tremoleda, J.L.; Bayomy, T.B.; Gsell, W. Molecular SPECT Imaging: An Overview. Available online: https://www.hindawi.com/journals/ijmi/2011/796025/abs/ (accessed on 19 August 2017).
- Fermi, E. Quality Control of PET Radiopharmaceuticals. In Molecular Imaging: Radiopharmaceuticals for PET and SPECT; Springer: Berlin/Heidelberg, Germany, 2009; pp. 197–204. ISBN 978-3-540-76734-3. [Google Scholar]
- Scott, P.J.H.; Hockley, B.G. Radiochemical Syntheses, Radiopharmaceuticals for Positron Emission Tomography; John Wiley & Sons: Hoboken, NJ, USA, 2011; ISBN 978-1-118-14033-8. [Google Scholar]
- U.S. Pharmacopeia (USP). General Chapter <823>: Positron Emission Tomography Drugs for Compounding, Investigation, and Research Uses; USP: Rockville, MD, USA, 2011. [Google Scholar]
- CFR-Code of Federal Regulations Title 21. Available online: http://www.accessdata.fda.gov/scripts/cdrh/cfdocs/cfcfr/CFRSearch.cfm (accessed on 30 June 2013).
- European Directorate for the Quality of Medicines & Healthcare. Technical Guide for the Elaboration of Monographs on Radiopharmaceutical Preparations; European Directorate for the Quality of Medicines & Healthcare: Strasbourg, France, 2010. [Google Scholar]
- Hung, J.C. Comparison of Various Requirements of the Quality Assurance Procedures for 18F-FDG Injection. J. Nucl. Med. 2002, 43, 1495–1506. [Google Scholar] [PubMed]
- Yu, S. Review of 18F-FDG synthesis and quality control. Biomed. Imaging Interv. J. 2006, 2, e57. [Google Scholar] [CrossRef] [PubMed]
- Lodi, F.; Boschi, S. Quality Control of PET Radiopharmaceuticals. In Basic Science of PET Imaging; Springer: Cham, Switzerland, 2017; pp. 105–126. ISBN 978-3-319-40068-6. [Google Scholar]
- Ferguson, D.; McGrath, S.; O’Hara, G.; Marshall, C. Investigation of staff finger doses during quality control of FDG production. Health Phys. 2011, 100, 523–529. [Google Scholar] [CrossRef] [PubMed]
- QC1. Automatic Quality Control for PET and MI Tracers. Available online: http://www.qc1.com/ (accessed on 1 December 2012).
- Trace-Ability Inc. SBIR Source. Available online: http://sbirsource.com/sbir/firms/26162-trace-ability-inc (accessed on 26 December 2015).
- Anzellotti, A.I.; McFarland, A.R.; Ferguson, D.; Olson, K.F. Towards the Full Automation of QC Release Tests for [18F] fluoride-labeled Radiotracers. Curr. Org. Chem. 2013, 17, 2153–2158. [Google Scholar] [CrossRef]
- Awasthi, V.; Watson, J.; Gali, H.; Matlock, G.; McFarland, A.; Bailey, J.; Anzellotti, A. A “dose on demand” Biomarker Generator for automated production of [18F] F- and [18F]FDG. Appl. Radiat. Isot. 2014, 89, 167–175. [Google Scholar] [CrossRef] [PubMed]
- Elizarov, A.M.; van Dam, R.M.; Shin, Y.S.; Kolb, H.C.; Padgett, H.C.; Stout, D.; Shu, J.; Huang, J.; Daridon, A.; Heath, J.R. Design and Optimization of Coin-Shaped Microreactor Chips for PET Radiopharmaceutical Synthesis. J. Nucl. Med. 2010, 51, 282–287. [Google Scholar] [CrossRef] [PubMed]
- Rensch, C.; Jackson, A.; Lindner, S.; Salvamoser, R.; Samper, V.; Riese, S.; Bartenstein, P.; Wängler, C.; Wängler, B. Microfluidics: A Groundbreaking Technology for PET Tracer Production? Molecules 2013, 18, 7930–7956. [Google Scholar] [CrossRef] [PubMed]
- Pascali, G.; Watts, P.; Salvadori, P. Microfluidics in radiopharmaceutical chemistry. Nucl. Med. Biol. 2013, 40, 776–787. [Google Scholar] [CrossRef] [PubMed]
- Keng, P.Y.; van Dam, R.M. Digital Microfluidics: A New Paradigm for Radiochemistry. Mol. Imaging 2015, 14, 579–594. [Google Scholar]
- Chao, P.H.; Collins, J.; Argus, J.P.; Tseng, W.-Y.; Lee, J.T.; van Dam, R.M. Automatic concentration and reformulation of PET tracers via microfluidic membrane distillation. Lab Chip 2017, 17, 1802–1816. [Google Scholar] [CrossRef] [PubMed]
- Whitesides, G.M. The origins and the future of microfluidics. Nature 2006, 442, 368–373. [Google Scholar] [CrossRef] [PubMed]
- Pascali, G.; Nannavecchia, G.; Pitzianti, S.; Salvadori, P.A. Dose-on-demand of diverse 18F-fluorocholine derivatives through a two-step microfluidic approach. Nucl. Med. Biol. 2011, 38, 637–644. [Google Scholar] [CrossRef] [PubMed]
- Hansteen, O.H.; Jakobsen, J.B.; Lindgaard, S.-E.; Franci, X.; Roed, L.; Andersen, A.; Johansen, G.; Knuttel, T.; Langseth, K.M. Quality Control Devices and Methods for Radiopharmaceuticals. U.S. Patent 9291606, 22 March 2016. [Google Scholar]
- Tarn, M.D.; Isu, A.; Archibald, S.J.; Pamme, N. On-chip absorbance spectroscopy for the determination of optical clarity and pH for the quality control testing of [18F] FDG radiotracer. In Proceedings of the 18th International Conference on Miniaturized Systems for Chemistry and Life Sciences, San Antonio, TX, 26–30 October 2014; pp. 1077–1079. [Google Scholar]
- Rushworth, C.M.; Davies, J.; Cabral, J.T.; Dolan, P.R.; Smith, J.M.; Vallance, C. Cavity-enhanced optical methods for online microfluidic analysis. Chem. Phys. Lett. 2012, 554, 1–14. [Google Scholar] [CrossRef]
- Khan, M.I.; Mukherjee, K.; Shoukat, R.; Dong, H. A review on pH sensitive materials for sensors and detection methods. Microsyst. Technol. 2017, 23, 4391–4404. [Google Scholar] [CrossRef]
- Maruyama, H.; Arai, F.; Fukuda, T. On-chip pH measurement using functionalized gel-microbeads positioned by optical tweezers. Lab Chip 2008, 8, 346–351. [Google Scholar] [CrossRef] [PubMed]
- Maclin, A.Q.; Kim, M.D.; Dergunov, S.A.; Pinkhassik, E.; Lindner, E. Small-Volume pH Sensing with a Capillary Optode Utilizing Dye-Loaded Porous Nanocapsules in a Hydrogel Matrix. Electroanalysis 2015, 27, 733–744. [Google Scholar] [CrossRef]
- Mela, P.; Onclin, S.; Goedbloed, M.H.; Levi, S.; García-Parajó, M.F.; van Hulst, N.F.; Ravoo, B.J.; Reinhoudt, D.N.; van den Berg, A. Monolayer-functionalized microfluidics devices for optical sensing of acidity. Lab Chip 2005, 5, 163–170. [Google Scholar] [CrossRef] [PubMed]
- Florea, L.; Fay, C.; Lahiff, E.; Phelan, T.; O’Connor, N.E.; Corcoran, B.; Diamond, D.; Benito-Lopez, F. Dynamic pH mapping in microfluidic devices by integrating adaptive coatings based on polyaniline with colorimetric imaging techniques. Lab Chip 2013, 13, 1079–1085. [Google Scholar] [CrossRef] [PubMed] [Green Version]
- Richter, A.; Paschew, G.; Klatt, S.; Lienig, J.; Arndt, K.-F.; Adler, H.-J.P. Review on Hydrogel-based pH Sensors and Microsensors. Sensors 2008, 8, 561–581. [Google Scholar] [CrossRef] [PubMed]
- Thong Trinh, Q.; Gerlach, G.; Sorber, J.; Arndt, K.-F. Hydrogel-based piezoresistive pH sensors: Design, simulation and output characteristics. Sens. Actuators B Chem. 2006, 117, 17–26. [Google Scholar] [CrossRef]
- Hilt, J.Z.; Gupta, A.K.; Bashir, R.; Peppas, N.A. Ultrasensitive BioMEMS Sensors Based on Microcantilevers Patterned with Environmentally Responsive Hydrogels. Biomed. Microdevices 2003, 5, 177–184. [Google Scholar] [CrossRef]
- Lin, C.-F.; Lee, G.-B.; Wang, C.-H.; Lee, H.-H.; Liao, W.-Y.; Chou, T.-C. Microfluidic pH-sensing chips integrated with pneumatic fluid-control devices. Biosens. Bioelectron. 2006, 21, 1468–1475. [Google Scholar] [CrossRef] [PubMed]
- Yamada, A.; Suzuki, M. A Microfluidic pH Measurement Device with a Flowing Liquid Junction. Sensors 2017, 17, 1563. [Google Scholar] [CrossRef] [PubMed]
- Food and Drug Administration, HHS. Current good manufacturing practice for positron emission tomography drugs. Fed. Regist. 2009, 74, 65409–65436. [Google Scholar]
- U.S. Pharmacopeia (USP). General Chapters: <71> STERILITY TESTS. Available online: http://www.pharmacopeia.cn/v29240/usp29nf24s0_c71.html (accessed on 9 September 2017).
- Foudeh, A.M.; Didar, T.F.; Veres, T.; Tabrizian, M. Microfluidic designs and techniques using lab-on-a-chip devices for pathogen detection for point-of-care diagnostics. Lab Chip 2012, 12, 3249–3266. [Google Scholar] [CrossRef] [PubMed]
- Bridle, H.; Miller, B.; Desmulliez, M.P.Y. Application of microfluidics in waterborne pathogen monitoring: A review. Water Res. 2014, 55, 256–271. [Google Scholar] [CrossRef] [PubMed]
- Brandão, D.; Liébana, S.; Pividori, M.I. Multiplexed detection of foodborne pathogens based on magnetic particles. New Biotechnol. 2015, 32, 511–520. [Google Scholar] [CrossRef] [PubMed]
- Mairhofer, J.; Roppert, K.; Ertl, P. Microfluidic Systems for Pathogen Sensing: A Review. Sensors 2009, 9, 4804–4823. [Google Scholar] [CrossRef] [PubMed]
- Jung, J.H.; Kim, G.-Y.; Seok Seo, T. An integrated passive micromixer—Magnetic separation—Capillary electrophoresis microdevice for rapid and multiplex pathogen detection at the single-cell level. Lab Chip 2011, 11, 3465–3470. [Google Scholar] [CrossRef] [PubMed]
- Lantz, A.W.; Bao, Y.; Armstrong, D.W. Single-Cell Detection: Test of Microbial Contamination Using Capillary Electrophoresis. Anal. Chem. 2007, 79, 1720–1724. [Google Scholar] [CrossRef] [PubMed]
- Sun, T.; Morgan, H. Single-cell microfluidic impedance cytometry: A review. Microfluid. Nanofluid. 2010, 8, 423–443. [Google Scholar] [CrossRef]
- Varshney, M.; Li, Y. Interdigitated array microelectrodes based impedance biosensors for detection of bacterial cells. Biosens. Bioelectron. 2009, 24, 2951–2960. [Google Scholar] [CrossRef] [PubMed]
- Haandbæk, N.; With, O.; Bürgel, S.C.; Heer, F.; Hierlemann, A. Resonance-enhanced microfluidic impedance cytometer for detection of single bacteria. Lab Chip 2014, 14, 3313–3324. [Google Scholar] [CrossRef] [PubMed]
- U.S. Pharmacopeia (USP). General Chapters: <85> BACTERIAL ENDOTOXINS TEST. Available online: http://www.pharmacopeia.cn/v29240/usp29nf24s0_c85.html (accessed on 12 August 2017).
- Das, A.P.; Kumar, P.S.; Swain, S. Recent advances in biosensor based endotoxin detection. Biosens. Bioelectron. 2014, 51, 62–75. [Google Scholar] [CrossRef] [PubMed]
- Charles River Laboratories, Inc. Endotoxin Testing Systems. Available online: http://www.criver.com/products-services/rapid-micro/endosafe/endotoxin-rapid-testing-systems (accessed on 16 September 2017).
- Suh, C.W.; Hwang, S.Y.; Choi, H.J.; Seong, G.H.; Ahn, Y.M.; Kim, Y.S.; Lee, E.K. Feasibility of on-chip detection of endotoxin by LAL test. Biotechnol. Bioprocess Eng. 2004, 9, 132–136. [Google Scholar] [CrossRef]
- Miao, P.; Han, K.; Qi, J.; Zhang, C.; Liu, T. Electrochemical investigation of endotoxin induced limulus amebocyte lysate gel-clot process. Electrochem. Commun. 2013, 26, 29–32. [Google Scholar] [CrossRef]
- Noda, K.; Goto, H.; Murakami, Y.; Ahmed, A.B.F.; Kuroda, A. Endotoxin assay by bioluminescence using mutant firefly luciferase. Anal. Biochem. 2010, 397, 152–155. [Google Scholar] [CrossRef] [PubMed]
- Su, W.; Lin, M.; Lee, H.; Cho, M.; Choe, W.-S.; Lee, Y. Determination of endotoxin through an aptamer-based impedance biosensor. Biosens. Bioelectron. 2012, 32, 32–36. [Google Scholar] [CrossRef] [PubMed]
- Makszin, L.; Kilár, A.; Felső, P.; Péterfi, Z.; Kocsis, B.; Kilár, F. Quantitative microfluidic analysis of S- and R-type endotoxin components with chip capillary electrophoresis. Electrophoresis 2012, 33, 3351–3360. [Google Scholar] [CrossRef] [PubMed]
- Franck, D.; Nann, H.; Davi, P.; Schubiger, P.A.; Ametamey, S.M. Faster analysis of radiopharmaceuticals using ultra performance liquid chromatography (UPLC®) in combination with low volume radio flow cell. Appl. Radiat. Isot. 2009, 67, 1068–1070. [Google Scholar] [CrossRef] [PubMed]
- Kryza, D.; Janier, M. Radio-UHPLC: A tool for rapidly determining the radiochemical purity of technetium-99m radiopharmaceuticals? Appl. Radiat. Isot. 2013, 78, 72–76. [Google Scholar] [CrossRef] [PubMed]
- Reichmuth, D.S.; Shepodd, T.J.; Kirby, B.J. Microchip HPLC of Peptides and Proteins. Anal. Chem. 2005, 77, 2997–3000. [Google Scholar] [CrossRef] [PubMed]
- Agilent|HPLC-Chip/MS System Solutions. Available online: http://www.agilent.com/en-us/products/liquid-chromatography/low-flow-lc-systems/1260-infinity-hplc-chip-ms-system/gp42776 (accessed on 18 October 2017).
- Šesták, J.; Moravcová, D.; Kahle, V. Instrument platforms for nano liquid chromatography. J. Chromatogr. A 2015, 1421, 2–17. [Google Scholar] [CrossRef] [PubMed]
- Yin, H.; Killeen, K. The fundamental aspects and applications of Agilent HPLC-Chip. J. Sep. Sci. 2007, 30, 1427–1434. [Google Scholar] [CrossRef] [PubMed]
- Castro, E.R.; Manz, A. Present state of microchip electrophoresis: State of the art and routine applications. J. Chromatogr. A 2015, 1382, 66–85. [Google Scholar] [CrossRef] [PubMed]
- Lewis, A.P.; Cranny, A.; Harris, N.R.; Green, N.G.; Wharton, J.A.; Wood, R.J.K.; Stokes, K.R. Review on the development of truly portable and in-situ capillary electrophoresis systems. Meas. Sci. Technol. 2013, 24, 042001. [Google Scholar] [CrossRef]
- Janasek, D.; Franzke, J.; Manz, A. Scaling and the design of miniaturized chemical-analysis systems. Nature 2006, 442, 374–380. [Google Scholar] [CrossRef] [PubMed]
- Ahuja, S.; Jimidar, M. Capillary Electrophoresis Methods for Pharmaceutical Analysis; Elsevier: Amsterdam, The Netherlands, 2011; ISBN 978-0-08-055961-2. [Google Scholar]
- Mironov, G.G.; Clouthier, C.M.; Akbar, A.; Keillor, J.W.; Berezovski, M.V. Simultaneous analysis of enzyme structure and activity by kinetic capillary electrophoresis-MS. Nat. Chem. Biol. 2016, 12, 918–922. [Google Scholar] [CrossRef] [PubMed]
- Morbioli, G.G.; Mazzu-Nascimento, T.; Aquino, A.; Cervantes, C.; Carrilho, E. Recombinant drugs-on-a-chip: The usage of capillary electrophoresis and trends in miniaturized systems—A review. Anal. Chim. Acta 2016, 935, 44–57. [Google Scholar] [CrossRef] [PubMed]
- Ha, N.S.; Ly, J.; Jones, J.; Cheung, S.; van Dam, R.M. Novel volumetric method for highly repeatable injection in microchip electrophoresis. Anal. Chim. Acta 2017, 985, 129–140. [Google Scholar] [CrossRef] [PubMed]
- Breadmore, M.C.; Shallan, A.I.; Rabanes, H.R.; Gstoettenmayr, D.; Abdul Keyon, A.S.; Gaspar, A.; Dawod, M.; Quirino, J.P. Recent advances in enhancing the sensitivity of electrophoresis and electrochromatography in capillaries and microchips (2010–2012). Electrophoresis 2013, 34, 29–54. [Google Scholar] [CrossRef] [PubMed]
- Holzgrabe, U.; Brinz, D.; Kopec, S.; Weber, C.; Bitar, Y. Why not using capillary electrophoresis in drug analysis? Electrophoresis 2006, 27, 2283–2292. [Google Scholar] [CrossRef] [PubMed]
- Kaniansky, D.; Rajec, P.; Švec, A.; Marák, J.; Kovaľ, M.; Lúčka, M.; Franko, Š.; Sabanoš, G. On-column radiometric detector for capillary isotachophoresis. J. Radioanal. Nucl. Chem. 1989, 129, 305–325. [Google Scholar] [CrossRef]
- Kaniansky, D.; Rajec, P.; Švec, A.; Havaši, P.; Macášek, F. On-line radiometric detection in capillary isotachophoresis. J. Chromatogr. A 1983, 258, 238–243. [Google Scholar] [CrossRef]
- Pentoney, S.L.; Zare, R.N.; Quint, J.F. On-line radioisotope detection for capillary electrophoresis. Anal. Chem. 1989, 61, 1642–1647. [Google Scholar] [CrossRef]
- Altria, K.D.; Simpson, C.F.; Bharij, A.K.; Theobald, A.E. A gamma-ray detector for capillary zone electrophoresis and its use in the analysis of some radiopharmaceuticals. Electrophoresis 1990, 11, 732–734. [Google Scholar] [CrossRef] [PubMed]
- Jankowsky, R.; Noll, B.; Johannsen, B. Capillary electrophoresis of 99mtechnetium radiopharmaceuticals. J. Chromatogr. B Biomed. Sci. Appl. 1999, 724, 365–371. [Google Scholar] [CrossRef]
- Cheung, S.; Ly, J.; Lazari, M.; Sadeghi, S.; Keng, P.Y.; van Dam, R.M. The separation and detection of PET tracers via capillary electrophoresis for chemical identity and purity analysis. J. Pharm. Biomed. Anal. 2014, 94, 12–18. [Google Scholar] [CrossRef] [PubMed]
- Bowen, A.L.; Martin, R.S. Integration of on-chip peristaltic pumps and injection valves with microchip electrophoresis and electrochemical detection. Electrophoresis 2010, 31, 2534–2540. [Google Scholar] [CrossRef] [PubMed]
- Kubáň, P.; Hauser, P.C. Effects of the cell geometry and operating parameters on the performance of an external contactless conductivity detector for microchip electrophoresis. Lab Chip 2005, 5, 407–415. [Google Scholar] [CrossRef] [PubMed]
- Kubáň, P.; Hauser, P.C. A review of the recent achievements in capacitively coupled contactless conductivity detection. Anal. Chim. Acta 2008, 607, 15–29. [Google Scholar] [CrossRef] [PubMed]
- Kubáň, P.; Hauser, P.C. Ten years of axial capacitively coupled contactless conductivity detection for CZE—A review. Electrophoresis 2009, 30, 176–188. [Google Scholar] [CrossRef] [PubMed]
- Bruno, A.E.; Krattiger, B.; Maystre, F.; Widmer, H.M. On-column laser-based refractive index detector for capillary electrophoresis. Anal. Chem. 1991, 63, 2689–2697. [Google Scholar] [CrossRef]
- Redman, E.A.; Mellors, J.S.; Starkey, J.A.; Ramsey, J.M. Characterization of Intact Antibody Drug Conjugate Variants Using Microfluidic Capillary Electrophoresis—Mass Spectrometry. Anal. Chem. 2016, 88, 2220–2226. [Google Scholar] [CrossRef] [PubMed]
- Chen, X.; Tang, K.; Lee, M.; Flynn, G.C. Microchip assays for screening monoclonal antibody product quality. Electrophoresis 2008, 29, 4993–5002. [Google Scholar] [CrossRef] [PubMed]
- Chaly, T.; Dahl, J.R. Thin layer chromatographic detection of Kryptofix 2.2.2 in the routine synthesis of [18F] 2-fluoro-2-deoxy-d-glucose. Int. J. Radiat. Appl. Instrum. B 1989, 16, 385–387. [Google Scholar] [CrossRef]
- Mock, B.H.; Winkle, W.; Vavrek, M.T. A color spot test for the detection of Kryptofix 2.2.2 in [18F] FDG preparations. Nucl. Med. Biol. 1997, 24, 193–195. [Google Scholar] [CrossRef]
- Ferrieri, R.A.; Schlyer, D.J.; Alexoff, D.L.; Fowler, J.S.; Wolf, A.P. Direct analysis of Kryptofix 2.2.2 in 18FDG by gas chromatography using a nitrogen-selective detector. Nucl. Med. Biol. 1993, 20, 367–369. [Google Scholar] [CrossRef]
- Lao, Y.; Yang, C.; Zou, W.; Gan, M.; Chen, P.; Su, W. Quantification of Kryptofix 2.2.2 in [18F] fluorine-labelled radiopharmaceuticals by rapid-resolution liquid chromatography. Nucl. Med. Commun. 2012, 33, 498–502. [Google Scholar] [CrossRef] [PubMed]
- Ma, Y.; Huang, B.X.; Channing, M.A.; Eckelman, W.C. Quantification of Kryptofix 2.2.2 in 2-[18F] FDG and other radiopharmaceuticals by LC/MS/MS. Nucl. Med. Biol. 2002, 29, 125–129. [Google Scholar] [CrossRef]
- Sun, X.; Gan, H.; Qiao, J.; Zhu, L.; Liu, Y.; Zhong, J. Rapid Detection of the Residual Kryptofix 2.2.2 Levels in [18F]-Labeled Radiopharmaceuticals by Ultra-Performance Liquid Chromatography Tandem Mass Spectrometry. Anal. Lett. 2011, 44, 1197–1205. [Google Scholar] [CrossRef]
- Nakao, R.; Ito, T.; Yamaguchi, M.; Suzuki, K. Simultaneous analysis of FDG, ClDG and Kryptofix 2.2.2 in [18F] DG preparation by high-performance liquid chromatography with UV detection. Nucl. Med. Biol. 2008, 35, 239–244. [Google Scholar] [CrossRef] [PubMed]
- Charles, O.C. Radioanalysis for PET imaging pharmaceuticals: On-chip Detection of Kryptofix 2.2.2. Int. J. Sci. Eng. Res. 2016, 7, 478–494. [Google Scholar]
- Tarn, M.D.; Esfahani, M.M.N.; Patinglag, L.; Chan, Y.C.; Buch, J.X.; Onyije, C.C.; Gawne, P.J.; Gambin, D.J.B.; Brown, N.J.; Archibald, S.J.; et al. Microanalytical devices towards integrated quality control testing of [18F]FDG radiotracer. In Proceedings of the 21st International Conference on Miniaturized Systems for Chemistry and Life Sciences, Savannah, GA, USA, 22–26 October 2017; pp. 559–560. [Google Scholar]
- Anzellotti, A.I.; McFarland, A.R.; Olson, K.F. A rapid and simple colorimetric test for 2,2,2-cryptand (Kryptofix 2.2.2.) in solution. Anal. Methods 2013, 5, 4317–4320. [Google Scholar] [CrossRef]
- Food and Drug Administration (FDA). FDA Guidance for Industry Q3C Impurities: Residual Solvents; FDA: Silver Springs, MD, USA, 1997.
- Koziorowski, J. A simple method for the quality control of [18F] FDG. Appl. Radiat. Isot. 2010, 68, 1740–1742. [Google Scholar] [CrossRef] [PubMed]
- Archibald, S.; Pamme, N.; Brown, N.; Tarn, M. Integrated microfluidic lab-on-a-chip systems for 18F radiotracer synthesis, purification and quality control. J. Nucl. Med. 2015, 56, 167. [Google Scholar]
- Wilson, A.D.; Baietto, M. Applications and Advances in Electronic-Nose Technologies. Sensors 2009, 9, 5099–5148. [Google Scholar] [CrossRef] [PubMed]
- Nutt, R.; Giamis, A.M.; Mcfarland, A. Quality Control Module for Biomarker Generator System. U.S. Patent 20110070158 A1, 24 March 2011. [Google Scholar]
- Bhushan, A.; Yemane, D.; Trudell, D.; Overton, E.B.; Goettert, J. Fabrication of micro-gas chromatograph columns for fast chromatography. Microsyst. Technol. 2007, 13, 361–368. [Google Scholar] [CrossRef]
- Tzeng, T.H.; Kuo, C.Y.; Wang, S.Y.; Huang, P.K.; Huang, Y.M.; Hsieh, W.C.; Huang, Y.J.; Kuo, P.H.; Yu, S.A.; Lee, S.C.; et al. A Portable Micro Gas Chromatography System for Lung Cancer Associated Volatile Organic Compound Detection. IEEE J. Solid State Circuits 2016, 51, 259–272. [Google Scholar] [CrossRef]
- Taggart, M.P.; Tarn, M.D.; Esfahani, M.M.N.; Schofield, D.M.; Brown, N.J.; Archibald, S.J.; Deakin, T.; Pamme, N.; Thompson, L.F. Development of radiodetection systems towards miniaturised quality control of PET and SPECT radiopharmaceuticals. Lab Chip 2016, 16, 1605–1616. [Google Scholar] [CrossRef] [PubMed]
- Convert, L.; Girard Baril, F.; Boisselle, V.; Pratte, J.-F.; Fontaine, R.; Lecomte, R.; Charette, P.G.; Aimez, V. Blood compatible microfluidic system for pharmacokinetic studies in small animals. Lab Chip 2012, 12, 4683–4692. [Google Scholar] [CrossRef] [PubMed]
- Dooraghi, A.A.; Carroll, L.; Collins, J.; van Dam, R.M.; Chatziioannou, A.F. ARAS: An automated radioactivity aliquoting system for dispensing solutions containing positron-emitting radioisotopes. EJNMMI Res. 2016, 6, 22. [Google Scholar] [CrossRef] [PubMed]
- Cho, J.S.; Vu, N.T.; Yu, Z.T.; Silverman, R.W.; Tseng, H.R.; Chatziioannou, A.F. Optimization of design parameters of a prototype CCD-based lens-coupled imaging system for the detection of beta particles in a microfluidic chip. In Proceedings of the 2007 IEEE Nuclear Science Symposium Conference Record, Honolulu, HI, USA, 26 October–3 November 2007; Volume 6, pp. 4615–4619. [Google Scholar]
- Sengupta, D.; Miller, S.; Marton, Z.; Chin, F.; Nagarkar, V.; Pratx, G. Bright Lu2O3: Eu Thin-Film Scintillators for High-Resolution Radioluminescence Microscopy. Adv. Healthc. Mater. 2015, 4, 2064–2070. [Google Scholar] [CrossRef] [PubMed]
- Cho, J.S.; Taschereau, R.; Olma, S.; Liu, K.; Chen, Y.-C.; Shen, C.K.-F.; van Dam, R.M.; Chatziioannou, A.F. Cerenkov radiation imaging as a method for quantitative measurements of beta particles in a microfluidic chip. Phys. Med. Biol. 2009, 54, 6757–6771. [Google Scholar] [CrossRef] [PubMed]
- Dooraghi, A.A.; Vu, N.T.; Silverman, R.W.; Farrell, R.; Shah, K.S.; Wang, J.; Heath, J.R.; Chatziioannou, A.F. Betabox: A beta particle imaging system based on a position sensitive avalanche photodiode. Phys. Med. Biol. 2013, 58, 3739. [Google Scholar] [CrossRef] [PubMed]
- Tarn, M.D.; Maneuski, D.; Alexander, R.; Brown, N.J.; O’Shea, V.; Pimlott, S.L.; Pamme, N.; Archibald, S.J. Positron detection in silica monoliths for miniaturised quality control of PET radiotracers. Chem. Commun. 2016, 52, 7221–7224. [Google Scholar] [CrossRef] [PubMed]
- Mapelli, A.; Gorini, B.; Haguenauer, M.; Jiguet, S.; Miotto, G.L.; Vandelli, W.; Triviño, N.V.; Renaud, P. Scintillation particle detection based on microfluidics. Sens. Actuators Phys. 2010, 162, 272–275. [Google Scholar] [CrossRef]
- Lavén, M.; Velikyan, I.; Djodjic, M.; Ljung, J.; Berglund, O.; Markides, K.; Långström, B.; Wallenborg, S. Imaging of peptide adsorption to microfluidic channels in a plastic compact disc using a positron emitting radionuclide. Lab Chip 2005, 5, 756–763. [Google Scholar] [CrossRef] [PubMed]
- Sadeghi, S.; Liang, V.; Cheung, S.; Woo, S.; Wu, C.; Ly, J.; Deng, Y.; Eddings, M.; van Dam, R.M. Reusable electrochemical cell for rapid separation of [18F] fluoride from [18O] water for flow-through synthesis of 18F-labeled tracers. Appl. Radiat. Isot. 2013, 75, 85–94. [Google Scholar] [CrossRef] [PubMed]
- Cho, J.S.; Vu, N.T.; Chung, Y.H.; Yu, Z.T.; Silverman, R.W.; Taschereau, R.; Tseng, H.R.; Chatziioannou, A.F. Detection of Beta Particles in a Microfluidic Chip Using a Scintillator and CCD. In Proceedings of the 2006 IEEE Nuclear Science Symposium Conference Record, San Diego, CA, USA, 29 October–1 November 2006; Volume 4, pp. 1977–1981. [Google Scholar]
- Pratx, G.; Chen, K.; Sun, C.; Martin, L.; Carpenter, C.M.; Olcott, P.D.; Xing, L. Radioluminescence Microscopy: Measuring the Heterogeneous Uptake of Radiotracers in Single Living Cells. PLoS ONE 2012, 7, e46285. [Google Scholar] [CrossRef] [PubMed]
- Dooraghi, A.A.; Keng, P.Y.; Chen, S.; Javed, M.R.; Kim, C.-J.; Chatziioannou, A.F.; van Dam, R.M. Optimization of microfluidic PET tracer synthesis with Cerenkov imaging. Analyst 2013, 138, 5654–5664. [Google Scholar] [CrossRef] [PubMed]
- Shin, Y.S.; Kim, J.; Johnson, D.; Dooraghi, A.A.; Mai, W.X.; Ta, L.; Chatziioannou, A.F.; Phelps, M.E.; Nathanson, D.A.; Heath, J.R. Quantitative assessments of glycolysis from single cells. Technology 2015, 3, 172–178. [Google Scholar] [CrossRef] [PubMed]
- Maneuski, D.; Giacomelli, F.; Lemaire, C.; Pimlott, S.; Plenevaux, A.; Owens, J.; O’Shea, V.; Luxen, A. On the use of positron counting for radio-Assay in nuclear pharmaceutical production. Appl. Radiat. Isot. 2017, 125, 9–14. [Google Scholar] [CrossRef] [PubMed]
- Maoddi, P.; Mapelli, A.; Bagiacchi, P.; Gorini, B.; Haguenauer, M.; Miotto, G.L.; Garcia, R.M.; Tehrani, F.S.; Veneziano, S.; Renaud, P. Scintillation detectors based on silicon microfluidic channels. J. Instrum. 2014, 9, C01019. [Google Scholar] [CrossRef]
- Ory, D.; Van den Brande, J.; de Groot, T.; Serdons, K.; Bex, M.; Declercq, L.; Cleeren, F.; Ooms, M.; Van Laere, K.; Verbruggen, A.; et al. Retention of [18F] fluoride on reversed phase HPLC columns. J. Pharm. Biomed. Anal. 2015, 111, 209–214. [Google Scholar] [CrossRef] [PubMed]
- Archibald, S.J.; He, P.; Haswell, S.J.; Pamme, N.; Brown, N.J.; Tarn, M.D.; Alexander, R.; Esfahani, M.M.N. Method and Apparatus for the Analysis of Compounds. Patent Application WO/2016/063068, 28 April 2016. [Google Scholar]
- Marchand, P.; Bekaert, V.; Ouadi, A.; Laquerriere, P.; Brasse, D.; Curien, H. Forty Years of 18F-Labeled Compound Development in an Open Access Database. J. Nucl. Med. 2013, 54, 15N–17N. [Google Scholar]
- Radiosynthesis Database of PET Probes (RaDaP). Available online: http://www.nirs.qst.go.jp/research/division/mic/db2/ (accessed on 8 May 2017).
- Keng, P.Y.; Esterby, M.; van Dam, R.M. Emerging Technologies for Decentralized Production of PET Tracers. In Positron Emission Tomography—Current Clinical and Research Aspects; Hsieh, C.-H., Ed.; InTech: Rijeka, Croatia, 2012; pp. 153–182. ISBN 978-953-307-824-3. [Google Scholar]
- Keng, P.Y.; Sergeev, M.; van Dam, R.M. Advantages of Radiochemistry in Microliter Volumes. In Perspectives on Nuclear Medicine for Molecular Diagnosis and Integrated Therapy; Kuge, Y., Shiga, T., Tamaki, N., Eds.; Springer: Japan, 2016; pp. 93–111. ISBN 978-4-431-55892-7. [Google Scholar]
- Pascali, G.; Salvadori, P.A. Opportunities and challenges in the utilization of microfluidic technologies to the production of radiopharmaceuticals. Chim. Oggi Chem. Today 2016, 34, 28–32. [Google Scholar]
- Shah, K.S.; Grazioso, R.; Farrell, R.; Glodo, J.; Mcclish, M.A.; Entine, G.; Dokhale, P.A.; Cherry, S.R. Position sensitive APDs for small animal PET imaging. In Proceedings of the 2002 IEEE Nuclear Science Symposium Conference Record, Norfolk, VA, USA, 10–16 November 2002; Volume 3, pp. 1411–1415. [Google Scholar]
Figure 1.
Production of positron emission tomography (PET)/single photon emission tomography (SPECT) radiotracers for clinical imaging involves generation of the radioisotope (via cyclotron or generator), radiosynthesis, purification (via HPLC or solid-phase extraction), formulation (via evaporative or solid-phase extraction methods), followed by quality control (QC) testing to ensure safety of the formulated radiotracer prior to injection.
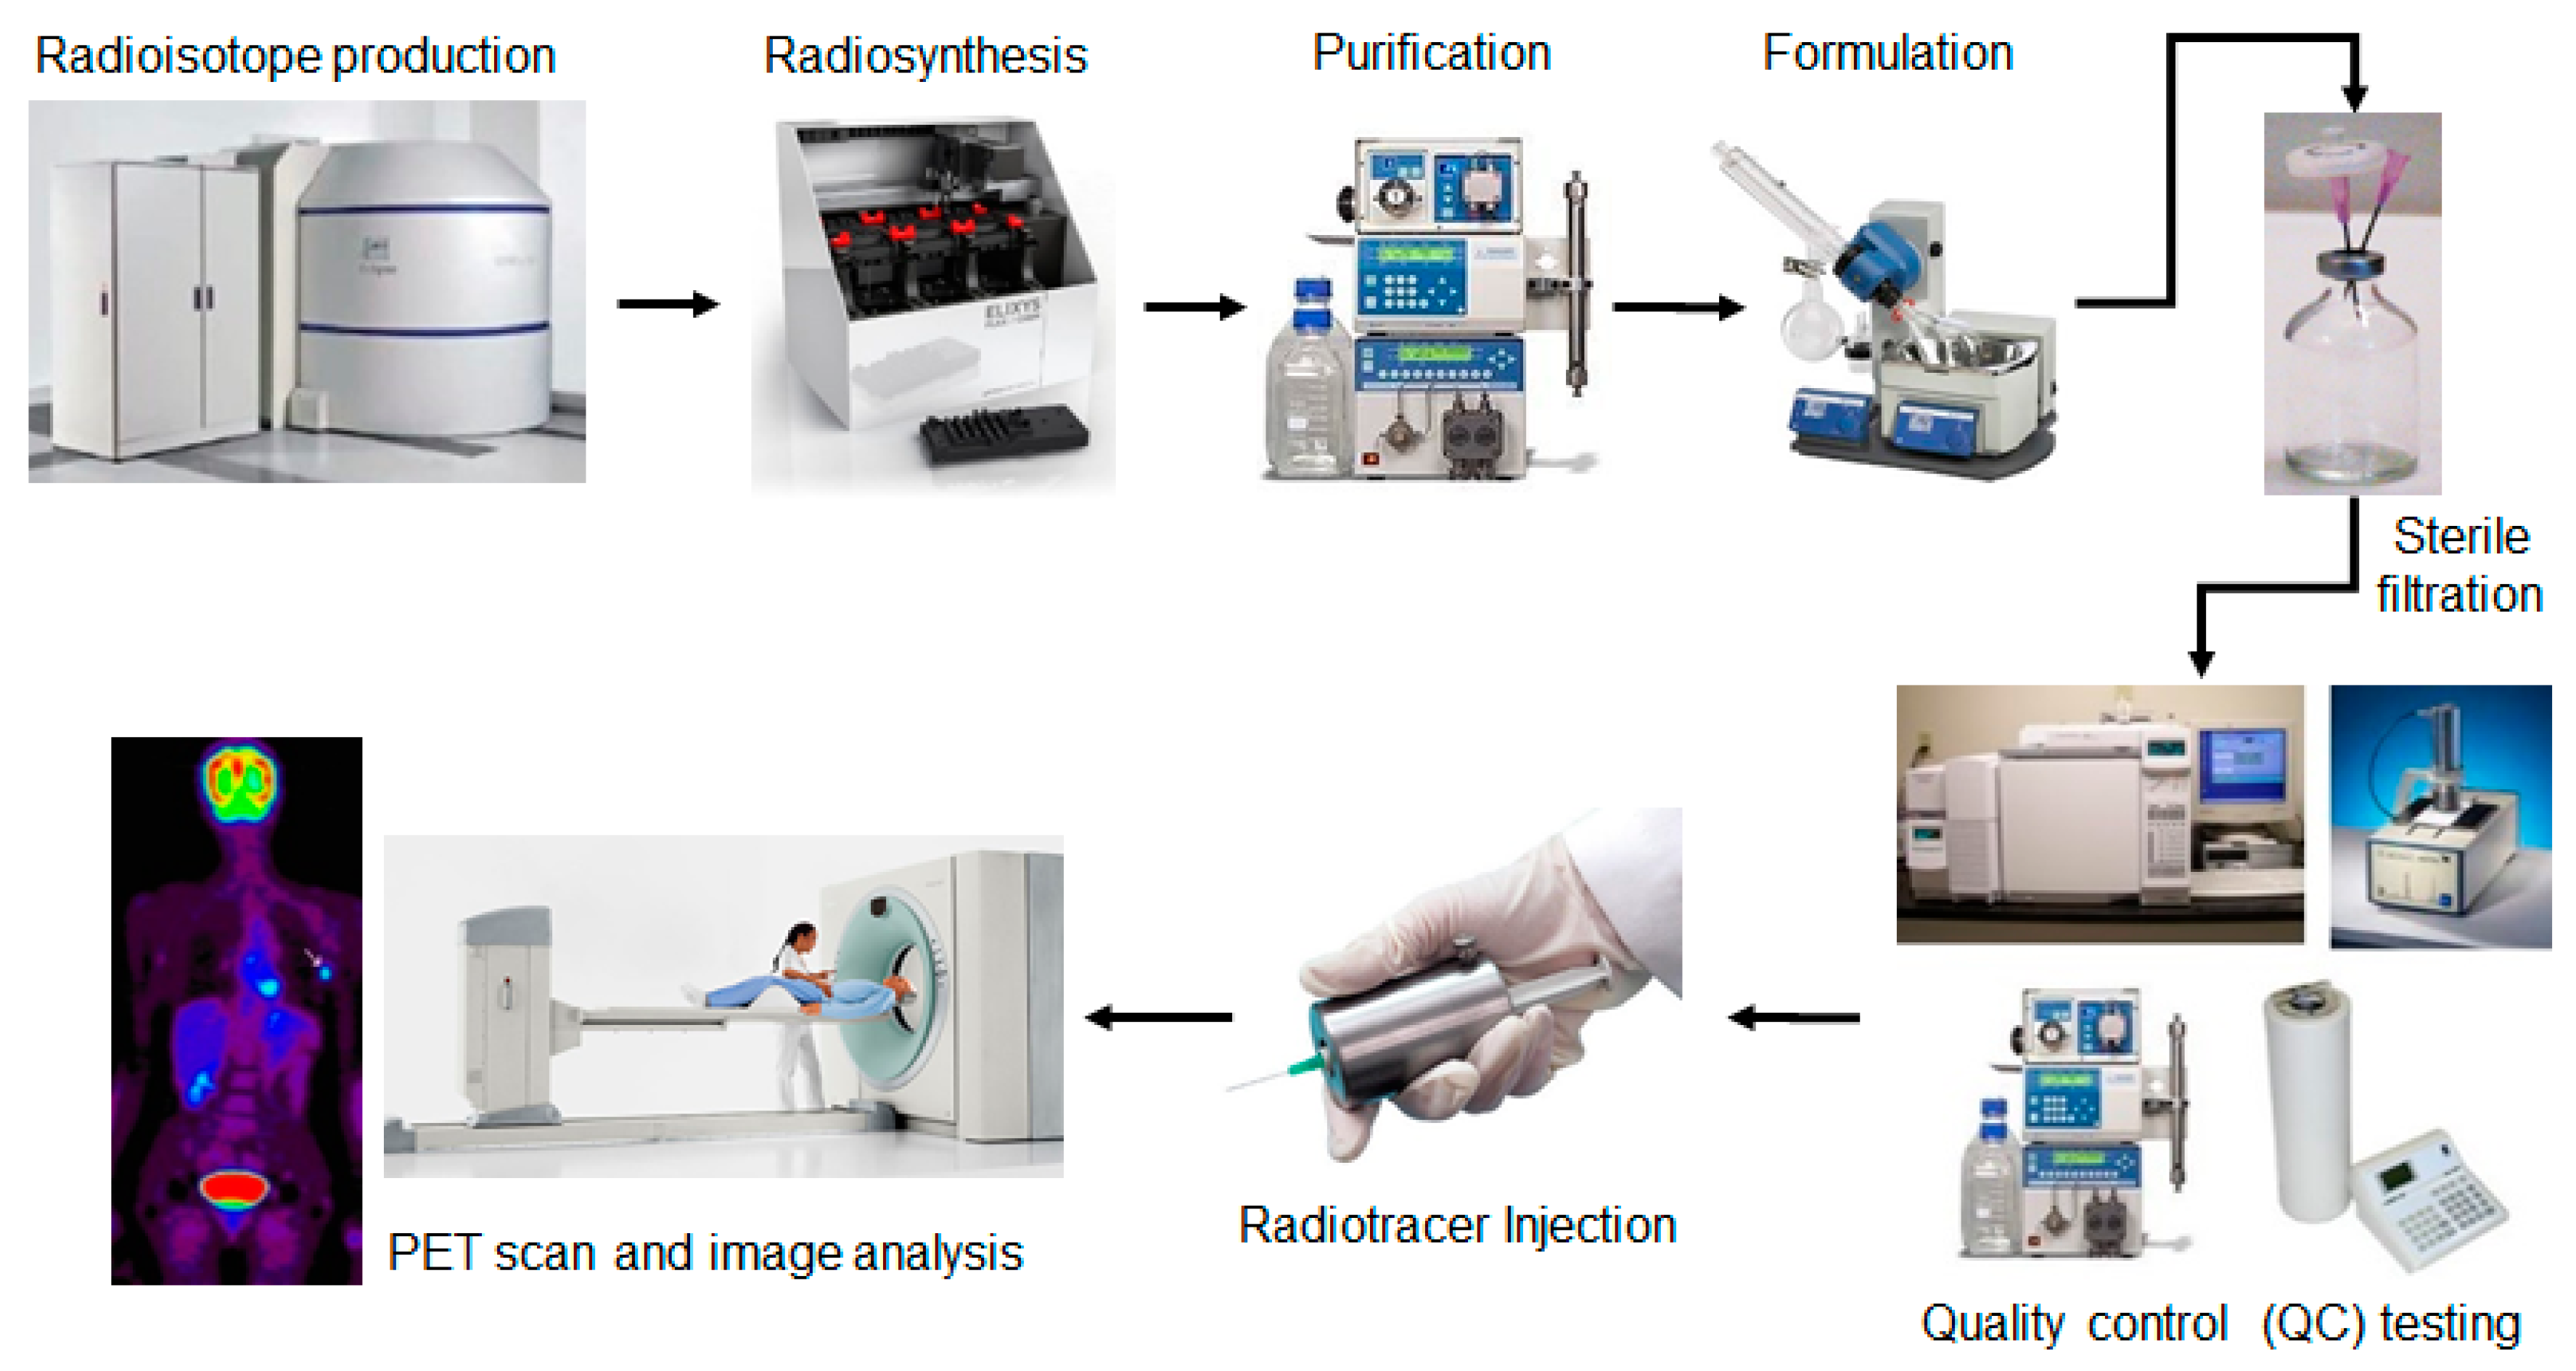
Figure 2.
Examples of microfluidic pH measurement systems. (A) (Left) Microfluidic device to mix a sample with a universal pH indicator and then measure optical absorbance in a 3.1 mm long detection cell. (Right) Representative absorbance measurements at 551 nm as a function of sample pH. Adapted with permission from [31] Copyright © 2014 The Chemical and Biological Microsystems Society. (B) (Top) pH-sensing polymer microbeads are prepared by introducing the pH indicator during the cross-linking process. (Bottom) The beads are immobilized using optical tweezers or tethered to the surface, and the color of each bead reflects the pH of the local environment. Adapted from [34] with permission of The Royal Society of Chemistry. (C) Microfluidic device with internal channel surface coated with pH-sensitive fluorescent molecules (Oregon Green 514). The fluorescence intensity is correlated with pH. Adapted from [36] with permission of The Royal Society of Chemistry. (D) (Left) polydimethylsiloxane (PDMS) microfluidic channel with polyaniline coating that changes color in response to pH. The zoomed in image shows the response to a pH gradient along the channel. Inset SEM image shows the structure of the coating layer. (Right) Absorbance spectra of the polyaniline coating when exposed to solutions of different pH. Adapted from [37] with permission of The Royal Society of Chemistry. (E) Micro-cantilever undergoes deflection in response to pH-dependent swelling of a hydrogel polymer coating. Deflection is monitored with a laser beam. Adapted with permission from [40] Copyright © 2003 Springer. (F) Thin-film electrodes integrated into a PDMS chip allow pH to be measured based on potential between working and reference electrodes. Adapted with permission from [41] Copyright © 2006 Elsevier. (G) Flow-based microfluidic pH measurement system using ion-sensitive field-effect transistor (ISFET) sensors, one acting as a reference and one as a working electrode. Modulation of flow rates moves the liquid junction and allows measurement of the sample solution (SS) after an initialization process using a baseline solution (BLS). Adapted from [42] with permission from MDPI AG.

Figure 3.
Microfluidic methods for detection of bacteria. (A) A microbial sample with “universal” fluorescent stain is concentrated by capillary electrophoresis to improve detection sensitivity. (BA = “blocking agent”). Adapted with permission from [50] Copyright © 2007 American Chemical Society. (B) Impedance-based bacterial detection chip. Cells are first focused via dielectrophoresis (DEP) to the center of channel for downstream detection. A detectable shift in resonant frequency and phase occur when a single cell or particle passes through the measurement area due to a change in the channel impedance. Adapted from [53] with permission of The Royal Society of Chemistry.
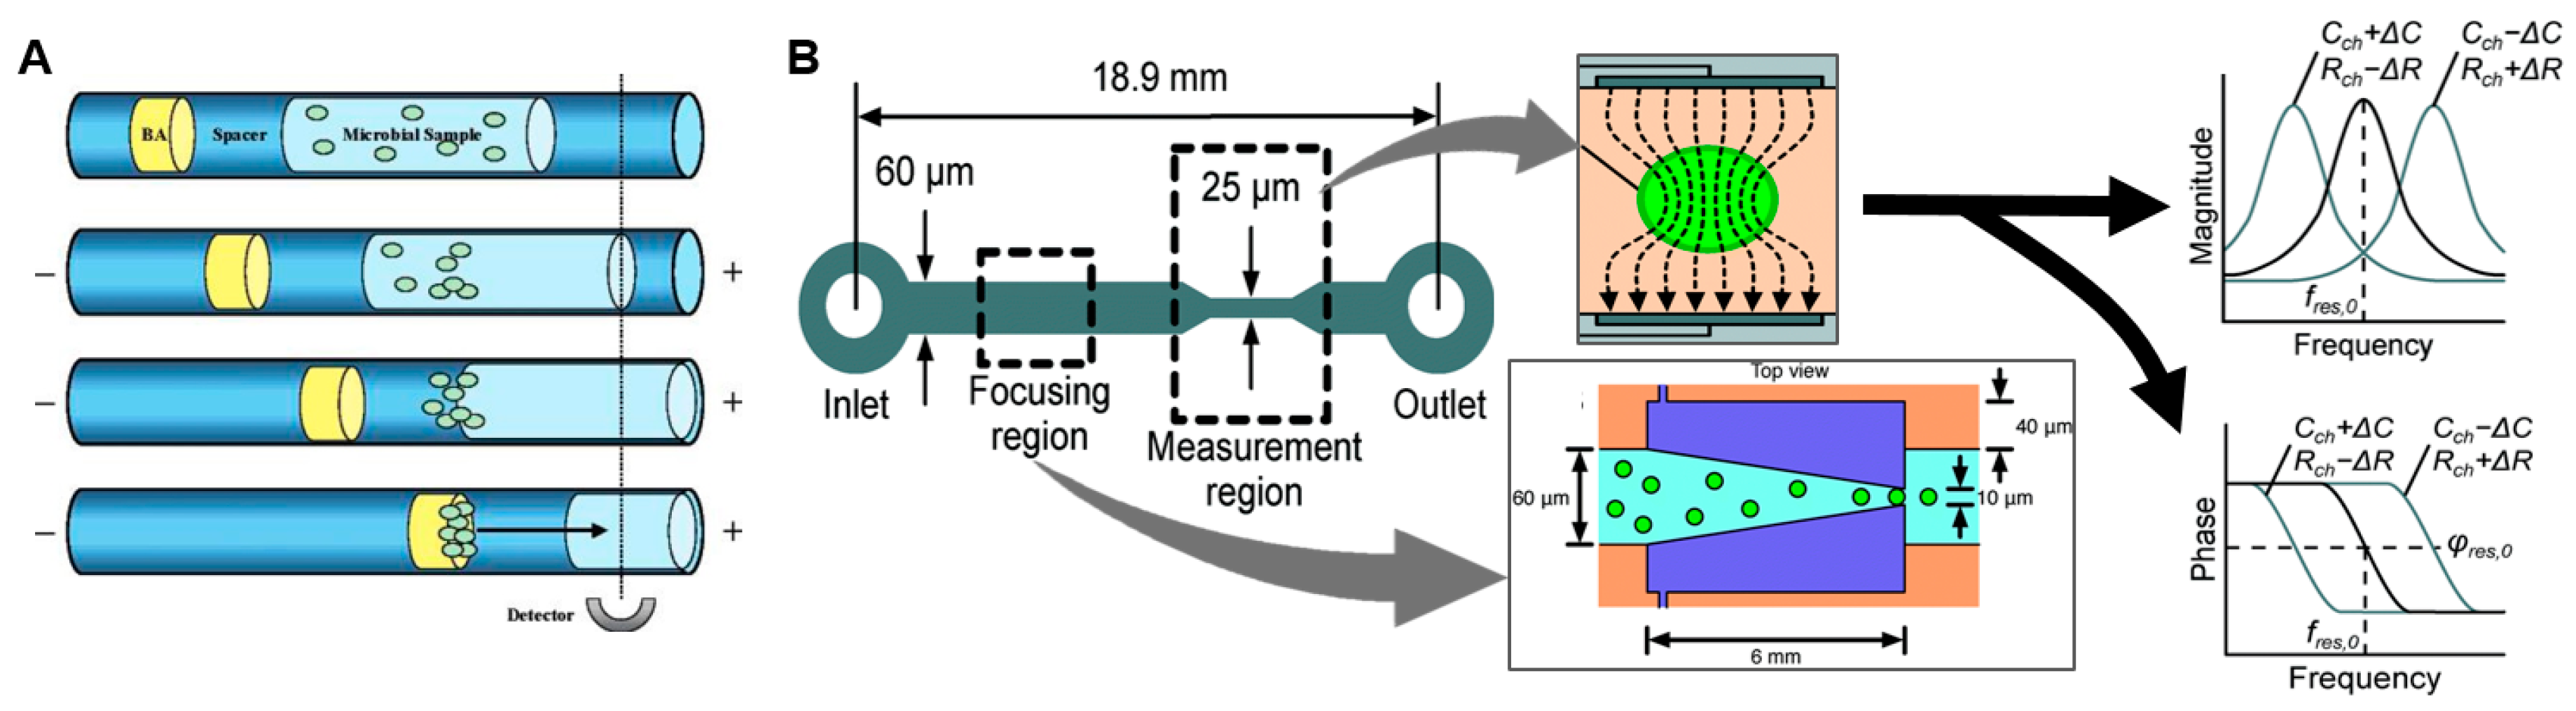
Figure 4.
Examples of microfluidic devices for bacterial endotoxin test. (A) Commercial LAL assay system (Endosafe®, Charles River Laboratories, Inc.) comprising a portable, hand-held spectrometer (left) and ~25 mm × 75 mm disposable microfluidic cartridge (right). Adapted from [56]. (B) Photograph of microfluidic LAL test chip (left) and block diagram illustrating detection method (right). Sample mixed with chromogenic substrate is loaded into the microchannel and optical detection is performed in the middle of channel. Photograph adapted with permission from [57] Copyright © 2004 Springer. (C) Screen-printed electrodes for electrical-impedance monitoring of standard gel clot LAL assay. Adapted with permission from [58] Copyright © 2013 Elsevier. (D) Biosensor comprising a gold electrode functionalized with endotoxin-specific aptamer. Binding of endotoxin is detected via impedance spectroscopy. Adapted with permission from [60] Copyright © 2012 Elsevier.

Figure 5.
Examples of miniature chromatography systems. (A) Microfluidic HPLC system. A sliding fluoropolymer element is used to create a high-pressure valve for sample injection. When the element is in the left position, sample can be loaded via the sample input port. When the HPLC pump is activated, the flowing buffer closes the valve (slides the element to the right) and sweeps the injected sample through the integrated monolith column for separation. Adapted with permission from [64] Copyright © 2005 American Chemical Society. (B) Commercial HPLC-chip (Agilent)) includes an integrated micro-rotary injection valve with sample enrichment column serving as the injection loop, for injecting samples into the integrated LC column and downstream electrospray emitter to nebulize and transfer the sample to a mass spectrometric detector. Adapted from [65]. (C) Microchip electrophoresis setup with a volumetric sample injection chip, a separation capillary, and an optical detection chip. Inset shows representative electropherogram showing baseline separation of a mixture of 4 compounds. Adapted with permission from [74] Copyright © 2017 Elsevier.

Figure 6.
Examples of radiation detection methods (A) (left) Setup of microfluidic chip and silicon photomultiplier (SiPM) array for measurement of radioactivity and half-life of a sample. (right) Photograph of the final chip setup on the SiPM array. Adapted from [107] with permission of the Royal Society of Chemistry. (B) Device for positron detection from blood samples in a microchannel bonded to a silicon PIN photodiode. Adapted from [108] with permission of the Royal Society of Chemistry. (C) Dual silicon PIN photodiode detection of a sample in a channel or tubing. Photodiode 1 responds to both positrons and gamma rays, while photodiode 2 responds only to gamma radiation, allowing subtraction of the background gamma signal. Adapted with permission from [109]. Copyright © 2016 Springer. (D) Scintillator based detection. A scintillator was placed in close proximity to a PDMS microfluidic chip and scintillation light from positron interactions was detected with a CCD camera. Adapted with permission from [110] Copyright © 2007 IEEE. (E) Radioluminescence imaging. Scintillator light output is observed via sensitive microscope as radioactive decays occur in sample. Adapted with permission from [111] Copyright © 2015 John Wiley & Sons, Inc. (F) Cerenkov imaging. (left) Cerenkov radiation is emitted as energetic particles travel through the liquid or chip material. (right) Bright-field and Cerenkov images of 200 µm-wide microchannel filled with [18F]FDG solution. Adapted from [112] with permission of IOP PUBLISHING, Ltd. (G) Beta-box imaging. (top left) Microfluidic chip containing multiple sample chambers is placed on the detector; (bottom left) photograph of position sensitive avalanche photodiode (PSAPD) detector; (right) resulting image when sample chambers are filled with varying concentrations of [18F]fluoride. Adapted from [113] with permission of IOP PUBLISHING, Ltd. (H) System for measuring radioactivity in a silica-based monolith column placed above a Medipix sensor. Adapted from [114] with permission of the Royal Society of Chemistry. (I) Microfluidic channel filled with liquid scintillator that acts an array of scintillation detectors connected by liquid waveguides to photodetectors. Adapted with permission from [115] Copyright © 2010 Elsevier. (J) Autoradiography (phosphor imaging system). (left) Autoradiography image of adsorbed radiolabeled peptide on the channel surfaces of a plastic microfluidic chip. Adapted from [116] with permission of The Royal Society of Chemistry. (right) Autoradiography image of [18F]fluoride trapped in the serpentine channel of an electrochemical cell. Adapted with permission from [117] Copyright © 2013 Elsevier.
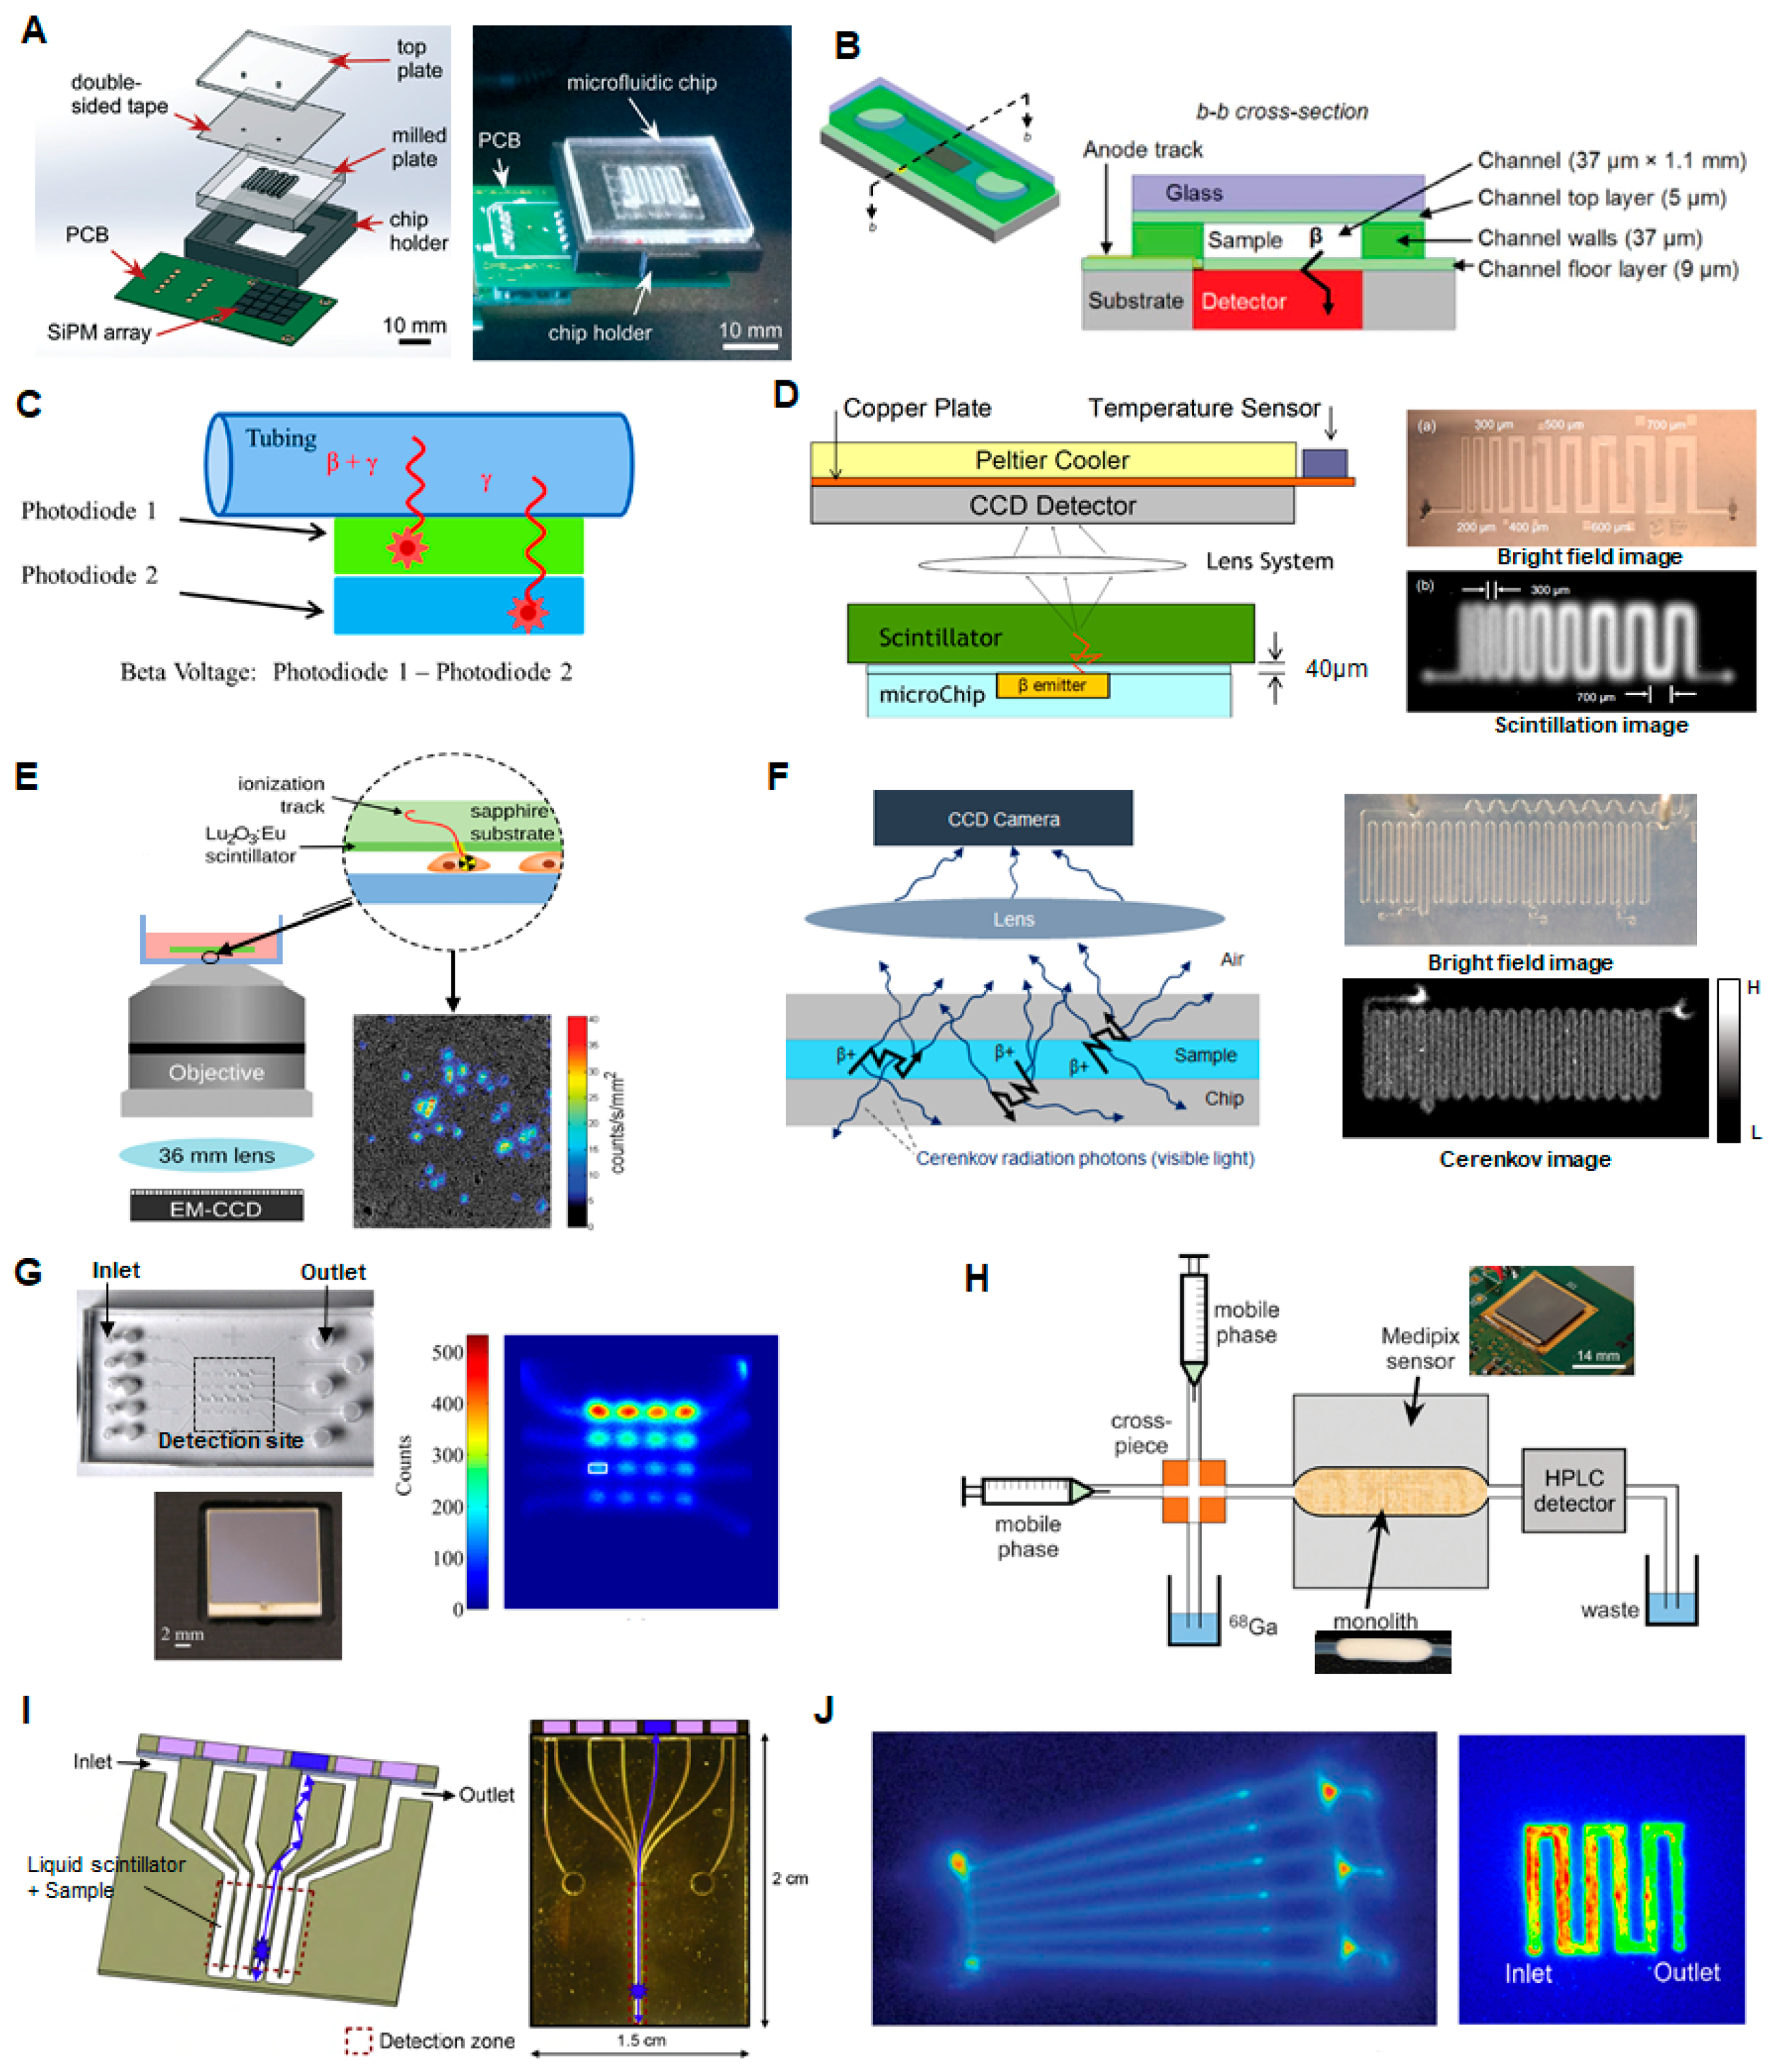

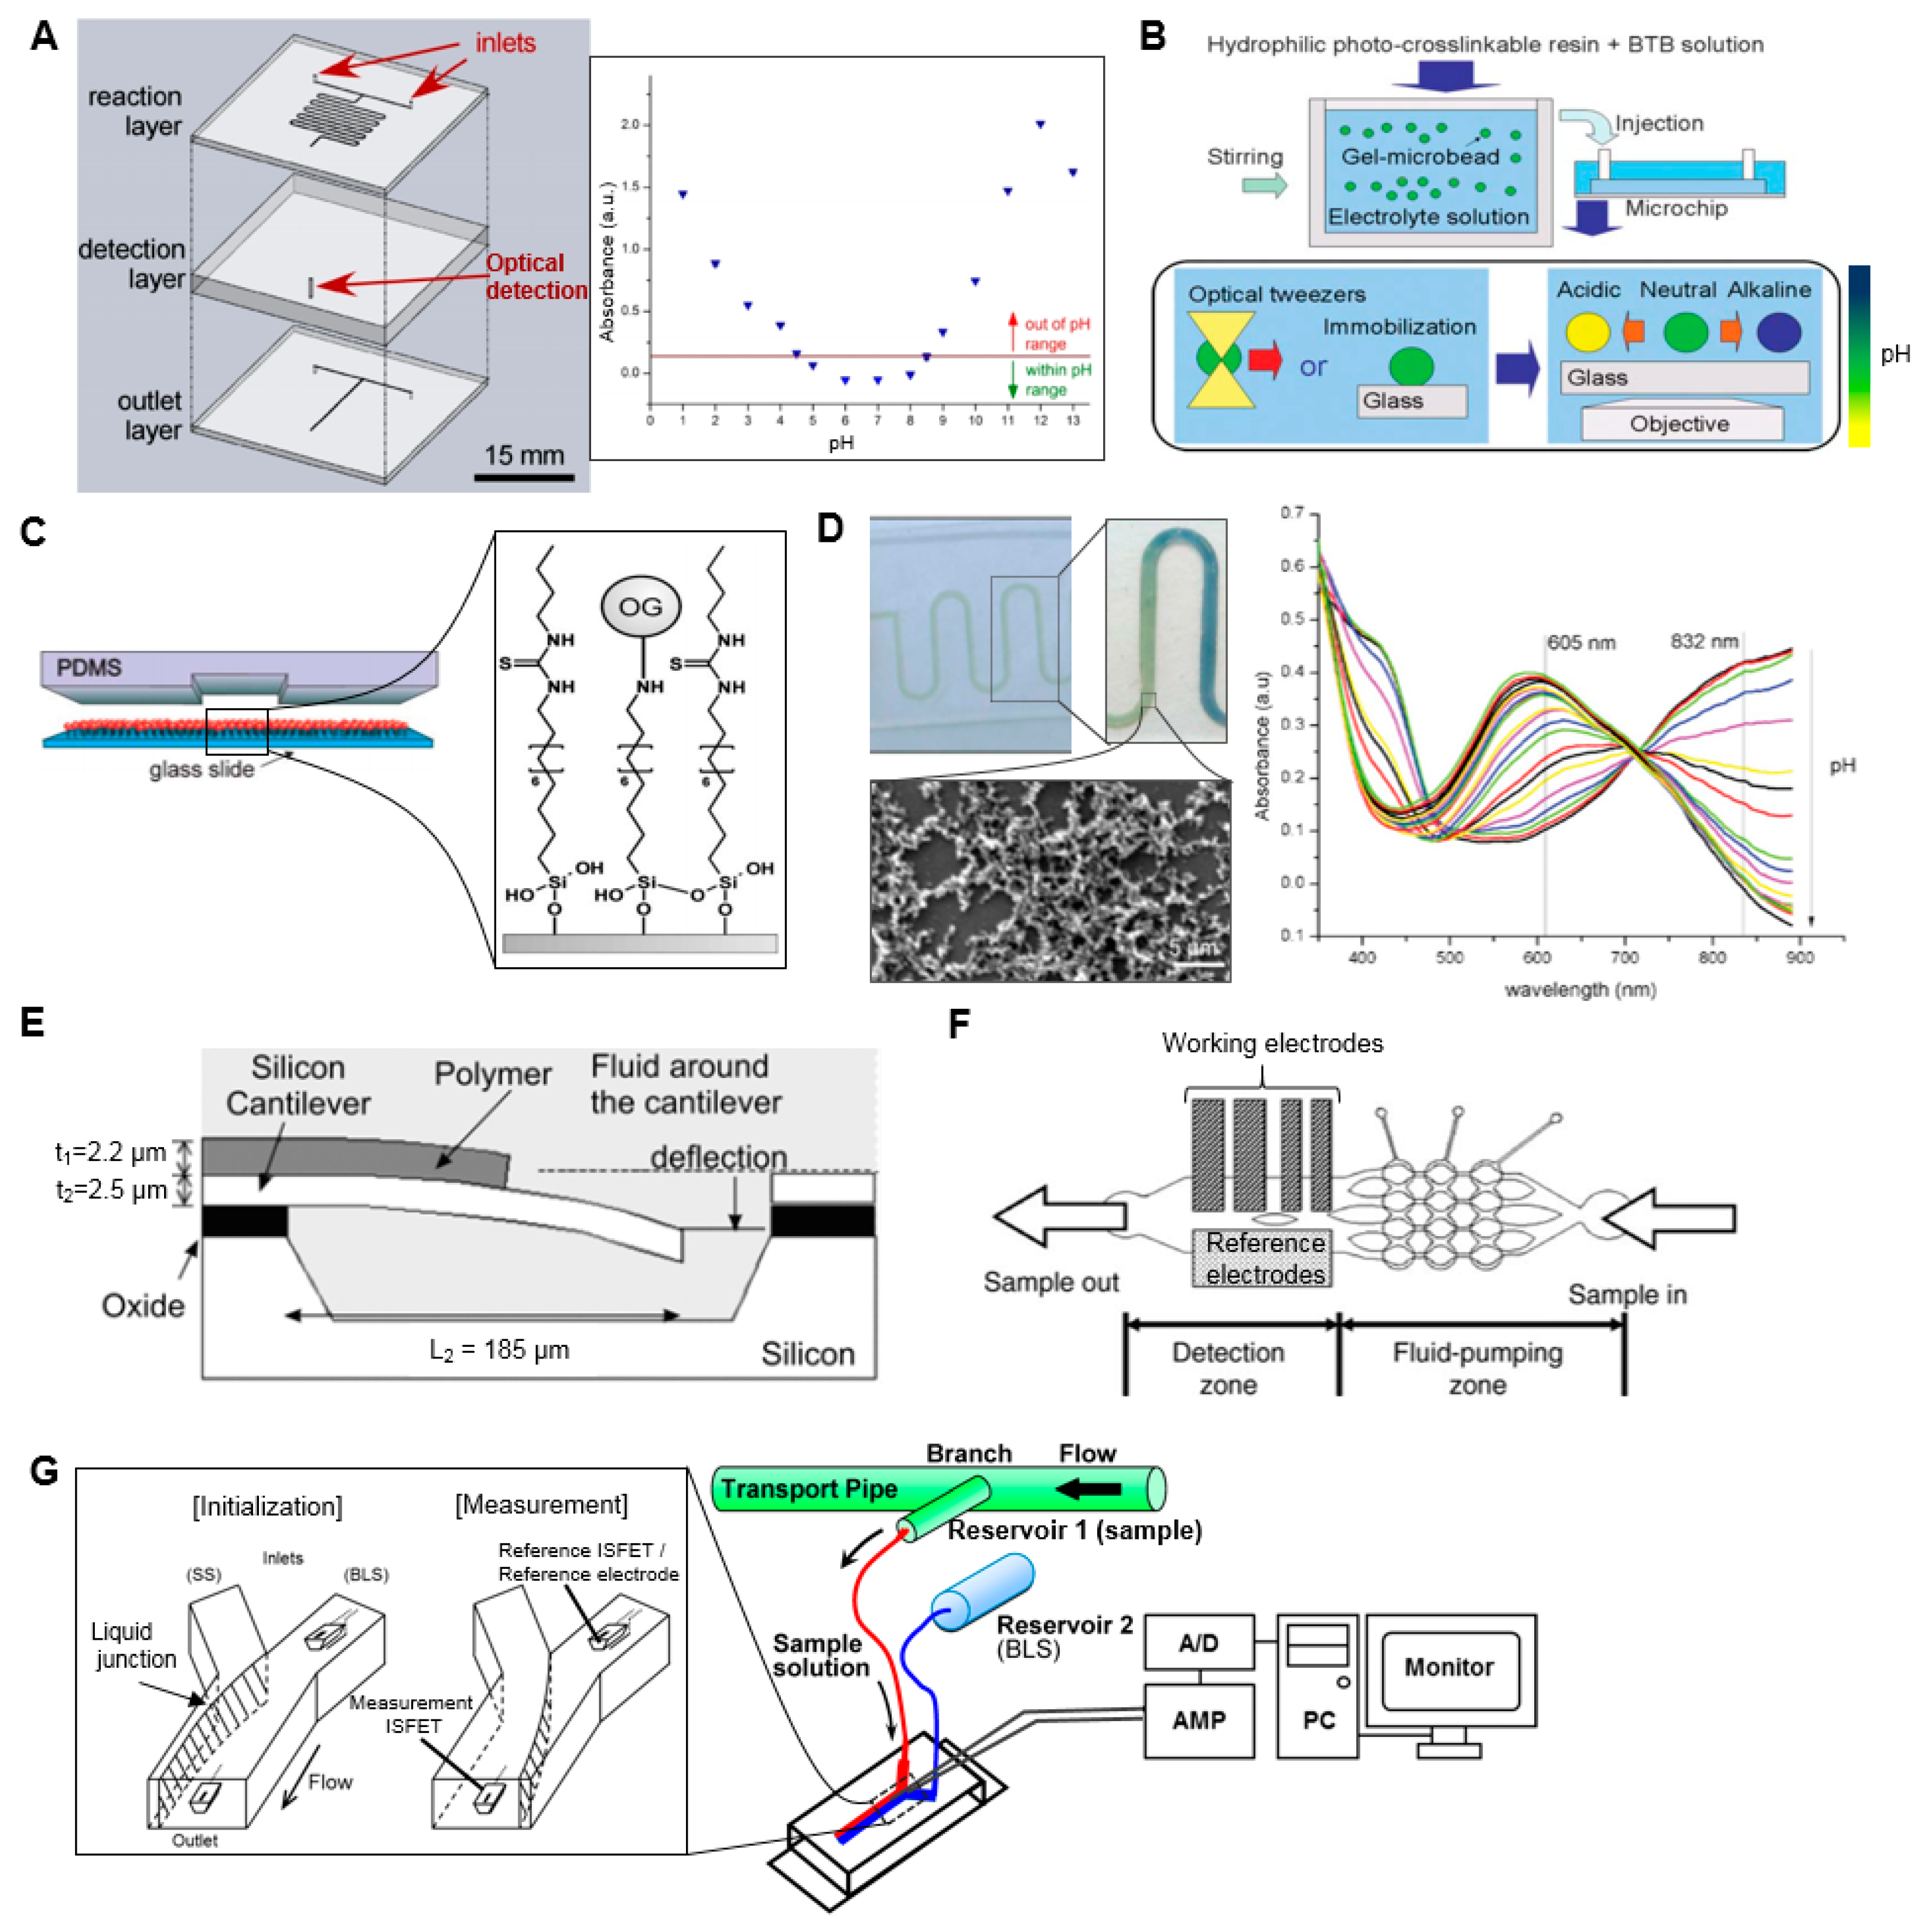
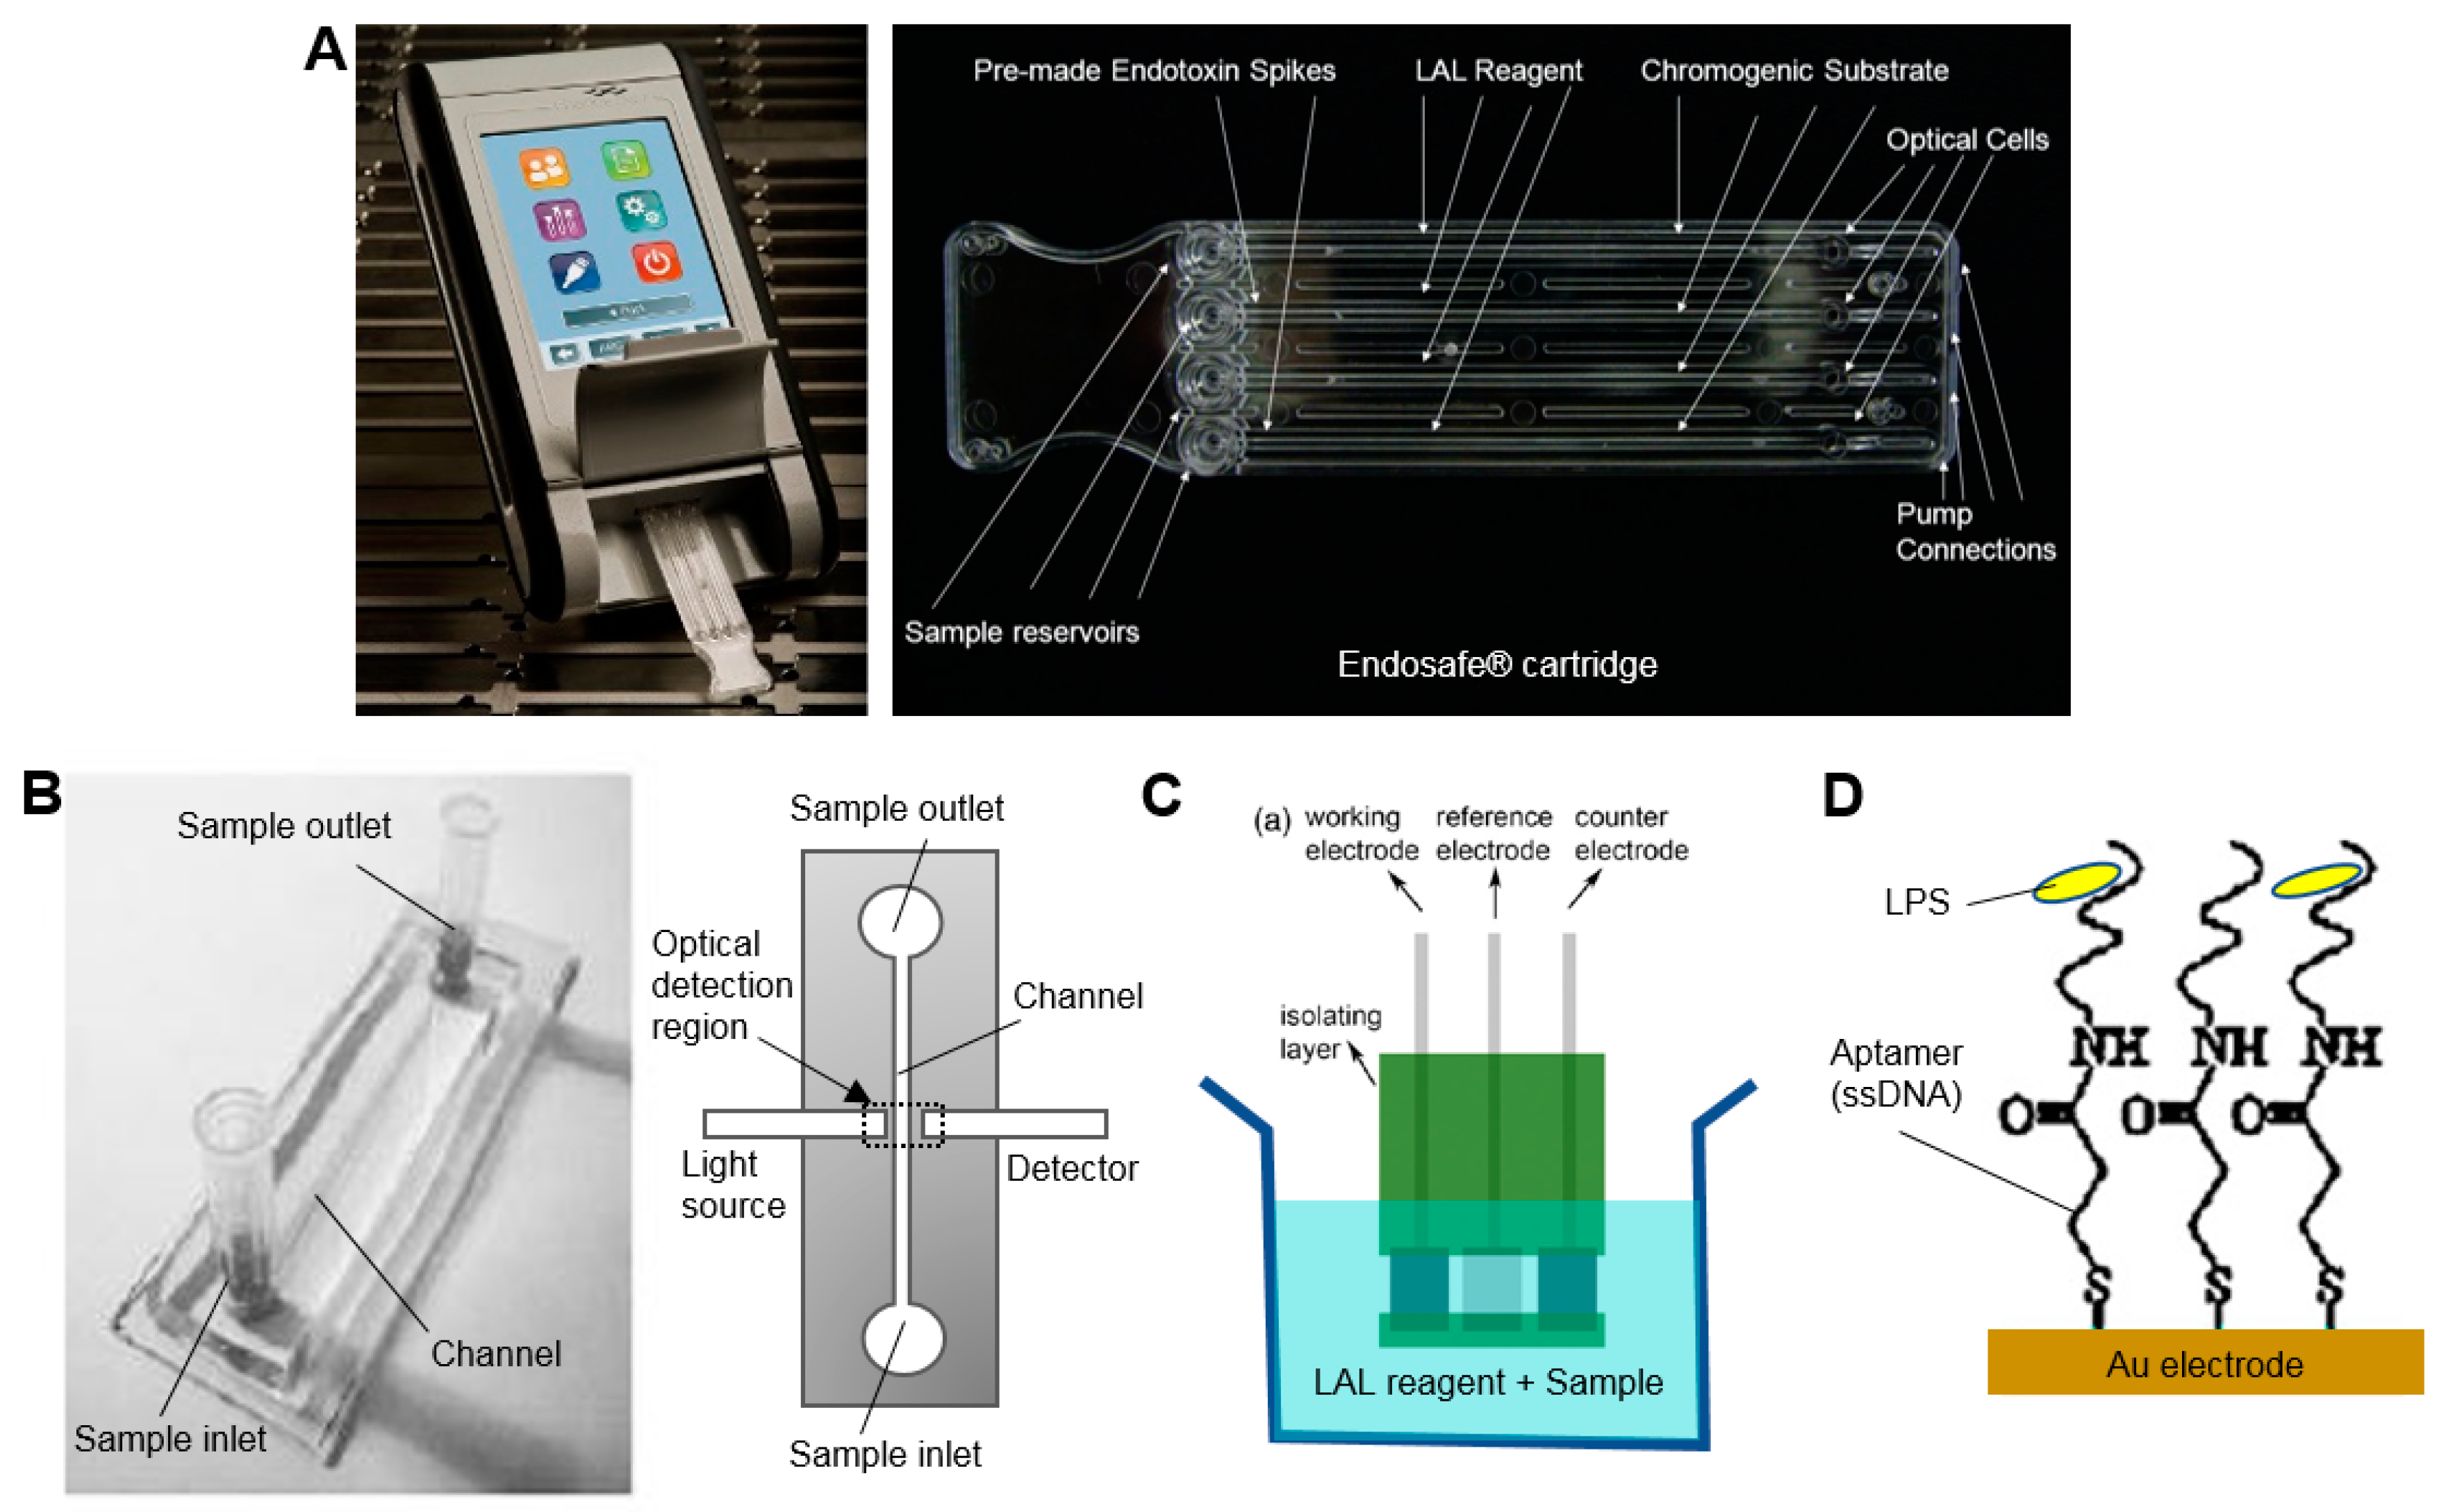
Table 1.
Summary of required QC tests, the conventional method(s) used, and typical specifications. In addition, examples of microfluidic approaches to perform each test are listed. Note we have indicated in italics approaches that have not been demonstrated/proven, but may be possible in principle. Abbreviations: HPLC/UV = HPLC with UV absorbance detector, HPLC/RI = HPLC with refractive index detector, etc.
| QC Test | Conventional Method (s) | Typical Acceptance Criteria | Examples of Microfluidic Suitable Approaches |
|---|---|---|---|
| pH | pH indicator strips; electronic pH meter | 4.5 < pH < 8.5 | |
| Appearance (color/clarity) | Visual | Clear, colorless, particulate-free |
|
| Sterility | Short term: filter integrity test (e.g., bubble point test); long term: Bacterial culture | Long term: No bacterial growth observed |
|
| Bacterial endotoxin | LAL test | 175 EU/V |
|
| Chemical identity/purity | HPLC/UV | Varies |
|
| Kryptofix 2.2.2 | Color spot test | <50 µg/mL (USP); 2.2 mg/V (EP) |
|
| Residual organic solvents | Gas chromatography; HPLC/RI | Varies (e.g., MeCN 4.1 mg/day, EtOH 50 mg/day, DMSO 50 mg/day, DCM 6 mg/day, DMF8.8 mg/day) |
|
| Radioactivity concentration | Dose calibrator | Varies | |
| Radionuclidic identity | Half-life measurement with dose calibrator | Varies (e.g., 105-115 min for 18F-labled tracers) |
|
| Radionuclidic purity | Gamma spectrometer | Match expected energy spectrum |
|
| Radiochemical identity and purity | Radio-HPLC; radio-TLC | >95%; (>90% for [18F]FDG) | |
| Specific activity | Radio-HPLC and dose calibrator | Varies |
|
© 2017 by the authors. Licensee MDPI, Basel, Switzerland. This article is an open access article distributed under the terms and conditions of the Creative Commons Attribution (CC BY) license (http://creativecommons.org/licenses/by/4.0/).
Share and Cite
MDPI and ACS Style
Ha, N.S.; Sadeghi, S.; Van Dam, R.M. Recent Progress toward Microfluidic Quality Control Testing of Radiopharmaceuticals. Micromachines 2017, 8, 337. https://doi.org/10.3390/mi8110337
AMA Style
Ha NS, Sadeghi S, Van Dam RM. Recent Progress toward Microfluidic Quality Control Testing of Radiopharmaceuticals. Micromachines. 2017; 8(11):337. https://doi.org/10.3390/mi8110337
Chicago/Turabian StyleHa, Noel S., Saman Sadeghi, and R. Michael Van Dam. 2017. "Recent Progress toward Microfluidic Quality Control Testing of Radiopharmaceuticals" Micromachines 8, no. 11: 337. https://doi.org/10.3390/mi8110337
Note that from the first issue of 2016, this journal uses article numbers instead of page numbers. See further details here.