
Modeling of the Effect of Process Variations on a Micromachined Doubly-Clamped Beam


Abstract
:1. Introduction
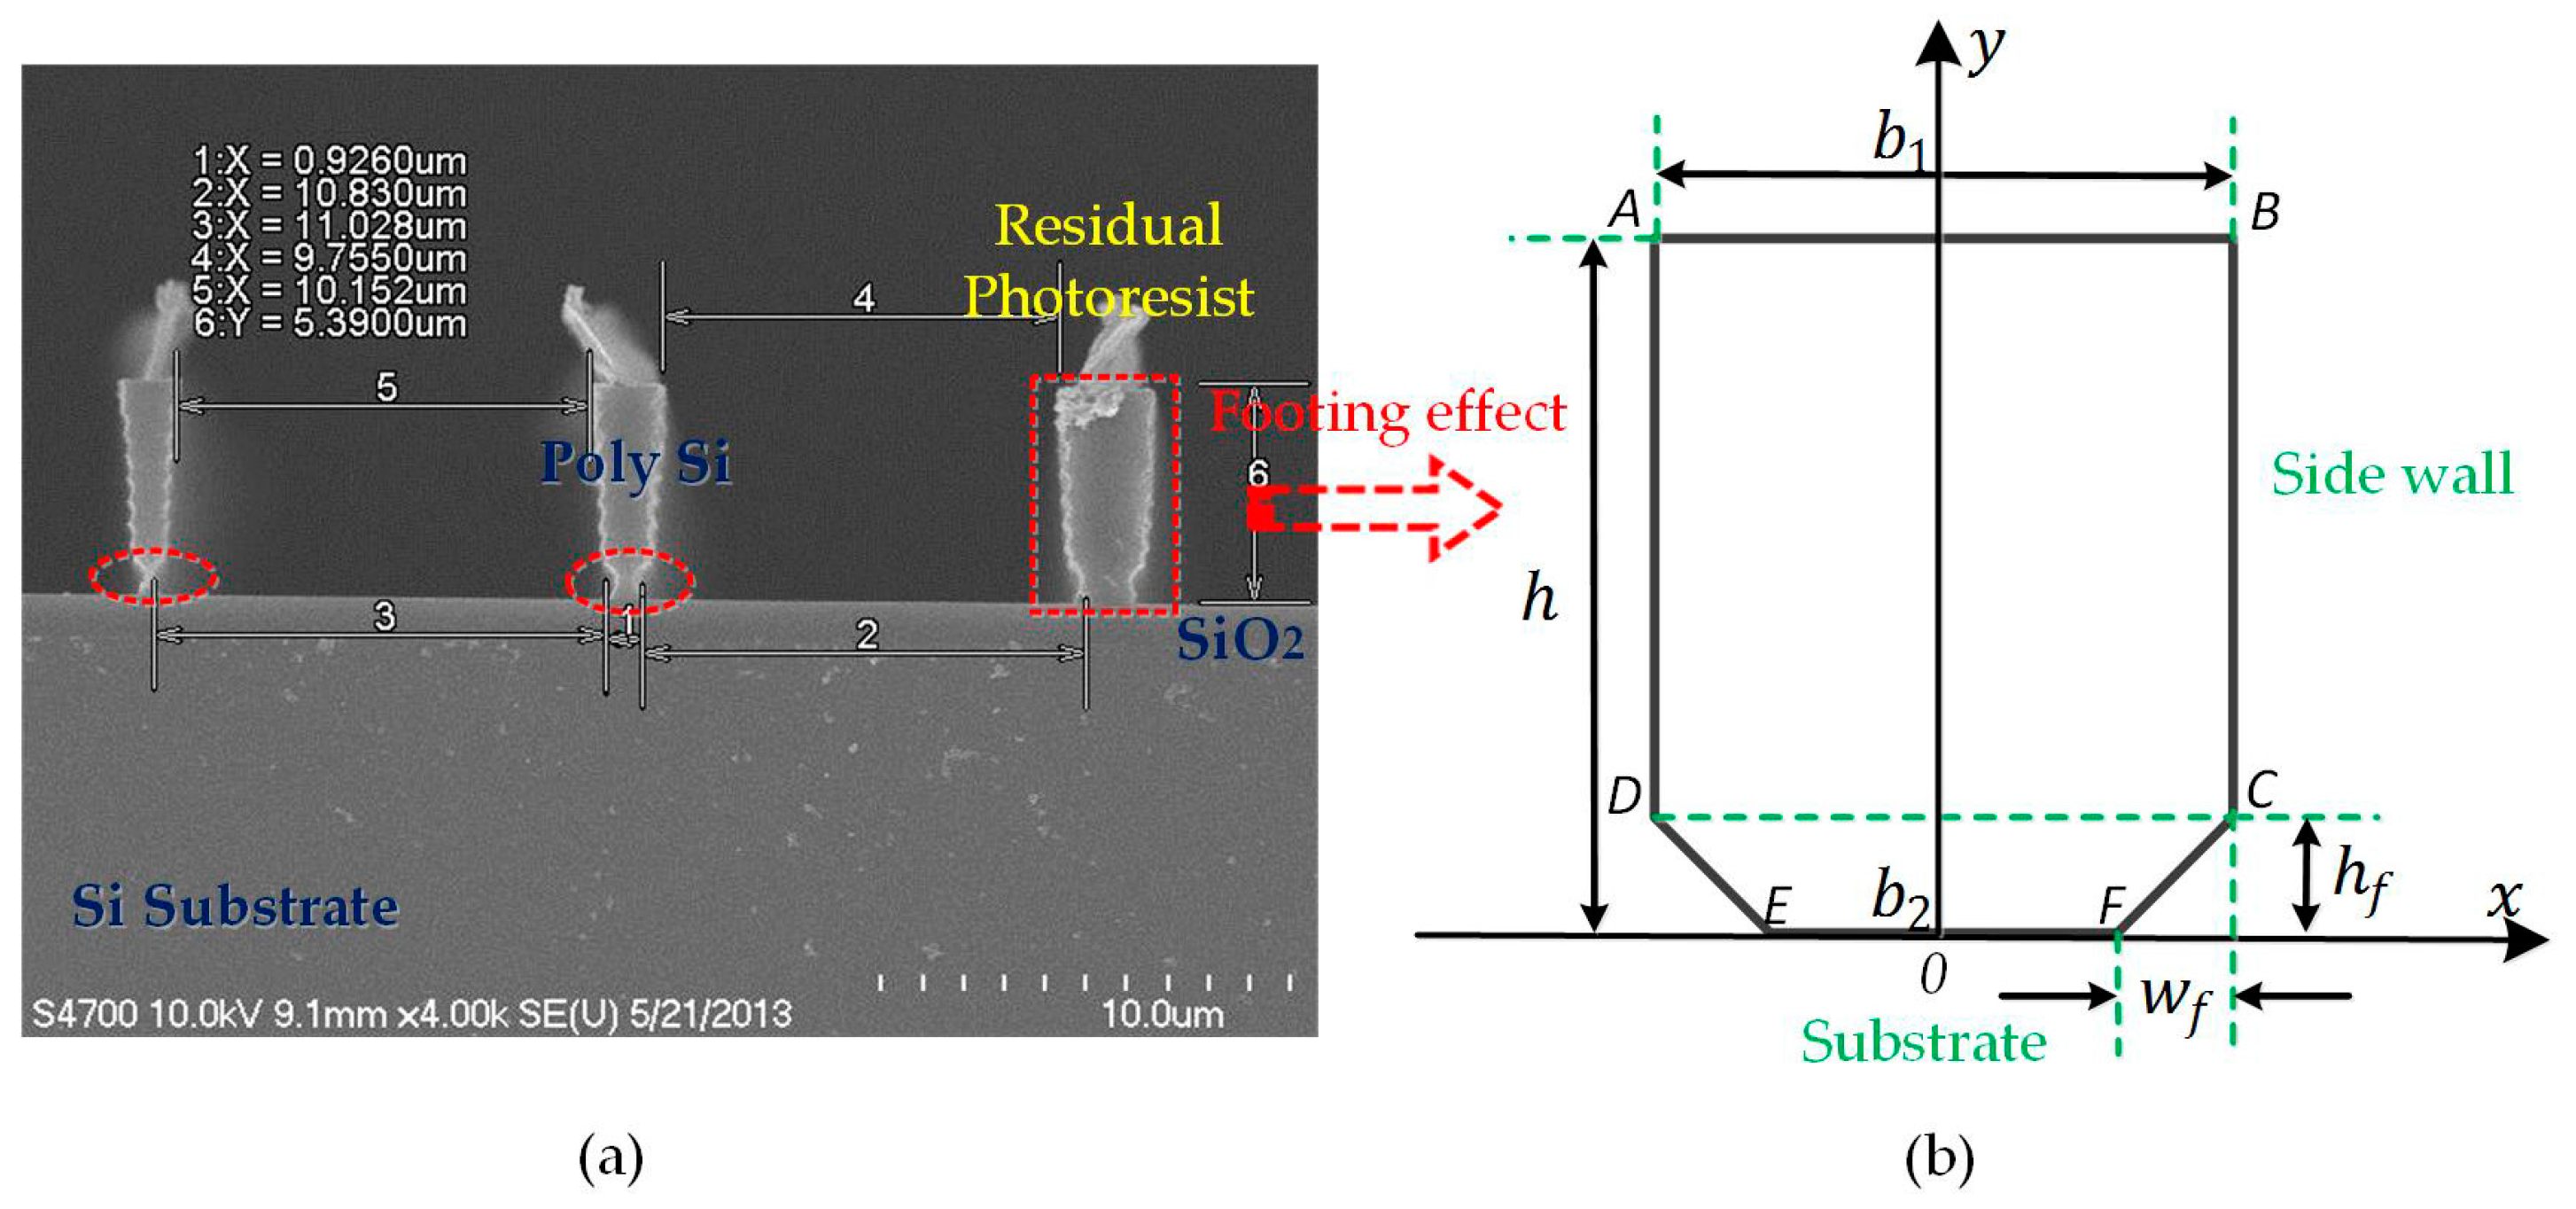
2. Process Variations
3. Problem Solution
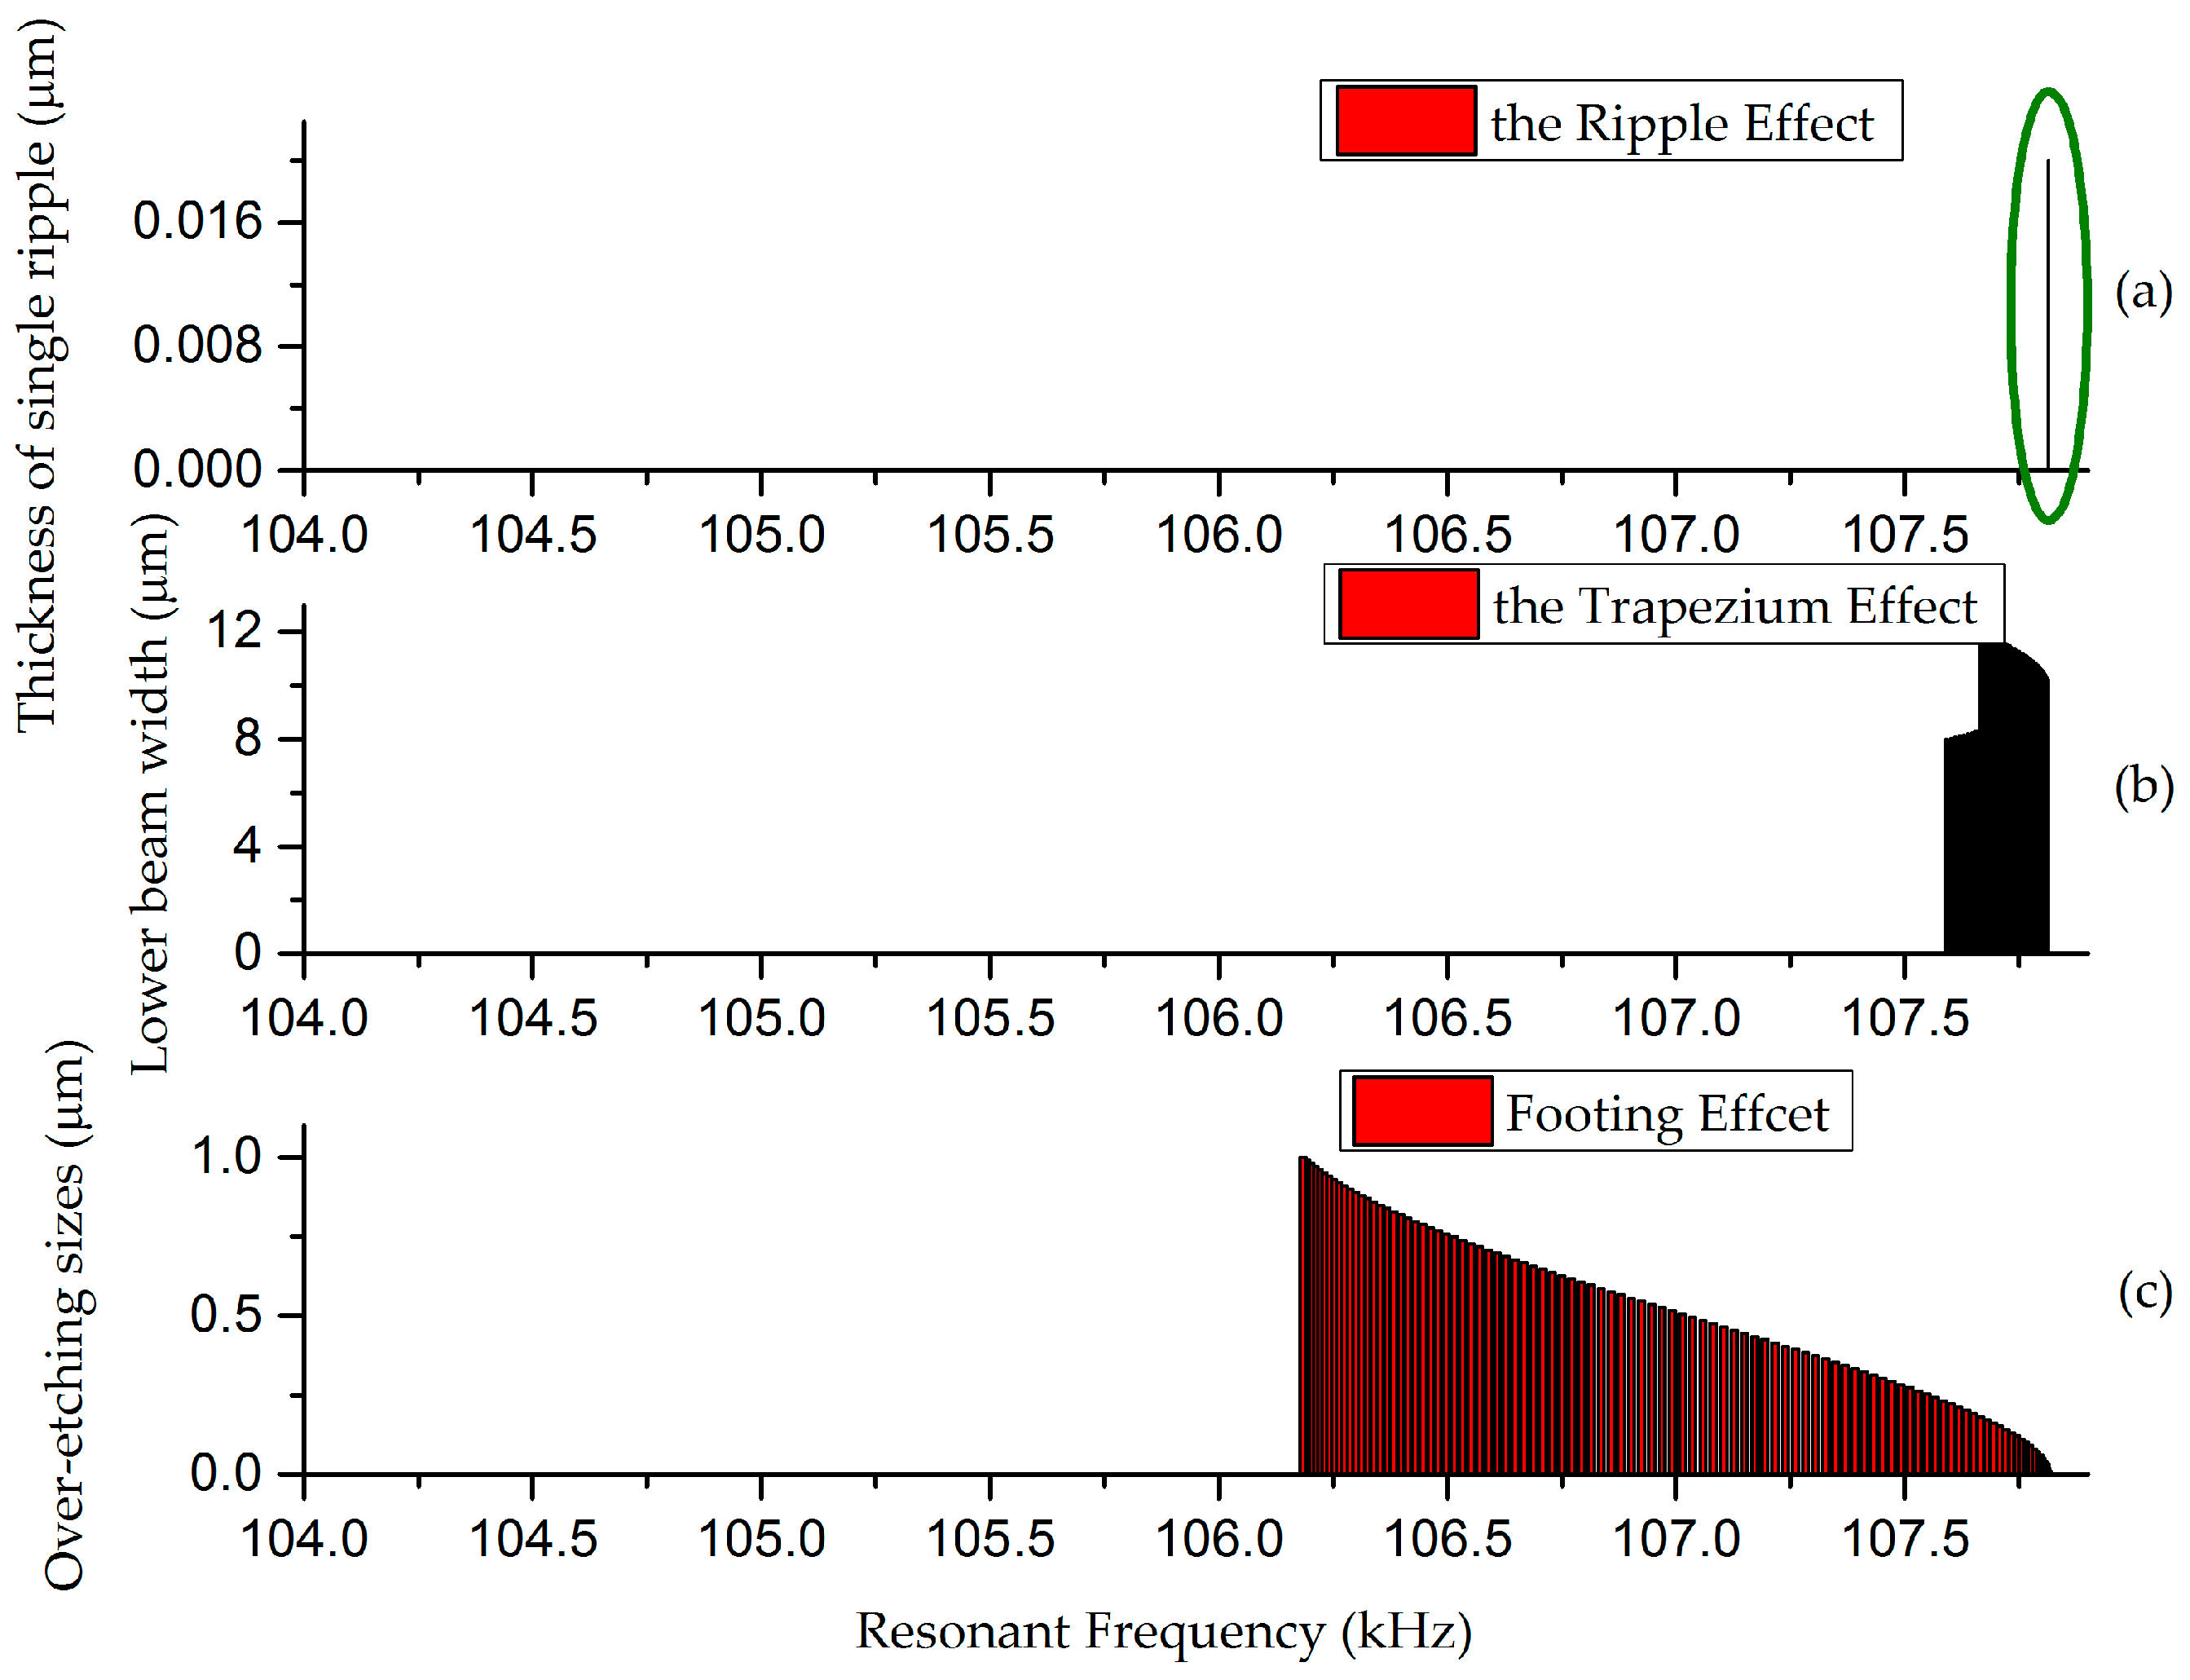
3.1. Effect of a Single Factor
3.2. Effect of Multiple Factors
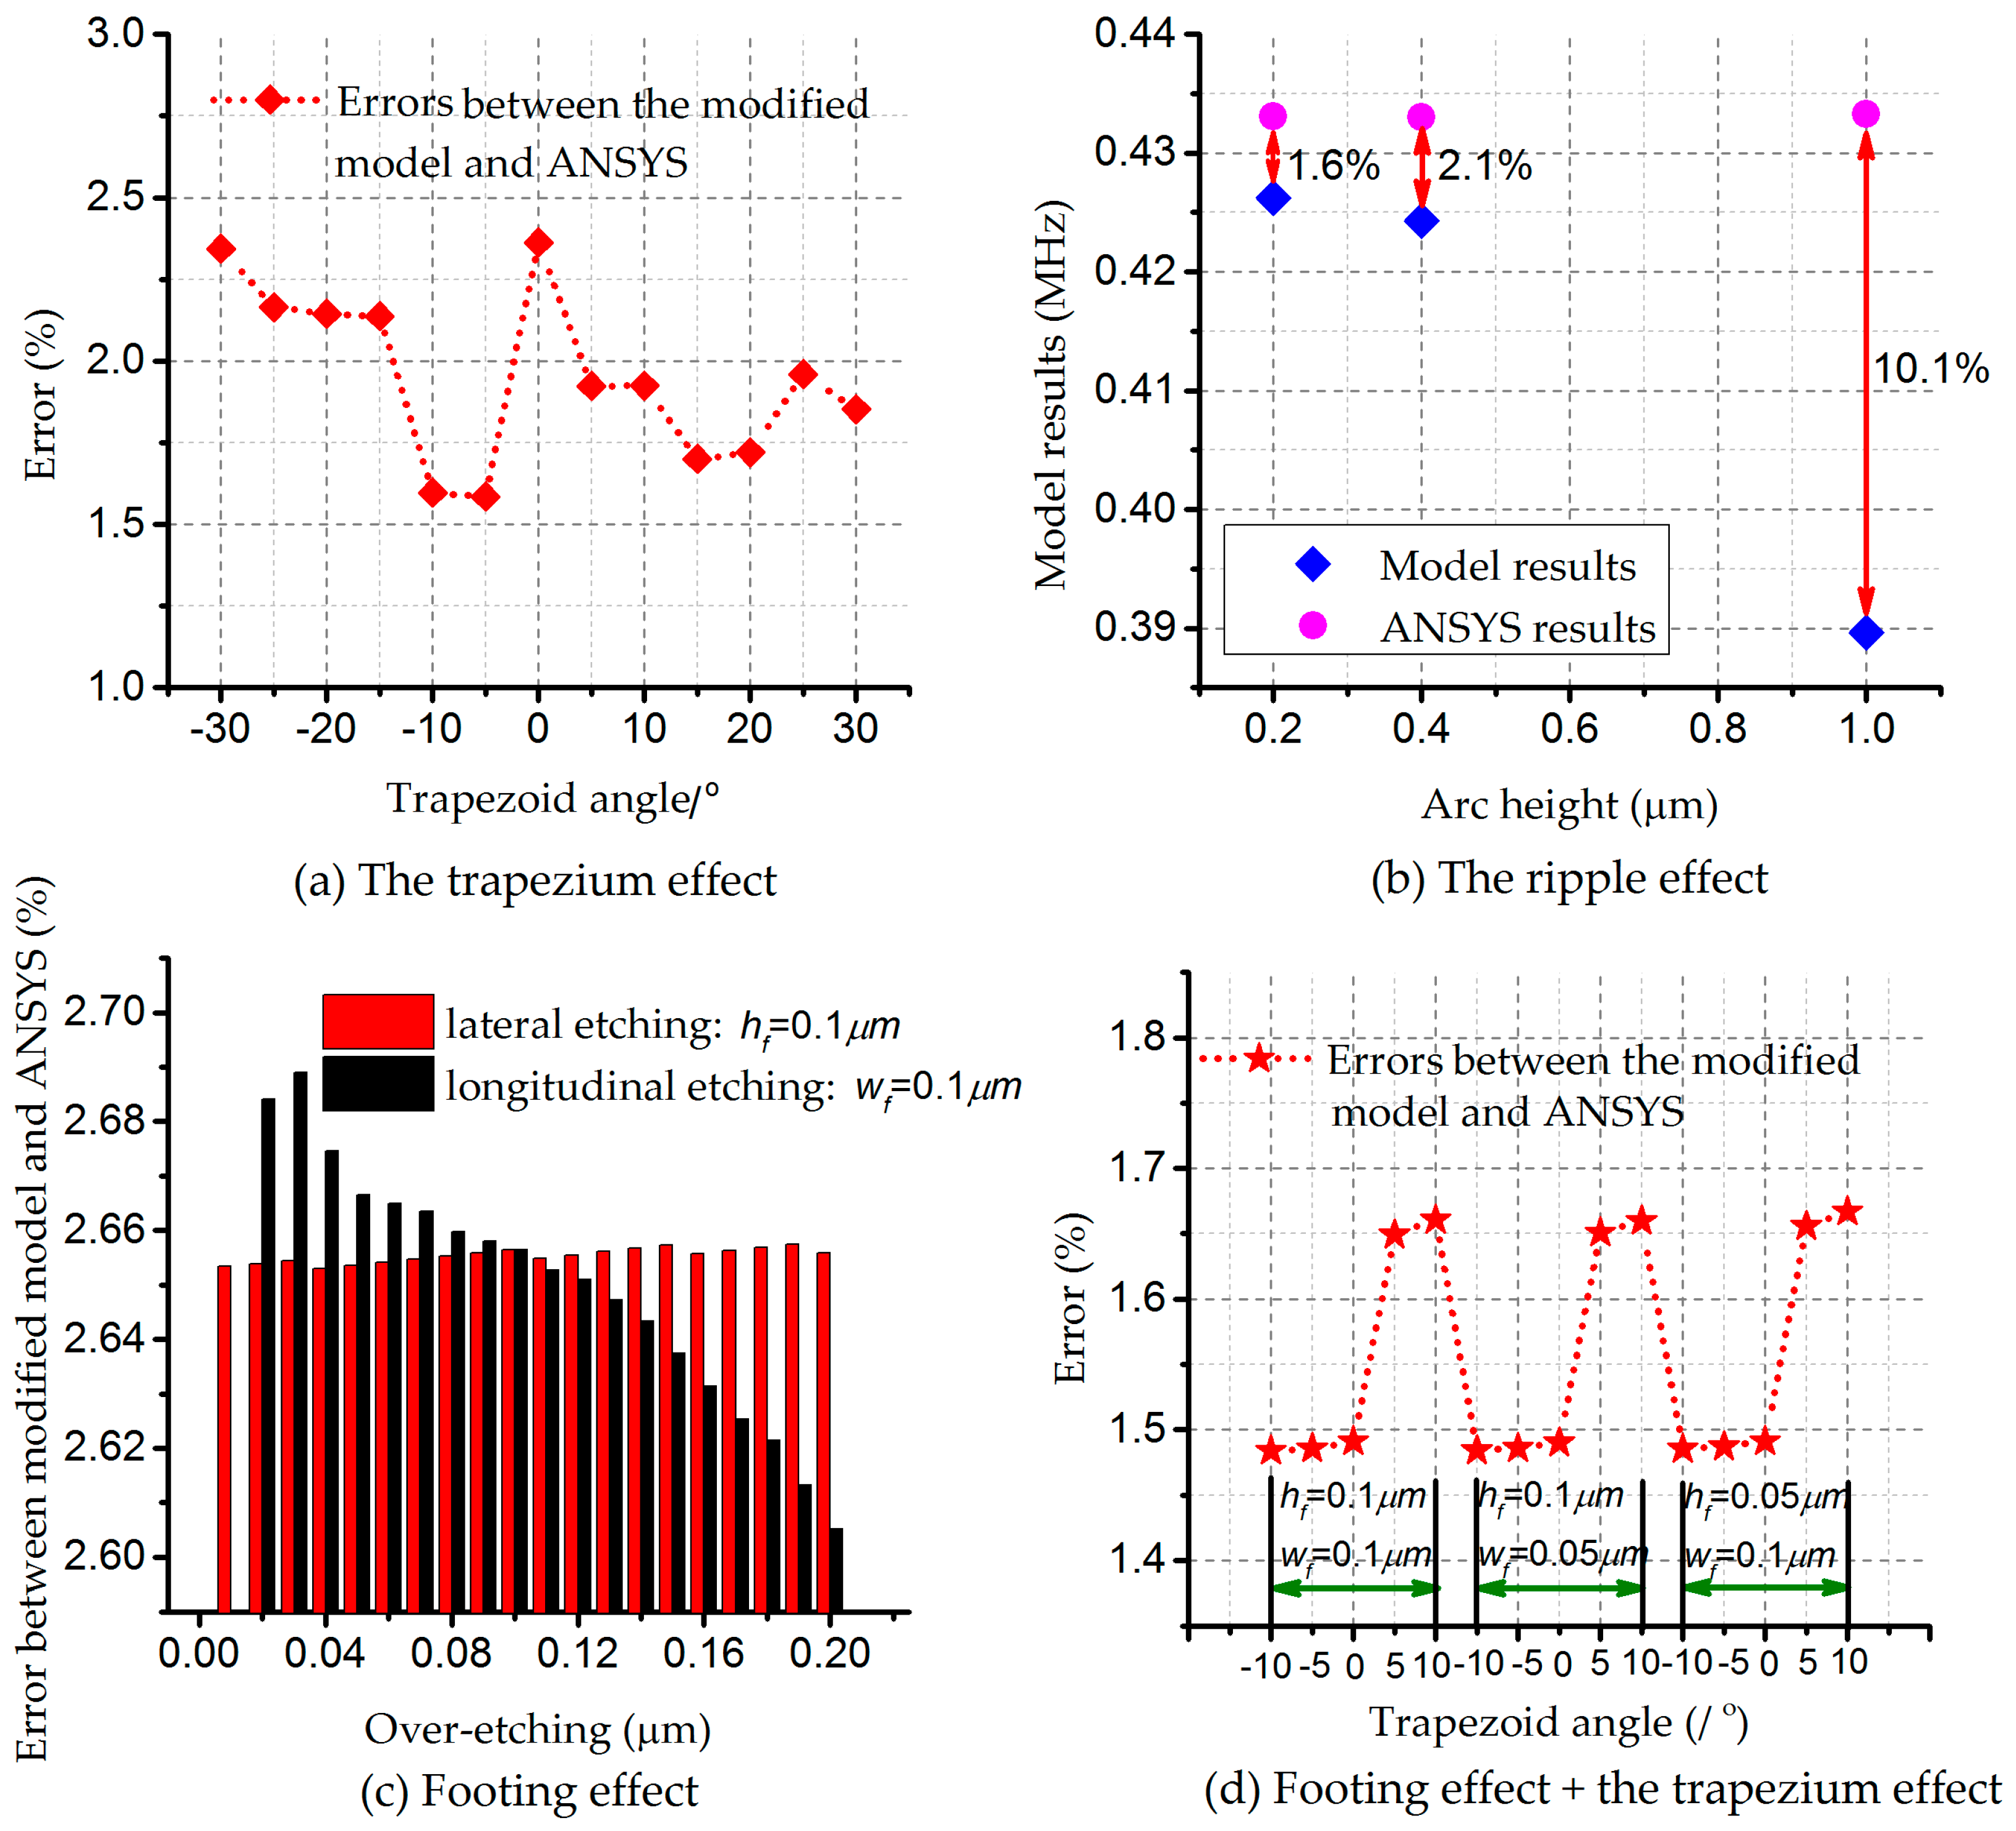
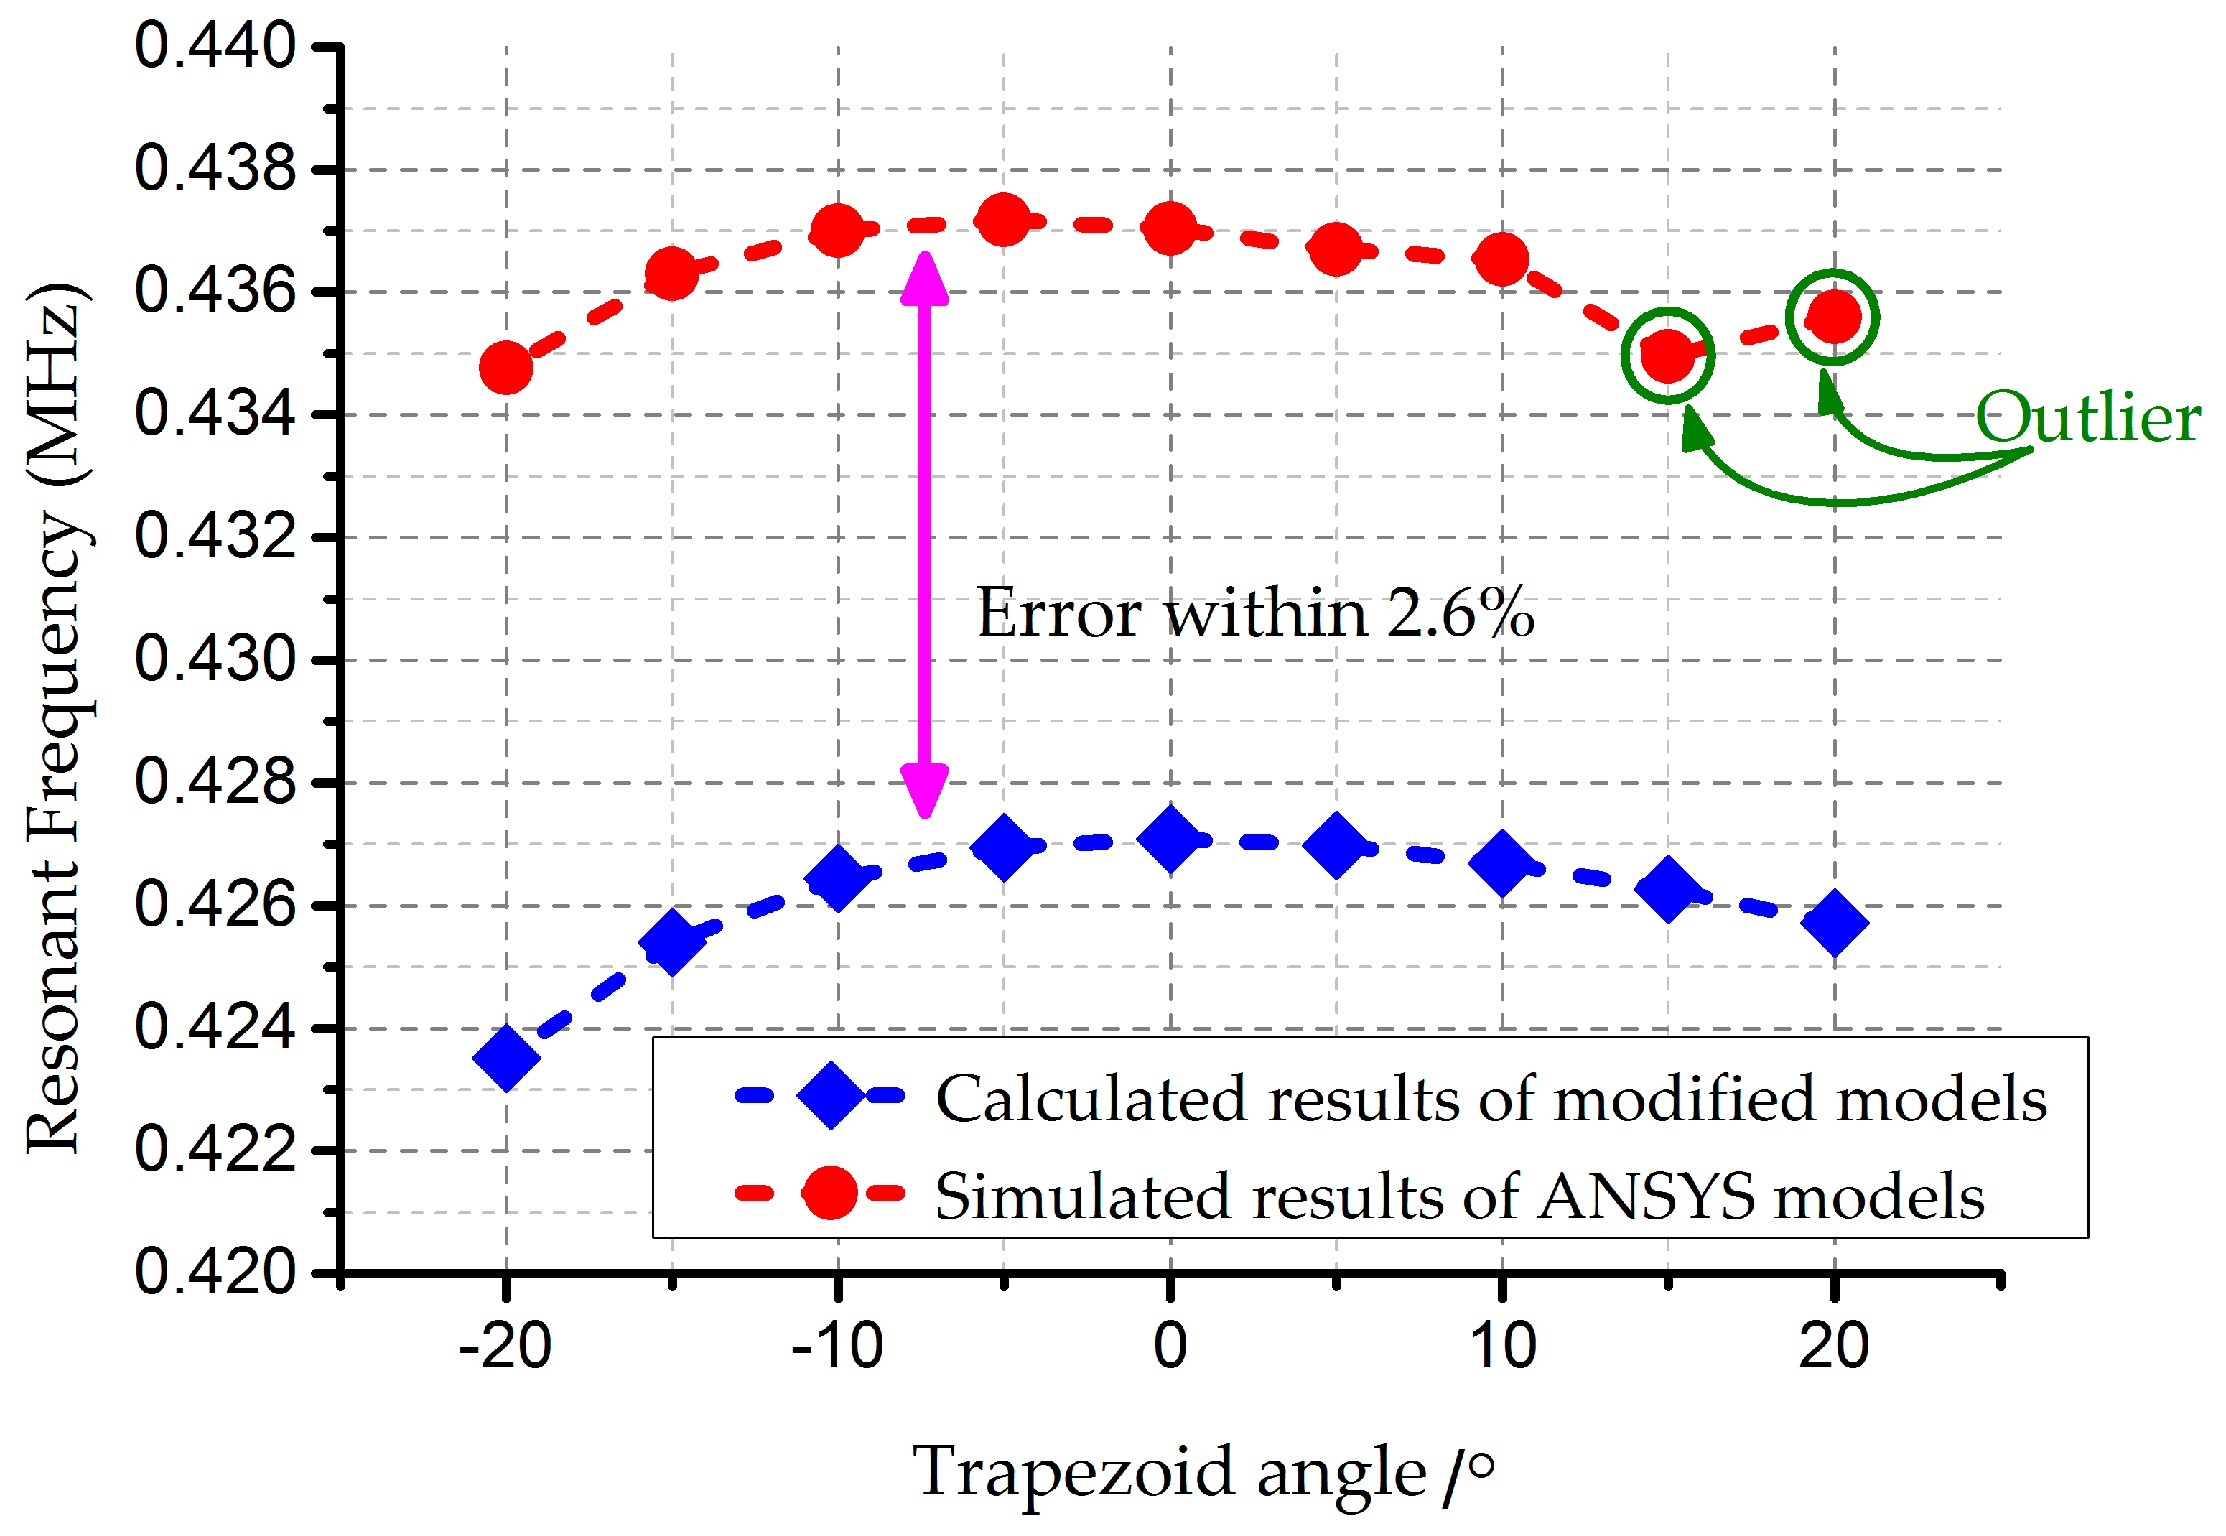
4. Analysis and Results
5. Conclusions
Acknowledgments
Author Contributions
Conflicts of Interest
Appendix A. Single Factor Effect
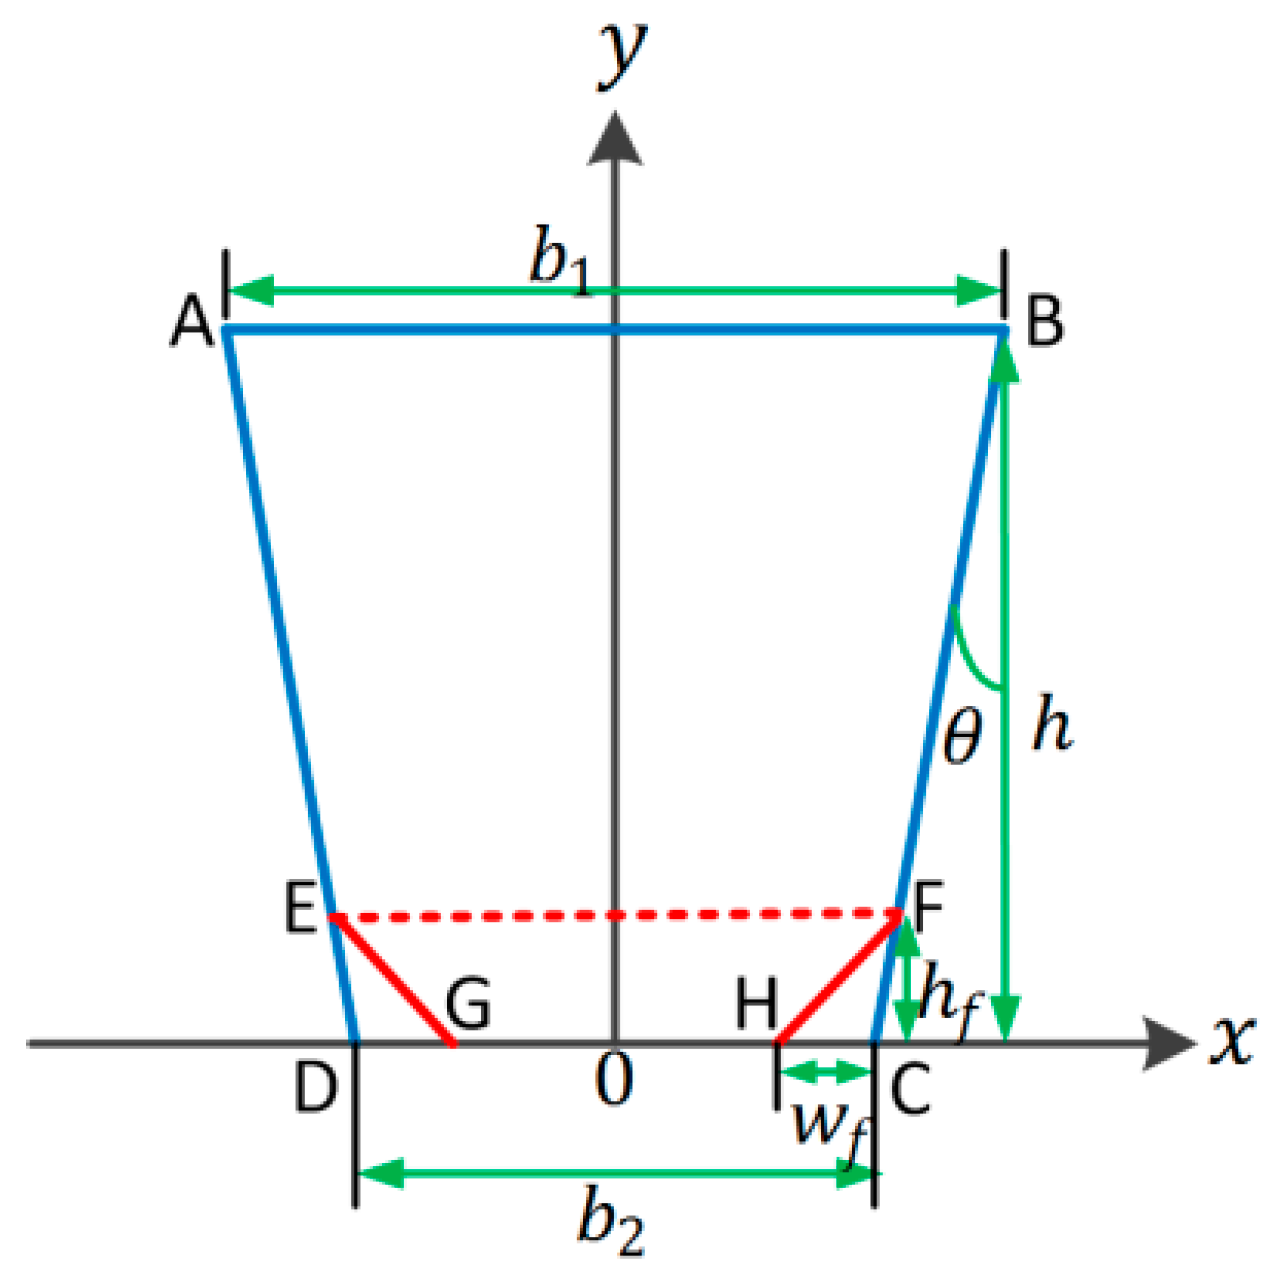
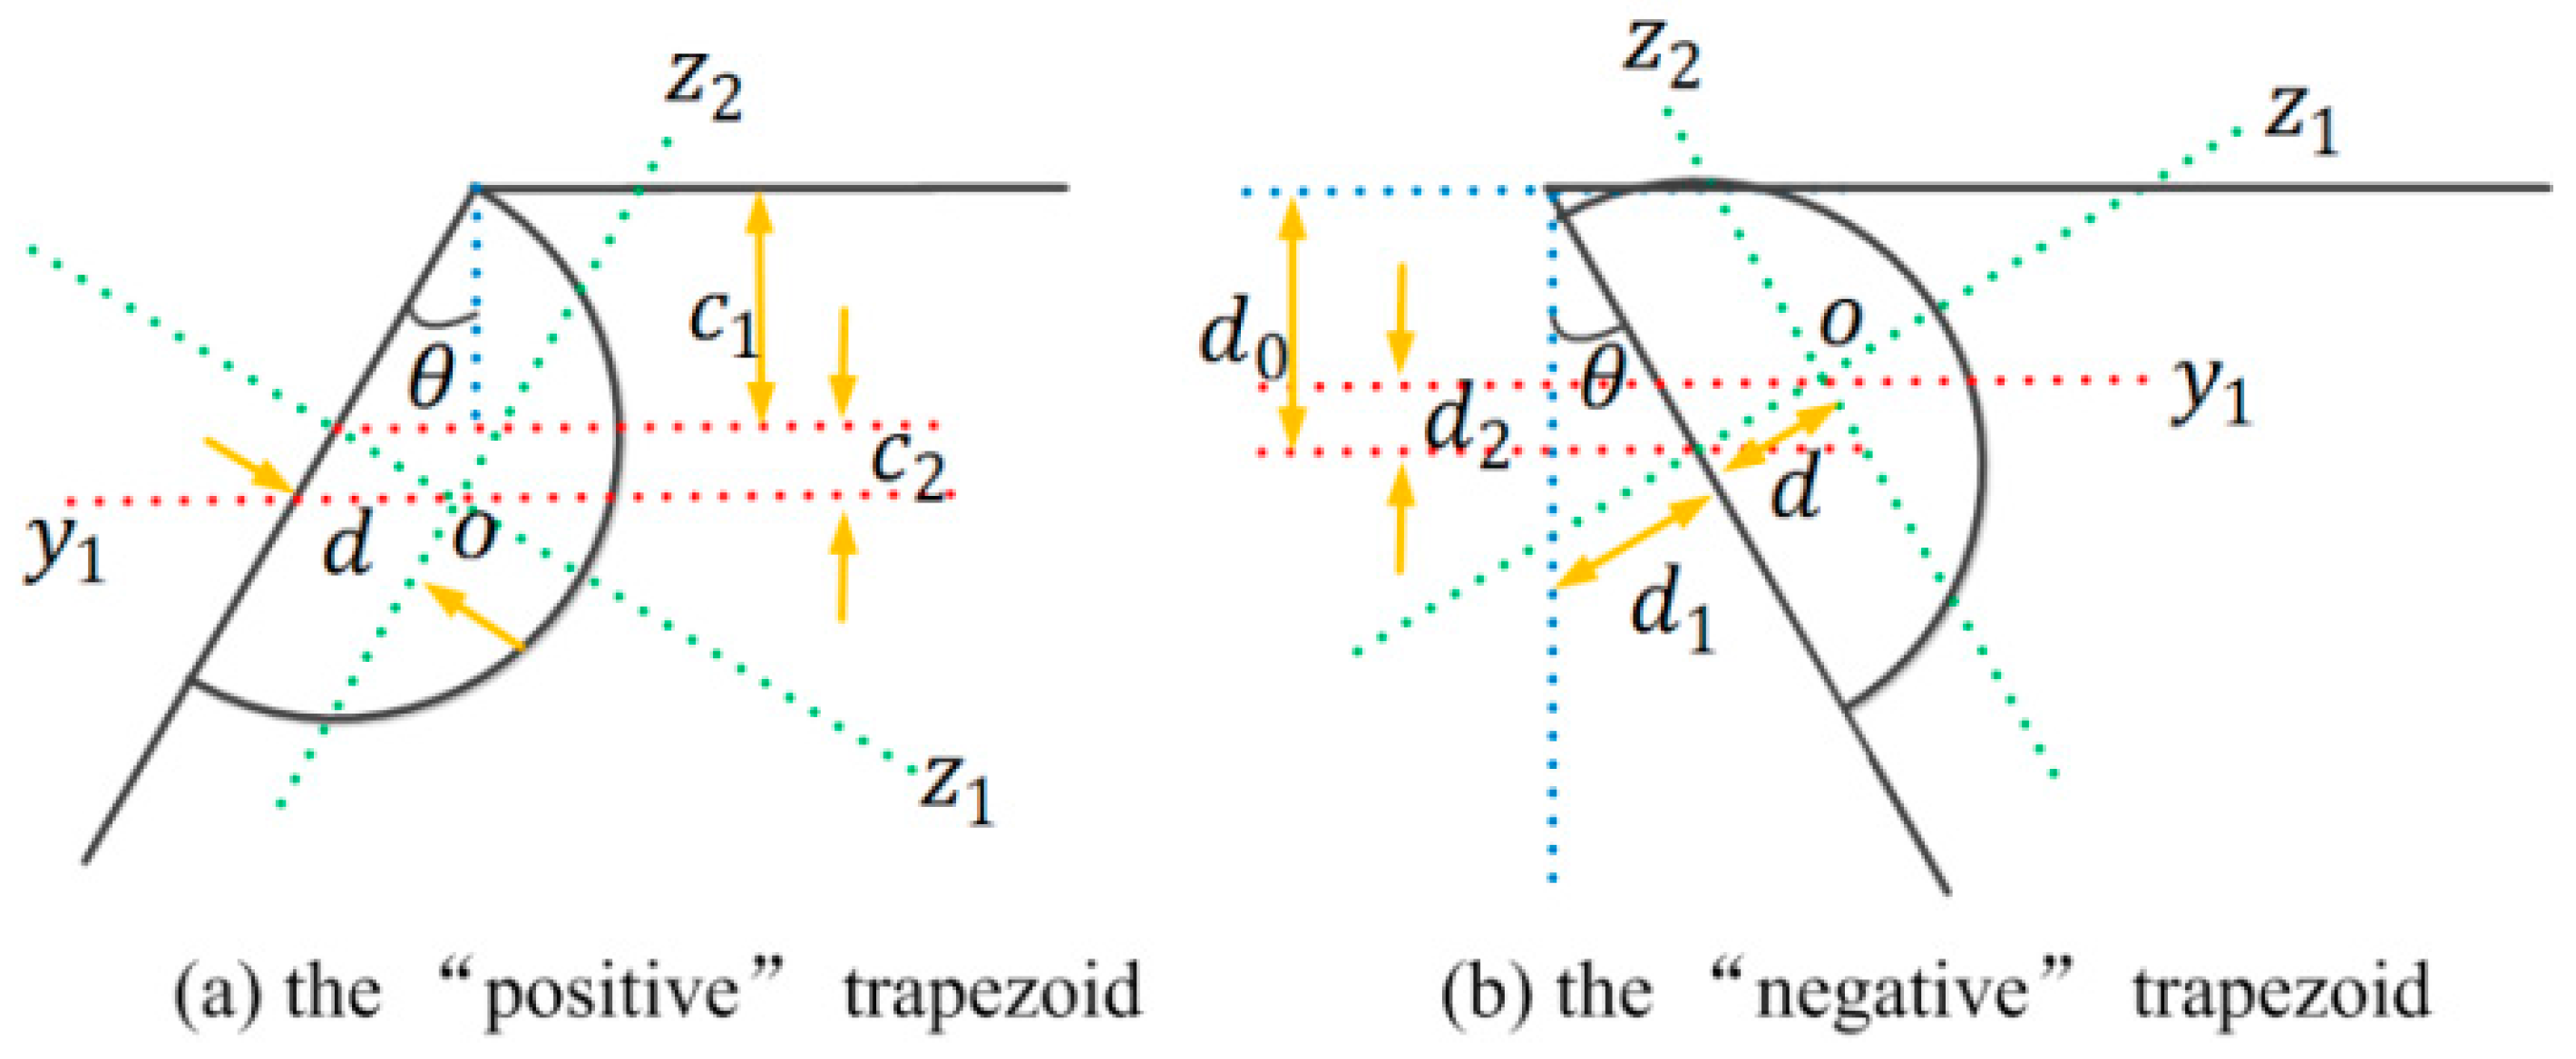
Appendix A.1. The Trapezium Effect
Appendix A.2. The Footing Effect
Appendix A.3. The Ripple Effect
Appendix B. Multiple Factors Effect
Appendix B.1. The Ripple Effect and Footing Effect
Appendix B.2. The Ripple Effect, the Footing Effect, and the Ripple Effect
References
- Reza Ghodssi, P.L. MEMS Materials and Processes Handbook; Springer: New York, NY, USA, 2011; pp. 1067–1076. [Google Scholar]
- Oropeza-Ramos, L.A.; Burgner, C.B.; Turner, K.L. Robust micro-rate sensor actuated by parametric resonance. Sens. Actuators A Phys. 2009, 152, 80–87. [Google Scholar] [CrossRef]
- Shavezipur, M.; Ponnambalam, K.; Khajepour, A.; Hashemi, S.M. Fabrication uncertainties and yield optimization in MEMS tunable capacitors. Sens. Actuators A Phys. 2008, 147, 613–622. [Google Scholar] [CrossRef]
- Lee, M.C.; Kang, S.J.; Jung, K.D.; Choa, S.-H.; Cho, Y.C. A high yield rate MEMS gyroscope with a packaged siog process. J. Micromech. Microeng. 2005, 15, 2003. [Google Scholar] [CrossRef]
- Yeom, J.; Wu, Y.; Selby, J.C.; Shannon, M.A. Maximum achievable aspect ratio in deep reactive ion etching of silicon due to aspect ratio dependent transport and the microloading effect. J. Vac. Sci. Technol. B 2005, 23, 2319–2329. [Google Scholar] [CrossRef]
- Johnson, B.N.; Mutharasan, R. Biosensing using dynamic-mode cantilever sensors: A review. Biosens. Bioelectron. 2012, 32, 1–18. [Google Scholar] [CrossRef] [PubMed]
- Lang, W. Silicon microstructuring technology. Mater. Sci. Eng. R Rep. 1996, 17, 1–55. [Google Scholar] [CrossRef]
- Younis, M.I. MEMS Linear and Nonlinear Statics and Dynamics; Springer: New York, NY, USA, 2010; p. 453. [Google Scholar]
- Milor, L. A survey of yield modeling and yield enhancement methods. IEEE Trans. Semicond. Manuf. 2013, 26, 196–213. [Google Scholar] [CrossRef]
- Islam, M.F.; Ali, M.A.M.; Majlis, B.Y. Probabilistic analysis of micro-machined fixed-fixed beam for reliability. IET Micro Nano Lett. 2008, 3, 95–100. [Google Scholar] [CrossRef]
- Liu, M.; Maute, K.; Frangopol, D.M. Multi-objective design optimization of electrostatically actuated microbeam resonators with and without parameter uncertainty. Reliab. Eng. Syst. Saf. 2007, 92, 1333–1343. [Google Scholar] [CrossRef]
- Rong, L.; Paden, B.; Turner, K. MEMS resonators that are robust to process-induced feature width variations. J. Microelectromech. Syst. 2002, 11, 505–511. [Google Scholar] [CrossRef]
- Mawardi, A.; Pitchumani, R. Design of microresonators under uncertainty. J. Microelectromech. Syst. 2005, 14, 63–69. [Google Scholar] [CrossRef]
- Bagherinia, M.; Bruggi, M.; Corigliano, A.; Mariani, S.; Lasalandra, E. Geometry optimization of a lorentz force, resonating MEMS magnetometer. Microelectron. Reliab. 2014, 54, 1192–1199. [Google Scholar] [CrossRef]
- Luo, Z.; Wang, X.; Jin, M.; Liu, S. MEMS gyroscope yield simulation based on Monte Carlo method. In Proceedings of the 2012 IEEE 62nd Electronic Components and Technology Conference, 29 May–1 June 2012; pp. 1636–1639.
- Mirzazadeh, R.; Eftekhar Azam, S.; Mariani, S. Micromechanical characterization of polysilicon films through on-chip tests. Sensors 2016, 16, 1191. [Google Scholar] [CrossRef] [PubMed]
- Mirzazadeh, R.G.A.; Mariani, S. Assessment of overetch and polysilicon film properties through on-chip tests. In Proceedings of the 2nd International Electronic Conference on Sensors and Applications, Basel, Switzerland, 15–30 November 2015.
- Mirzazadeh, R.M.S. Assessment of micromechanically-induced uncertainties in the electromechanical response of MEMS devices. In Proceedings of the 3rd International Electronic Conference on Sensors and Applications, Basel, Switzerland, 15–30 November 2016.
- Shavezipur, M.; Ponnambalam, K.; Hashemi, S.M.; Khajepour, A. A probabilistic design optimization for MEMS tunable capacitors. Microelectron. J. 2008, 39, 1528–1533. [Google Scholar] [CrossRef]
- Allen, M.; Raulli, M.; Maute, K.; Frangopol, D.M. Reliability-based analysis and design optimization of electrostatically actuated mems. Comput. Struct. 2004, 82, 1007–1020. [Google Scholar] [CrossRef]
- Pfingsten, T.; Herrmann, D.J.L.; Rasmussen, C.E. Model-based design analysis and yield optimization. IEEE Trans. Semicond. Manuf. 2006, 19, 475–486. [Google Scholar] [CrossRef]
- Vudathu, S.P.; Duganapalli, K.K.; Laur, R.; Kubalinska, D.; Bunse-Gerstner, A. Yield analysis via induction of process statistics into the design of MEMS and other microsystems. Microsyst. Technol. 2007, 13, 1545–1551. [Google Scholar] [CrossRef]
- Engesser, M.; Buhmann, A.; Franke, A.R.; Korvink, J.G. Efficient reliability-based design optimization for microelectromechanical systems. IEEE Sens. J. 2010, 10, 1383–1390. [Google Scholar] [CrossRef]
- Agarwal, N.; Aluru, N.R. Stochastic modeling of coupled electromechanical interaction for uncertainty quantification in electrostatically actuated mems. Comput. Methods Appl. Mech. Eng. 2008, 197, 3456–3471. [Google Scholar] [CrossRef]
- Dewey, A.; Ren, H.; Zhang, T. Behavioral modeling of microelectromechanical systems (MEMS) with statistical performance-variability reduction and sensitivity analysis. IEEE Trans. Circuits Syst. II Analog Digit. Signal Process. 2000, 47, 105–113. [Google Scholar] [CrossRef]
- Vudathu, S.P.; Laur, R. A design methodology for the yield enhancement of MEMS designs with respect to process induced variations. In Proceedings of the 57th Electronic Components and Technology Conference, Sparks, NV, USA, 29 May–1 June 2007.
- ANSYS Academic Research, Release 16.2, Help System, ANSYS, Inc. Available online: http://ansys.com/products/academic (accessed on 3 March 2017).
- Laermer, F.; Schilp, A. Method of Anisotropically Etching Silicon. U.S. Patent US5501893, 26 March 1996. [Google Scholar]
- Laermer, F.; Schilp, A. Method for Anisotropic Etching of Silicon. U.S. Patent US6284148, 4 September 2001. [Google Scholar]
- Laermer, F.; Schilp, A. Method of Anisotropic Etching of Silicon. U.S. Patent US6531068, 11 March 2003. [Google Scholar]
- Wu, B. A statistically optimal macromodeling framework with application in process variation analysis of MEMS devices. In Proceedings of the 2012 IEEE 10th International New Circuits and Systems Conference (NEWCAS), Montreal, QC, Canada, 17–20 June 2012; pp. 221–224.
- Liu, C. Foundations of MEMS; Prentice Hall Press: Upper Saddle River, NJ, USA, 2011; p. 560. [Google Scholar]
- Weaver, W., Jr.; Timoshenko, S.P.; Young, D.H. Vibration Problems in Engineering; Wiley: New York, NY, USA, 1974; pp. 415–455. [Google Scholar]
- Cowen, A.; Hardy, B.; Mahadevan, R.; Wilcenski, S. PolyMUMPs Design Handbook; MEMSCAP Inc.: Durham, NC, USA, 2011. [Google Scholar]
- Cowen, A.; Hames, G.; Monk, D.; Wilcenski, S.; Hardy, B. SoiMUMPs Design Handbook; MEMSCAP Inc.: Durham, NC, USA, 2011. [Google Scholar]


| Structure Parameters | Values |
|---|---|
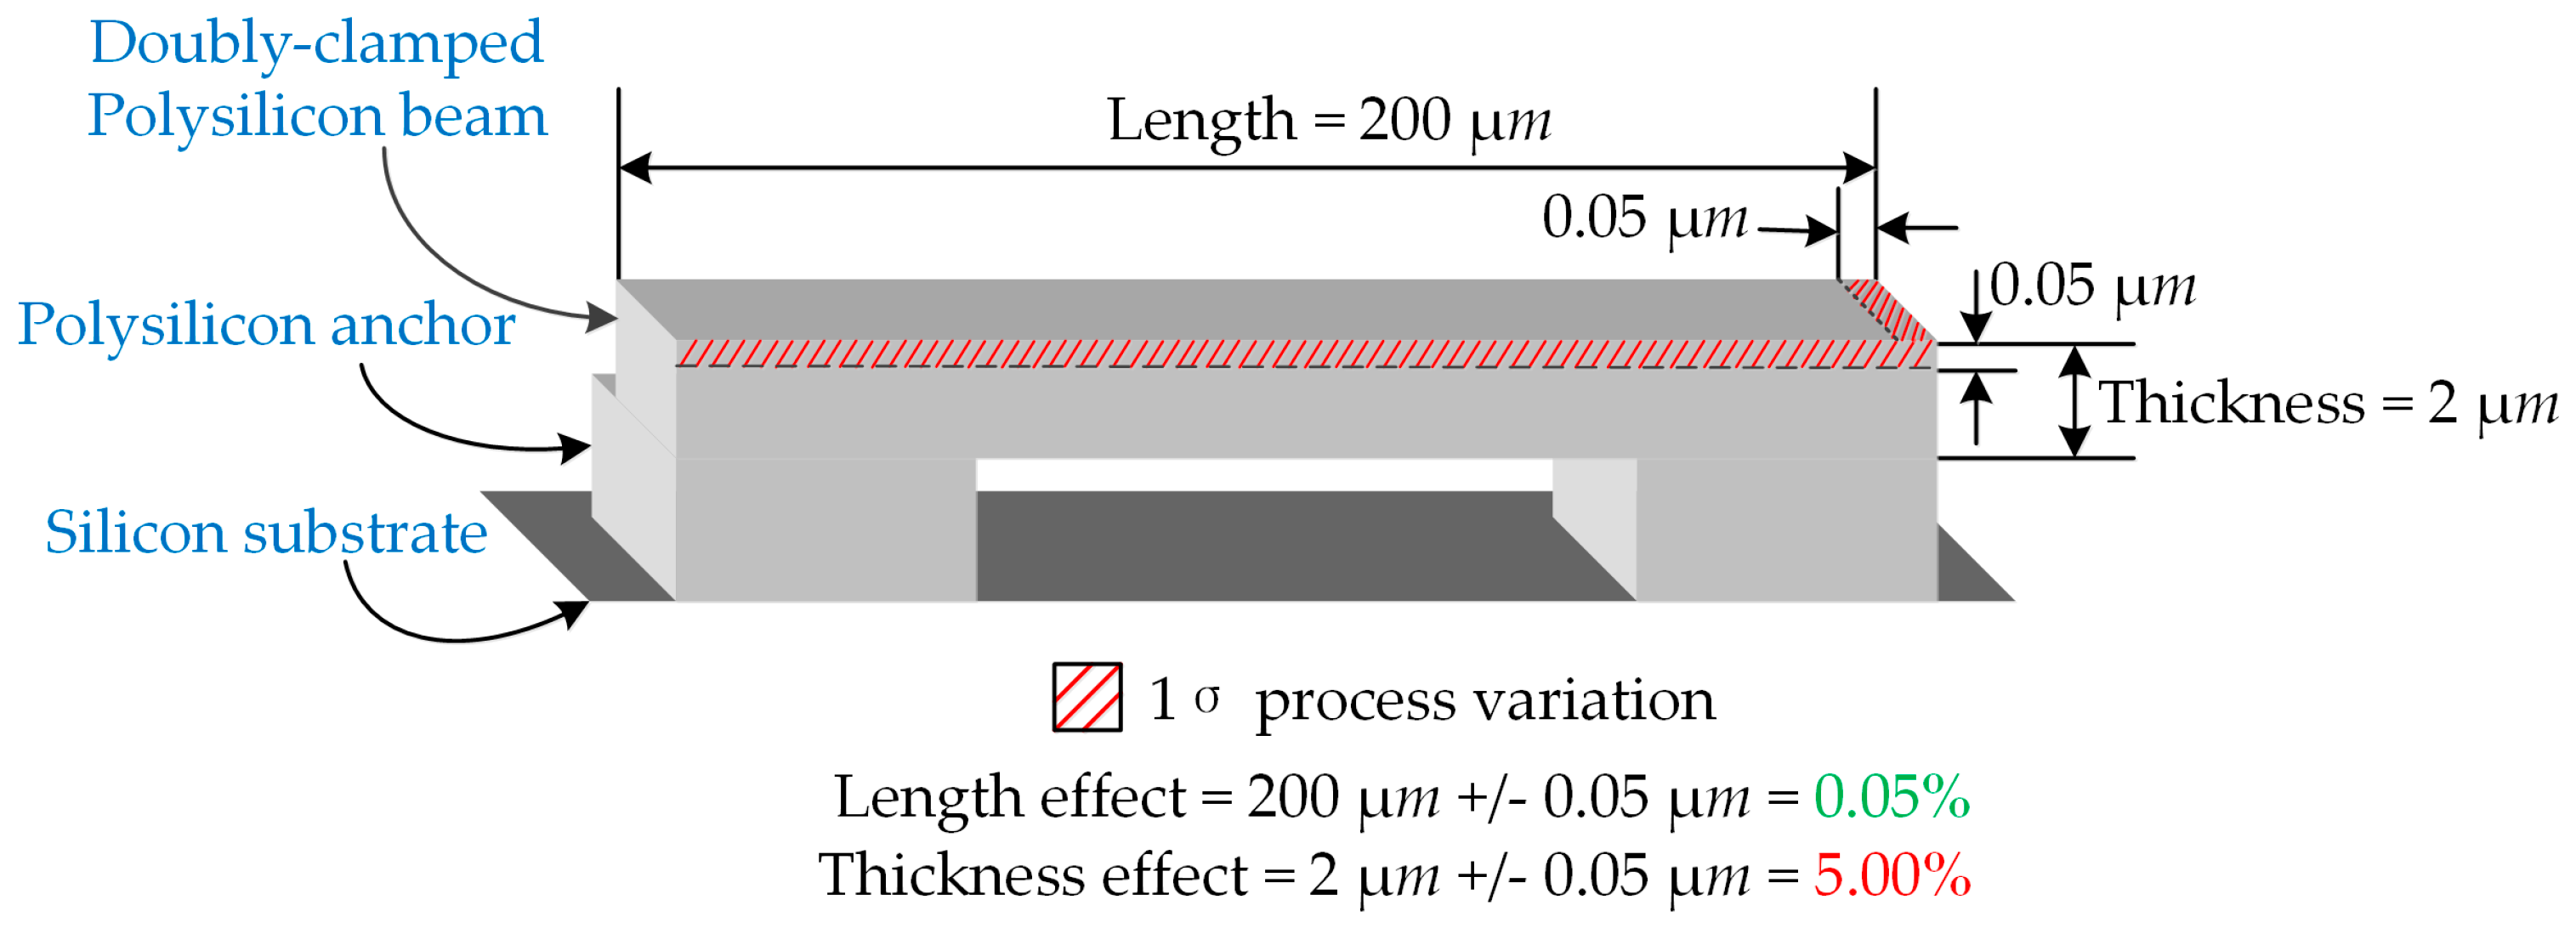
| Beam length | 200 |
| Beam width | 4 |
| Beam thickness | 2 |
| Young’s modulus | 158 |
| Material density |
© 2017 by the authors. Licensee MDPI, Basel, Switzerland. This article is an open access article distributed under the terms and conditions of the Creative Commons Attribution (CC BY) license ( http://creativecommons.org/licenses/by/4.0/).
Share and Cite
Gao, L.; Zhou, Z.-F.; Huang, Q.-A. Modeling of the Effect of Process Variations on a Micromachined Doubly-Clamped Beam. Micromachines 2017, 8, 81. https://doi.org/10.3390/mi8030081
Gao L, Zhou Z-F, Huang Q-A. Modeling of the Effect of Process Variations on a Micromachined Doubly-Clamped Beam. Micromachines. 2017; 8(3):81. https://doi.org/10.3390/mi8030081
Chicago/Turabian StyleGao, Lili, Zai-Fa Zhou, and Qing-An Huang. 2017. "Modeling of the Effect of Process Variations on a Micromachined Doubly-Clamped Beam" Micromachines 8, no. 3: 81. https://doi.org/10.3390/mi8030081