Tongue Pressure Sensing Array Integrated with a System-on-Chip Embedded in a Mandibular Advancement Splint

Abstract
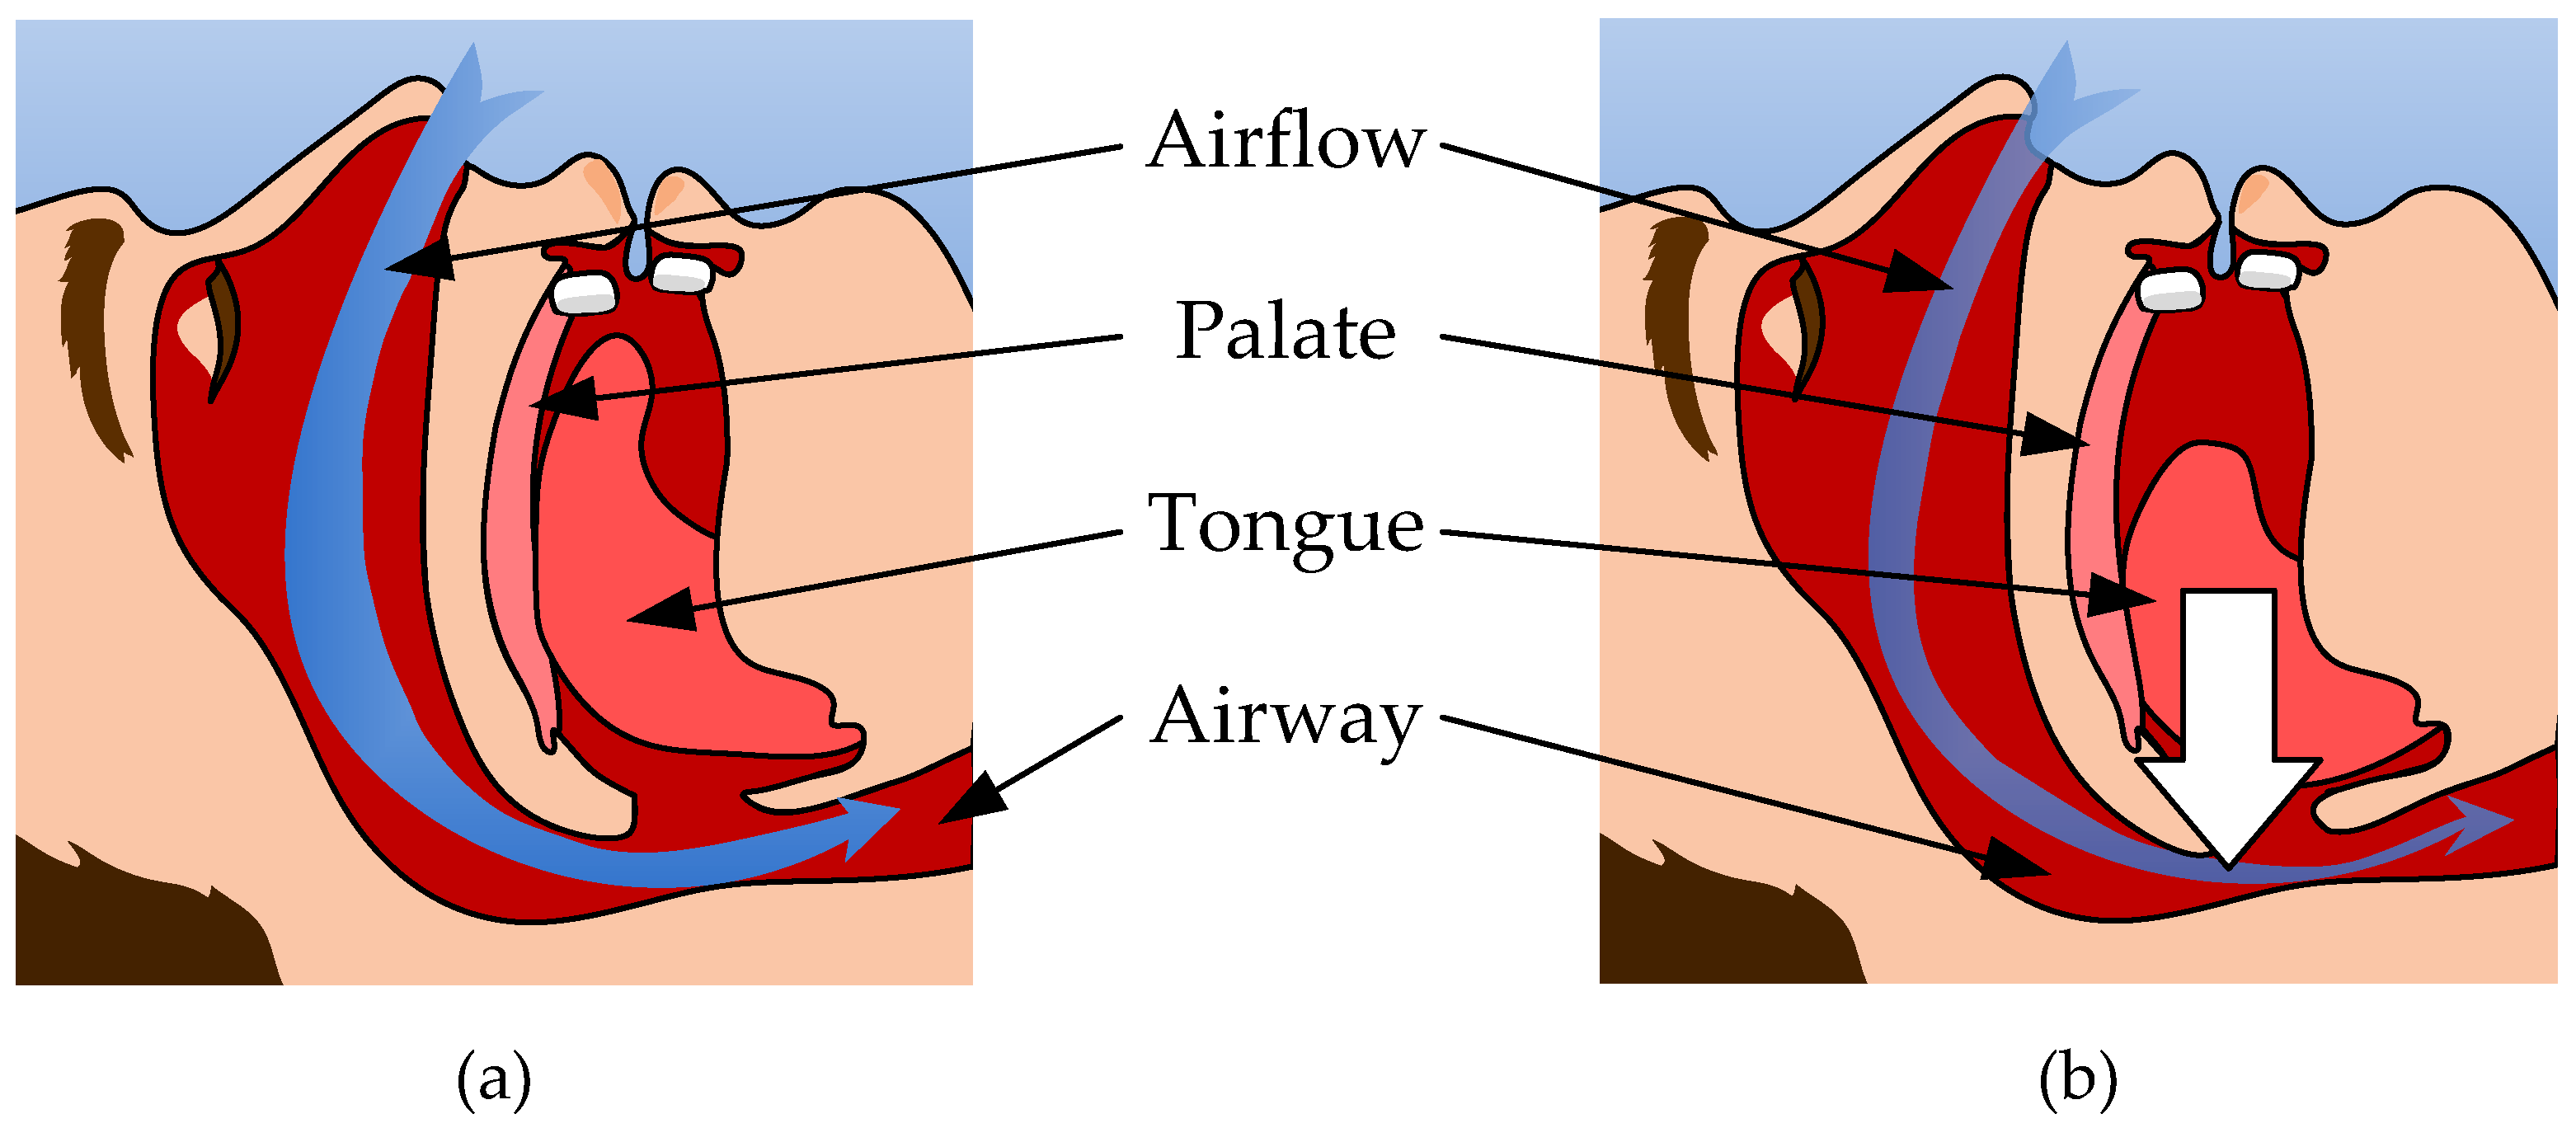
:1. Introduction
2. Device Design and Operational Principles
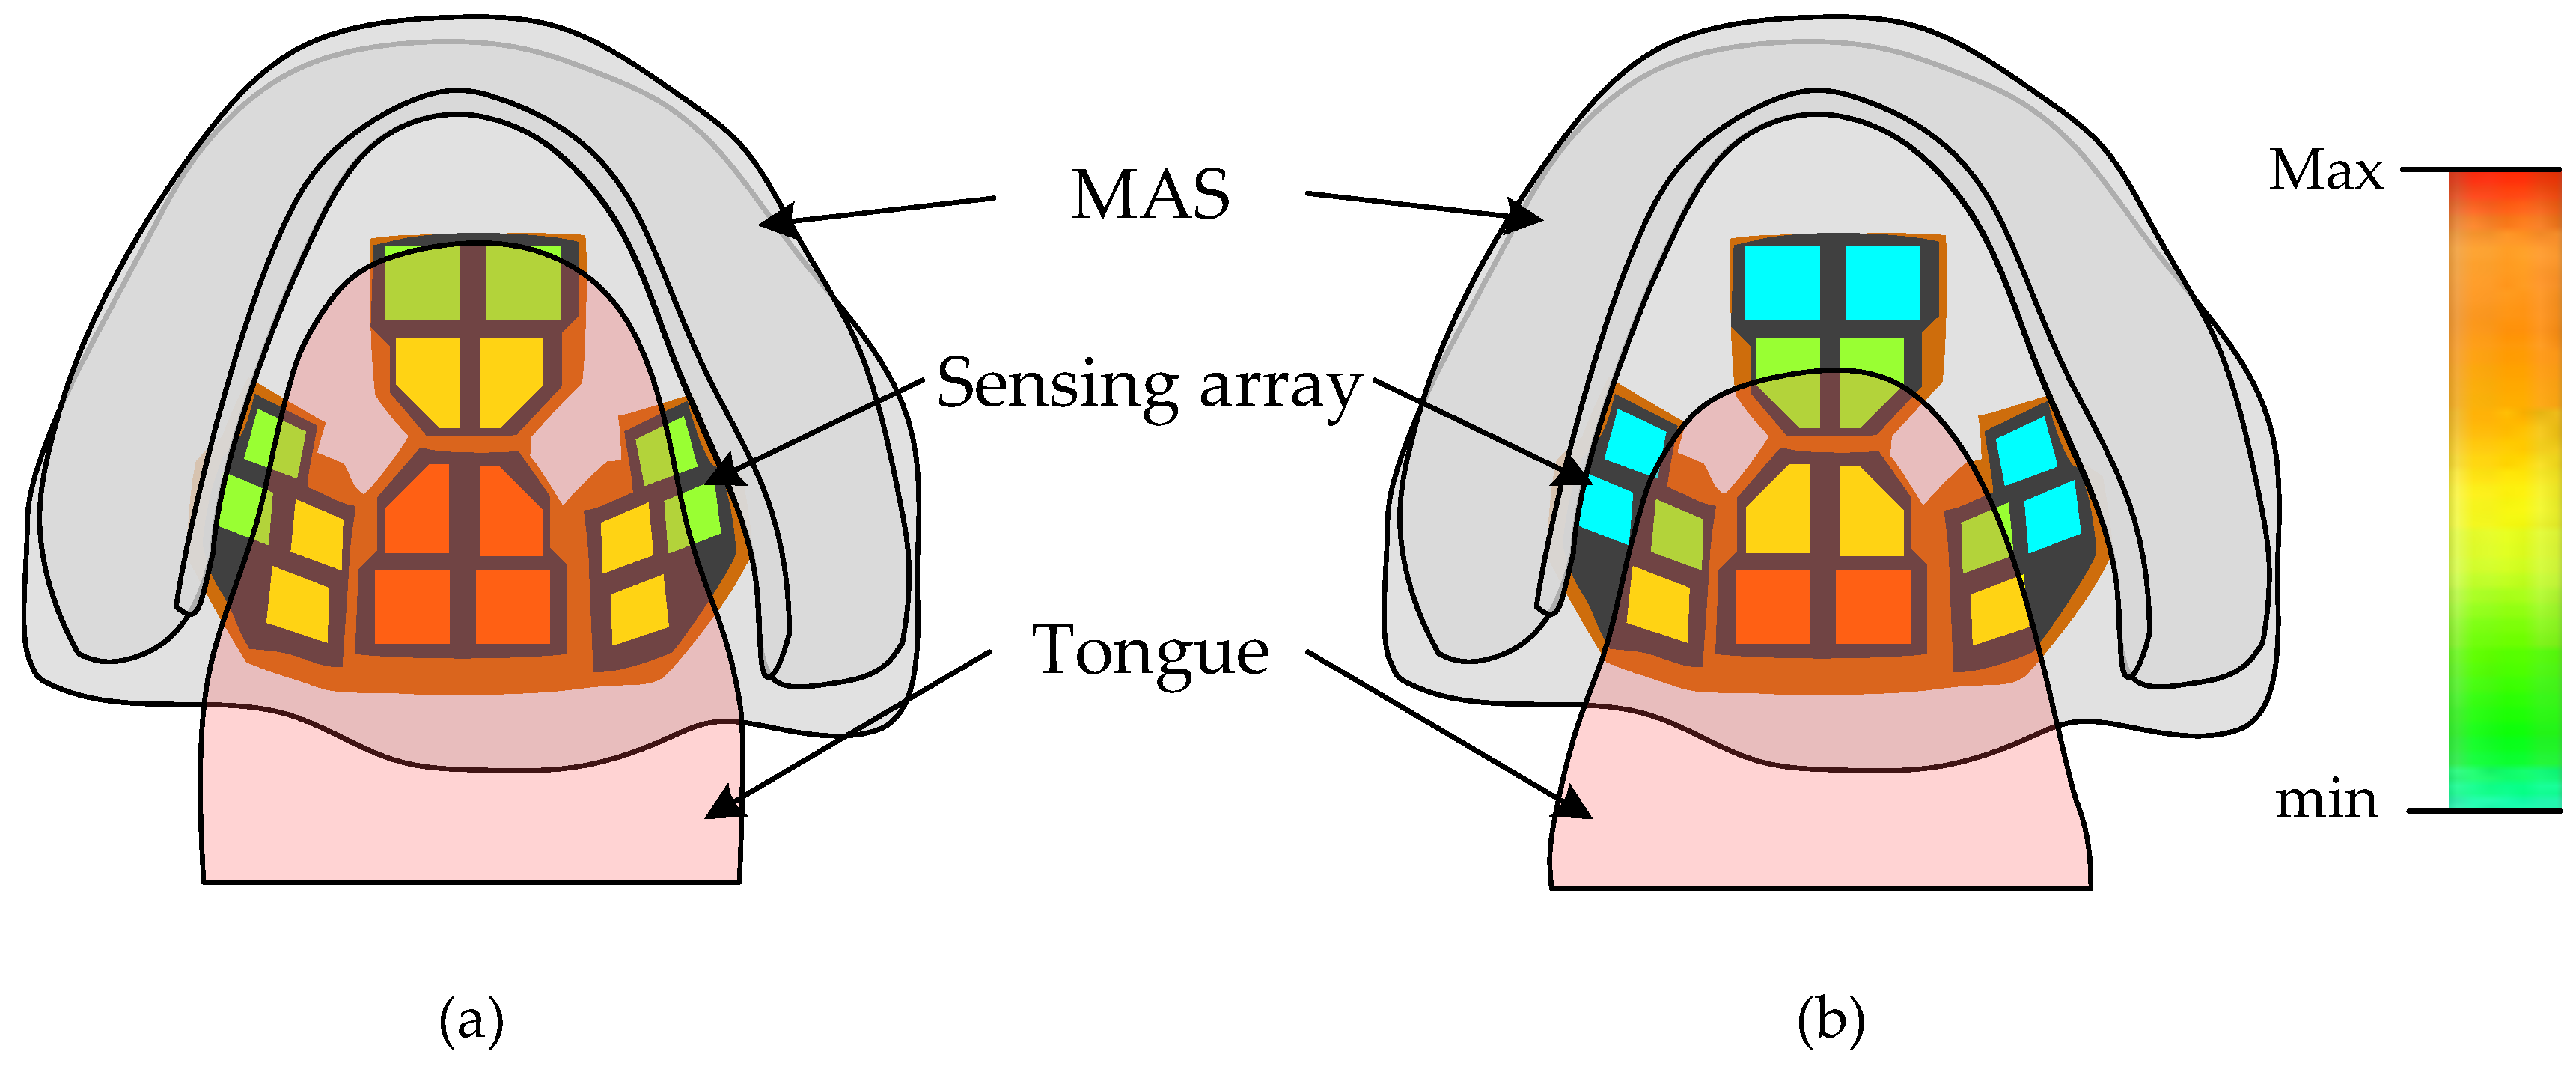
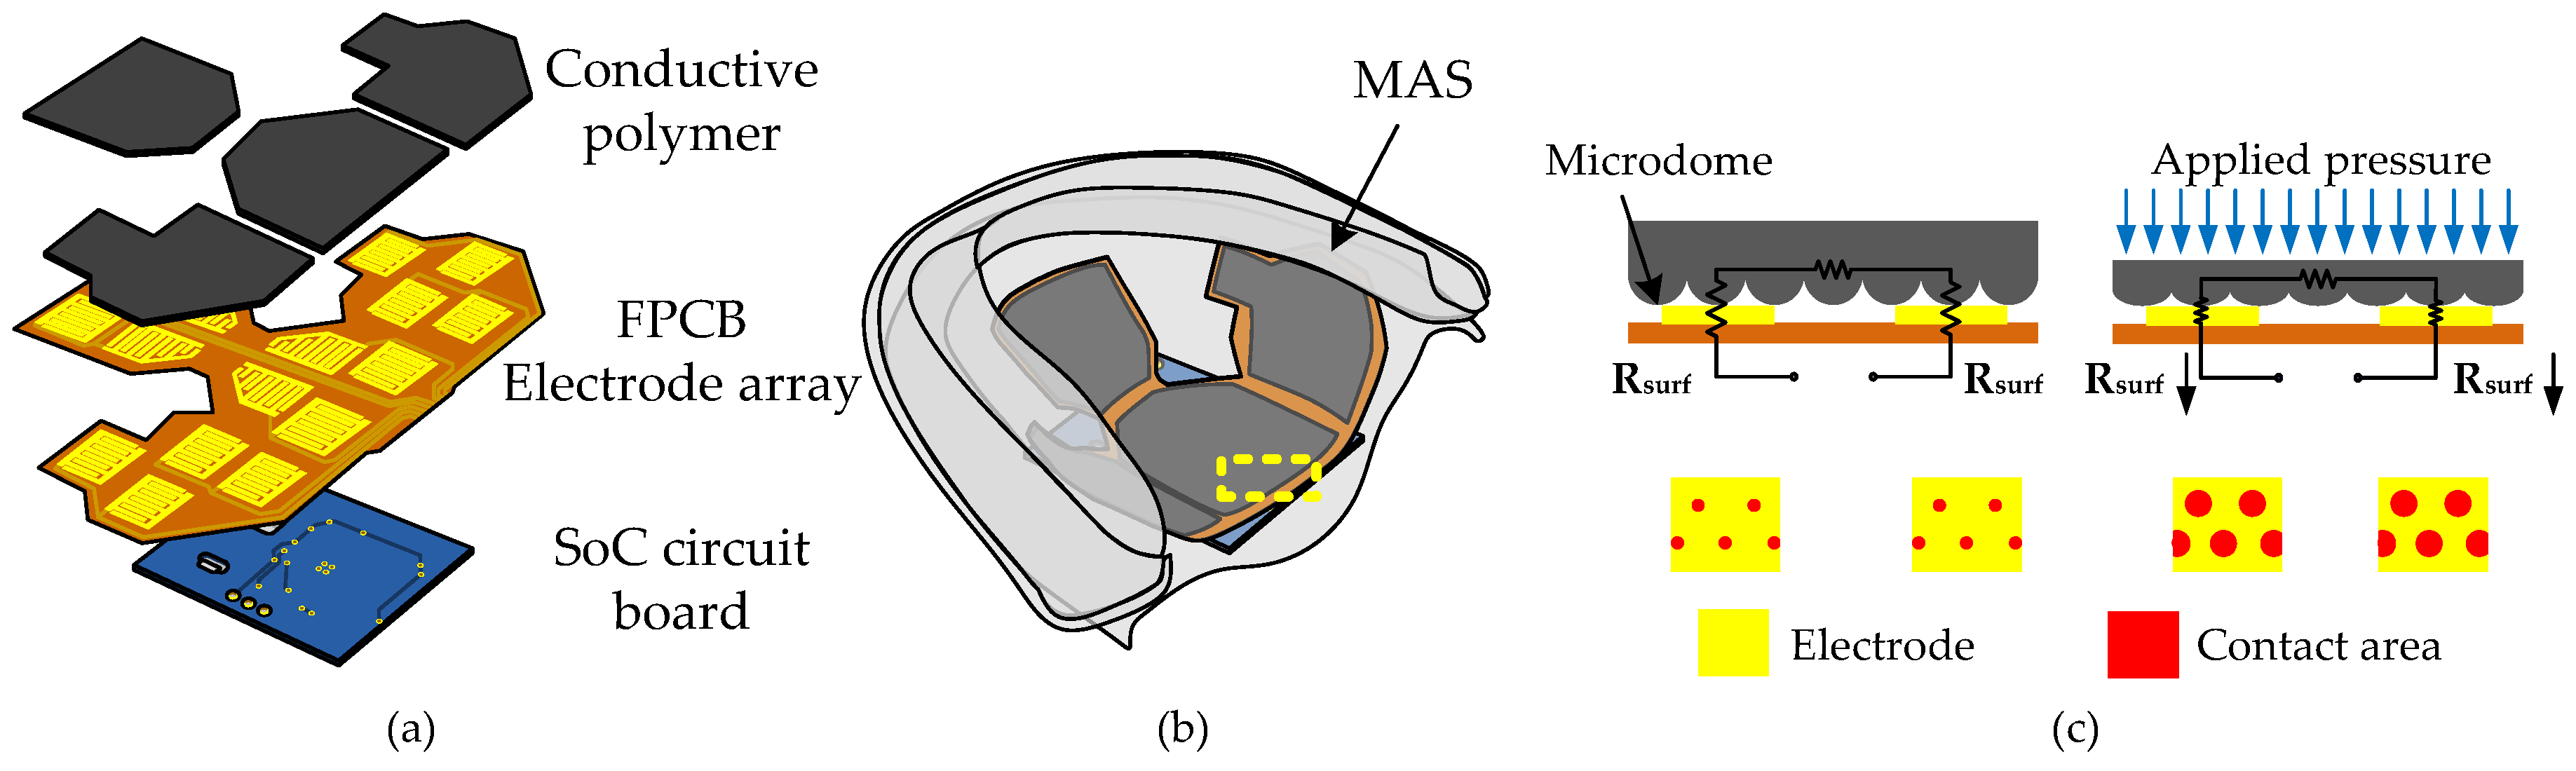
2.1. Sensor Array Principle and Design
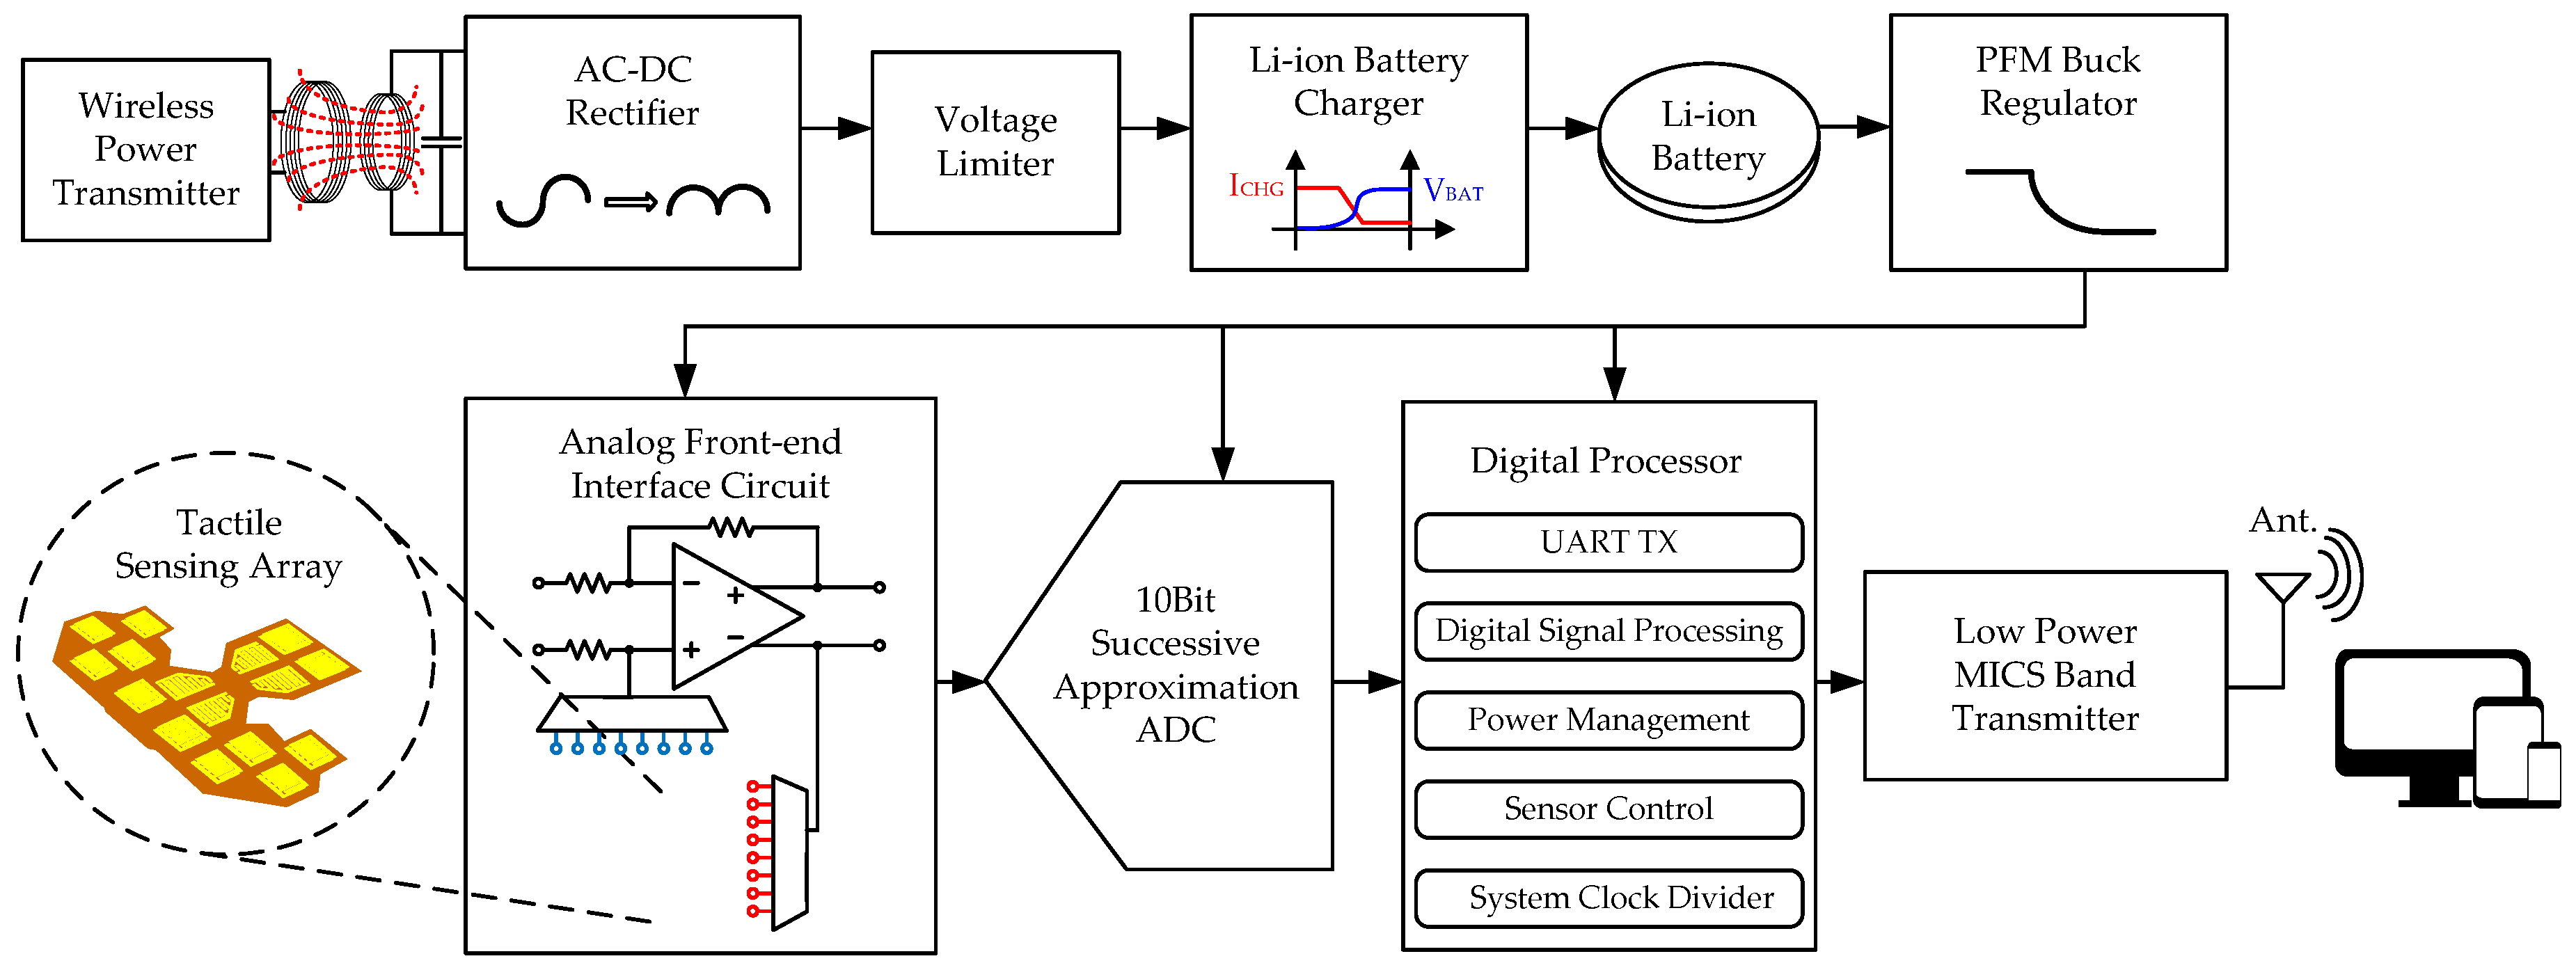
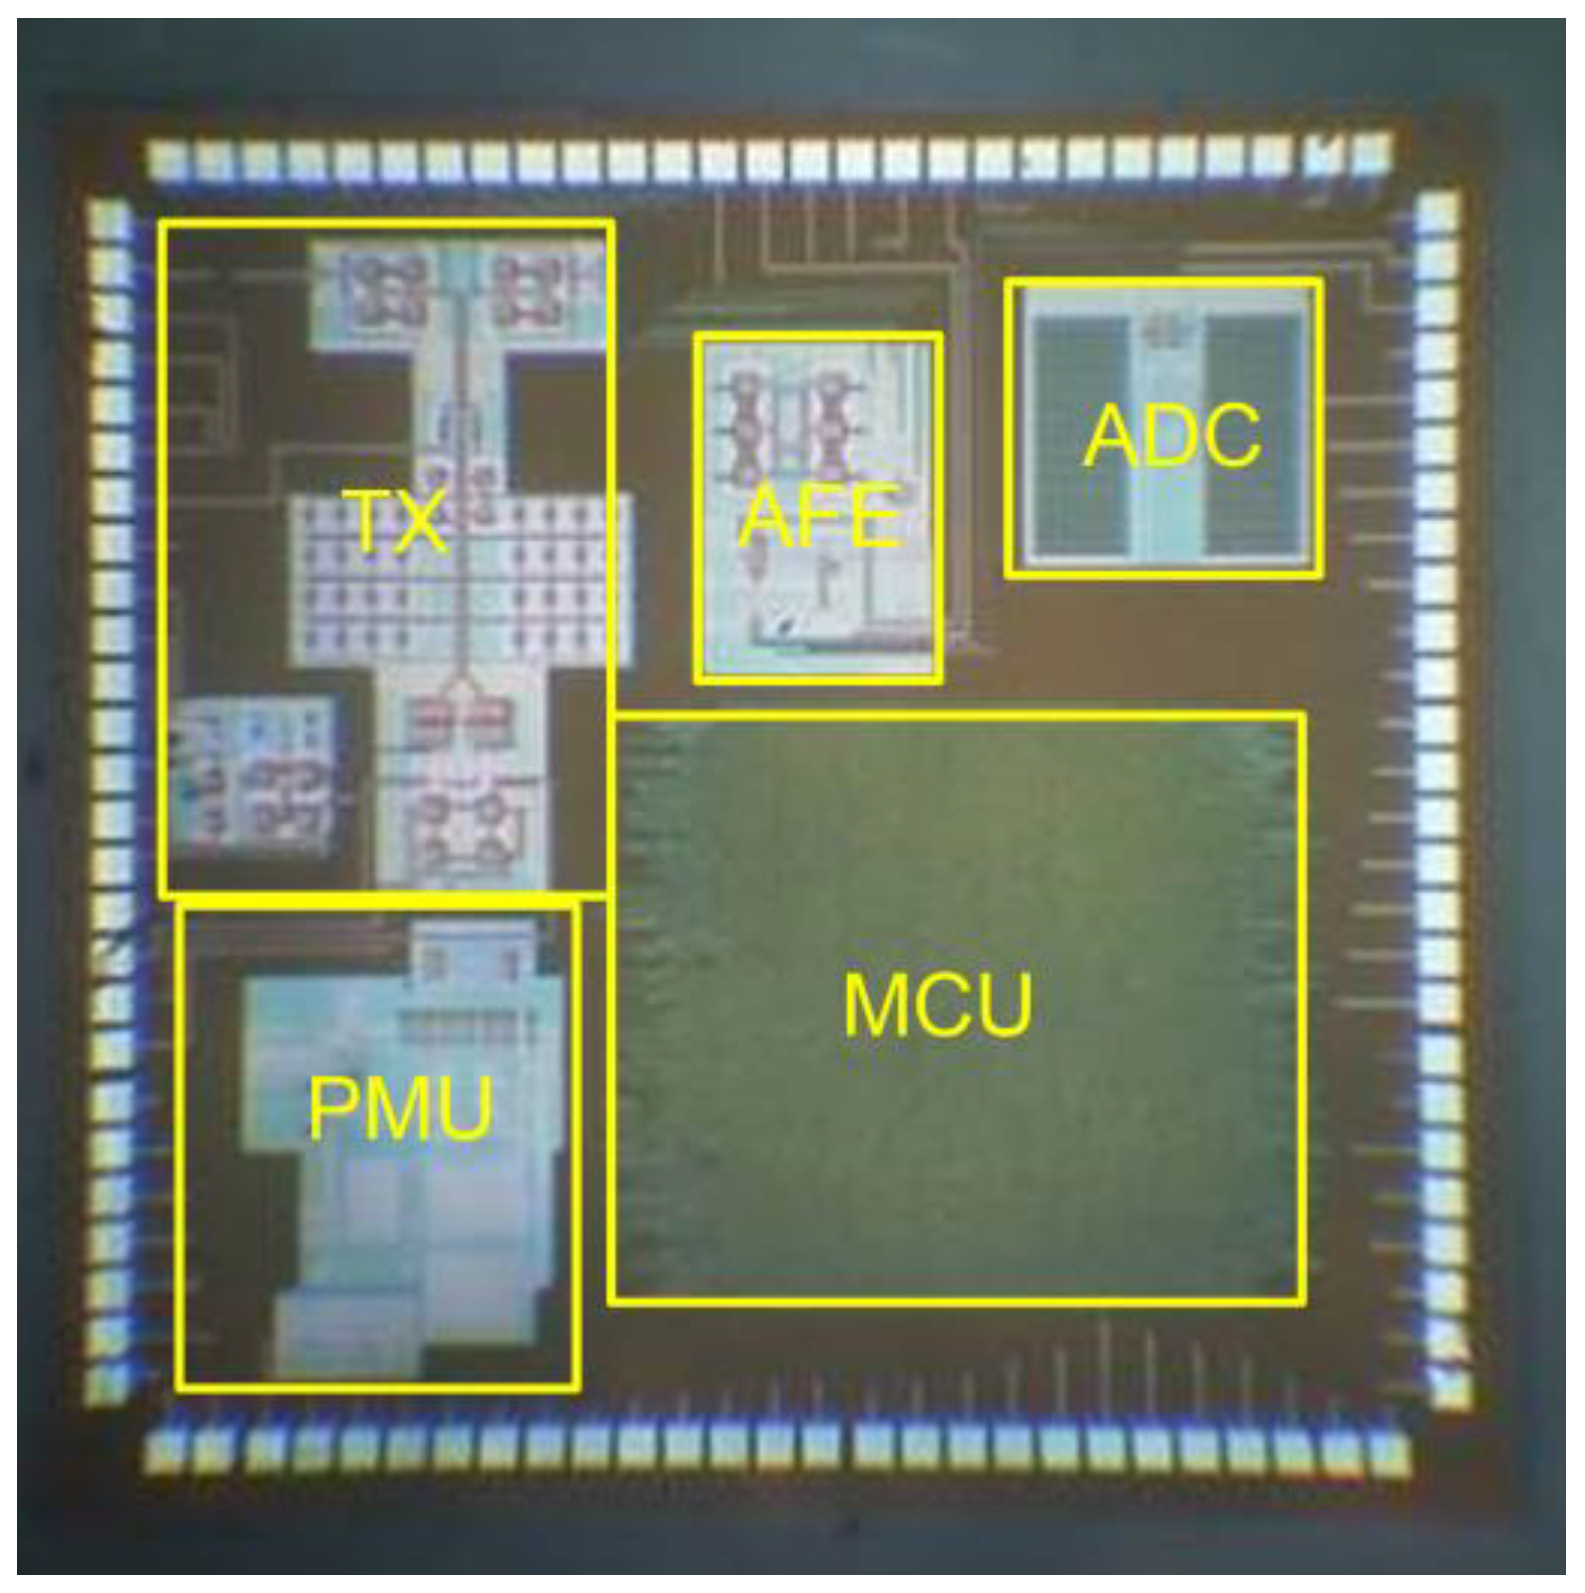
2.2. SoC Architecture
3. Fabrication
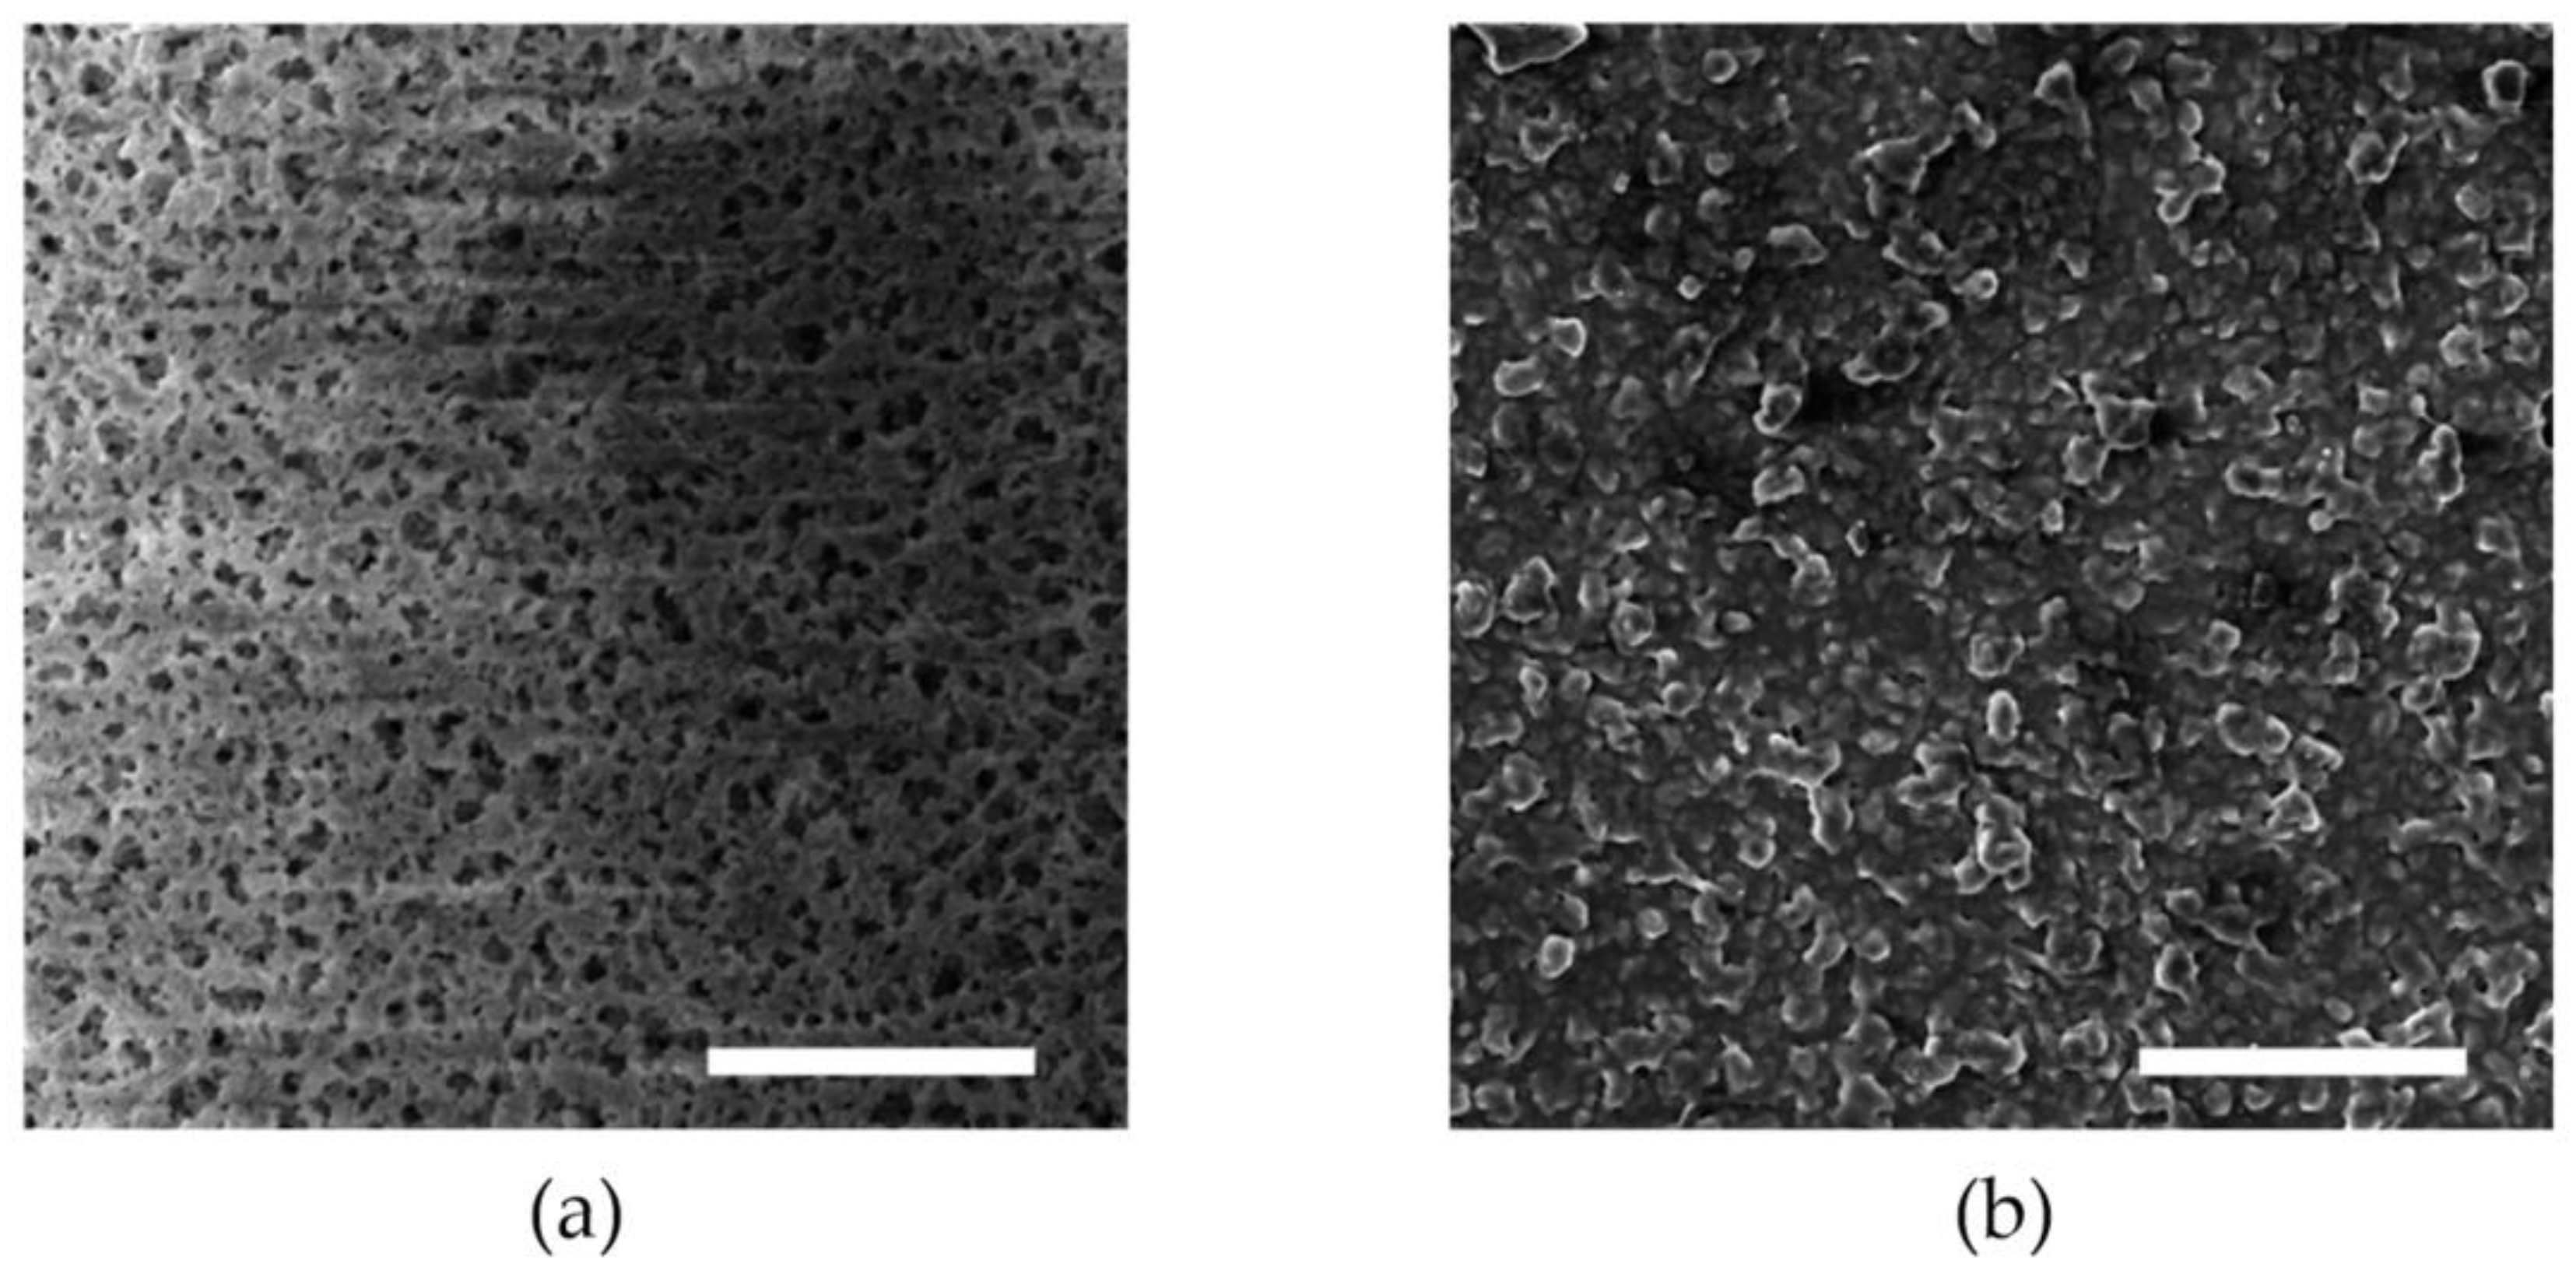
3.1. Fabrication of the Conductive Polymer
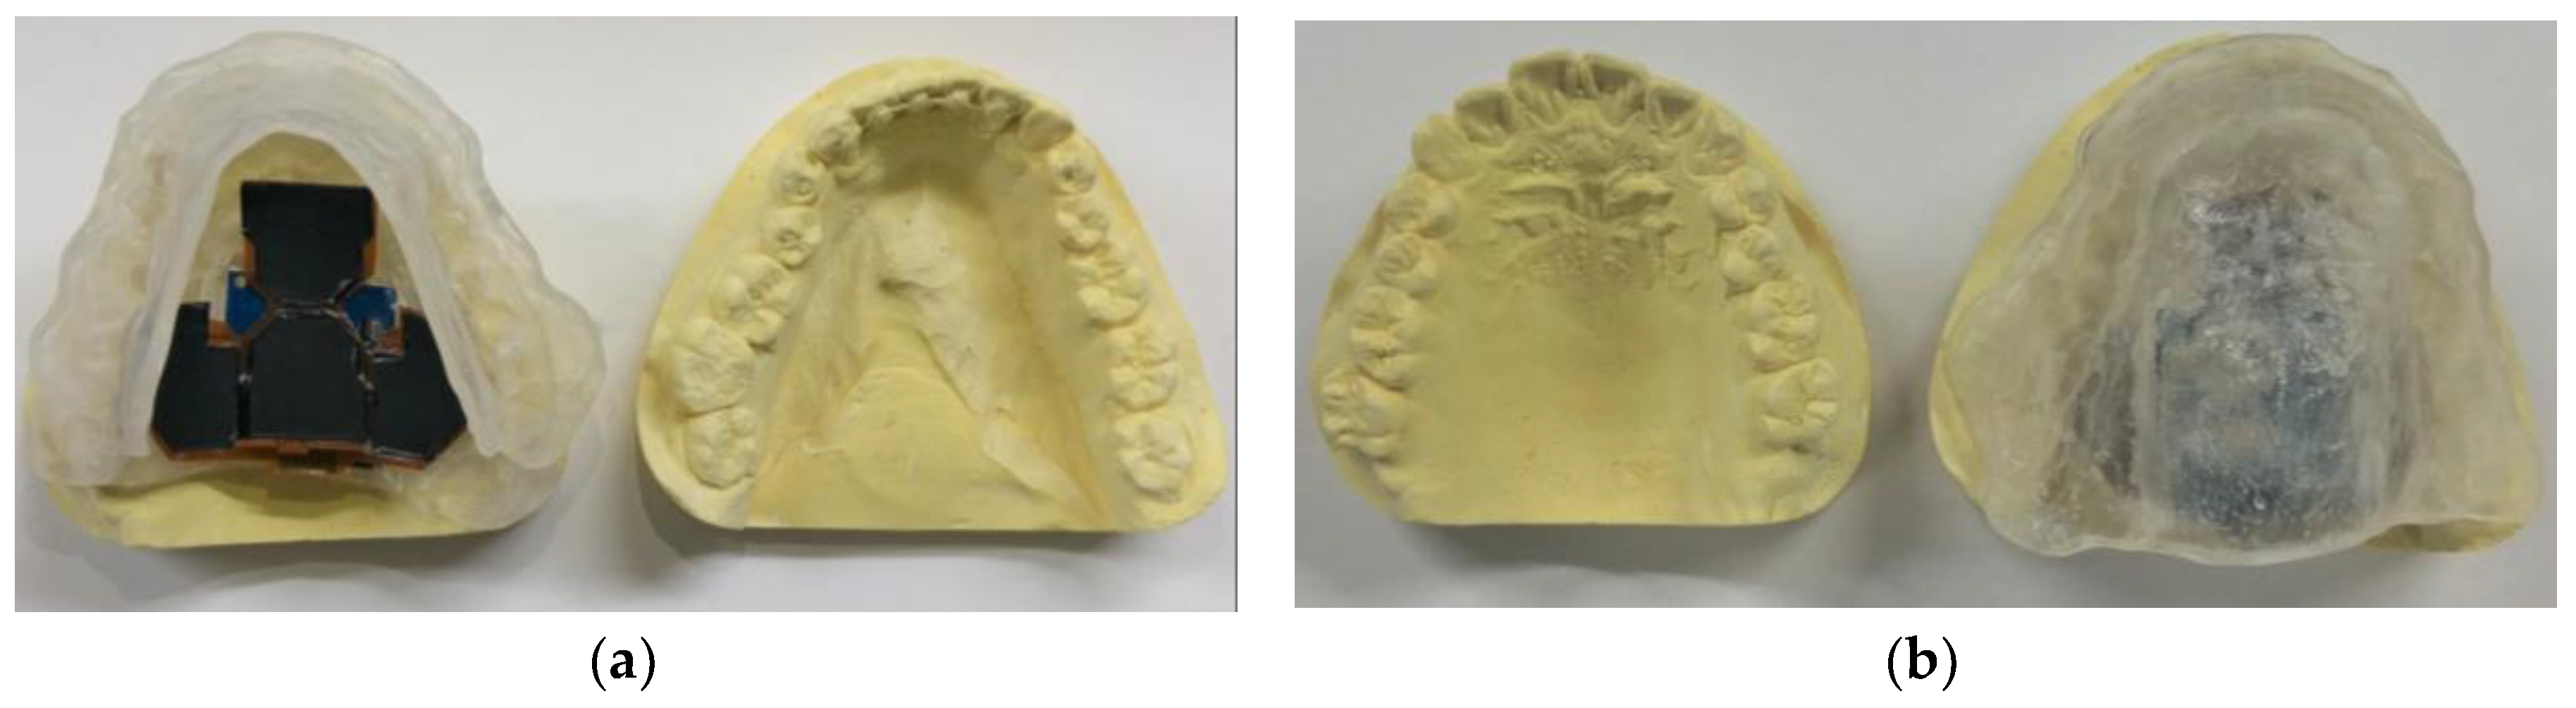
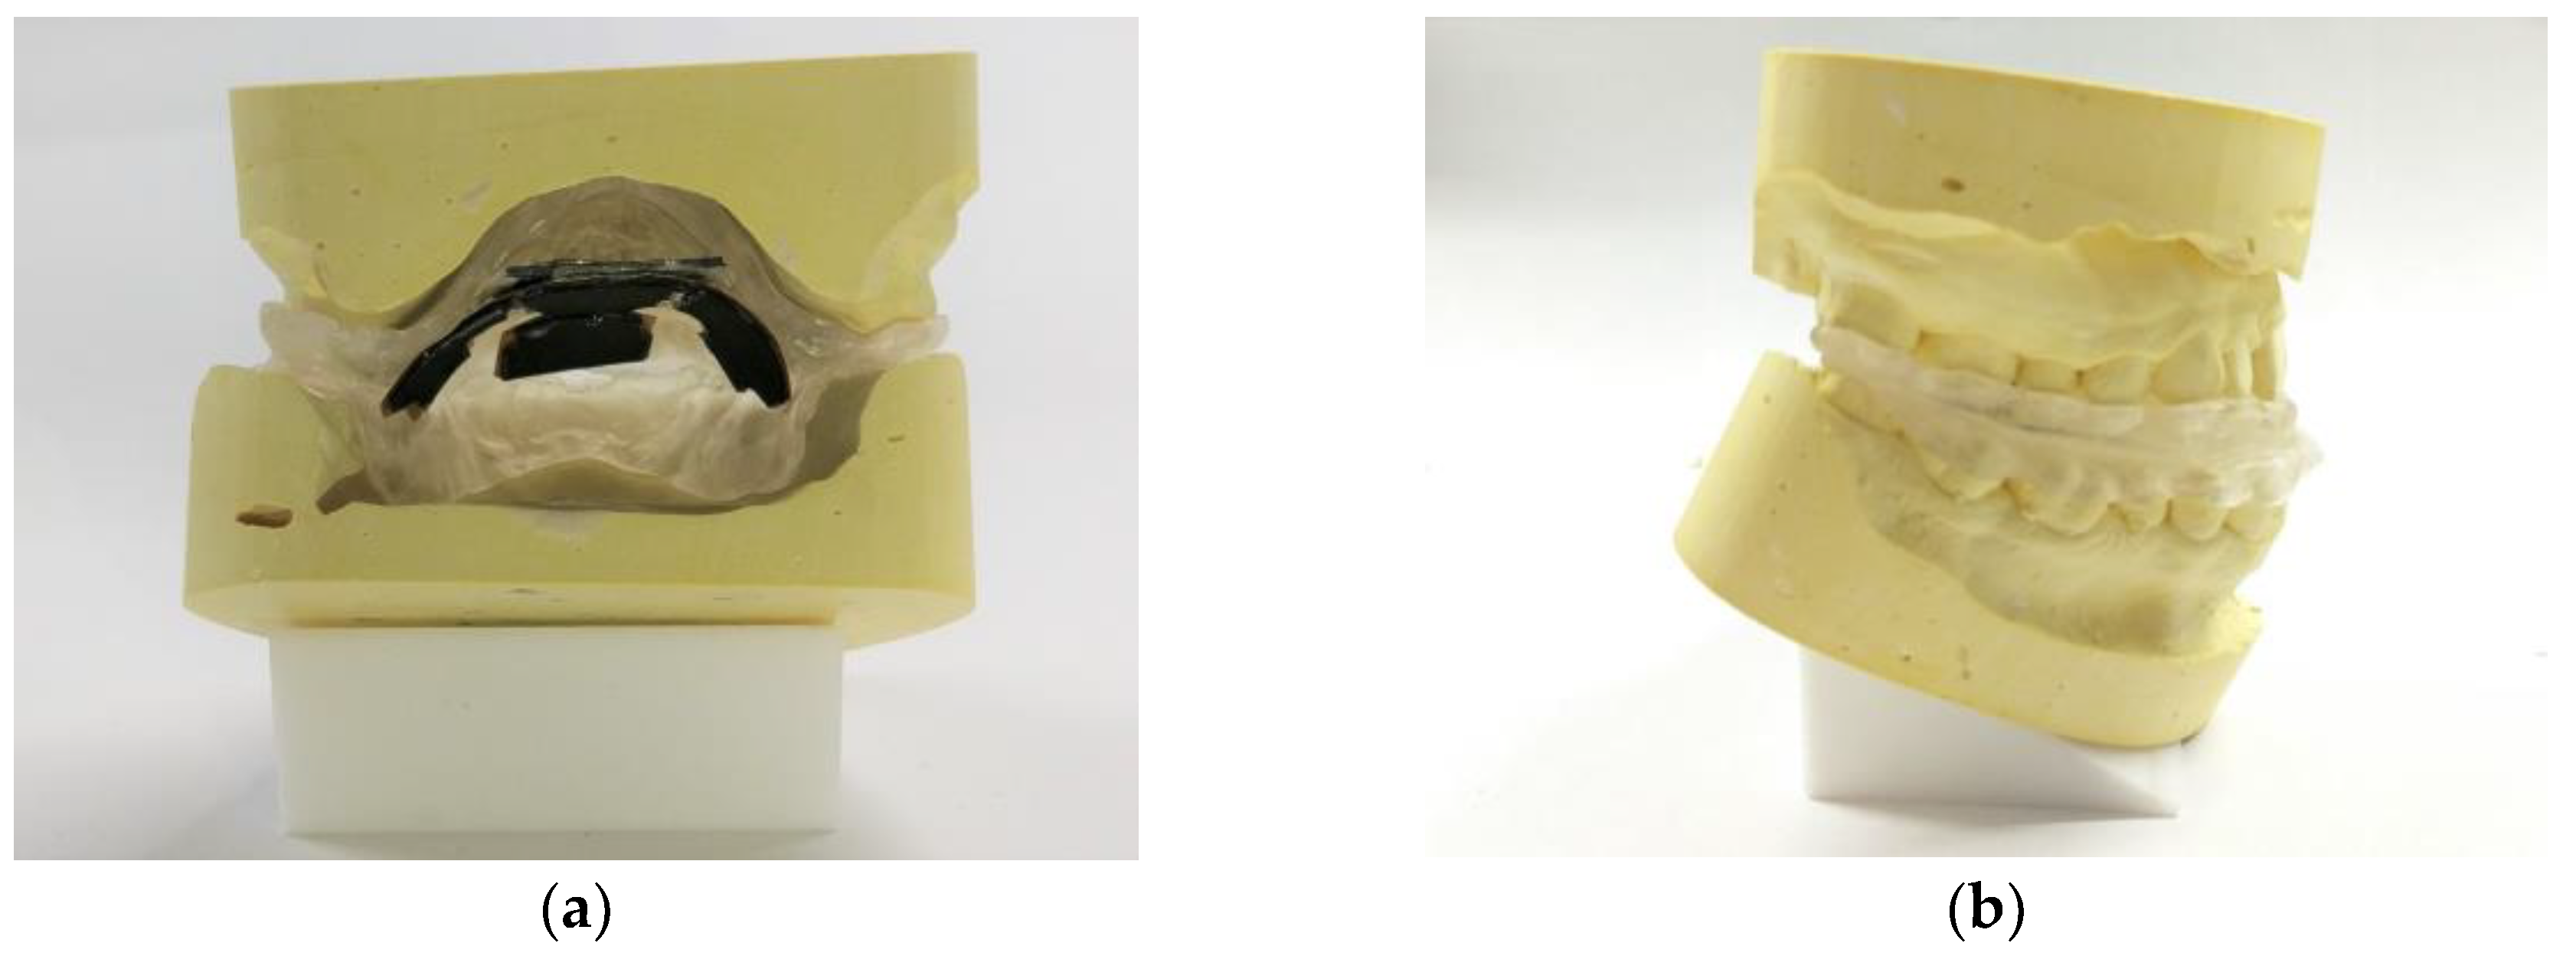
3.2. Assembling and Packaging
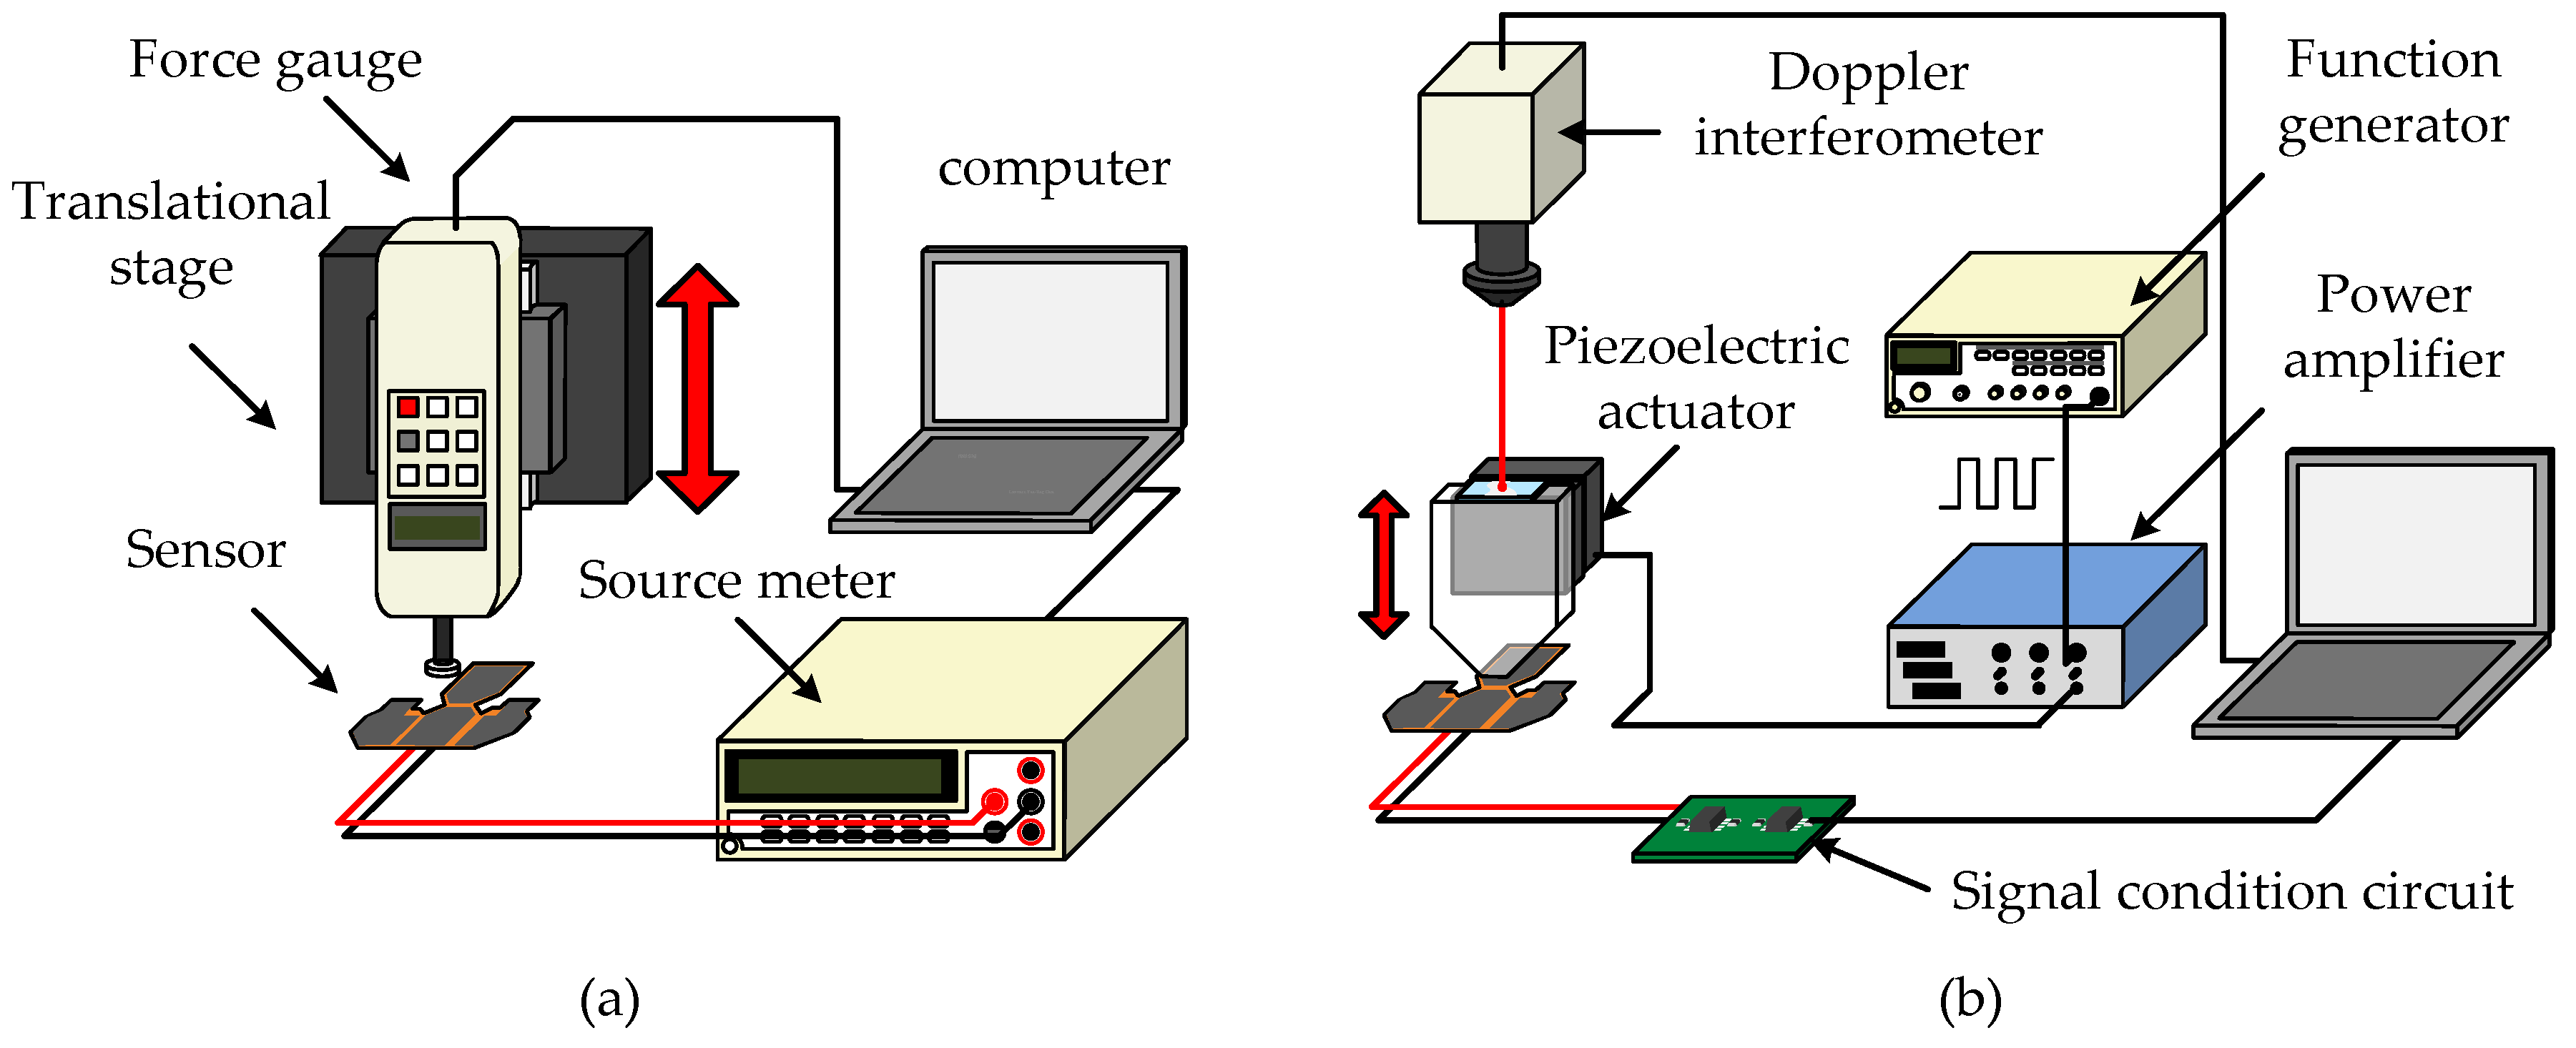
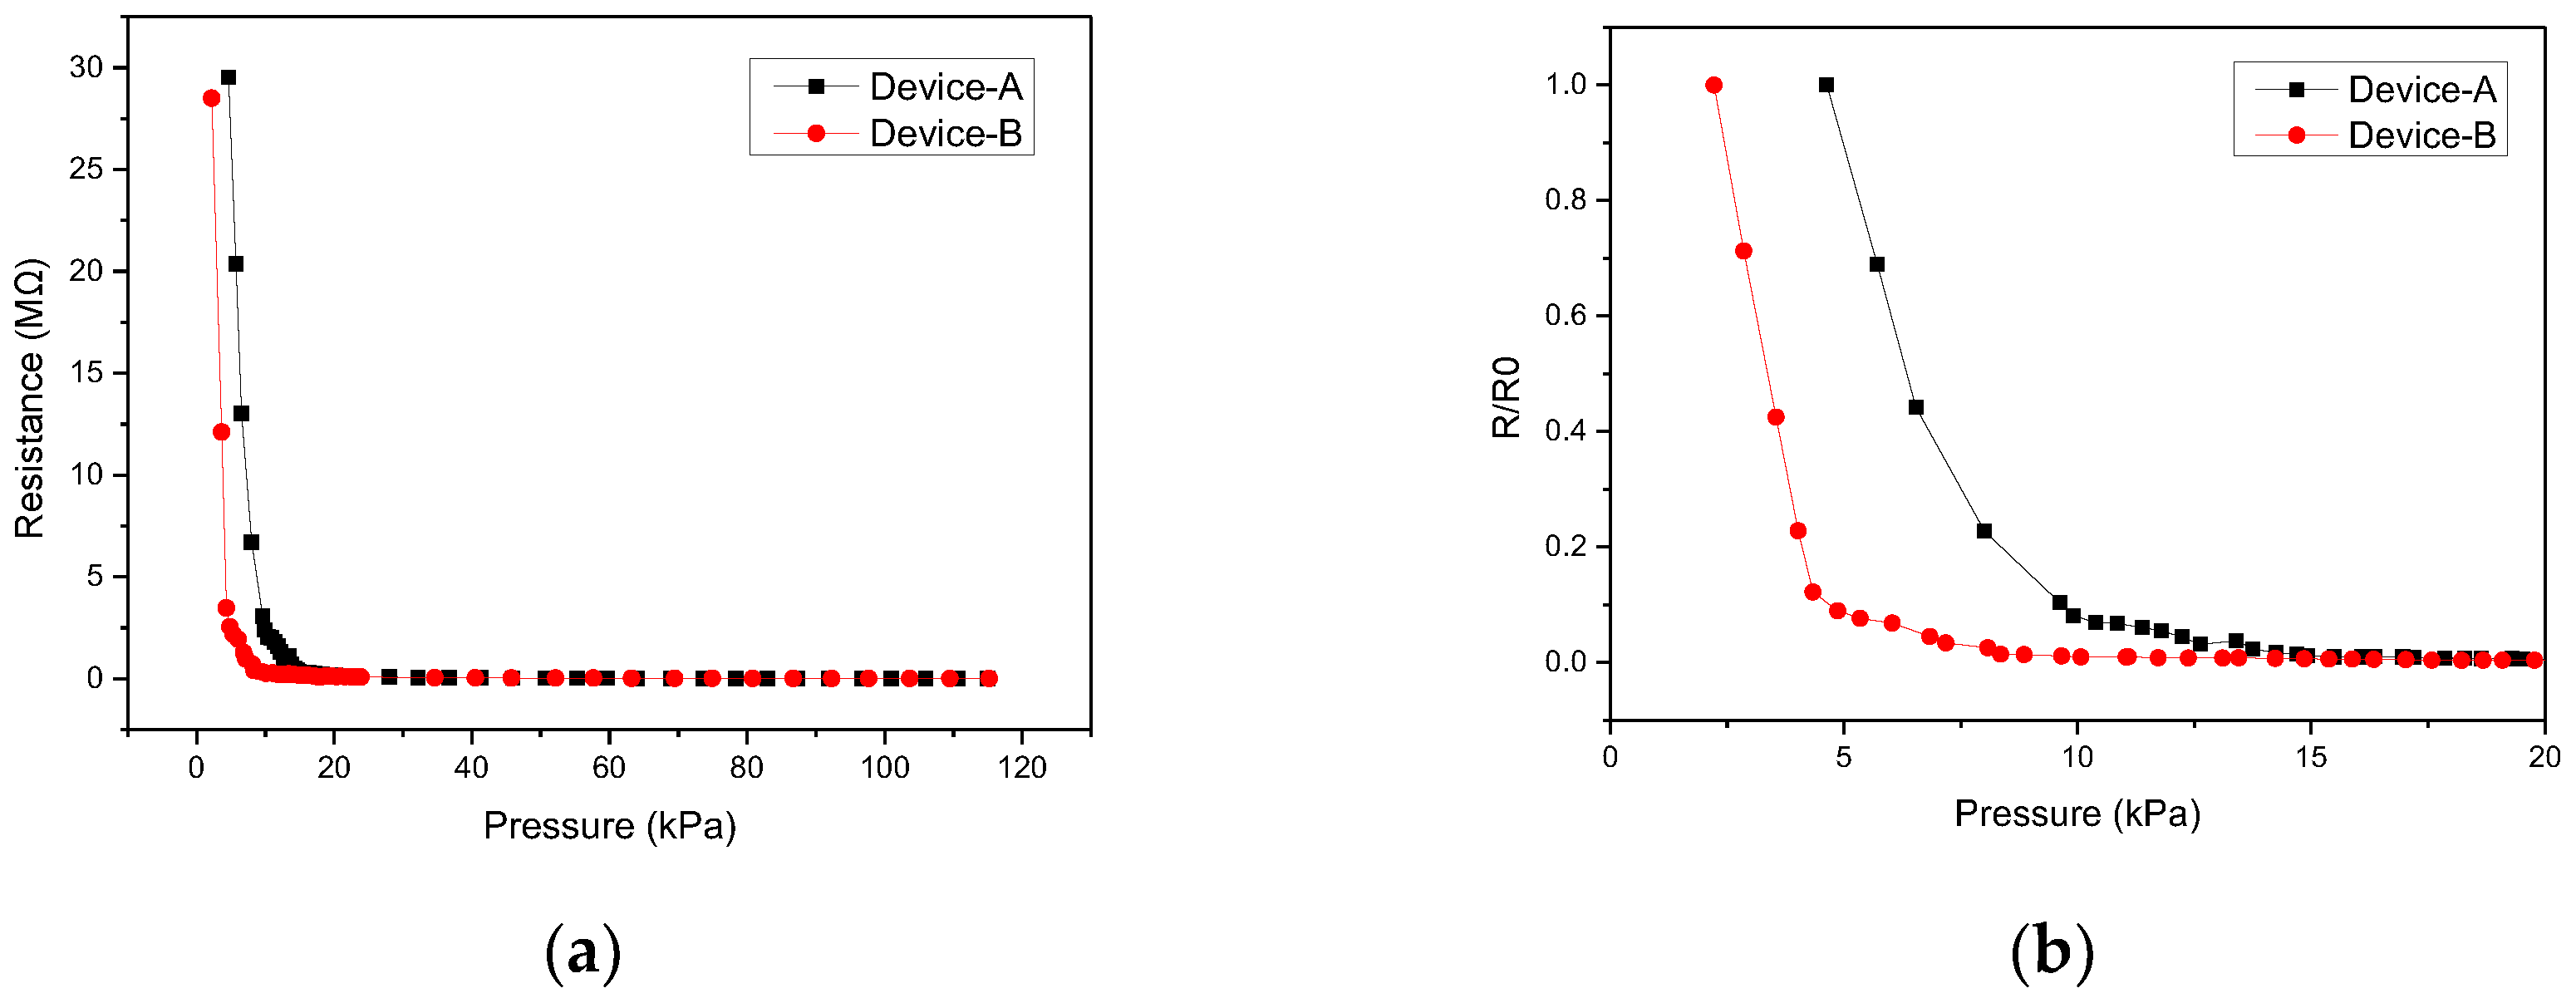
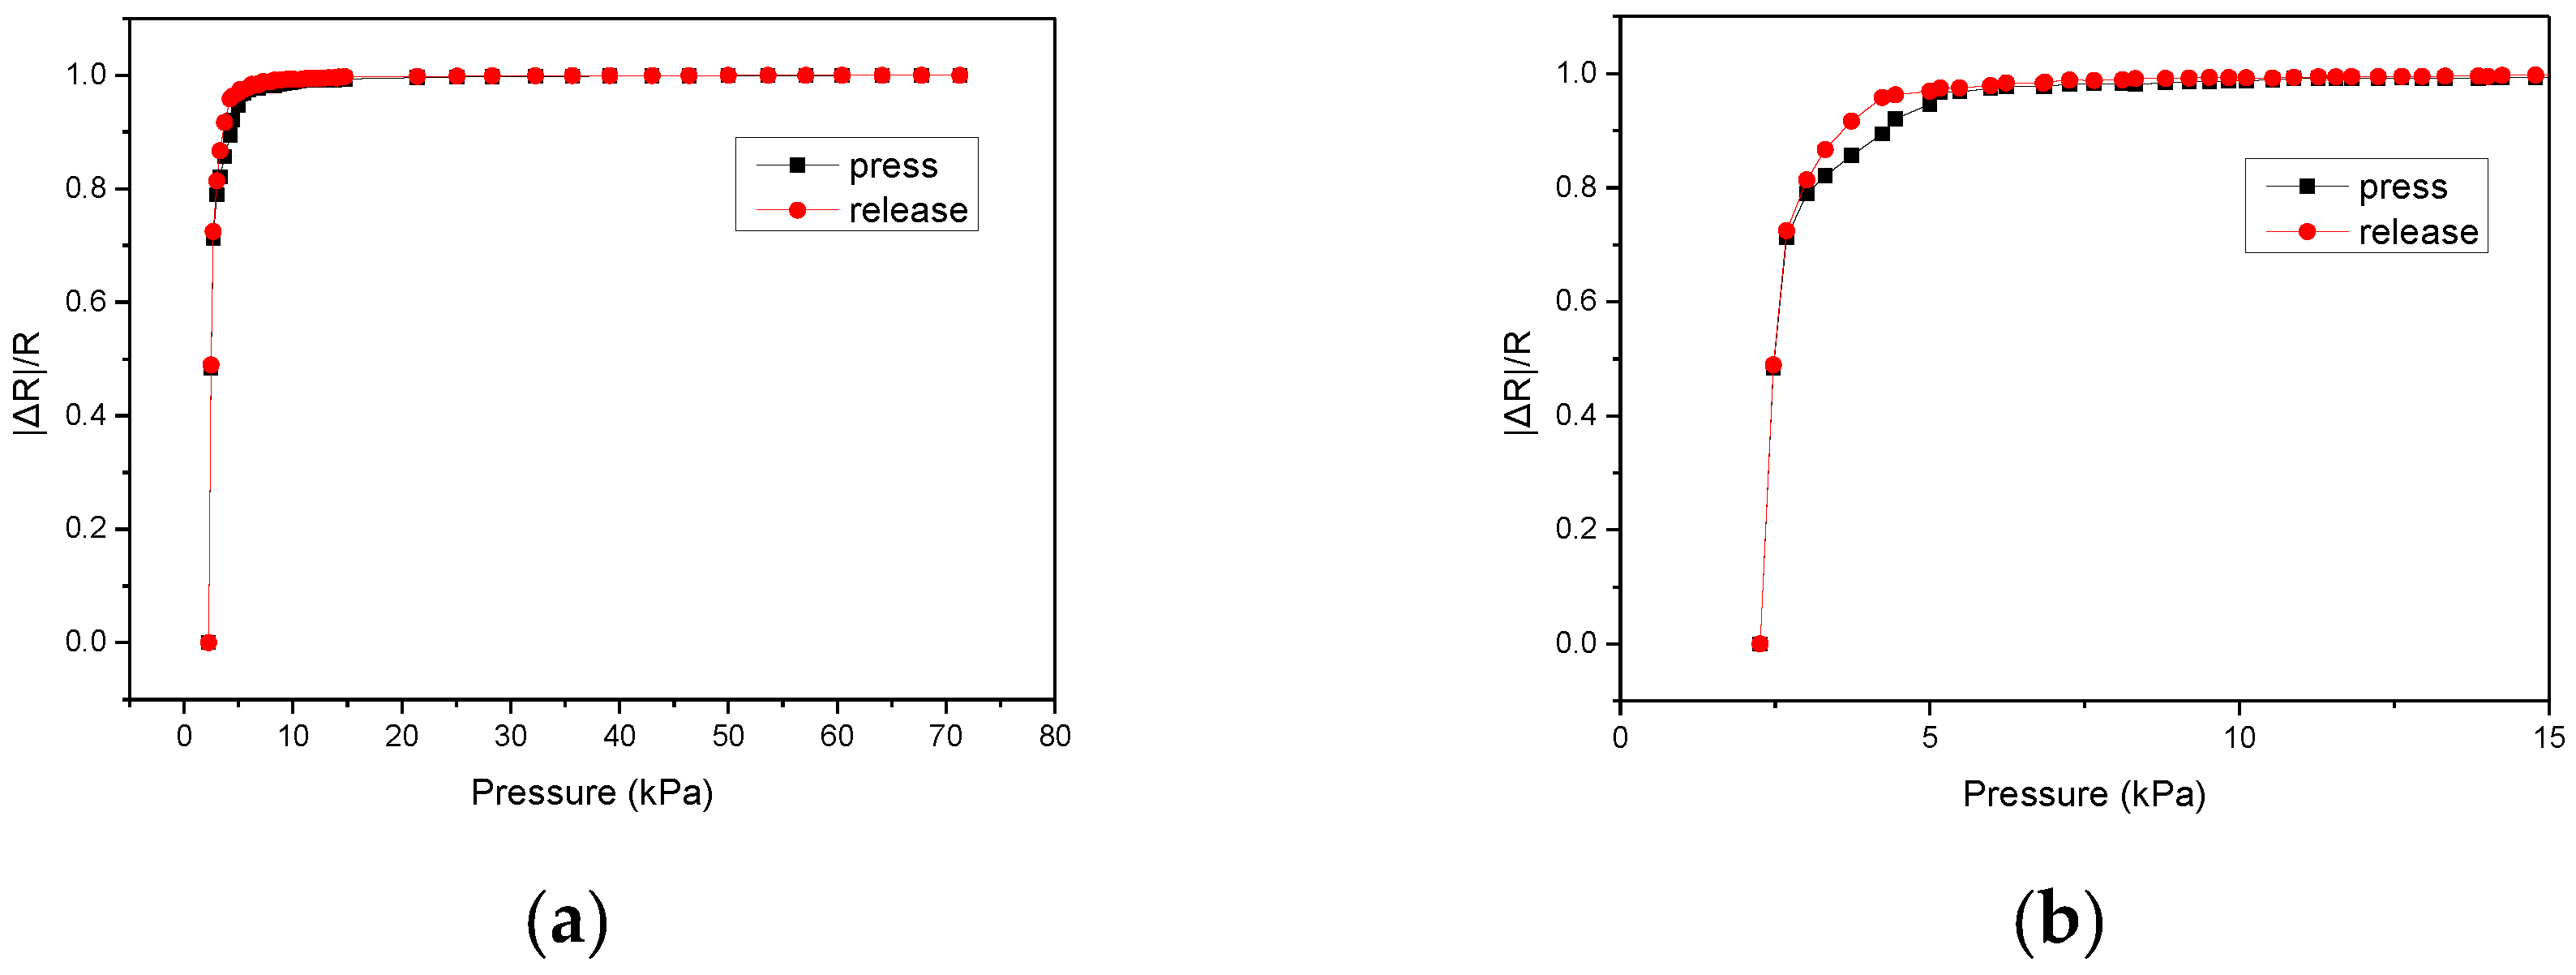
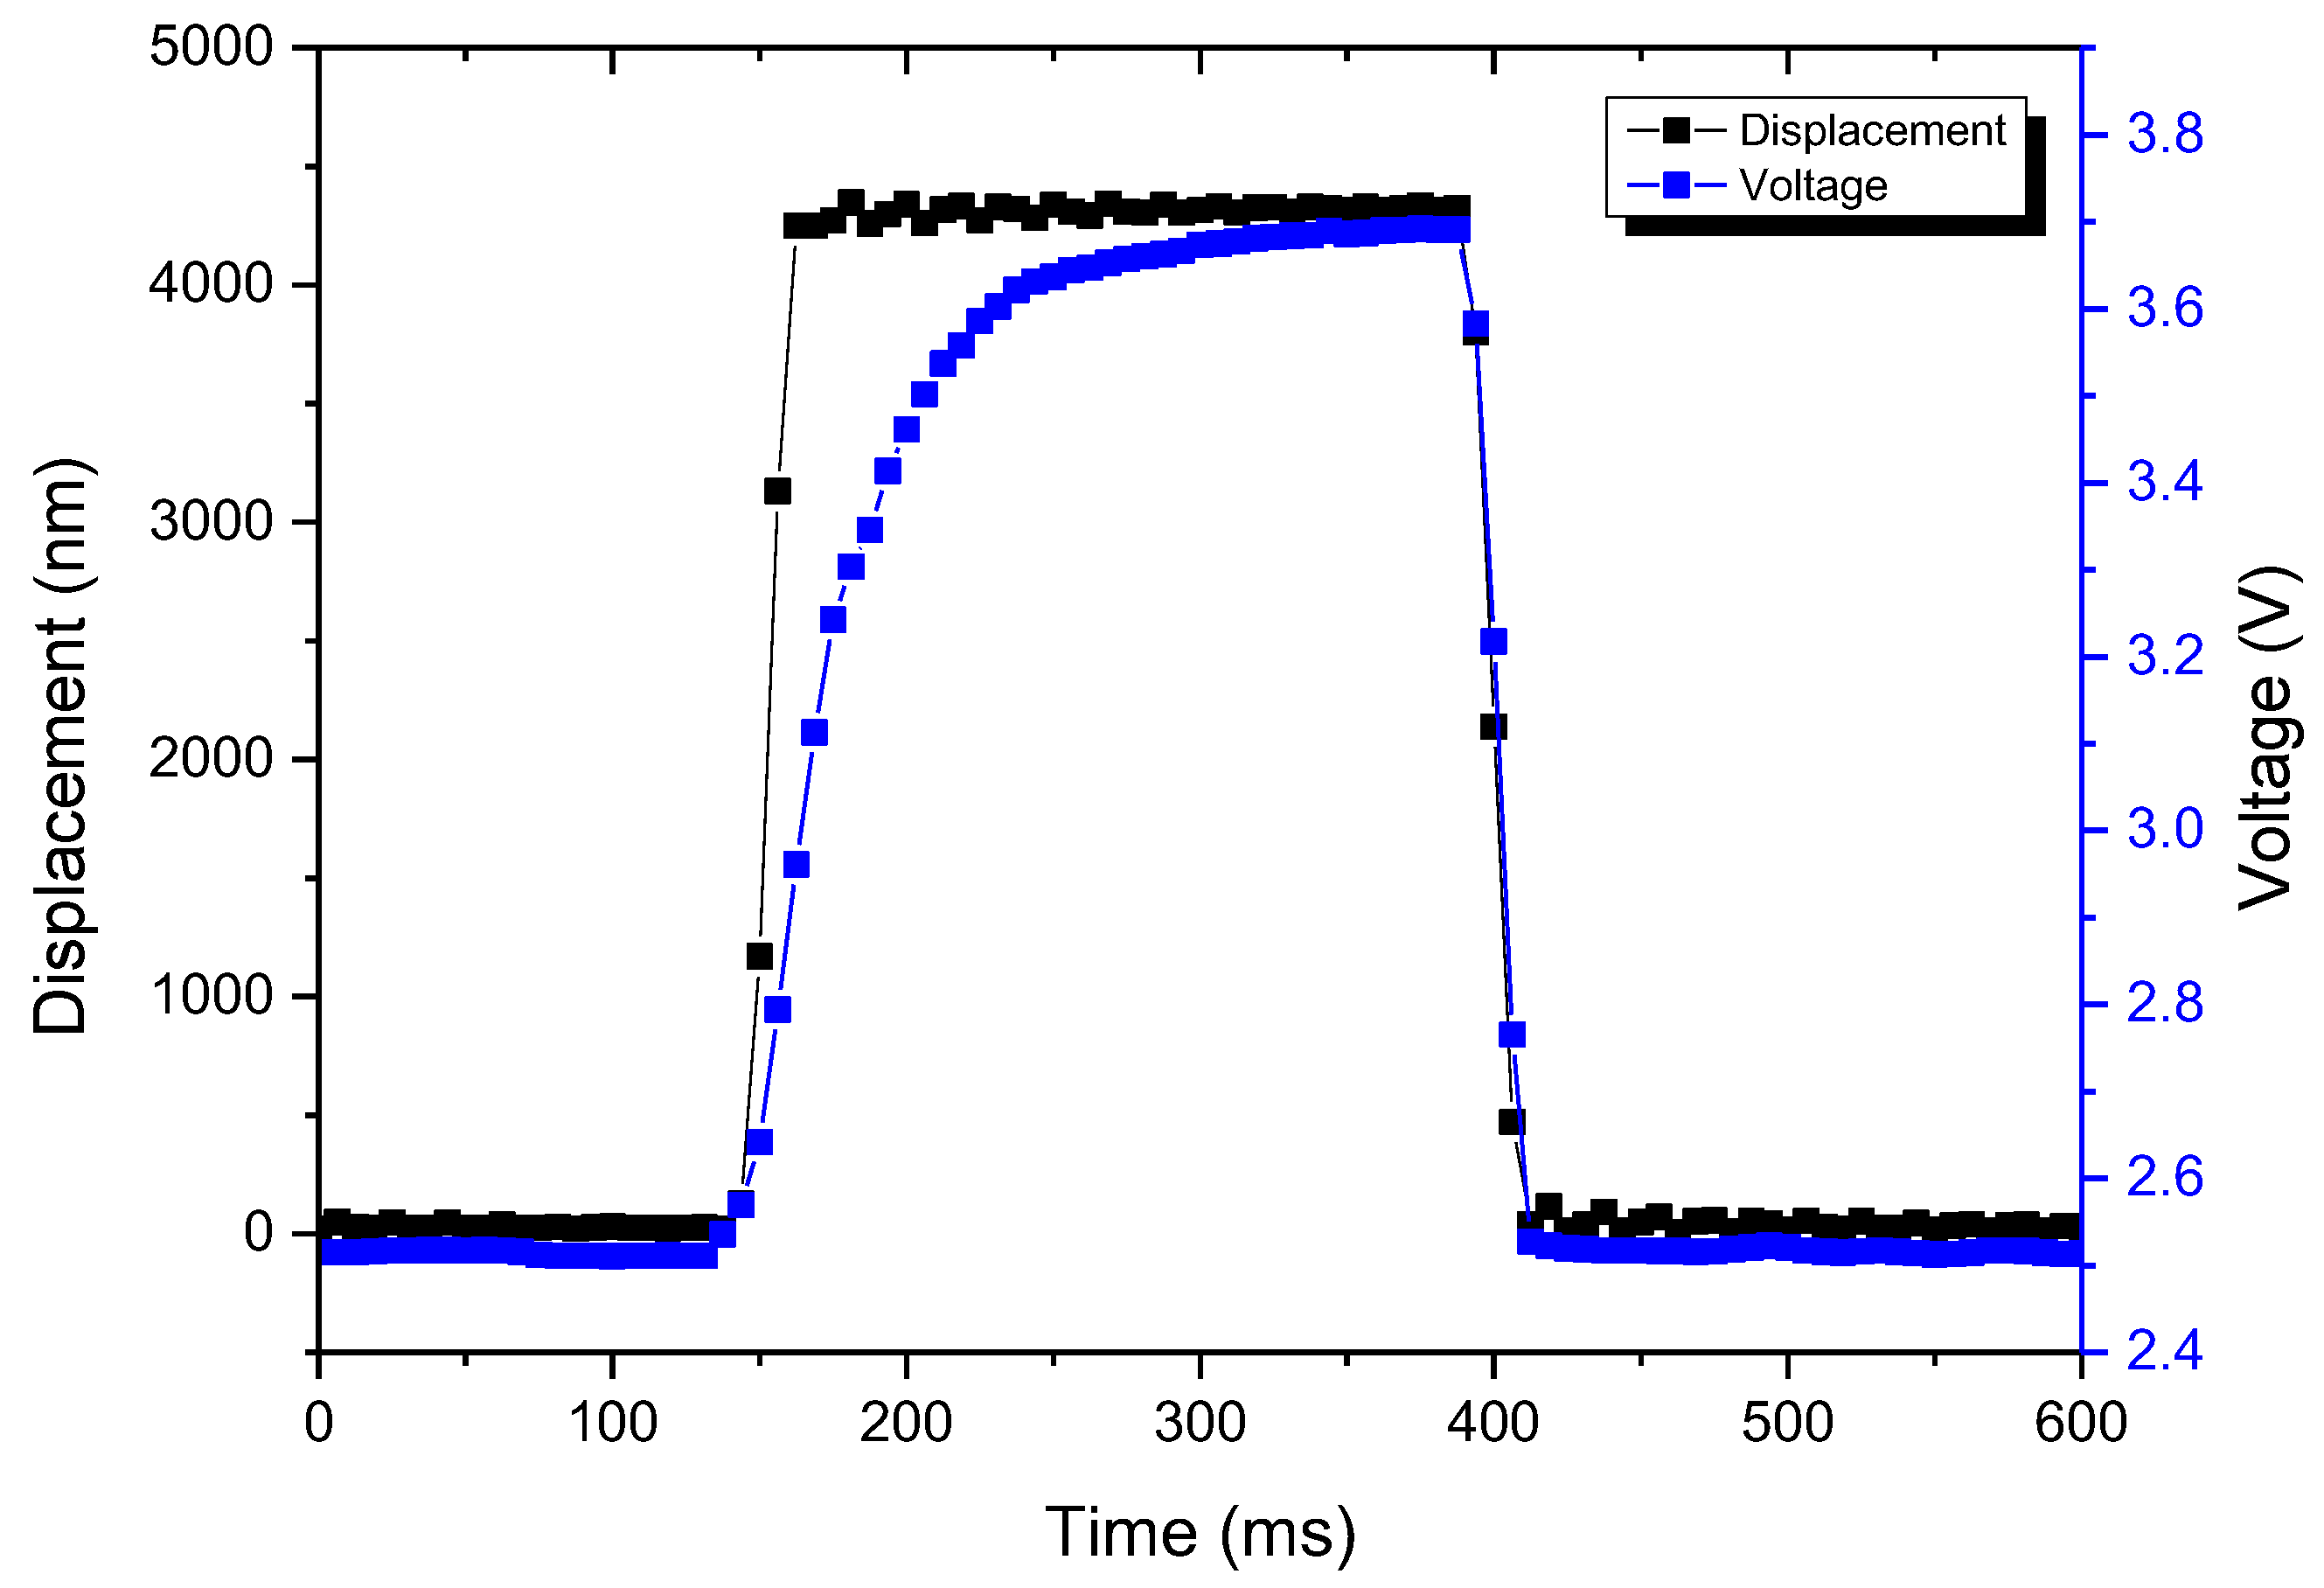
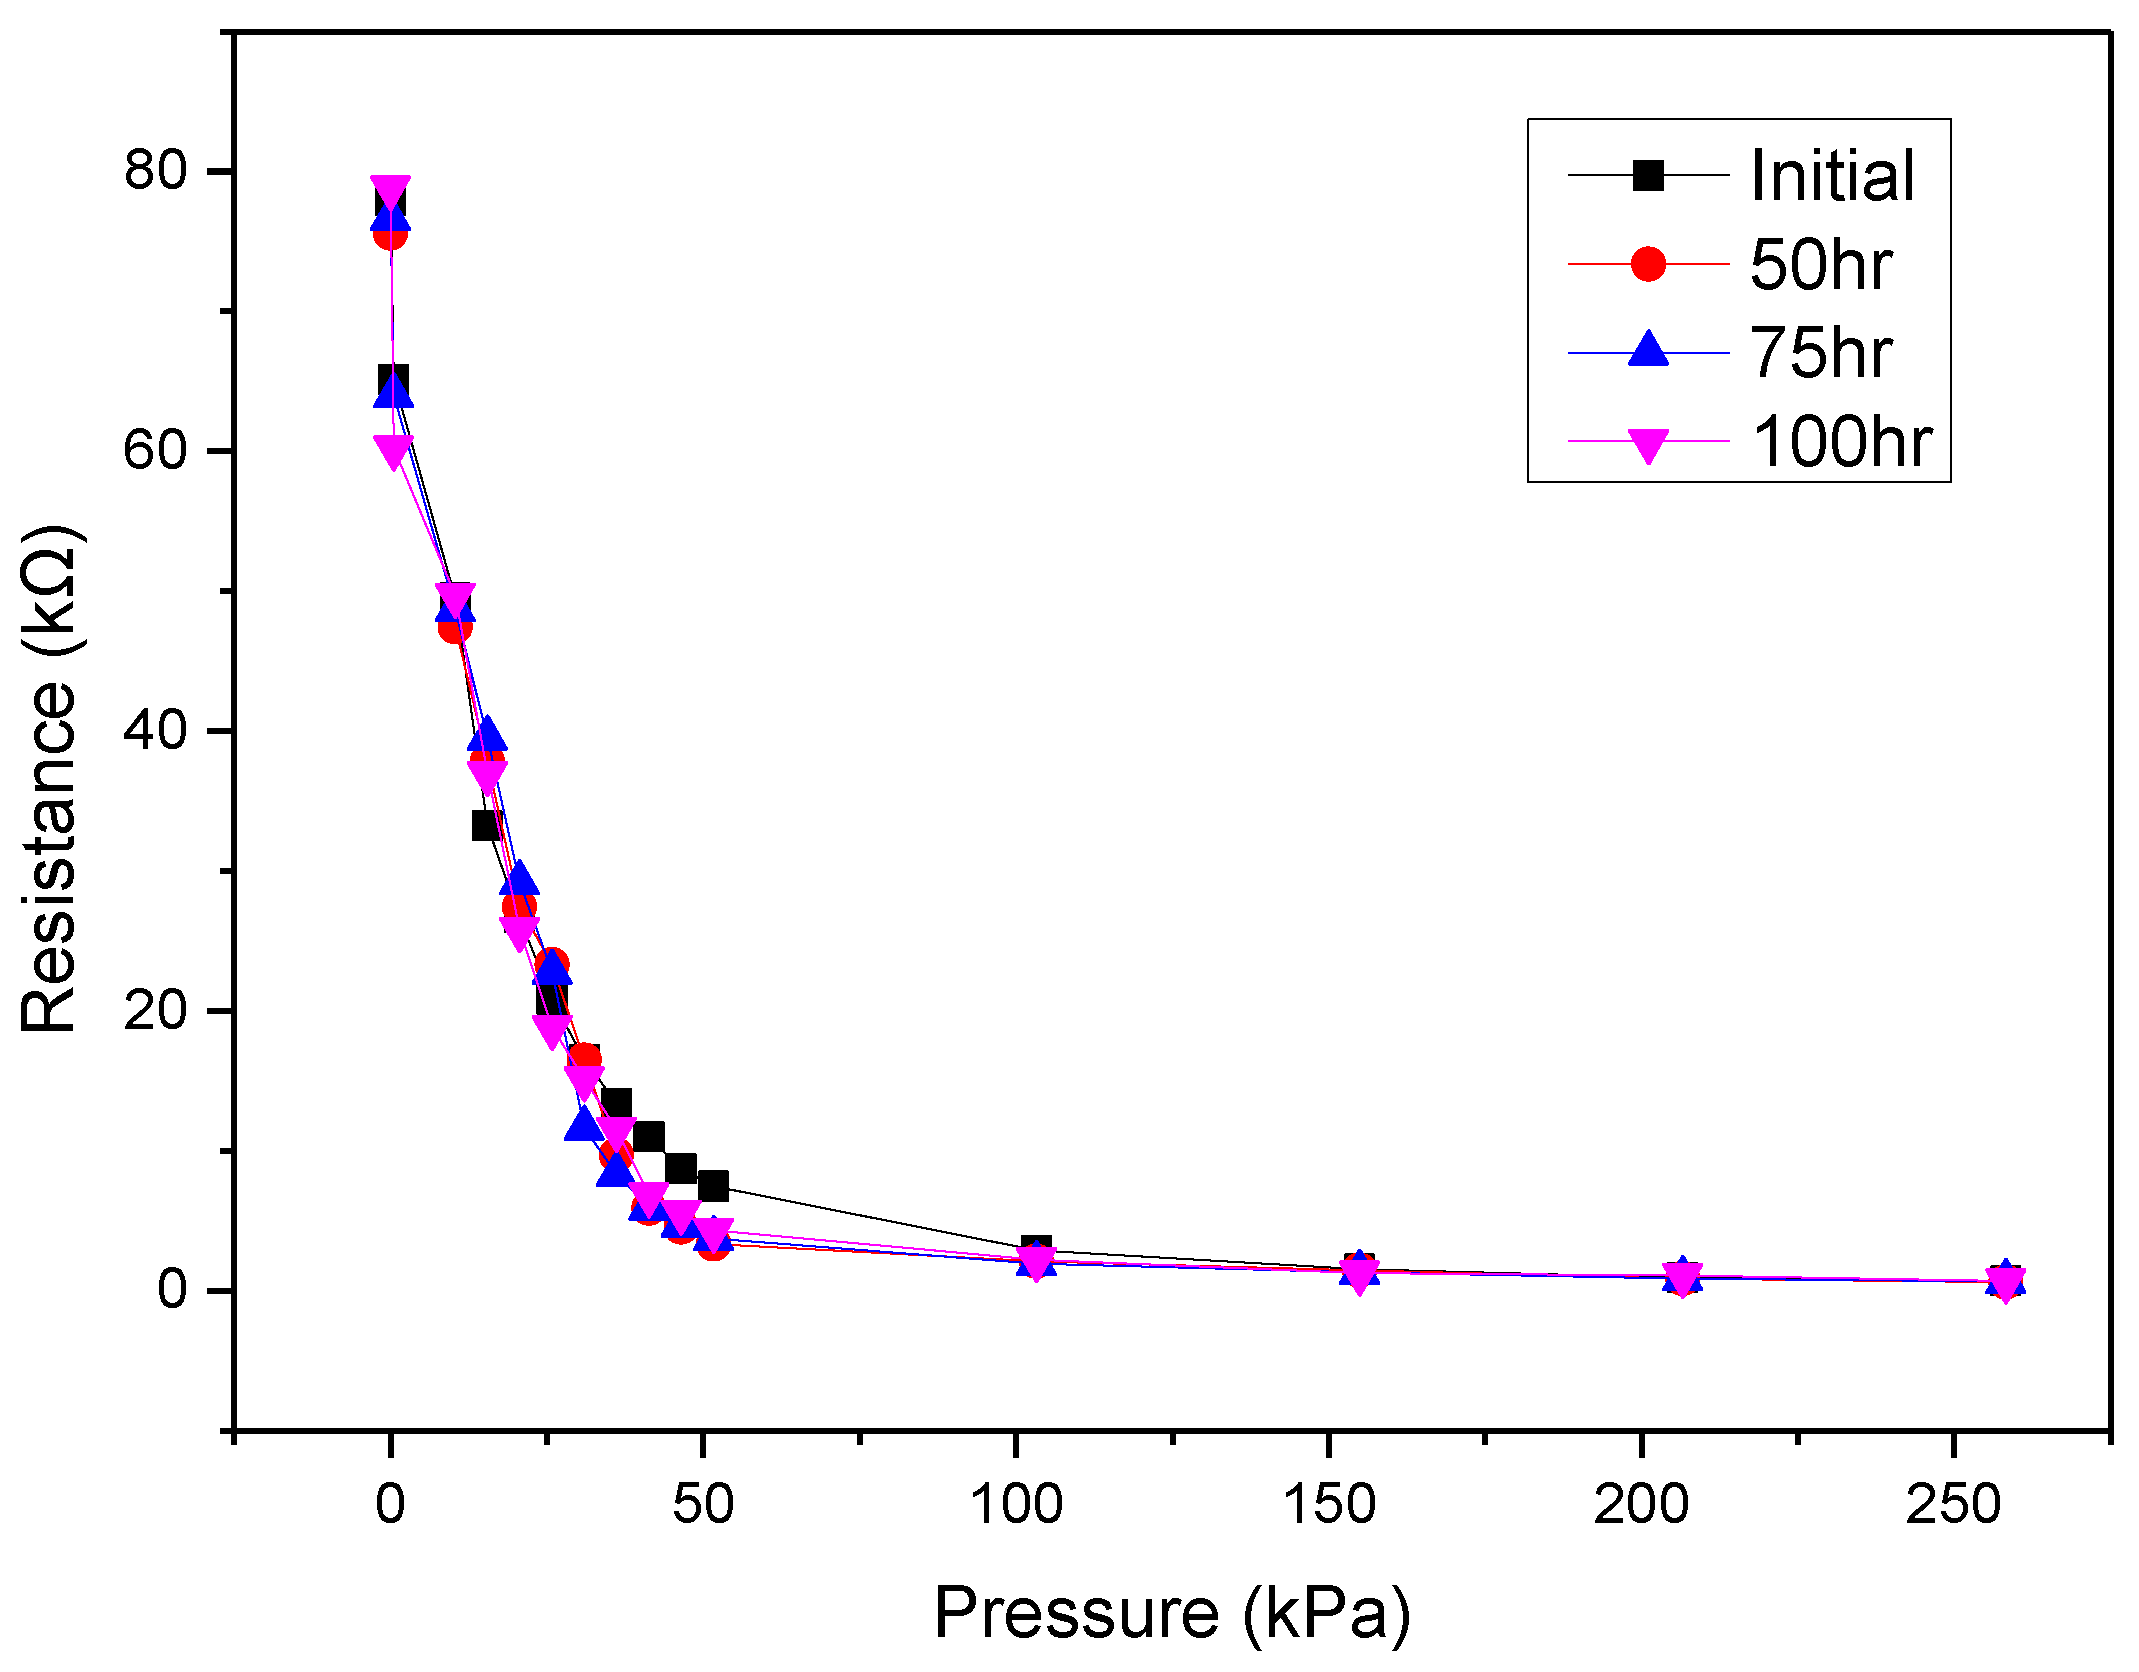
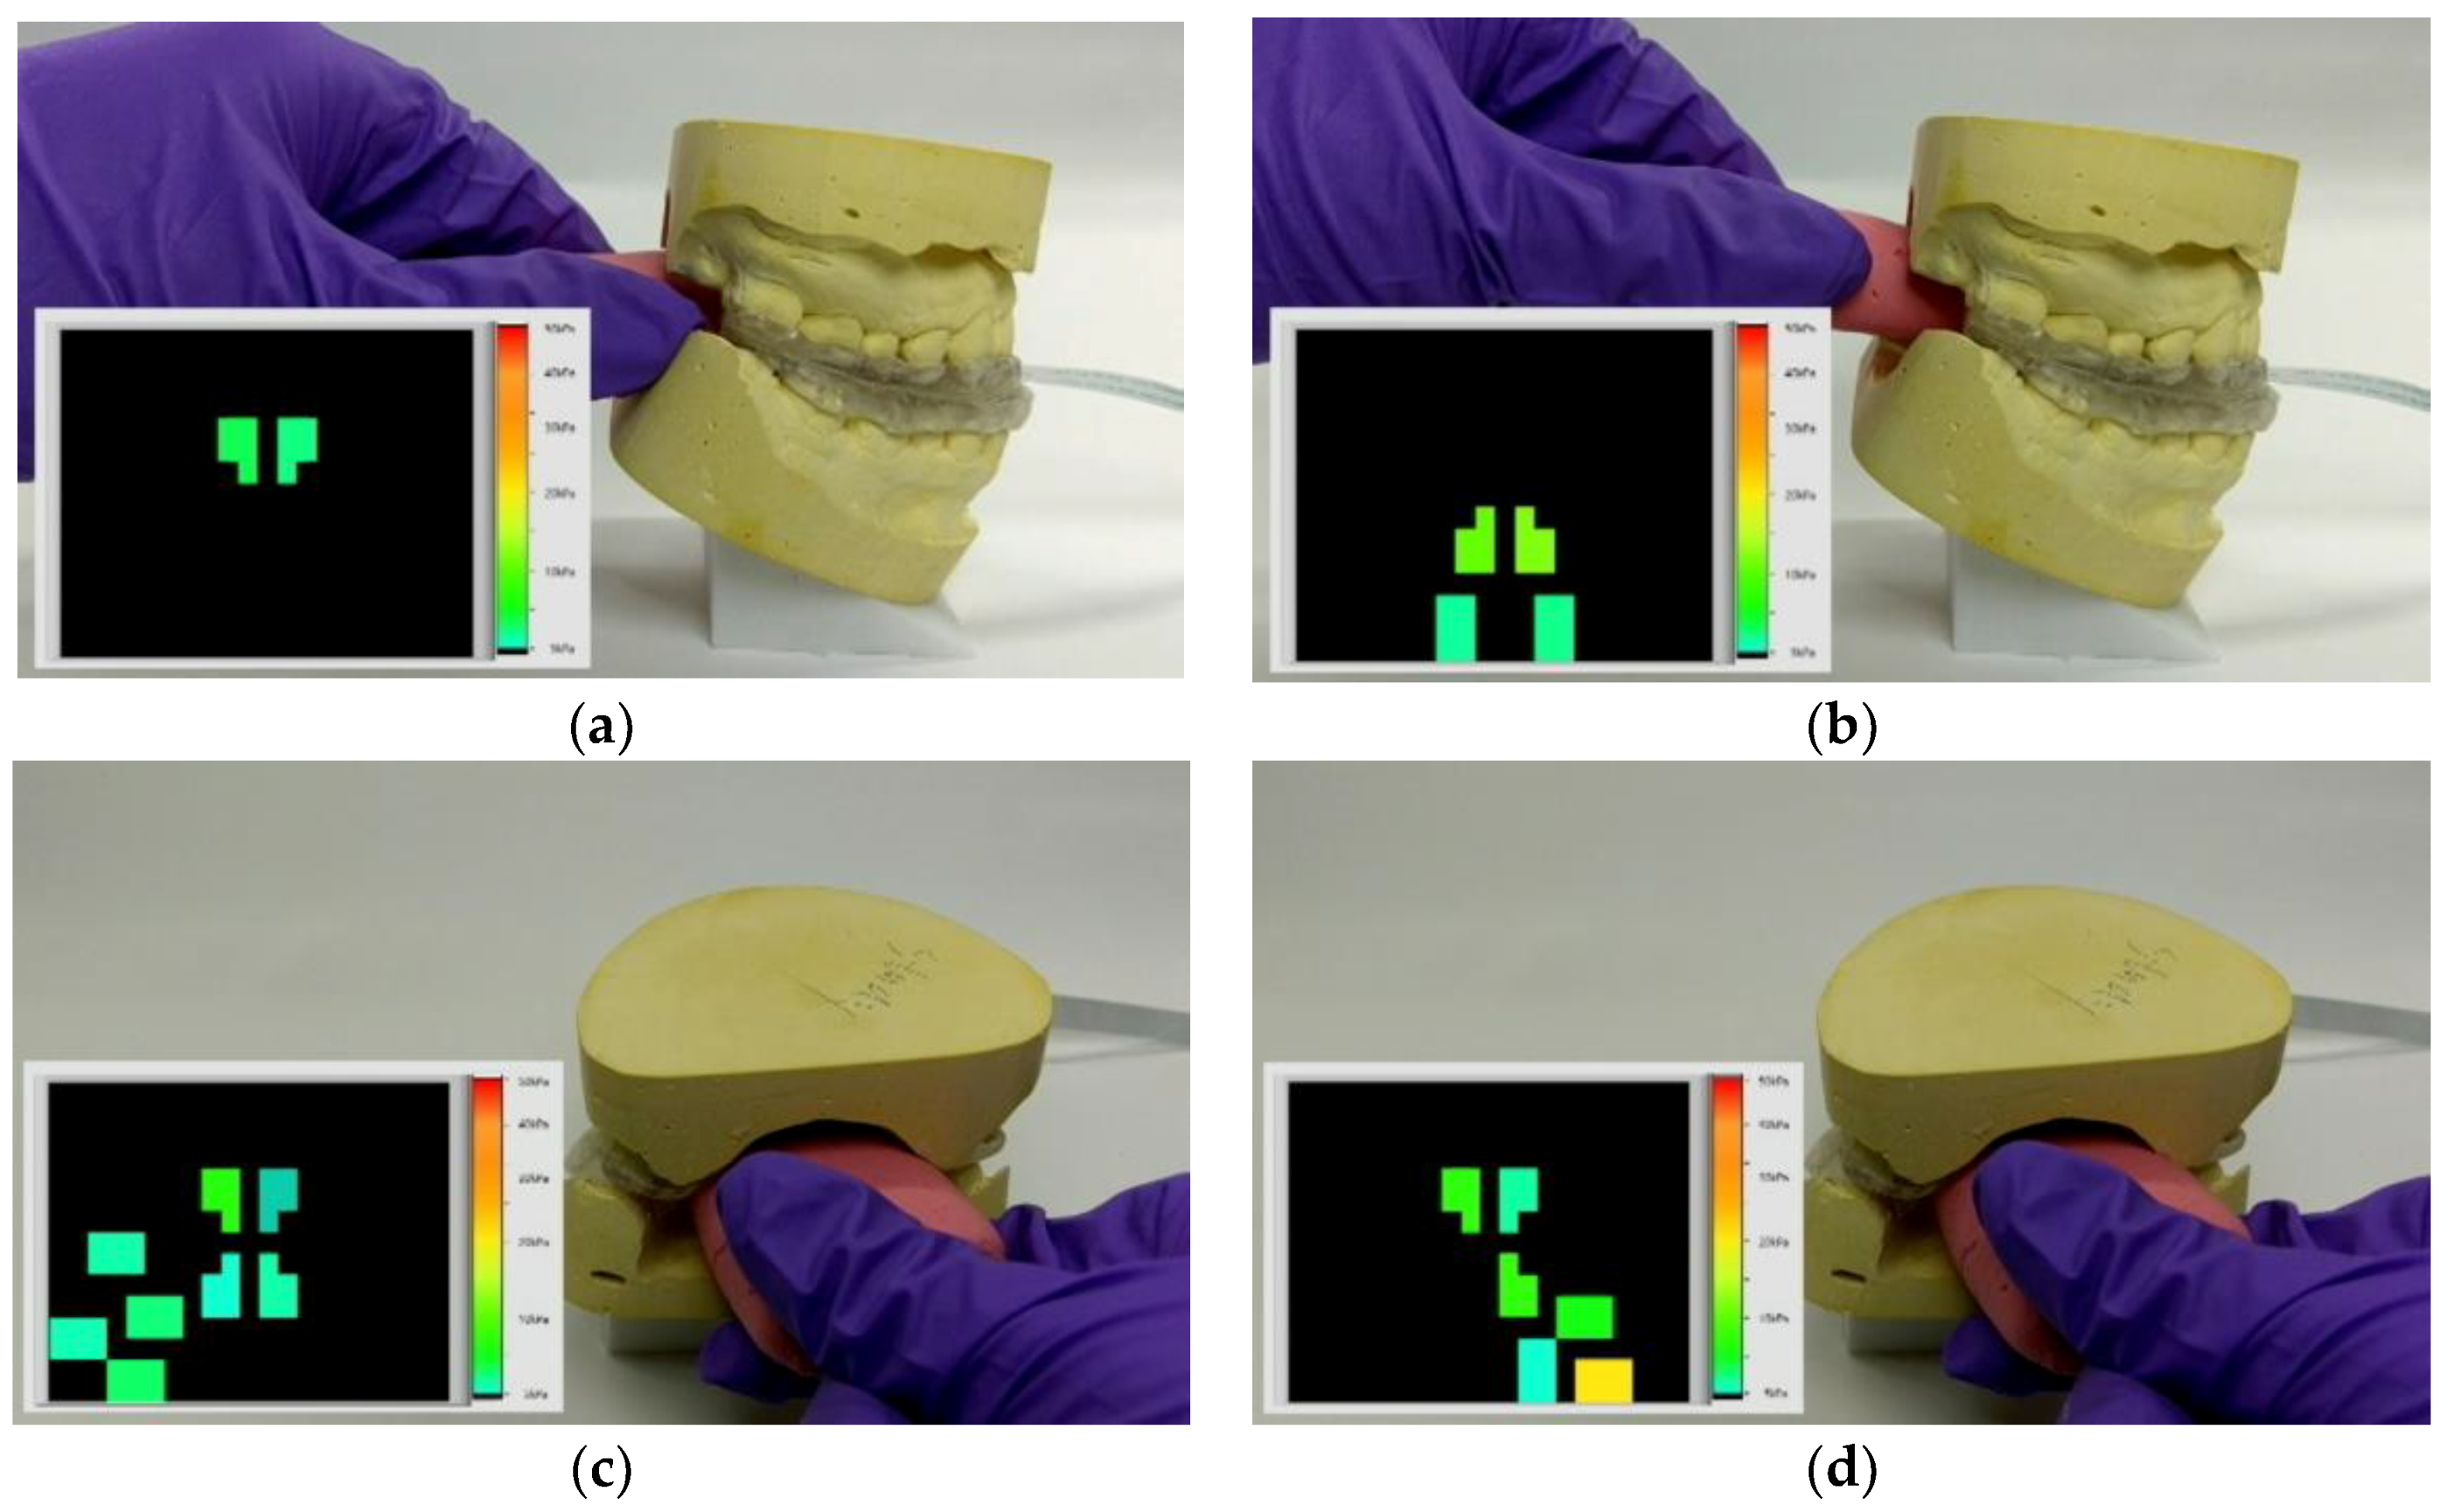
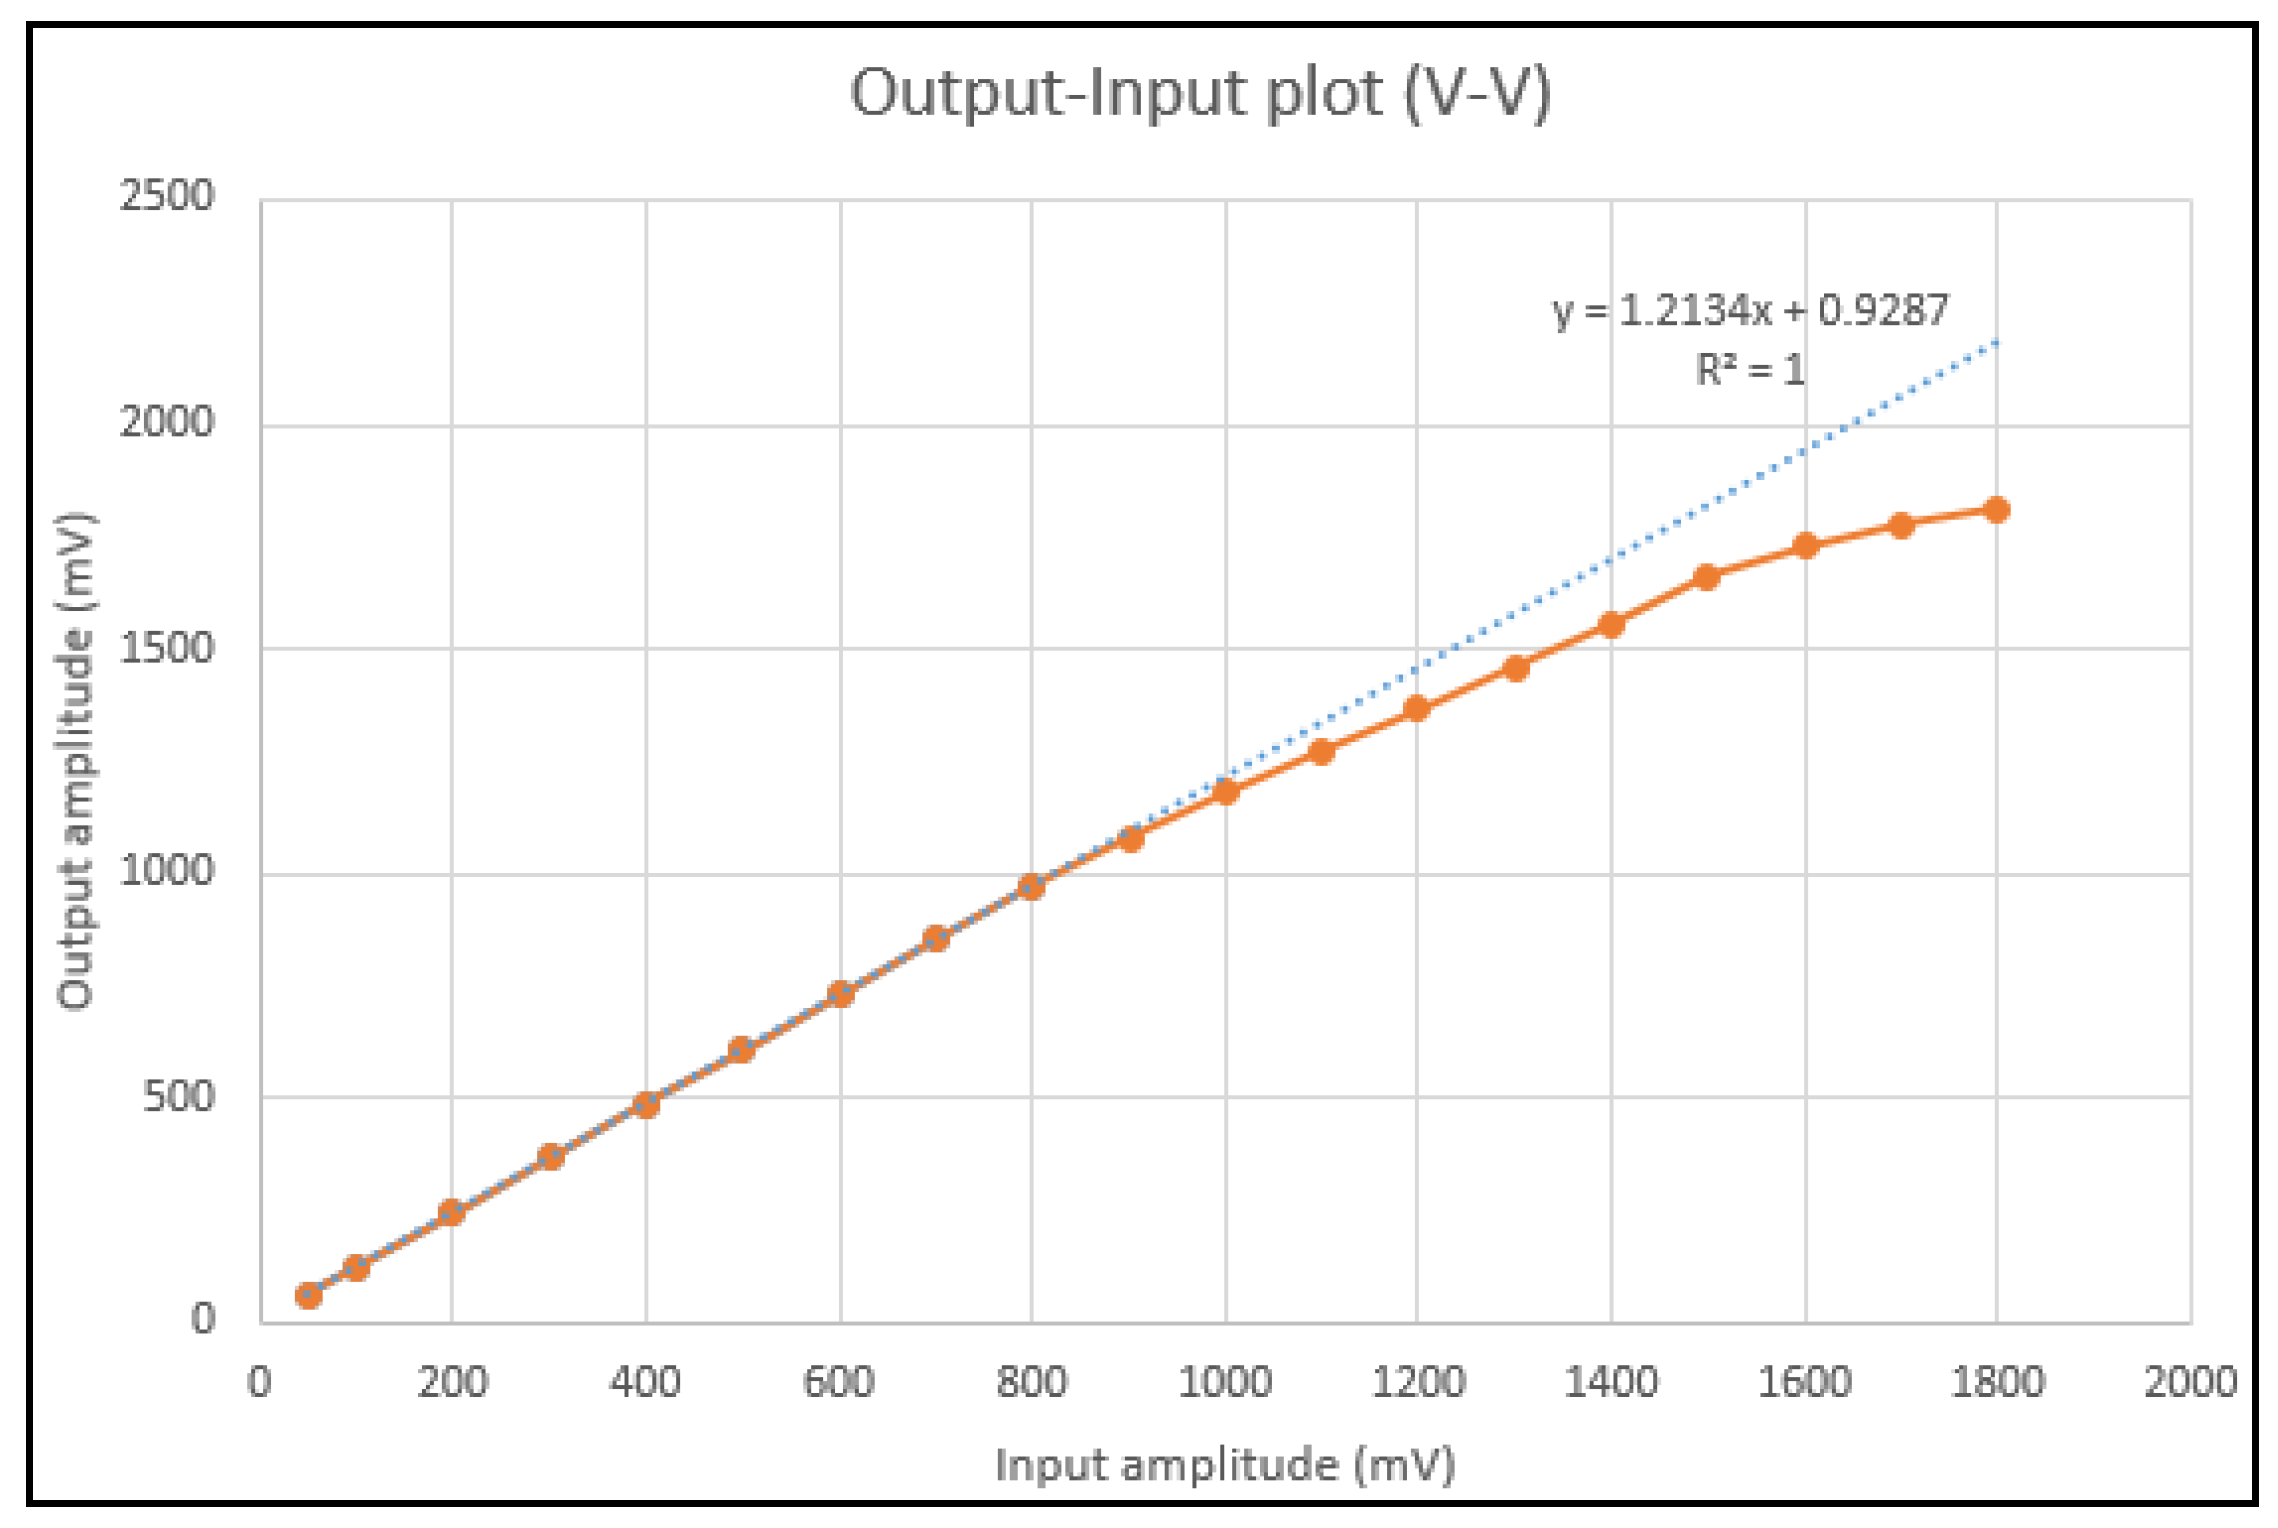
4. Measurements
5. Conclusions
Author Contributions
Funding
Acknowledgments
Conflicts of Interest
References
- Franklin, K.A.; Lindberg, E. Obstructive sleep apnea is a common disorder in the population—A review on the epidemiology of sleep apnea. J. Thorac. Dis. 2015, 7, 1311. [Google Scholar] [PubMed]
- Epstein, L.J.; Kristo, D.; Strollo, P.J.; Friedman, N.; Malhotra, A.; Patil, S.P.; Ramar, K.; Rogers, R.; Schwab, R.J.; Weaver, E.M.; et al. Clinical guideline for the evaluation, management and long-term care of obstructive sleep apnea in adults. J. Clin. Sleep Med. 2009, 5, 263. [Google Scholar] [PubMed]
- Tregear, S.; Reston, J.; Schoelles, K.; Phillips, B. Obstructive sleep apnea and risk of motor vehicle crash: Systematic review and meta-analysis. J. Clin. Sleep Med. 2009, 5, 573. [Google Scholar] [PubMed]
- Marin, J.M.; Carrizo, S.J.; Vicente, E.; Agusti, A.G. Long-term cardiovascular outcomes in men with obstructive sleep apnoea-hypopnoea with or without treatment with continuous positive airway pressure: An observational study. Lancet 2005, 365, 1046–1053. [Google Scholar] [CrossRef]
- Schmidt-Nowara, W.; Lowe, A.; Wiegand, L.; Cartwright, R.; Perez-Guerra, F.; Menn, S. Oral appliances for the treatment of snoring and obstructive sleep apnea: A review. Sleep 1995, 18, 501–510. [Google Scholar] [CrossRef] [PubMed]
- Ryan, C.F.; Love, L.L.; Peat, D.; Fleetham, J.A.; Lowe, A.A. Mandibular advancement oral appliance therapy for obstructive sleep apnoea: Effect on awake calibre of the velopharynx. Thorax 1999, 54, 972–977. [Google Scholar] [CrossRef] [PubMed]
- Schessl, J.; Rose, E.; Korinthenberg, R.; Henschen, M. Severe obstructive sleep apnea alleviated by oral appliance in a three-year-old Boy. Respiration 2008, 76, 112–116. [Google Scholar] [CrossRef] [PubMed]
- Mehta, A.; Qian, J.; Petocz, P.; Darendeliler, M.A.; Cistulli, P.A. A Randomized, controlled study of a mandibular advancement splint for obstructive sleep apnea. Am. J. Respir. Crit. Care Med. 2001, 163, 1457–1461. [Google Scholar] [CrossRef] [PubMed]
- Robertson, C.; Herbison, P.; Harkness, M. Dental and occlusal changes during mandibular advancement splint therapy in sleep disordered patients. Eur. J. Orthod. 2003, 25, 371–376. [Google Scholar] [CrossRef] [PubMed] [Green Version]
- Battagel, J.M.; L’Estrange, P.R.; Nolan, P.; Harkness, B. The role of lateral cephalometric radiography and fluoroscopy in assessing mandibular advancement in sleep-related disorders. Eur. J. Orthod. 1998, 20, 121–132. [Google Scholar] [CrossRef] [PubMed] [Green Version]
- Lee, C.H.; Kim, J.W.; Lee, H.J.; Seo, B.S.; Yun, P.Y.; Kim, D.Y.; Yoon, I.Y.; Rhee, C.S.; Park, J.W.; Mo, J.H. Determinants of treatment outcome after use of the mandibular advancement device in patients with obstructive sleep apnea. Arch. Otolaryngol. Head. Neck. Surg. 2010, 136, 677–681. [Google Scholar] [CrossRef] [PubMed]
- Kyung, S.H.; Park, Y.C.; Pae, E.K. Obstructive sleep apnea patients with the oral appliance experience pharyngeal size and shape changes in three dimensions. Angle Orthod. 2005, 75, 15–22. [Google Scholar] [PubMed]
- Haskell, J.A.; McCrillis, J.; Haskell, B.S.; Scheetz, J.P.; Scarfe, W.C.; Farman, A.G. Effects of Mandibular Advancement Device (MAD) on Airway Dimensions Assessed with Cone-beam Computed Tomography. In Seminars in Orthodontics; Elsevier: New York, NY, USA, 2009; Volume 15, pp. 132–158. [Google Scholar]
- Sanner, B.M.; Heise, M.; Knoben, B.; Machnick, M.; Laufer, U.; Kikuth, R.; Zidek, W.; Hellmich, B. MRI of the pharynx and treatment efficacy of a mandibular advancement device in obstructive sleep apnoea syndrome. Eur. J. Orthod. 2002, 20, 143–150. [Google Scholar] [CrossRef] [Green Version]
- Chan, A.S.; Sutherland, K.; Schwab, R.J.; Zeng, B.; Petocz, P.; Lee, R.W.; Darendeliler, M.A.; Cistulli, P.A. The effect of mandibular advancement on upper airway structure in obstructive sleep apnoea. Thorax 2010, 65, 726–732. [Google Scholar] [CrossRef] [PubMed] [Green Version]
- Yildirim, N.; Fitzpatrick, M.F.; Whyte, K.F.; Jalleh, R.; Wightman, A.J.; Douglas, N.J. The Effect of posture on upper airway dimensions in normal subjects and in patients with the sleep apnea/hypopnea syndrome. Am. Rev. Respir. Dis. 1991, 144, 845–847. [Google Scholar] [CrossRef] [PubMed]
- Chen, Y.T.; Yeh, C.C.; Chen, S.H.; Xu, M.X.; Tan, F.; Chen, Y.J.; Yang, Y.J. A Mandibular Advancement Device Embedded with Polymer-based Tunneling Piezoresistive Pressure Sensing Array. In Proceedings of the 31st IEEE International Conference on Micro Electro Mechanical Systems (MEMS), Belfast, UK, 21–25 January 2018; pp. 51–54. [Google Scholar]
- Park, J.; Lee, Y.; Hong, J.; Ha, M.; Jung, Y.-D.; Lim, H.; Kim, S.Y.; Ko, H. Giant tunneling piezoresistance of composite elastomers with interlocked microdome arrays for ultrasensitive and multimodal electronic skins. ACS Nano 2014, 8, 4689–4697. [Google Scholar] [CrossRef] [PubMed]
- Ma, C.W.; Chang, C.M.; Lin, T.H.; Yang, Y.J. Highly sensitive tactile sensing array realized using a novel fabrication process with membrane filters. J. Microelectromech. Syst. 2015, 24, 2062–2070. [Google Scholar] [CrossRef]


| Devices | Device A | Device B |
|---|---|---|
| Finger width (μm) | 300 | 400 |
| Gap width (μm) | 200 | 200 |
| Sensitivity (kPa−1) | 0.177 | 0.288 |
| Summary | |
| Technology | UMC 0.18um CMOS |
| Chip Area | 3.16 × 3.09 mm2 |
| Supply Voltage | 1.8 V |
| Analog Front-end | |
| SNR | 63.1 dB |
| GainBWProduct | 4.4 MHz |
| Linearity | ~0.999 |
| Sensitivity | 14 mV/kPa |
| Power Consumption | 6 mW |
| SAR ADC | |
| Resolution | 10 bit |
| Sampling Rate | 200 kS/s |
| SFDR | 74.0 [email protected] kHz |
| DNL | +0.127/−0.18 LSB |
| INL | +0.30/−0.14 LSB |
| ENOB | 9.47 [email protected] kHz |
| Power Consumption | 6.24 mW |
| Digital Control Circuits | |
| Clock Rate | UART: 38.4 KHz; Scan rate: 1 Hz |
| Power Consumption | 2.53 mW |
| Buck DC-DC Converter | |
| Input voltage | 3.6 V |
| Power Consumption | 6 mW @ 98 mA, η = 78.3% |
| OOK Transmitter | |
| Carrier Frequency | 403 MHz (MICS) |
| Output Power | −14 dBm |
| Power Consumption | 1 mW |
| Off-chip Components | |
| Li-ion Battery | 3.6 V/50 mAh |
| Power Consumption | EEPROM: 0.72 mV @ Read; 9 mV @ Write |
© 2018 by the authors. Licensee MDPI, Basel, Switzerland. This article is an open access article distributed under the terms and conditions of the Creative Commons Attribution (CC BY) license (http://creativecommons.org/licenses/by/4.0/).
Share and Cite
Chen, Y.-T.; Yeh, K.-Y.; Chen, S.-H.; Wang, C.-Y.; Yeh, C.-C.; Xu, M.-X.; Lu, S.-S.; Chen, Y.-J.; Yang, Y.-J. Tongue Pressure Sensing Array Integrated with a System-on-Chip Embedded in a Mandibular Advancement Splint. Micromachines 2018, 9, 352. https://doi.org/10.3390/mi9070352
Chen Y-T, Yeh K-Y, Chen S-H, Wang C-Y, Yeh C-C, Xu M-X, Lu S-S, Chen Y-J, Yang Y-J. Tongue Pressure Sensing Array Integrated with a System-on-Chip Embedded in a Mandibular Advancement Splint. Micromachines. 2018; 9(7):352. https://doi.org/10.3390/mi9070352
Chicago/Turabian StyleChen, Yun-Ting, Kun-Ying Yeh, Szu-Han Chen, Chuang-Yin Wang, Chao-Chi Yeh, Ming-Xin Xu, Shey-Shi Lu, Yunn-Jy Chen, and Yao-Joe Yang. 2018. "Tongue Pressure Sensing Array Integrated with a System-on-Chip Embedded in a Mandibular Advancement Splint" Micromachines 9, no. 7: 352. https://doi.org/10.3390/mi9070352