Chromogranin A as Serum Marker for Gastroenteropancreatic Neuroendocrine Tumors: A Single Center Experience and Literature Review

Abstract
:1. Introduction
2. Results and Discussion
2.1. Chromogranin A (CgA)

| CIS-Bio IRMA Kit | Sensitivity | CgA Cut-Off Level (ng/mL) |
|---|---|---|
| n = 110 | 62% | <98 |
| n = 110 | 73% | <70 |
| n = 110 | 83% | <53 |
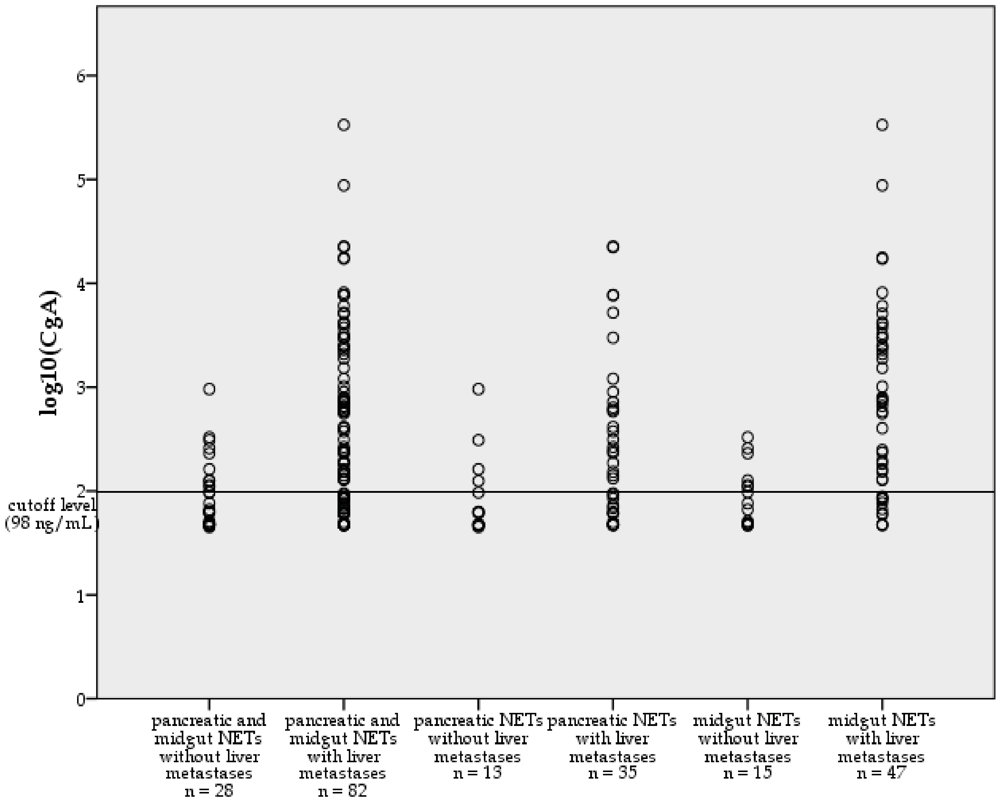
| CIS-Bio IRMA Kit | Pancreatic NETs | Sensitivity in Pancreatic NETs | Midgut NETs / Carcinoids | Sensitivity in Midgut NETs / Carcinoids |
|---|---|---|---|---|
| CgA Cutoff level (ng/mL): 98 | n = 48 | 26/48 (54%) | n = 62 | 42/62 (68%) |
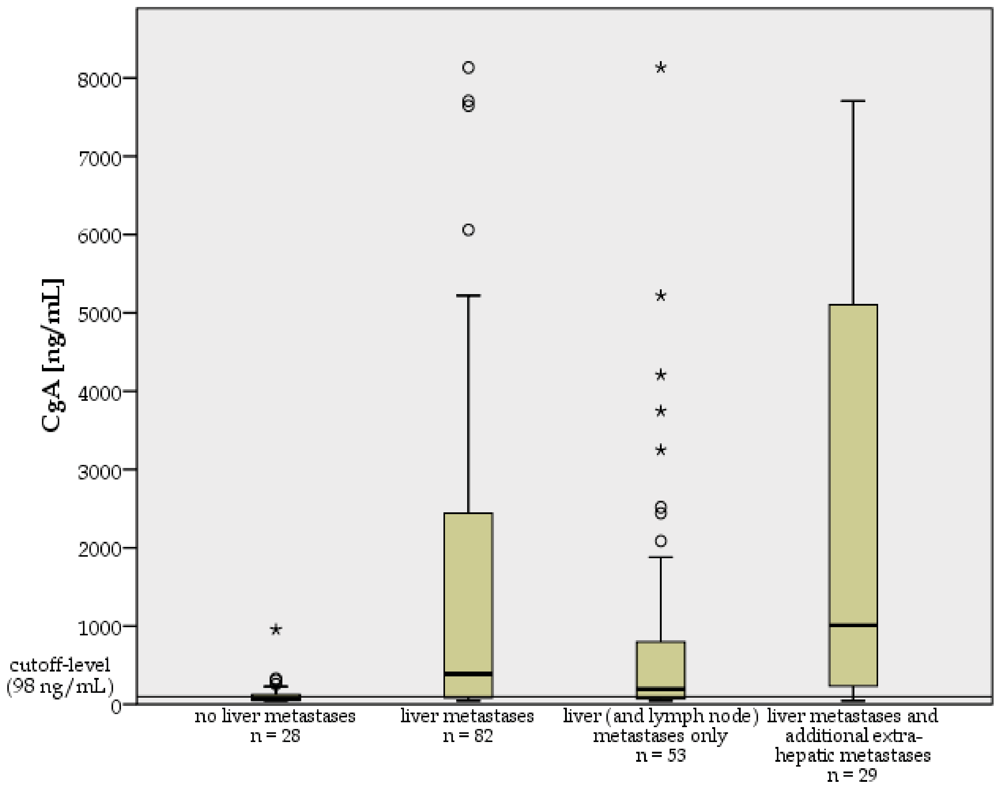
| Sensitivity of CgA * | No Liver Metastases | Liver Metastases |
|---|---|---|
| Pancreatic NETs (n = 48) | 4/13 (31%) | 22/35 (63%) |
| Midgut NETs (n = 62) | 6/15 (40%) | 36/47 (77%) |
| Total | 10/28 (36%) | 58/82 (71%) |
| Sensitivity of CgA * | Localized Disease | Lymph Node Metastases Only | Pulmonary Metastases Only | Lymph Node and Pulmonary Metastases Only | Liver (± Lymph Node) Metastases Only | Liver Metastases and Additional Bone, Peritoneal or Pulmonary Metastases |
|---|---|---|---|---|---|---|
| Pancreatic NETs (n = 48) | 3/10 (30%) | 1/2 (50%) | 0/1 (0%) | 15/25 (60%) | 7/10 (70%) | |
| Midgut NETs (n = 62) | 3/9 (33%) | 2/5 (40%) | 1/1 (100%) | 20/28 (71%) | 16/19 (84%) | |
| Total | 6/19 (32%) | 3/7 (43%) | 0/1 (0%) | 1/1 (100%) | 35/53 (66%) | 23/29 (79%) |


2.2. Alkaline Phosphatase (AP)
| Sensitivity of AP * | No Liver Metastases | Liver Metastases | Total |
|---|---|---|---|
| Pancreatic NETs (n = 48) | 3/13 (23%) | 17/35 (49%) | 20/48 (42%) |
| Midgut NETs (n = 62) | 1/15 (7%) | 15/47 (32%) | 16/62 (26%) |
| Total | 4/28 (14%) | 32/82 (39%) | 36/110 (33%) |
2.3. Urinary 5-Hydroxyindoleacetic Acid (5-HIAA)
| Sensitivity of 5-HIAA * | No Liver Metastases | Liver Metastases |
|---|---|---|
| Midgut NETs (n = 51) | 0/11 (0%) | 35/40 (88%) |
2.4. Discussion and Literature Review
| CIS-bio IRMA Kit | Stridsberg et al. (n = 45) | Ferrari et al. (n = 93) | Zatelli et al. (n = 202) |
|---|---|---|---|
| Sensitivity | 67% | 79% | 78% |
| Specificity | 96% | 64% | 71% |
| CgA Cutoff Level (ng/mL) | <99 | <70 | <53 |
| DAKO ELISA Kit | Stridsberg et al. (n = 45) | Ferrari et al. (n = 93) | Zatelli et al. (n = 202) |
|---|---|---|---|
| Sensitivity | 85% | 79% | 84% |
| Specificity | 85% | 91% | 85% |
| CgA Cutoff Level [U/L] | <19 | <34 | <16 |
| Eurodiagnostica RIA | Stridsberg et al. (n = 45) |
|---|---|
| Sensitivity | 93% |
| Specificity | 85% |
| CgA Cutoff Level (mmol/L) | <4 |
| Pancreatic NETs | Sensitivity in Pancreatic NETs | Midgut NETs / Carcinoids | Sensitivity in Midgut NETs / Carcinoids | |
|---|---|---|---|---|
| Current Study 1 CgA Cutoff level (ng/mL): 98 | n = 48 * | 54% | n = 62 | 68% |
| Stridsberg et al. 1 CgA Cutoff level (ng/mL): 99 | n = 16 * | 69% | n = 11 | 73% |
| Ferrari et al. 1 CgA Cutoff level (ng/mL): 70 | n = 36 * | 58% | n = 14 | 85% |
| Tomassetti et al. 2 CgA Cutoff level (U/L): 17 | n = 29 ** | 55% | n = 34 | 59% |
| Stridsberg et al. 2 CgA Cutoff level (U/L): 19 | n = 16 * | 81% | n = 11 | 91% |
| Ferrari et al. 2 CgA Cutoff level (U/L): 34 | n = 36 * | 92% | n = 14 | 81% |
| Nobels et al. 3 CgA Cutoff level (ng/mL): 175 | n = 34 *** | 32% | n = 59 | 80% |
| Falsely High Levels | |
|---|---|
| Carcinoma | Hepatocellular carcinoma, pancreas carcinoma, colorectal cancer, small cell lung cancer, breast cancer, ovary cancer, prostate cancer, neuroblastoma |
| Renal Disease | Renal insufficiency |
| Cardiovascular Diseases | Arterial hypertension, cardiac insufficiency, acute coronary syndrome |
| Gastrointestinal Disorders | Chronic atrophic gastritis, pancreatitis, inflammatory bowel disease, irritable bowel syndrome, liver cirrhosis, chronic hepatitis |
| Inflammatory Diseases | Systemic rheumatoid arthritis, chronic bronchitis, airway obstruction in smokers |
| Drugs | PPI, H2RA |
| Others | Food intake and sports shortly before CgA measurement |
| Falsely High Levels | Falsely Low Levels | |
|---|---|---|
| Drugs | Acetaminophen, cumarin, diazepam, fluorouracil, antihypertensive drugs, ephedrine, reserpine, mephenesin, phenobarbital, amphetamine | Heparin, aspirin, MAO-inhibitors, methyldopa, levodopa, tricyclic antidepressants, isoniacide, hydralazine |
| Fruits | Banana, pineapple, currant, plum, melon, gooseberry, mirabelles, kiwi | |
| Vegetable | Tomatoes, avocados, aubergines | |
| Other Food | Chocolate, walnuts | |
| Natural Stimulants | Nicotine, coffee, black tea | Alcohol |
| Co-morbiditiesc | Coeliac sprue, epilepsy | Renal insufficiency |
3. Experimental Section
3.1. Patients and Laboratory Measurements
3.2. Statistics and Data Analysis
4. Conclusions
Acknowledgements
References
- Modlin, I.M.; Gustafsson, B.I.; Moss, S.F.; Pavel, M.; Tsolakis, A.V.; Kidd, M. Chromogranin A—Biological function and clinical utility in neuro endocrine tumor disease. Ann. Surg. Oncol. 2010, 17, 2427–2443. [Google Scholar] [CrossRef]
- Deftos, L.J. Chromogranin A: Its role in endocrine function and as an endocrine and neuroendocrine tumor marker. Endocr. Rev. 1991, 12, 181–187. [Google Scholar] [CrossRef]
- Taupenot, L.; Harper, K.L.; O'Connor, D.T. The chromogranin-secretogranin family. N. Engl. J. Med. 2003, 348, 1134–1149. [Google Scholar] [CrossRef]
- Nobels, F.R.; Kwekkeboom, D.J.; Bouillon, R.; Lamberts, S.W. Chromogranin A: Its clinical value as marker of neuroendocrine tumours. Eur. J. Clin. Invest. 1998, 28, 431–440. [Google Scholar] [CrossRef]
- Nobels, F.R.; Kwekkeboom, D.J.; Coopmans, W.; Schoenmakers, C.H.; Lindemans, J.; de Herder, W.W.; Krenning, E.P.; Bouillon, R.; Lamberts, S.W. Chromogranin A as serum marker for neuroendocrine neoplasia: Comparison with neuron-specific enolase and the alpha-subunit of glycoprotein hormones. J. Clin. Endocrinol. Metab. 1997, 82, 2622–2628. [Google Scholar]
- O'Connor, D.T.; Deftos, L.J. Secretion of chromogranin A by peptide-producing endocrine neoplasms. N. Engl. J. Med. 1986, 314, 1145–1151. [Google Scholar] [CrossRef]
- Sobol, R.E.; Memoli, V.; Deftos, L.J. Hormone-negative, chromogranin A-positive endocrine tumors. N. Engl. J. Med. 1989, 320, 444–447. [Google Scholar] [CrossRef]
- Eriksson, B.; Oberg, K.; Stridsberg, M. Tumor markers in neuroendocrine tumors. Digestion 2000, 62, S33–S38. [Google Scholar] [CrossRef]
- Oberg, K. The ultimate biochemical diagnosis of gastro-enteropancreatic tumours. Digestion 1996, 57, S45–S47. [Google Scholar] [CrossRef]
- Ahmed, A.; Turner, G.; King, B.; Jones, L.; Culliford, D.; McCance, D.; Ardill, J.; Johnston, B.T.; Poston, G.; Rees, M.; et al. Midgut neuroendocrine tumours with liver metastases: Results of the UKINETS study. Endocr. Relat. Cancer 2009, 16, 885–894. [Google Scholar] [CrossRef]
- O'Toole, D.; Grossman, A.; Gross, D.; Delle Fave, G.; Barkmanova, J.; O'Connor, J.; Pape, U.F.; Plockinger, U. ENETS consensus guidelines for the standards of care in neuroendocrine tumors: Biochemical markers. Neuroendocrinology 2009, 90, 194–202. [Google Scholar] [CrossRef]
- Vinik, A.I.; Woltering, E.A.; Warner, R.R.; Caplin, M.; O'Dorisio, T.M.; Wiseman, G.A.; Coppola, D.; Go, V.L. NANETS consensus guidelines for the diagnosis of neuroendocrine tumor. Pancreas 2010, 39, 713–734. [Google Scholar] [CrossRef]
- Lawrence, B.; Gustafsson, B.I.; Kidd, M.; Pavel, M.; Svejda, B.; Modlin, I.M. The clinical relevance of chromogranin A as a biomarker for gastroenteropancreatic neuroendocrine tumors. Endocrinol. Metab. Clin. North Am. 2011, 40, 111–134. [Google Scholar] [CrossRef]
- Ferrari, L.; Seregni, E.; Lucignani, G.; Bajetta, E.; Martinetti, A.; Aliberti, G.; Pallotti, F.; Procopio, G.; Della Torre, S.; Luksch, R.; et al. Accuracy and clinical correlates of two different methods for chromogranin A assay in neuroendocrine tumors. Int. J. Biol. Markers 2004, 19, 295–304. [Google Scholar]
- Stridsberg, M.; Eriksson, B.; Oberg, K.; Janson, E.T. A comparison between three commercial kits for chromogranin A measurements. J. Endocrinol. 2003, 177, 337–341. [Google Scholar] [CrossRef]
- Zatelli, M.C.; Torta, M.; Leon, A.; Ambrosio, M.R.; Gion, M.; Tomassetti, P.; de Braud, F.; Delle Fave, G.; Dogliotti, L.; degli Uberti, E.C. Chromogranin A as a marker of neuroendocrine neoplasia: An Italian Multicenter Study. Endocr. Relat. Cancer 2007, 14, 473–482. [Google Scholar] [CrossRef]
- Baudin, E.; Bidart, J.M.; Bachelot, A.; Ducreux, M.; Elias, D.; Ruffie, P.; Schlumberger, M. Impact of chromogranin A measurement in the work-up of neuroendocrine tumors. Ann. Oncol. 2001, 12, S79–S82. [Google Scholar] [CrossRef]
- Schurmann, G.; Raeth, U.; Wiedenmann, B.; Buhr, H.; Herfarth, C. Serum chromogranin A in the diagnosis and follow-up of neuroendocrine tumors of the gastroenteropancreatic tract. World J. Surg. 1992, 16, 697–701. [Google Scholar] [CrossRef]
- Nikou, G.C.; Marinou, K.; Thomakos, P.; Papageorgiou, D.; Sanzanidis, V.; Nikolaou, P.; Kosmidis, C.; Moulakakis, A.; Mallas, E. Chromogranin a levels in diagnosis, treatment and follow-up of 42 patients with non-functioning pancreatic endocrine tumours. Pancreatology 2008, 8, 510–519. [Google Scholar] [CrossRef]
- Tomassetti, P.; Migliori, M.; Simoni, P.; Casadei, R.; de Iasio, R.; Corinaldesi, R.; Gullo, L. Diagnostic value of plasma chromogranin A in neuroendocrine tumours. Eur. J. Gastroenterol. Hepatol. 2001, 13, 55–58. [Google Scholar] [CrossRef]
- Arnold, R.; Wilke, A.; Rinke, A.; Mayer, C.; Kann, P.H.; Klose, K.J.; Scherag, A.; Hahmann, M.; Muller, H.H.; Barth, P. Plasma chromogranin A as marker for survival in patients with metastatic endocrine gastroenteropancreatic tumors. Clin. Gastroenterol. Hepatol. 2008, 6, 820–827. [Google Scholar] [CrossRef]
- Janson, E.T.; Holmberg, L.; Stridsberg, M.; Eriksson, B.; Theodorsson, E.; Wilander, E.; Oberg, K. Carcinoid tumors: Analysis of prognostic factors and survival in 301 patients from a referral center. Ann. Oncol. 1997, 8, 685–690. [Google Scholar] [CrossRef]
- Kolby, L.; Bernhardt, P.; Sward, C.; Johanson, V.; Ahlman, H.; Forssell-Aronsson, E.; Stridsberg, M.; Wangberg, B.; Nilsson, O. Chromogranin A as a determinant of midgut carcinoid tumour volume. Regul. Pept. 2004, 120, 269–273. [Google Scholar] [CrossRef]
- Korse, C.M.; Bonfrer, J.M.; Aaronson, N.K.; Hart, A.A.; Taal, B.G. Chromogranin A as an alternative to 5-hydroxyindoleacetic acid in the evaluation of symptoms during treatment of patients with neuroendocrine tumors. Neuroendocrinology 2009, 89, 296–301. [Google Scholar] [CrossRef]
- Clancy, T.E.; Sengupta, T.P.; Paulus, J.; Ahmed, F.; Duh, M.S.; Kulke, M.H. Alkaline phosphatase predicts survival in patients with metastatic neuroendocrine tumors. Dig. Dis. Sci. 2006, 51, 877–884. [Google Scholar] [CrossRef]
- Campana, D.; Nori, F.; Piscitelli, L.; Morselli-Labate, A.M.; Pezzilli, R.; Corinaldesi, R.; Tomassetti, P. Chromogranin A: Is it a useful marker of neuroendocrine tumors? J. Clin. Oncol. 2007, 25, 1967–1973. [Google Scholar] [CrossRef]
- Nehar, D.; Lombard-Bohas, C.; Olivieri, S.; Claustrat, B.; Chayvialle, J.A.; Penes, M.C.; Sassolas, G.; Borson-Chazot, F. Interest of Chromogranin A for diagnosis and follow-up of endocrine tumours. Clin. Endocrinol. (Oxf.) 2004, 60, 644–652. [Google Scholar]
- Walter, T.; Chardon, L.; Chopin-Laly, X.; Raverot, V.; Caffin, A.G.; Chayvialle, J.A.; Scoazec, J.Y.; Lombard-Bohas, C. Is the combination of chromogranin A and pancreatic polypeptide serum determinations of interest in the diagnosis and follow-up of gastro-entero-pancreatic neuroendocrine tumours? Eur. J. Cancer 2011, in press.. [Google Scholar]
- Pirker, R.A.; Pont, J.; Pohnl, R.; Schutz, W.; Griesmacher, A.; Muller, M.M. Usefulness of chromogranin A as a marker for detection of relapses of carcinoid tumours. Clin. Chem. Lab. Med. 1998, 36, 837–840. [Google Scholar] [CrossRef]
- Welin, S.; Stridsberg, M.; Cunningham, J.; Granberg, D.; Skogseid, B.; Oberg, K.; Eriksson, B.; Janson, E.T. Elevated plasma chromogranin A is the first indication of recurrence in radically operated midgut carcinoid tumors. Neuroendocrinology 2009, 89, 302–307. [Google Scholar] [CrossRef]
- Yao, J.C.; Pavel, M.; Phan, A.T.; Kulke, M.H.; Hoosen, S.; St. Peter, J.; Cherfi, A.; Oberg, K.E. Chromogranin A and neuron-specific enolase as prognostic markers in patients with advanced pNET treated with everolimus. J. Clin. Endocrinol. Metab. 2011, 96, 3741–3749. [Google Scholar] [CrossRef]
- Vezzosi, D.; Walter, T.; Laplanche, A.; Raoul, J.L.; Dromain, C.; Ruszniewski, P.; d'Herbomez, M.; Guigay, J.; Mitry, E.; Cadiot, G.; et al. Chromogranin A measurement in metastatic well-differentiated gastroenteropancreatic neuroendocrine carcinoma: Screening for false positives and a prospective follow-up study. Int. J. Biol. Markers 2011, 26, 94–101. [Google Scholar] [CrossRef]
- Bland, J.M.; Altman, D.G. Calculating correlation coefficients with repeated observations: Part 1—Correlation within subjects. BMJ 1995, 310, 446. [Google Scholar]
© 2012 by the authors; licensee MDPI, Basel, Switzerland. This article is an open access article distributed under the terms and conditions of the Creative Commons Attribution license (http://creativecommons.org/licenses/by/3.0/).
Share and Cite
Nölting, S.; Kuttner, A.; Lauseker, M.; Vogeser, M.; Haug, A.; Herrmann, K.A.; Hoffmann, J.N.; Spitzweg, C.; Göke, B.; Auernhammer, C.J. Chromogranin A as Serum Marker for Gastroenteropancreatic Neuroendocrine Tumors: A Single Center Experience and Literature Review. Cancers 2012, 4, 141-155. https://doi.org/10.3390/cancers4010141
Nölting S, Kuttner A, Lauseker M, Vogeser M, Haug A, Herrmann KA, Hoffmann JN, Spitzweg C, Göke B, Auernhammer CJ. Chromogranin A as Serum Marker for Gastroenteropancreatic Neuroendocrine Tumors: A Single Center Experience and Literature Review. Cancers. 2012; 4(1):141-155. https://doi.org/10.3390/cancers4010141
Chicago/Turabian StyleNölting, Svenja, Axel Kuttner, Michael Lauseker, Michael Vogeser, Alexander Haug, Karin A. Herrmann, Johannes N. Hoffmann, Christine Spitzweg, Burkhard Göke, and Christoph J. Auernhammer. 2012. "Chromogranin A as Serum Marker for Gastroenteropancreatic Neuroendocrine Tumors: A Single Center Experience and Literature Review" Cancers 4, no. 1: 141-155. https://doi.org/10.3390/cancers4010141