Cell Line Secretome and Tumor Tissue Proteome Markers for Early Detection of Colorectal Cancer: A Systematic Review


1
Division of Preventive Oncology, German Cancer Research Center (DKFZ) and National Center for Tumor Diseases (NCT), 69120 Heidelberg, Germany
2
Division of Clinical Epidemiology and Aging Research, German Cancer Research Center (DKFZ), 69120 Heidelberg, Germany
3
German Cancer Consortium (DKTK), German Cancer Research Center (DKFZ), 69120 Heidelberg, Germany
*
Author to whom correspondence should be addressed.
Cancers 2017, 9(11), 156; https://doi.org/10.3390/cancers9110156
Submission received: 24 October 2017
/
Revised: 6 November 2017
/
Accepted: 8 November 2017
/
Published: 16 November 2017
(This article belongs to the Special Issue Cancer Biomarkers)
Abstract
:Objective: In order to find low abundant proteins secretome and tumor tissue proteome data have been explored in the last few years for the diagnosis of colorectal cancer (CRC). In this review we aim to summarize the results of studies evaluating markers derived from the secretome and tumor proteome for blood based detection of colorectal cancer. Methods: Observing the preferred reporting items for systematic reviews and meta-analysis (PRISMA) guidelines PubMed and Web of Science databases were searched systematically for relevant studies published up to 18 July 2017. After screening for predefined eligibility criteria a total of 47 studies were identified. Information on diagnostic performance indicators, methodological procedures and validation was extracted. Functions of proteins were identified from the UniProt database and the the Quality Assessment of Diagnostic Accuracy Studies-2 (QUADAS-2) tool was used to assess study quality. Results: Forty seven studies meeting inclusion criteria were identified. Overall, 83 different proteins were identified, with carcinoembryonic Antigen (CEA) being by far the most commonly reported (reported in 24 studies). Evaluation of the markers or marker combinations in blood samples from CRC cases and controls yielded apparently very promising diagnostic performances, with area under the curve >0.9 in several cases, but lack of internal or external validation, overoptimism due to overfitting and spectrum bias due to evaluation in clinical setting rather than screening settings are major concerns. Conclusions: Secretome and tumor proteome-based biomarkers when validated in blood yield promising candidates. However, for discovered protein markers to be clinically applicable as screening tool they have to be specific for early stages and need to be validated externally in larger studies with participants recruited in true screening setting.
1. Introduction
With approximately 1.4 million incident cases per year and 700,000 deaths, colorectal cancer (CRC) is the third most common malignancy and fourth leading cause of cancer-related mortality worldwide [1]. Additionally, CRC is one of major contributors to disability-adjusted-life-years (DALYs) in most regions of the world [2]. Recent estimates suggest that the burden of CRC is expected to increase by 60%, to more than 2.2 million new cases and 1.1 million deaths by 2030 [3]. A large proportion of this burden could be prevented by screening, either by detection of the cancer at earlier stages, when chances of cure are substantially higher than at later stages or by detection and removal of precancerous lesions, e.g., through screening by flexible sigmoidoscopy or colonoscopy [4,5].
Nevertheless, the use of endoscopic exams for primary screening faces limitations in terms of invasiveness, available capacities, costs, inconvenience and adherence [6,7]. As a non-invasive alternative, stool-based tests, in particular fecal immunochemical tests for hemoglobin (FITs) are increasingly used, but studies consistently show that people would highly prefer blood-based screening test over stool-based screening tests [8,9,10,11]. The already known blood-based protein biomarkers like carcinoembryonic antigen (CEA) and carbohydrate antigen 19-9 (CA 19-9) alone lack the sensitivity and specificity needed for early diagnosis of CRC [12,13,14] which underlines the importance to identify and validate additional, more sensitive blood-based markers or marker signatures.
In recent years the secretome from conditioned media of cell culture and the tumor tissue proteome have turned out to be interesting and informative sources for markers associated with early diagnosis of CRC. The cell line secretome and tumor tissue proteome comprise all proteins shed, secreted or leaked from the cancer cells [15,16]. These secreted or leaked proteins are likely to end up in the systemic blood circulation and even though concentrations may be low, they have a high potential for serving as candidate diagnostic markers. The aim of this systematic review is to provide an overview of studies that investigated the diagnostic potential of proteins from the cell line sercretome and/or tumor tissue and validated those markers in blood from CRC patients and controls.
2. Methods
2.1. Data Sources and Search Strategy
Adhering to preferred reporting items for systematic reviews and meta-analysis (PRISMA) guidelines [17] a literature search was performed in the online scientific citation databases Web of Science (previously known as ISI Web of Knowledge) and MEDLINE (via PubMed) from establishment until 18 July 2017. Details of the search terms which included keywords like “Cell line”, “Secretome”, “Tumor microenvironment”, “Tumor tissue”, “Protein”, or “Colorectal Cancer” are reported in the Supplementary Materials File S1.
2.2. Study Selection, Data Extraction and Risk of Bias Assessment
The language of the selected literature was restricted to English. Only studies which firstly discovered protein markers in the cell-line secretome or tumor tissue proteome and later validated these candidates in serum or plasma were included. Studies were excluded if they did not report sufficient information on diagnostic indicators, if the candidates were not validated in blood, if the number of CRC cases were less than 10 and if the diagnostic performance was reported only for unidentified peaks. A set of proteins was classified as combination if the joint diagnostic performance was reported for ≥2 proteins in an individual study.
Data from all relevant studies regarding characteristics of study participants, platform used for quantification in blood, diagnostic performance related indicators and methods used for validation and correction for overoptimism was extracted from the main and Supplementary Files by Megha Bhardwaj and Vanessa Erben (two authors) independently. In order to assess the risk of bias the Quality Assessment of Diagnostic Accuracy Studies 2 instrument (QUADAS-2) [18] was used. The information on functions and locations of proteins was extracted from the UniProt database [19] and 95% confidence intervals (95% CI) of given sensitivities and specificities by Clopper-Pearson method were calculated using R (R core team 2016, version R 3.3.2, Vienna, Austria).
3. Results
3.1. Study Selection
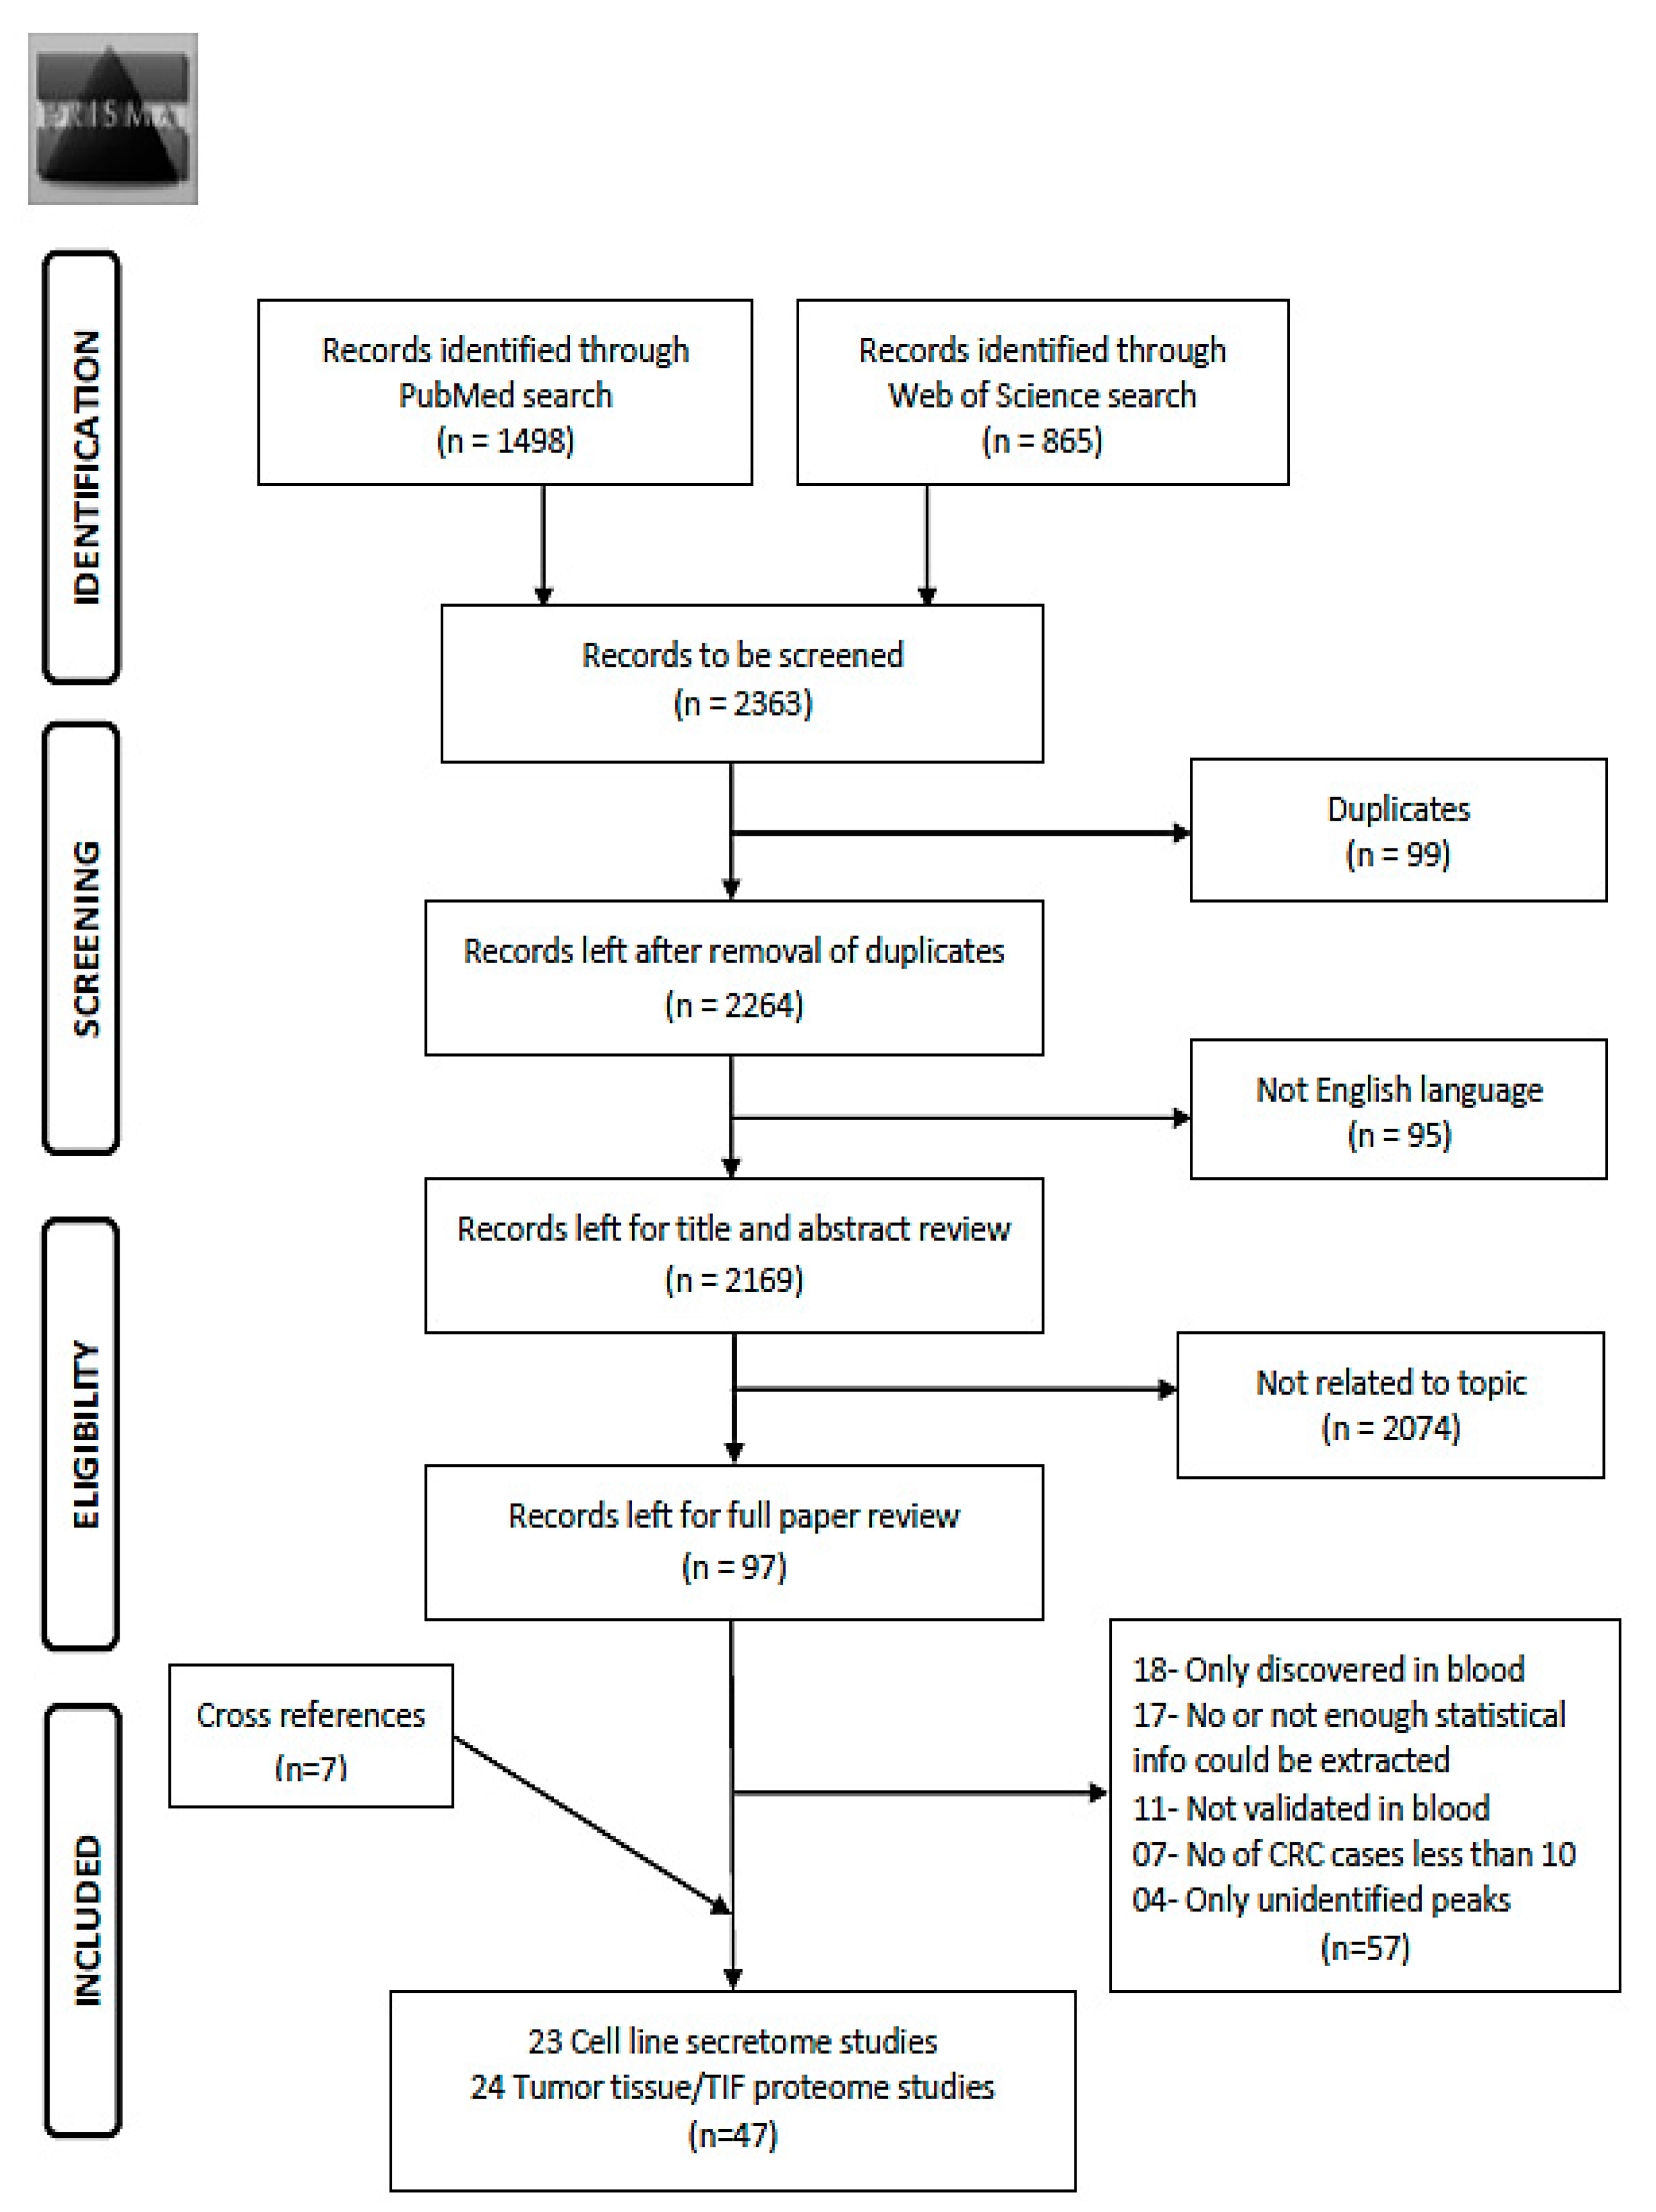
Using the search term given in Supplementary Materials File S1, 2363 records were obtained from the two databases (Figure 1). After exclusion of duplicates (n = 99) and non-English articles (n = 95), the remaining 2169 articles were reviewed for title and abstract. From these, 2074 articles were found to be not related to the topic and 97 articles remained for full text review. Applying the pre-determined eligibility criteria, 40 studies remained and seven other studies were acquired with careful cross referencing. Amongst the 47 finally selected studies, 29 reported diagnostic performance of combinations of protein markers and 18 studies reported diagnostic performance of individual markers. Twenty-three studies assessed cell line secretome, seventeen out of which additionally assessed tumor tissues. The remaining 21 studies were exclusively based on tumor and normal tissue comparison and three studies on xenograft tissue interstitial fluid (TIF). Characteristics of the study populations for cell line secretome and tumor tissue/TIF studies are reported in Table 1 and Table 2 respectively. Furthermore, information concerning type of proteins, platform for validation in blood, internal and/or external validation employed and diagnostic performance related indicators are summarized in Table 3 and Table 4 for cell line secretome and tumor tissue/TIF studies respectively. Figure 2 and Figure 3 represent the diagnostic performances of proteins by internal validation performed and molecular functions, respectively. Supplementary Materials S1–S5 contain search strategy, stage specific numbers and diagnostic performances, functions and locations of proteins, risk of bias and applicability concerns for individual studies and the PRISMA checklist [20], respectively.
3.2. Study Characteristics
Table 1 and Table 2 present an overview on the characteristics of the participants for the cell line secretome and tumor tissue proteome marker studies, respectively. Twenty-nine studies were conducted in Asia; fourteen in China [21,22,23,24,25,26,27,28,29,30,31,32,33,34], five each in Taiwan [35,36,37,38,39] and Japan [40,41,42,43,44], four in Korea [45,46,47,48] and one in Singapore [49]. Out of 15 studies that were carried out in Europe, six studies were performed in Spain [50,51,52,53,54,55], four in Germany [56,57,58,59] out of which one multicenter study was also carried out in the Czech Republic [58], and one each in Denmark [60], France [61], Ireland [62], The Netherlands [63] and Poland [64]. Three studies were carried out in the United States of America [65,66,67]. Among the 23 different cell secretome studies cell line SW480 was used in 16, SW620 in 12, HCT116 in 11, Colo205 in 10 and Caco-2, LoVo and HT-29 each in eight different studies, respectively. For 24 studies that used tumor tissue and pairwise or adjacent normal mucosa or TIF from xenograft models, the number of tumor tissue samples ranged from 6 to 294.
The numbers of study participants used for validating the candidates in blood samples ranged from 30 to 280 CRC cases and from 20 to 201 controls for marker combination studies and from 8 to 405 CRC cases and 16 to 317 controls for individual protein marker studies. In only one study blood was collected from asymptomatic participants before diagnosis [65]. In one study blood was collected post-operatively [40]. All studies had a case control design and nine studies matched cases and controls with respect to age [21,32,39,43,48,52,54,60,65] and/or gender [32,43,48,52,60,65]. In some of the studies, mean age varied strongly between cases and controls e.g., 39 versus 67 years in a study from Japan [40] and 65.5 versus 41 years in a study from China [24]. There were more male than female study participants in 30 out of 34 studies where the gender distribution was reported. Stage distribution of cases was reported by 36 different studies and there was a majority of early stage cases (i.e., stage I or II) in 17 studies and late stage cases (i.e., stage III or IV) in 16 studies whereas early and late stages were equally represented in three studies. Nine studies used other case groups like participants with adenomas (details in Supplementary Materials Table S2).
3.3. Diagnostic Performance of Biomarkers
Overall the diagnostic performance of all markers from the 47 studies included in the review varied widely, with the sensitivity, specificity and Area under the ROC curve (AUC) ranging from 22–100%, 48–100% and 0.464–0.989 respectively (Table 3 and Table 4). The number of proteins evaluated ranged from 1 to 12. Eighteen out of 47 studies performed some form of correction for overoptimism. In Figure 2 the diagnostic performances of the studies are plotted (sensitivity on y-axis and 1-specificty on x-axis) with respect to internal validation performed by these studies for correction of overoptimism. As shown in this figure the studies with internal validation typically reported somewhat lower sensitivities at comparable levels of specificity, than studies without internal validation.
As shown in Table 3, fifteen studies that used cell line secretome for identification of combination protein markers, reported 31 different protein marker candidates. The number of protein markers in the combinations varied from 2 to 12. The most common marker included in the combinations by far was CEA (included in 10 out of 15 combinations). Out of the 15 studies only six [37,50,51,52,65,67] performed some form of correction for overoptimism. From these six the best diagnostic performance with 89% sensitivity at 90% specificity, was reported by Barderas et al. [52] that used secretome from 16 different cell lines and Enzyme-linked immunosorbent assay (ELISA) based validation for a combination of protein markers MAPKAPK3, ACVR2B, PIM1, FGFR4 and phages GRN, NHSL1, SREBF2.
In total 14 of the studies comparing tumor tissues and adjacent normal mucosa reported some biomarker combinations (Table 4). Overall, 38 different proteins were included in some of the combinations, with CEA included in eight out of 14 combinations, again being the most commonly reported. From six studies that performed some form of correction for overoptimism [25,29,42,58,61,62], Kijanka et al. [62] reported best diagnostic performance (84% sensitivity at 80% specificity) with a 12 protein marker combination using tissue from 43 CRC patients and 19 controls with no neoplasm of colon.
From the 18 studies that reported individual biomarkers rather than combinations, eight used cell line secretome and 10 used tumor tissue proteome data. Twenty-three different individual biomarkers were reported by this category and except CEA (reported in six of the 18 studies) no biomarker was used in more than one study. Only five studies [22,30,43,55,66] performed correction for overoptimism, all utilizing the split sample method and among these the best diagnostic performance was reported by Ji et al. [22] for protein Zinc-α-2-glycoprotein with 100% sensitivity at 79% specificity.
3.4. Functionality of Discovered Proteins
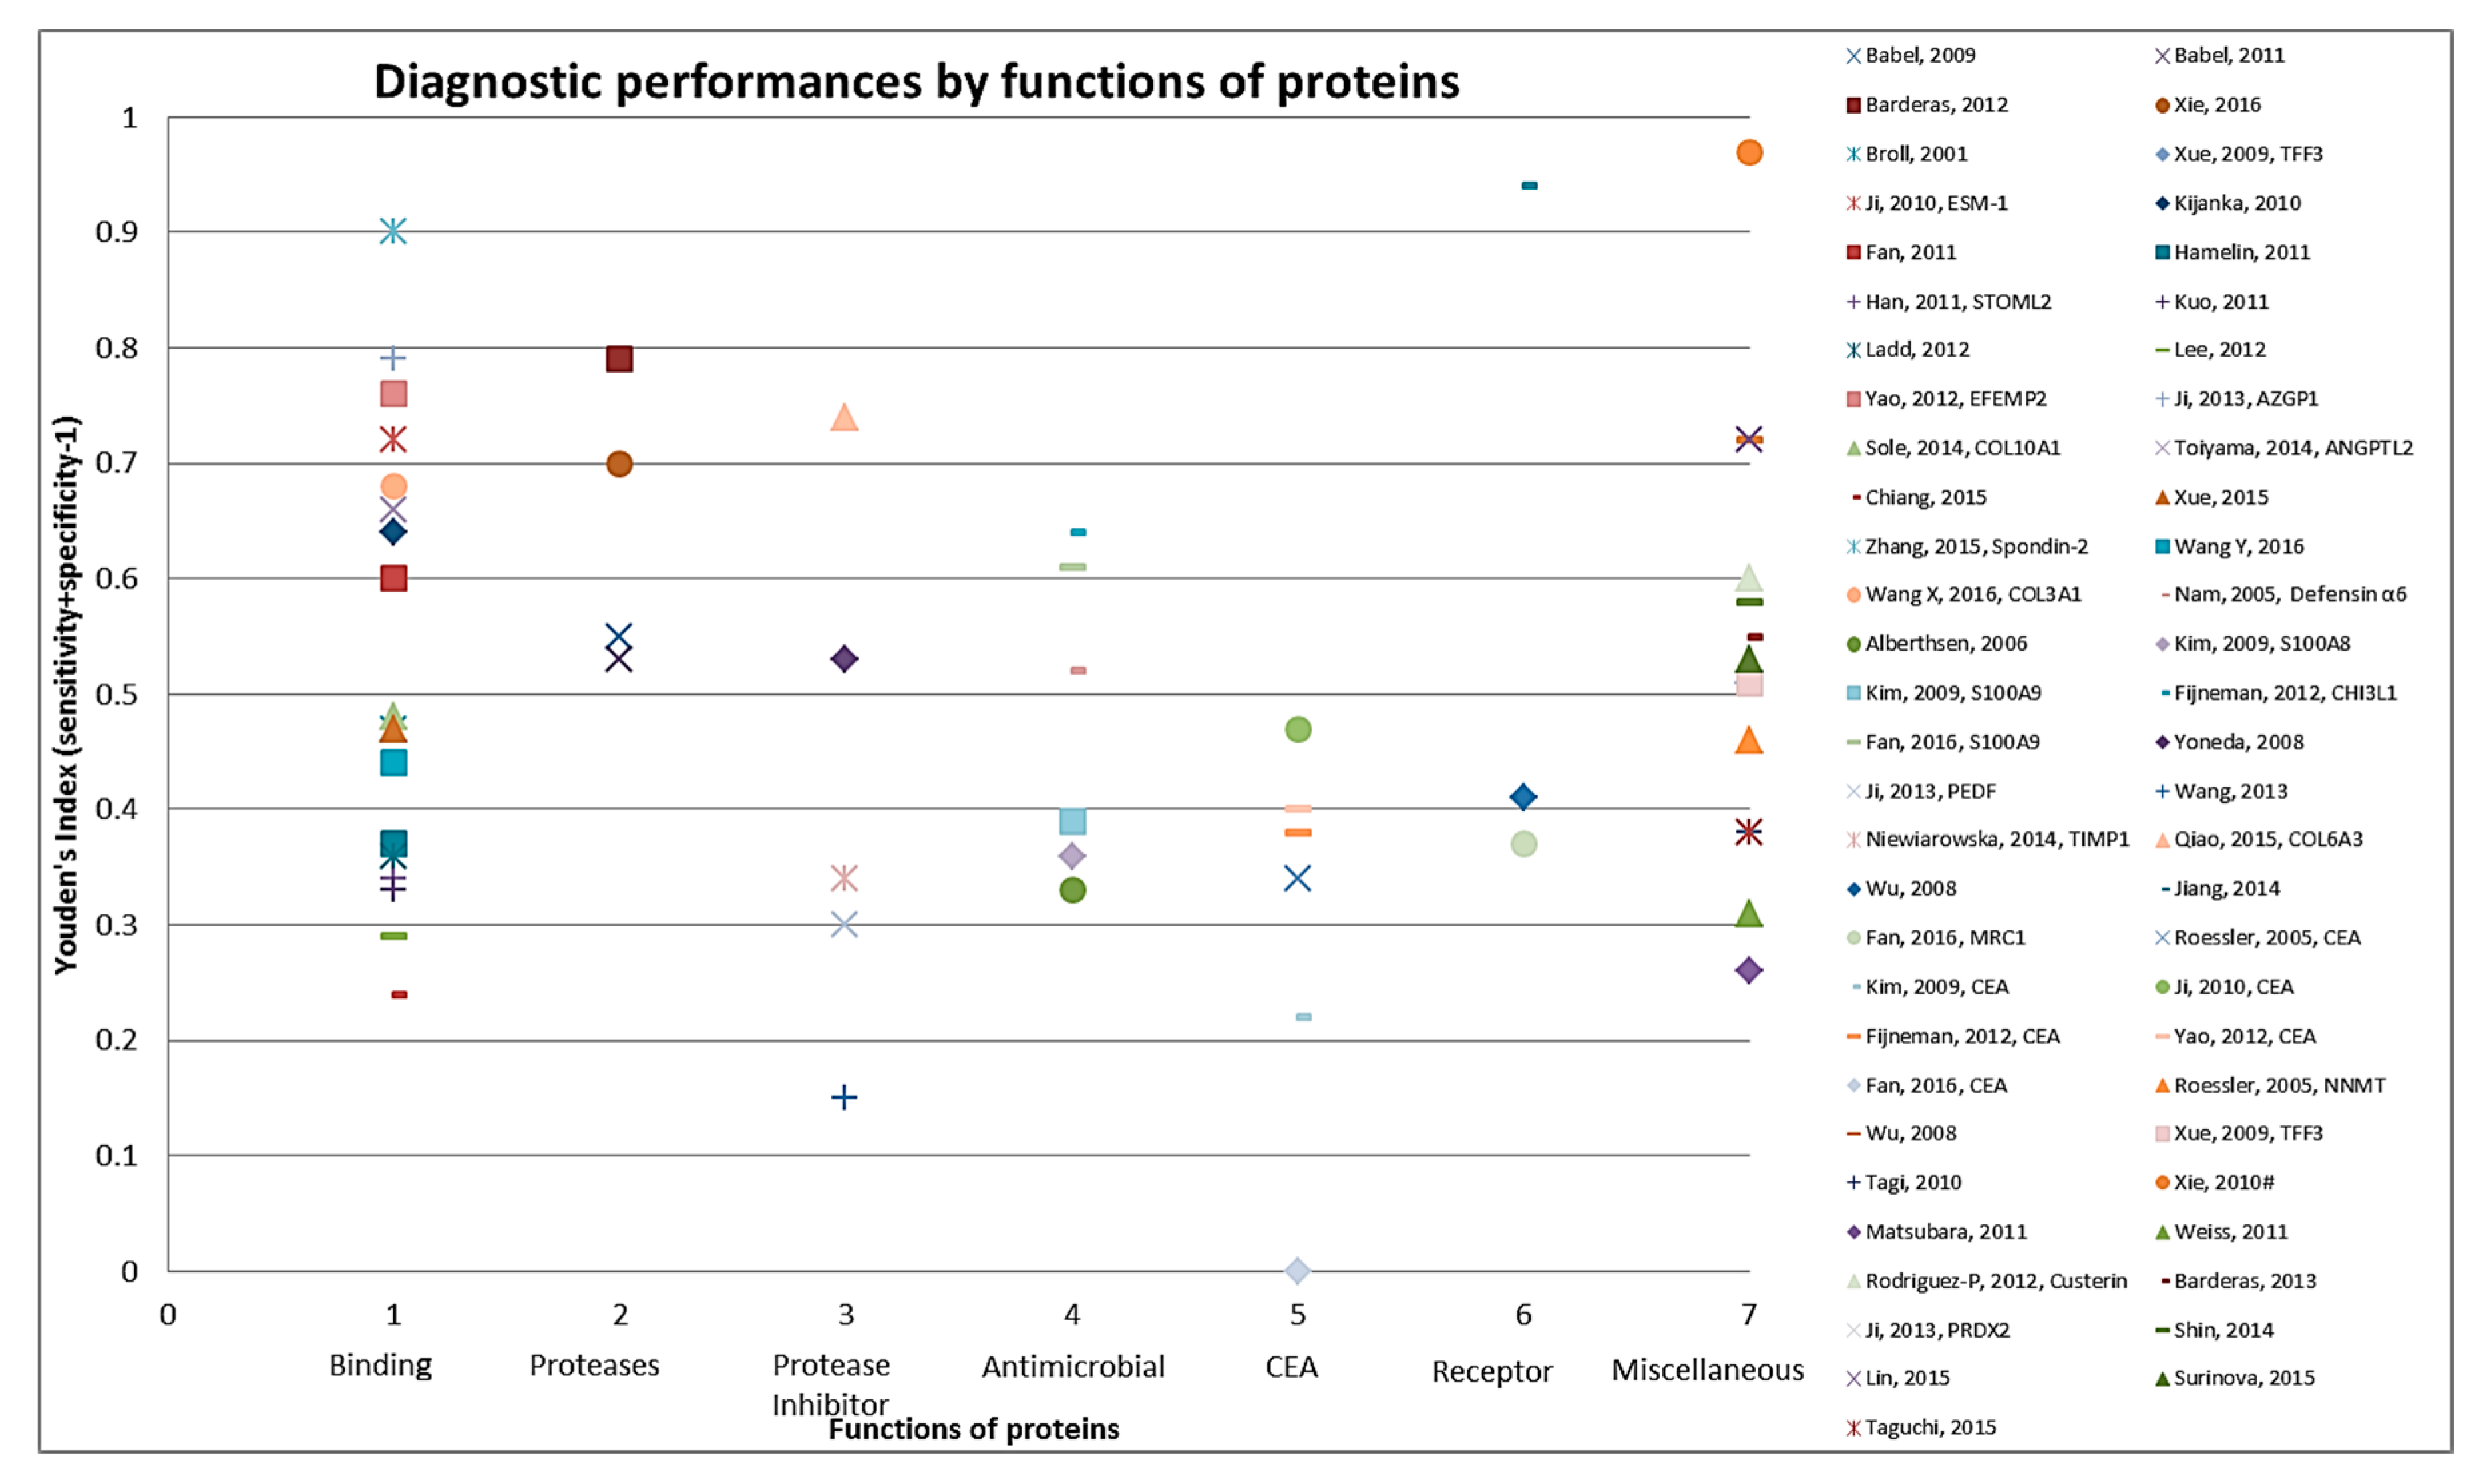
The 83 identified protein biomarker candidates identified from the cell line secretome and tumor tissue proteome represent different classes of proteins. Apart from CEA (identified in 24 studies), only few proteins have been identified in more than one study (CEA in 24 studies, CA 19-9 in four studies, S100A9 and LRG1 in three studies each and ACVR2B, AZGP1, GDF15, MAPKAPK3, PIM1 in two studies each). Supplementary Materials Table S3 provides information on the molecular and biological function and location with cellular component of the proteins as identified from the UniProt database [19]. Thirty-nine proteins function as binding (DNA-, RNA-, metal-ion- or ATP-) proteins, while eight are protease inhibitors, followed by seven each that function as antimicrobial. Overall, a large variety of biological functions were represented. For example, eleven proteins were found to be involved in apoptosis and in cell adhesion each, eight in inflammatory response and other six proteins in transcription. As shown in Figure 3 when diagnostic performances of proteins were represented by molecular function of these markers the best performances were seen for some of the binding (DNA-, RNA-, metal-ion- or ATP-) proteins and proteases, followed by protease inhibitors and antimicrobials.
Various and sometimes multiple methods were used for identification of proteins in cell line secretome of tumor tissue proteome (Table 1 and Table 2) and for validation of those markers in blood (Table 3 and Table 4). Immunohistochemistry (IHC) was used individually or in combination with other methods for identification of proteins in the cell line secretome or tumor tissue proteome in 24 different studies. Fifteen studies used a Mass spectrometry based platform and nine studies used various types of microarray (antibody/protein/phage/tissue/reverse phase) based platforms. For 39 out of 47 studies ELISA was used to validate biomarkers in blood.
3.5. Assessment of Risk of Bias across Biomarker Combination Studies
Results of our assessment for risk of bias and applicability using the QUADAS-2 tool are summarized in Supplementary Materials Table S4. In the QUADAS-2 assessment for four domains, no single study out of the 47 studies presented low risk of bias and low applicability concerns in all domains. Risk of bias was highest for the domain “Patient selection” with “High” risk for all of the studies except one [65]. This is because the blood sample from CRC cases was not collected in a true screening setting from asymptomatic participants in these studies. Risk of bias for “Index test” was “High” for more than half of the studies (N = 25) because a pre-specified cut-off was not used by these studies and no correction for overoptimism was performed. Risk of bias for Reference standard was also “High” for 26 studies since the reference standard was not clearly set for both CRC cases and controls in these studies. For nearly all studies it is unclear whether the results of the index test were interpreted without knowledge of results of the reference standard and if the samples were blinded before the execution of the index test or not. For none of the studies the time from storage to analysis was specified.
4. Discussion
In this review we present a comprehensive overview of studies that searched cell line secretome or tumor tissue proteome markers for early detection of colorectal cancer. We focused only on studies that validated the protein markers in blood. We summarize results of 47 studies which investigated 83 proteins. Overall sample size varied from 42 to 427 and was less than 100 in 18 studies, between 100 and 200 in 13 studies and more than 200 in 16 studies. The age of CRC patients ranged from 19 to 93 years and 17 to 93 years for controls. The majority of participants were male in 30 studies. Even though 36 out of 47 studies specified the stage wise distribution of cases, only thirteen out these specified stage wise diagnostic performance of the protein markers. Diagnostic performances reported for these markers were highly diverse ranging from sensitivity (at specificity) 22% (93%) to 100% (97%). In only one study [65] validation of the protein markers was performed in a true screening setting, where they showed rather limited diagnostic performance (41% sensitivity at 95% specificity and AUC = 0.724).
Twenty two most abundant proteins dominate 99% of total protein mass in plasma and the vast dynamic concentration range of these proteins makes quantitation of low abundant proteins difficult in blood [68]. There are around ten orders of magnitude in concentration between most abundant proteins in blood and tumor cell proteins [69]. However comparative analysis between tumor tissue proteome and adjacent normal mucosa can reveal potential candidates for diagnosis because certain secretary proteins are produced by various cell types of the same tissue [70]. As not all proteins altered in tumors are secreted in same concentrations in blood, identifying candidate proteins in the tumor tissue proteome or cell line secretome and subsequently validating them in blood with high sensitivity assays appears to be a rational and promising approach. Moreover tumors comprise of numerous neoplastic and non-neoplastic cells but isolating particular cells for candidate identification from the tumor tissue can be a daunting task especially due to often small size of biopsied tissue. In the current review several candidates were identified from this type of comparison and yielded diagnostic performances, which, if confirmed in yet to be conducted validation studies in true screening settings, might result into clinically applicable tests.
Commonly used substitutes for neoplastic tumor tissue are the immediately available numerous CRC cell lines representing various stages and histotypes of tumor. Cell lines can be easily manipulated and are well suited for isolation of secretome by fractionation which helps reduce the sample complexity and aids identification not only of abundant proteins but also proteins present in intermediate and low quantities. Secretome studies can minimize the biological, environmental or behavioral variability which makes results quantifiable and reproducible [71,72]. However, there are several technical difficulties associated with secretome analysis like its contamination by cell media or intra-cellular proteins and also the high dilution factor of proteins in cell culture media [71]. Nevertheless, in current review studies that used cell lines reported several candidates with apparently very promising diagnostic performance in case-control studies conducted in clinical settings. Again validation and potential confirmation in asymptomatic screening participants will be crucial to determine their potential use as screening markers.
A major concern in biomarker studies, especially in studies on signatures of multiple biomarkers in overfitting and the resulting overoptimism of derived measures of diagnostic performance. Application of internal and/or external validation is crucial to overcome such overestimation of diagnostic performance. In the current review 18 studies performed some form of correction for overoptimism out of which 11 used the split sample method, four and three studies used bootstrap and cross validation methods, respectively. However, external validation of these candidates on participants differing from setting, origin and time frame than the original population was not performed by any study. Since none of the markers were externally validated, validating seemingly promising candidate markers or marker algorithms in different study populations are warranted. In particular, validation in true screening settings, where the majority of cases are typically of early stages is indispensible for deriving valid estimates of expected diagnostic performance for screening purposes. Such validation studies should also take utmost care to avoid other potential common biases, such as clinical review and detection bias [73,74] for which blinding samples is most crucial, or it might result in bias resulting from potentially different handling, storage or preprocessing of blood samples from cases and controls should also be accounted for.
To our knowledge, this is the first systematic review summarizing the existing literature on CRC secretome and tumor proteome biomarkers validated in blood. In addition to diagnostic performances, particular attention was given to epidemiological aspects, precautions against possible biases and functional aspects of identified biomarkers. A number of limitations of our review have to be considered like despite comprehensive search in two well established databases and comprehensive cross referencing, we cannot exclude the possibility of having missed potentially relevant studies in particular if they were not reported in English or reported in the grey literature. Additionally, the differences in the functionality type and numbers of proteins, diversities in types of study populations and experimental techniques, differences in cell lines and in number of tumor tissue and in the blood collection or time to storage procedures or time to analysis and varied statistical evaluation procedures makes it impossible to make a direct balanced comparison or conduct meta-analysis of all the individual marker or marker signatures from 47 different studies. Also, correlations between identified secreted markers and mutation status of tumors cannot be established from the reviewed studies.
Despite its limitations, our systematic review illustrates the large potential of cell line secretome and tumor tissue derived protein biomarkers, in particular biomarker signatures consisting of multiple proteins, might have for blood based detection of CRC. Our review also demonstrates, however, that for most of the identified markers and signatures, in particular those with the apparently most promising diagnostic performance, rigorous validation in true screening settings is still required, paying particular attention to standardized pre-diagnostic collection, blinded processing and analysis among CRC cases and controls, which should be comparable in all aspects except the presence of CRC, as well as rigorous control for overoptimism by internal and/or external validation. Ideal settings for this purpose are studies among participants of screening colonoscopy, with blood samples taken prior to colonoscopy. Validation studies should also be sufficiently large in order to provide accuracy estimates with reasonable precision which is often a major challenge for screening colonoscopy studies due to the typically low prevalence of CRC cases in this setting. Our systematic review may help to select markers to be included in such validations, either individually or in combination (with combinations not necessarily restricted to the previously evaluated ones). If some of the apparently very promising diagnostic performance results for these markers can be successfully validated and confirmed in such settings they might become promising alternatives for non-invasive CRC screening. Additional factors to be considered in this context, in particular when compared with other screening options and preferably in the context of comprehensive modeling of screening effectiveness and cost-effectiveness, will be adherence to and costs of blood based tests.
Supplementary Materials
The following are available online at https://www.mdpi.com/2072-6694/9/11/156/s1. File S1: Data source and search strategy, Table S2: Stage specific diagnostic performance, Table S3: Function and location of proteins as identified from Uniprot database, Table S4: QUADAS-2 risk of bias assessment of the studies, Table S5: PRISMA 2009 checklist.
Acknowledgments
This study involved no specific funding.
Author Contributions
Hermann Brenner designed and supervised the study. Megha Bhardwaj drafted the manuscript, carried out the literature search, used R 3.3.2 for stated calculations and extracted specified information from UniProt database. Megha Bhardwaj and Vanessa Erben extracted the data from the eligible studies. Megha Bhardwaj, Vanessa Erben, Petra Schrotz-King and Hermann Brenner critically reviewed, contributed to and approved the final manuscript.
Conflicts of Interest
Research on colorectal cancer screening conducted at the German Cancer Institute has been or is currently being partly funded by industrial research grants from Epigenomics, Roche Diagnostics and Applied Proteomics. None of these funders had any role in design and conduct of the study, collection, management, analysis, and interpretation of the data, and preparation, review, or approval of the manuscript.
References
- Ferlay, J.; Soerjomataram, I.; Dikshit, R.; Eser, S.; Mathers, C.; Rebelo, M.; Parkin, D.M.; Forman, D.; Bray, F. Cancer incidence and mortality worldwide: Sources, methods and major patterns in Globoscan 2012. Int. J. Cancer 2015, 136, E359–E386. [Google Scholar] [CrossRef] [PubMed]
- Soerjomataram, I.; Lortet-Tieulent, J.; Parkin, D.M.; Ferlay, J.; Mathers, C.; Forman, D.; Bray, F. Global burden of cancer in 2008: A systematic analysis of disability-adjusted life-years in 12 world regions. Lancet 2012, 380, 1840–1850. [Google Scholar] [CrossRef]
- Arnold, M.; Sierra, M.S.; Laversanne, M.; Soerjomataram, I.; Jemal, A.; Bray, F. Global patterns and trends in colorectal cancer incidence and mortality. Gut 2017, 66, 683–691. [Google Scholar] [CrossRef] [PubMed]
- Brenner, H.; Stock, C.; Hoffmeister, M. Effect of screening sigmoidoscopy and screening colonoscopy on colorectal cancer incidence and mortality: Systematic review and meta-analysis of randomised controlled trials and observational studies. BMJ 2014, 348, g2467. [Google Scholar] [CrossRef] [PubMed]
- Zauber, A.G. The impact of screening on colorectal cancer mortality and incidence: Has it really made a difference? Dig. Dis. Sci. 2015, 60, 681–691. [Google Scholar] [CrossRef] [PubMed]
- Lansdorp-Vogelaar, I.; Knudsen, A.B.; Brenner, H. Cost-effectiveness of colorectal cancer screening. Epidemiol. Rev. 2011, 33, 88–100. [Google Scholar] [CrossRef] [PubMed]
- Hassan, C.; Giorgi Rossi, P.; Camilloni, L.; Rex, D.K.; Jimenez-Cendales, B.; Ferroni, E.; Borgia, P.; Zullo, A.; Guasticchi, G.; Group, H.T.A. Meta-analysis: Adherence to colorectal cancer screening and the detection rate for advanced neoplasia, according to the type of screening test. Aliment. Pharmacol. Ther. 2012, 36, 929–940. [Google Scholar] [CrossRef] [PubMed]
- Song, L.L.; Li, Y.M. Current noninvasive tests for colorectal cancer screening: An overview of colorectal cancer screening tests. World J. Gastrointest. Oncol. 2016, 8, 793–800. [Google Scholar] [CrossRef] [PubMed]
- Adler, A.; Geiger, S.; Keil, A.; Bias, H.; Schatz, P.; deVos, T.; Dhein, J.; Zimmermann, M.; Tauber, R.; Wiedenmann, B. Improving compliance to colorectal cancer screening using blood and stool based tests in patients refusing screening colonoscopy in germany. BMC Gastroenterol. 2014, 14, 183. [Google Scholar] [CrossRef] [PubMed]
- Robertson, D.J.; Lee, J.K.; Boland, C.R.; Dominitz, J.A.; Giardiello, F.M.; Johnson, D.A.; Kaltenbach, T.; Lieberman, D.; Levin, T.R.; Rex, D.K. Recommendations on fecal immunochemical testing to screen for colorectal neoplasia: A consensus statement by the us multi-society task force on colorectal cancer. Gastroenterology 2017, 152, 1217–1237.e1213. [Google Scholar] [CrossRef] [PubMed]
- Stracci, F.; Zorzi, M.; Grazzini, G. Colorectal cancer screening: Tests, strategies, and perspectives. Front. Public Health 2014, 2, 210. [Google Scholar] [CrossRef] [PubMed]
- Gonzalez-Pons, M.; Cruz-Correa, M. Colorectal cancer biomarkers: Where are we now? BioMed Res. Int. 2015, 2015, 149014. [Google Scholar] [CrossRef] [PubMed]
- Mroczko, B.; Groblewska, M.; Wereszczynska-Siemiatkowska, U.; Kedra, B.; Konopko, M.; Szmitkowski, M. The diagnostic value of G-CSF measurement in the sera of colorectal cancer and adenoma patients. Clin. Chim. Acta Int. J. Clin. Chem. 2006, 371, 143–147. [Google Scholar] [CrossRef] [PubMed]
- Zhang, S.-Y.; Lin, M.; Zhang, H.-B. Diagnostic value of carcinoembryonic antigen and carcinoma antigen 19-9 for colorectal carcinoma. Int. J. Clin. Exp. Pathol. 2015, 8, 9404–9409. [Google Scholar] [PubMed]
- Schaaij-Visser, T.B.; de Wit, M.; Lam, S.W.; Jimenez, C.R. The cancer secretome, current status and opportunities in the lung, breast and colorectal cancer context. Biochim. Biophys. Acta 2013, 1834, 2242–2258. [Google Scholar] [CrossRef] [PubMed]
- De Wit, M.; Kant, H.; Piersma, S.R.; Pham, T.V.; Mongera, S.; van Berkel, M.P.; Boven, E.; Ponten, F.; Meijer, G.A.; Jimenez, C.R.; et al. Colorectal cancer candidate biomarkers identified by tissue secretome proteome profiling. J. Proteom. 2014, 99, 26–39. [Google Scholar] [CrossRef] [PubMed]
- Liberati, A.; Altman, D.G.; Tetzlaff, J.; Mulrow, C.; Gøtzsche, P.C.; Ioannidis, J.P.A.; Clarke, M.; Devereaux, P.J.; Kleijnen, J.; Moher, D. The prisma statement for reporting systematic reviews and meta-analyses of studies that evaluate healthcare interventions: Explanation and elaboration. BMJ 2009, 339, b2077. [Google Scholar] [CrossRef] [PubMed]
- Whiting, P.F.; Rutjes, A.W.; Westwood, M.E.; Mallett, S.; Deeks, J.J.; Reitsma, J.B.; Leeflang, M.M.; Sterne, J.A.; Bossuyt, P.M. QUADAS-2: A revised tool for the quality assessment of diagnostic accuracy studies. Ann. Intern. Med. 2011, 155, 529–536. [Google Scholar] [CrossRef] [PubMed]
- The UniProt Consortium. Uniprot: The universal protein knowledgebase. Nucleic Acids Res. 2017, 45, D158–D169. [Google Scholar]
- Moher, D.; Liberati, A.; Tetzlaff, J.; Altman, D.G. Preferred reporting items for systematic reviews and meta-analyses: The prisma statement. Ann. Intern. Med. 2009, 151, 264–269. [Google Scholar] [CrossRef] [PubMed]
- Han, C.L.; Chen, J.S.; Chan, E.C.; Wu, C.P.; Yu, K.H.; Chen, K.T.; Tsou, C.C.; Tsai, C.F.; Chien, C.W.; Kuo, Y.B.; et al. An informatics-assisted label-free approach for personalized tissue membrane proteomics: Case study on colorectal cancer. Mol. Cell. Proteom. MCP 2011, 10, M110.003087. [Google Scholar] [CrossRef] [PubMed]
- Ji, D.; Li, M.; Zhan, T.; Yao, Y.; Shen, J.; Tian, H.; Zhang, Z.; Gu, J. Prognostic role of serum AZGP1, PEDF and PRDX2 in colorectal cancer patients. Carcinogenesis 2013, 34, 1265–1272. [Google Scholar] [CrossRef] [PubMed]
- Jiang, Y.; Zhang, C.; Chen, K.; Chen, Z.; Sun, Z.; Zhang, Z.; Ding, D.; Ren, S.; Zuo, Y. The clinical significance of DC-SIGN and DC-SIGNR, which are novel markers expressed in human colon cancer. PLoS ONE 2014, 9, e114748. [Google Scholar] [CrossRef] [PubMed]
- Qiao, J.; Fang, C.Y.; Chen, S.X.; Wang, X.Q.; Cui, S.J.; Liu, X.H.; Jiang, Y.H.; Wang, J.; Zhang, Y.; Yang, P.Y.; et al. Stroma derived COL6A3 is a potential prognosis marker of colorectal carcinoma revealed by quantitative proteomics. Oncotarget 2015, 6, 29929–29946. [Google Scholar] [CrossRef] [PubMed]
- Wang, J.; Wang, X.; Lin, S.; Chen, C.; Wang, C.; Ma, Q.; Jiang, B. Identification of kininogen-1 as a serum biomarker for the early detection of advanced colorectal adenoma and colorectal cancer. PLoS ONE 2013, 8, e70519. [Google Scholar] [CrossRef] [PubMed]
- Wang, X.Q.; Tang, Z.X.; Yu, D.; Cui, S.J.; Jiang, Y.H.; Zhang, Q.; Wang, J.; Yang, P.Y.; Liu, F. Epithelial but not stromal expression of collagen alpha-1(III) is a diagnostic and prognostic indicator of colorectal carcinoma. Oncotarget 2016, 7, 8823–8838. [Google Scholar] [CrossRef] [PubMed]
- Xie, L.Q.; Zhao, C.; Cai, S.J.; Xu, Y.; Huang, L.Y.; Bian, J.S.; Shen, C.P.; Lu, H.J.; Yang, P.Y. Novel proteomic strategy reveal combined α1 antitrypsin and cathepsin D as biomarkers for colorectal cancer early screening. J. Proteome Res. 2010, 9, 4701–4709. [Google Scholar] [CrossRef] [PubMed]
- Xue, H.; Lu, B.; Zhang, J.; Wu, M.; Huang, Q.; Wu, Q.; Sheng, H.; Wu, D.; Hu, J.; Lai, M. Identification of serum biomarkers for colorectal cancer metastasis using a differential secretome approach. J. Proteome Res. 2010, 9, 545–555. [Google Scholar] [CrossRef] [PubMed]
- Xue, Y.; Yu, F.; Yan, D.; Cui, F.; Tang, H.; Wang, X.; Chen, J.; Lu, H.; Zhao, S.; Peng, Z. Zinc-α-2-glycoprotein: A candidate biomarker for colon cancer diagnosis in Chinese population. Int. J. Mol. Sci. 2014, 16, 691–703. [Google Scholar] [CrossRef] [PubMed]
- Yao, L.; Lao, W.F.; Zhang, Y.; Tang, X.R.; Hu, X.T.; He, C.; Hu, X.F.; Xu, L.S.X. Identification of EFEMP2 as a serum biomarker for the early detection of colorectal cancer with lectin affinity capture assisted secretome analysis of cultured fresh tissues. J. Proteome Res. 2012, 11, 3281–3294. [Google Scholar] [CrossRef] [PubMed]
- Fan, N.J.; Chen, H.M.; Song, W.; Zhang, Z.Y.; Zhang, M.D.; Feng, L.Y.; Gao, C.F. Macrophage mannose receptor 1 and S100A9 were identified as serum diagnostic biomarkers for colorectal cancer through a label-free quantitative proteomic analysis. Cancer Biomark. 2016, 16, 235–243. [Google Scholar] [CrossRef] [PubMed]
- Wang, Y.; Shan, Q.; Hou, G.; Zhang, J.; Bai, J.; Lv, X.; Xie, Y.; Zhu, H.; Su, S.; Li, Y.; et al. Discovery of potential colorectal cancer serum biomarkers through quantitative proteomics on the colonic tissue interstitial fluids from the AOM-DSS mouse model. J. Proteom. 2016, 132, 31–40. [Google Scholar] [CrossRef] [PubMed]
- Zhang, Q.; Wang, X.Q.; Wang, J.; Cui, S.J.; Lou, X.M.; Yan, B.; Qiao, J.; Jiang, Y.H.; Zhang, L.J.; Yang, P.Y.; et al. Upregulation of spondin-2 predicts poor survival of colorectal carcinoma patients. Oncotarget 2015, 6, 15095–15110. [Google Scholar] [CrossRef] [PubMed]
- Xie, Y.Y.; Chen, L.H.; Lv, X.L.; Hou, G.X.; Wang, Y.; Jiang, C.C.; Zhu, H.X.; Xu, N.Z.; Wu, L.; Lou, X.M.; et al. The levels of serine proteases in colon tissue interstitial fluid and serum serve as an indicator of colorectal cancer progression. Oncotarget 2016, 7, 32592–32606. [Google Scholar] [CrossRef] [PubMed]
- Wu, C.C.; Chen, H.C.; Chen, S.J.; Liu, H.P.; Hsieh, Y.Y.; Yu, C.J.; Tang, R.; Hsieh, L.L.; Yu, J.S.; Chang, Y.S. Identification of collapsin response mediator protein-2 as a potential marker of colorectal carcinoma by comparative analysis of cancer cell secretomes. Proteomics 2008, 8, 316–332. [Google Scholar] [CrossRef] [PubMed]
- Wu, C.C.; Huang, Y.S.; Lee, L.Y.; Liang, Y.; Tang, R.P.; Chang, Y.S.; Hsieh, L.L.; Yu, J.S. Overexpression and elevated plasma level of tumor-associated antigen 90 K/Mac-2 binding protein in colorectal carcinoma. Proteom. Clin. Appl. 2008, 2, 1586–1595. [Google Scholar] [CrossRef] [PubMed]
- Chiang, S.F.; Kan, C.Y.; Hsiao, Y.C.; Tang, R.; Hsieh, L.L.; Chiang, J.M.; Tsai, W.S.; Yeh, C.Y.; Hsieh, P.S.; Liang, Y.; et al. Bone marrow stromal antigen 2 is a novel plasma biomarker and prognosticator for colorectal carcinoma: A secretome-based verification study. Dis. Mark. 2015, 2015, 874054. [Google Scholar] [CrossRef] [PubMed]
- Fan, C.W.; Chan, C.C.; Chen, K.T.; Twu, J.; Huang, Y.S.; Han, C.L.; Chen, Y.J.; Yu, J.S.; Chang, Y.S.; Kuo, Y.B.; et al. Identification of SEC61β and its autoantibody as biomarkers for colorectal cancer. Clin. Chim. Acta Int. J. Clin. Chem. 2011, 412, 887–893. [Google Scholar] [CrossRef] [PubMed]
- Kuo, Y.B.; Chan, C.C.; Chang, C.A.; Fan, C.W.; Hung, R.P.; Hung, Y.S.; Chen, K.T.; Yu, J.S.; Chang, Y.S.; Chan, E.C. Identification of phospholipid scramblase 1 as a biomarker and determination of its prognostic value for colorectal cancer. Mol. Med. 2011, 17, 41–47. [Google Scholar] [CrossRef] [PubMed]
- Tagi, T.; Matsui, T.; Kikuchi, S.; Hoshi, S.; Ochiai, T.; Kokuba, Y.; Kinoshita-Ida, Y.; Kisumi-Hayashi, F.; Morimoto, K.; Imai, T.; et al. Dermokine as a novel biomarker for early-stage colorectal cancer. J. Gastroenterol. 2010, 45, 1201–1211. [Google Scholar] [CrossRef] [PubMed]
- Yoneda, K.; Iida, H.; Endo, H.; Hosono, K.; Akiyama, T.; Takahashi, H.; Inamori, M.; Abe, Y.; Yoneda, M.; Fujita, K.; et al. Identification of Cystatin SN as a novel tumor marker for colorectal cancer. Int. J. Oncol. 2009, 35, 33–40. [Google Scholar] [PubMed]
- Matsubara, J.; Honda, K.; Ono, M.; Sekine, S.; Tanaka, Y.; Kobayashi, M.; Jung, G.M.; Sakuma, T.; Nakamori, S.; Sata, N.; et al. Identification of adipophilin as a potential plasma biomarker for colorectal cancer using label-free quantitative mass spectrometry and protein microarray. Cancer Epidemiol. Biomark. Prev. 2011, 20, 2195–2203. [Google Scholar] [CrossRef] [PubMed] [Green Version]
- Toiyama, Y.; Tanaka, K.; Kitajima, T.; Shimura, T.; Kawamura, M.; Kawamoto, A.; Okugawa, Y.; Saigusa, S.; Hiro, J.; Inoue, Y.; et al. Elevated serum angiopoietin-like protein 2 correlates with the metastatic properties of colorectal cancer: A serum biomarker for early diagnosis and recurrence. Clin. Cancer Res. 2014, 20, 6175–6186. [Google Scholar] [CrossRef] [PubMed]
- Hosono, K.; Yamada, E.; Endo, H.; Takahashi, H.; Inamori, M.; Hippo, Y.; Nakagama, H.; Nakajima, A. Increased tumor necrosis factor receptor 1 expression in human colorectal adenomas. World J. Gastroenterol. 2012, 18, 5360–5368. [Google Scholar] [CrossRef] [PubMed]
- Ji, N.Y.; Kim, Y.H.; Jang, Y.J.; Kang, Y.H.; Lee, C.I.; Kim, J.W.; Yeom, Y.I.; Chun, H.K.; Choi, Y.H.; Kim, J.H.; et al. Identification of endothelial cell-specific molecule-1 as a potential serum marker for colorectal cancer. Cancer Sci. 2010, 101, 2248–2253. [Google Scholar] [PubMed]
- Shin, J.; Kim, H.J.; Kim, G.; Song, M.; Woo, S.J.; Lee, S.T.; Kim, H.; Lee, C. Discovery of melanotransferrin as a serological marker of colorectal cancer by secretome analysis and quantitative proteomics. J. Proteome Res. 2014, 13, 4919–4931. [Google Scholar] [CrossRef] [PubMed]
- Kim, H.J.; Kang, H.J.; Lee, H.; Lee, S.T.; Yu, M.H.; Kim, H.; Lee, C. Identification of S100A8 and S100A9 as serological markers for colorectal cancer. J. Proteome Res. 2009, 8, 1368–1379. [Google Scholar] [CrossRef] [PubMed]
- Lee, H.; Song, M.; Shin, N.; Shin, C.H.; Min, B.S.; Kim, H.S.; Yoo, J.S.; Kim, H. Diagnostic significance of serum HMGB1 in colorectal carcinomas. PLoS ONE 2012, 7, e34318. [Google Scholar]
- Lin, Q.; Lim, H.S.; Lin, H.L.; Tan, H.T.; Lim, T.K.; Cheong, W.K.; Cheah, P.Y.; Tang, C.L.; Chow, P.K.; Chung, M.C. Analysis of colorectal cancer glyco-secretome identifies laminin β-1 (LAMB1) as a potential serological biomarker for colorectal cancer. Proteomics 2015, 15, 3905–3920. [Google Scholar] [PubMed]
- Babel, I.; Barderas, R.; Diaz-Uriarte, R.; Martinez-Torrecuadrada, J.L.; Sanchez-Carbayo, M.; Casal, J.I. Identification of tumor-associated autoantigens for the diagnosis of colorectal cancer in serum using high density protein microarrays. Mol. Cell. Proteom. MCP 2009, 8, 2382–2395. [Google Scholar]
- Babel, I.; Barderas, R.; Diaz-Uriarte, R.; Moreno, V.; Suarez, A.; Fernandez-Acenero, M.J.; Salazar, R.; Capella, G.; Casal, J.I. Identification of MST1/STK4 and SULF1 proteins as autoantibody targets for the diagnosis of colorectal cancer by using phage microarrays. Mol. Cell. Proteom. MCP 2011, 10, M110.001784. [Google Scholar]
- Barderas, R.; Babel, I.; Diaz-Uriarte, R.; Moreno, V.; Suarez, A.; Bonilla, F.; Villar-Vazquez, R.; Capella, G.; Casal, J.I. An optimized predictor panel for colorectal cancer diagnosis based on the combination of tumor-associated antigens obtained from protein and phage microarrays. J. Proteom. 2012, 75, 4647–4655. [Google Scholar] [Green Version]
- Barderas, R.; Mendes, M.; Torres, S.; Bartolome, R.A.; Lopez-Lucendo, M.; Villar-Vazquez, R.; Pelaez-Garcia, A.; Fuente, E.; Bonilla, F.; Casal, J.I. In-depth characterization of the secretome of colorectal cancer metastatic cells identifies key proteins in cell adhesion, migration, and invasion. Mol. Cell. Proteom. MCP 2013, 12, 1602–1620. [Google Scholar]
- Rodriguez-Pineiro, A.M.; Garcia-Lorenzo, A.; Blanco-Prieto, S.; Alvarez-Chaver, P.; Rodriguez-Berrocal, F.J.; Cadena, M.P.; Martinez-Zorzano, V.S. Secreted clusterin in colon tumor cell models and its potential as diagnostic marker for colorectal cancer. Cancer Investig. 2012, 30, 72–78. [Google Scholar]
- Sole, X.; Crous-Bou, M.; Cordero, D.; Olivares, D.; Guino, E.; Sanz-Pamplona, R.; Rodriguez-Moranta, F.; Sanjuan, X.; de Oca, J.; Salazar, R.; et al. Discovery and validation of new potential biomarkers for early detection of colon cancer. PLoS ONE 2014, 9, e106748. [Google Scholar]
- Broll, R.; Duchrow, M.; Oevermann, E.; Wellm, C.; Schwandner, O.; Schimmelpenning, H.; Roblick, U.J.; Bruch, H.P.; Windhovel, U. P53 autoantibodies in sera of patients with a colorectal cancer and their association to p53 protein concentration and p53 immunohistochemistry in tumor tissue. Int. J. Colorectal Dis. 2001, 16, 22–27. [Google Scholar] [PubMed]
- Roessler, M.; Rollinger, W.; Palme, S.; Hagmann, M.L.; Berndt, P.; Engel, A.M.; Schneidinger, B.; Pfeffer, M.; Andres, H.; Karl, J.; et al. Identification of nicotinamide N-methyltransferase as a novel serum tumor marker for colorectal cancer. Clin. Cancer Res. 2005, 11, 6550–6557. [Google Scholar]
- Surinova, S.; Choi, M.; Tao, S.; Schuffler, P.J.; Chang, C.Y.; Clough, T.; Vyslouzil, K.; Khoylou, M.; Srovnal, J.; Liu, Y.; et al. Prediction of colorectal cancer diagnosis based on circulating plasma proteins. EMBO Mol. Med. 2015, 7, 1166–1178. [Google Scholar] [PubMed]
- Weiss, J.V.; Klein-Scory, S.; Kubler, S.; Reinacher-Schick, A.; Stricker, I.; Schmiegel, W.; Schwarte-Waldhoff, I. Soluble E-cadherin as a serum biomarker candidate: Elevated levels in patients with late-stage colorectal carcinoma and FAP. Int. J. Cancer 2011, 128, 1384–1392. [Google Scholar] [PubMed]
- Albrethsen, J.; Moller, C.H.; Olsen, J.; Raskov, H.; Gammeltoft, S. Human neutrophil peptides 1, 2 and 3 are biochemical markers for metastatic colorectal cancer. Eur. J. Cancer 2006, 42, 3057–3064. [Google Scholar] [PubMed]
- Hamelin, C.; Cornut, E.; Poirier, F.; Pons, S.; Beaulieu, C.; Charrier, J.P.; Haidous, H.; Cotte, E.; Lambert, C.; Piard, F.; et al. Identification and verification of heat shock protein 60 as a potential serum marker for colorectal cancer. FEBS J. 2011, 278, 4845–4859. [Google Scholar] [PubMed]
- Kijanka, G.; Hector, S.; Kay, E.W.; Murray, F.; Cummins, R.; Murphy, D.; MacCraith, B.D.; Prehn, J.H.; Kenny, D. Human IgG antibody profiles differentiate between symptomatic patients with and without colorectal cancer. Gut 2010, 59, 69–78. [Google Scholar] [PubMed]
- Fijneman, R.J.; de Wit, M.; Pourghiasian, M.; Piersma, S.R.; Pham, T.V.; Warmoes, M.O.; Lavaei, M.; Piso, C.; Smit, F.; Delis-van Diemen, P.M.; et al. Proximal fluid proteome profiling of mouse colon tumors reveals biomarkers for early diagnosis of human colorectal cancer. Clin. Cancer Res. 2012, 18, 2613–2624. [Google Scholar]
- Niewiarowska, K.; Pryczynicz, A.; Dymicka-Piekarska, V.; Gryko, M.; Cepowicz, D.; Famulski, W.; Kemona, A.; Guzinska-Ustymowicz, K. Diagnostic significance of TIMP-1 level in serum and its immunohistochemical expression in colorectal cancer patients. Pol. J. Pathol. 2014, 65, 296–304. [Google Scholar] [PubMed]
- Ladd, J.J.; Busald, T.; Johnson, M.M.; Zhang, Q.; Pitteri, S.J.; Wang, H.; Brenner, D.E.; Lampe, P.D.; Kucherlapati, R.; Feng, Z.; et al. Increased plasma levels of the APC-interacting protein MAPRE1, LRG1, and IGFBP2 preceding a diagnosis of colorectal cancer in women. Cancer Prev. Res. 2012, 5, 655–664. [Google Scholar]
- Nam, M.J.; Kee, M.K.; Kuick, R.; Hanash, S.M. Identification of defensin α6 as a potential biomarker in colon adenocarcinoma. J. Biol. Chem. 2005, 280, 8260–8265. [Google Scholar] [PubMed]
- Taguchi, A.; Rho, J.H.; Yan, Q.; Zhang, Y.; Zhao, Y.; Xu, H.; Tripathi, S.C.; Wang, H.; Brenner, D.E.; Kucherlapati, M.; et al. Mapre1 as a plasma biomarker for early-stage colorectal cancer and adenomas. Cancer Prev. Res. 2015, 8, 1112–1119. [Google Scholar]
- Prieto, D.A.; Johann, D.J.; Wei, B.-R.; Ye, X.; Chan, K.C.; Nissley, D.V.; Simpson, R.M.; Citrin, D.E.; Mackall, C.L.; Linehan, W.M.; et al. Mass spectrometry in cancer biomarker research: A case for immunodepletion of abundant blood-derived proteins from clinical tissue specimens. Biomark. Med. 2014, 8, 269–286. [Google Scholar] [PubMed]
- Anderson, N.L.; Anderson, N.G. The human plasma proteome: History, character, and diagnostic prospects. Mol. Cell. Proteom. MCP 2002, 1, 845–867. [Google Scholar]
- Alvarez-Llamas, G.; Szalowska, E.; de Vries, M.P.; Weening, D.; Landman, K.; Hoek, A.; Wolffenbuttel, B.H.; Roelofsen, H.; Vonk, R.J. Characterization of the human visceral adipose tissue secretome. Mol. Cell. Proteom. MCP 2007, 6, 589–600. [Google Scholar]
- Makridakis, M.; Vlahou, A. Secretome proteomics for discovery of cancer biomarkers. J. Proteom. 2010, 73, 2291–2305. [Google Scholar]
- Pavlou, M.P.; Diamandis, E.P. The cancer cell secretome: A good source for discovering biomarkers? J. Proteom. 2010, 73, 1896–1906. [Google Scholar]
- Viswanathan, M.; Ansari, M.T.; Berkman, N.D.; Chang, S.; Hartling, L.; McPheeters, M.; Santaguida, P.L.; Shamliyan, T.; Singh, K.; Tsertsvadze, A.; et al. Assessing the risk of bias of individual studies in systematic reviews of health care interventions. In Methods Guide for Effectiveness and Comparative Effectiveness Reviews; Agency for Healthcare Research and Quality: Rockville, MD, USA, 2012. [Google Scholar]
- Whiting, P.; Rutjes, A.W.; Reitsma, J.B.; Glas, A.S.; Bossuyt, P.M.; Kleijnen, J. Sources of variation and bias in studies of diagnostic accuracy: A systematic review. Ann. Intern. Med. 2004, 140, 189–202. [Google Scholar] [PubMed]
Figure 1.
Preferred reporting items for systematic reviews and meta-analysis (PRISMA) Flow diagram for literature search process for records identified via PubMed and Web of Science database [20]. Abbreviations: TIF: tissue interstitial fluid; CRC: colorectal cancer.
Figure 1.
Preferred reporting items for systematic reviews and meta-analysis (PRISMA) Flow diagram for literature search process for records identified via PubMed and Web of Science database [20]. Abbreviations: TIF: tissue interstitial fluid; CRC: colorectal cancer.

Figure 2.
Graphical representation of diagnostic performance of protein markers with respect to internal validation performed by the studies.
Figure 2.
Graphical representation of diagnostic performance of protein markers with respect to internal validation performed by the studies.
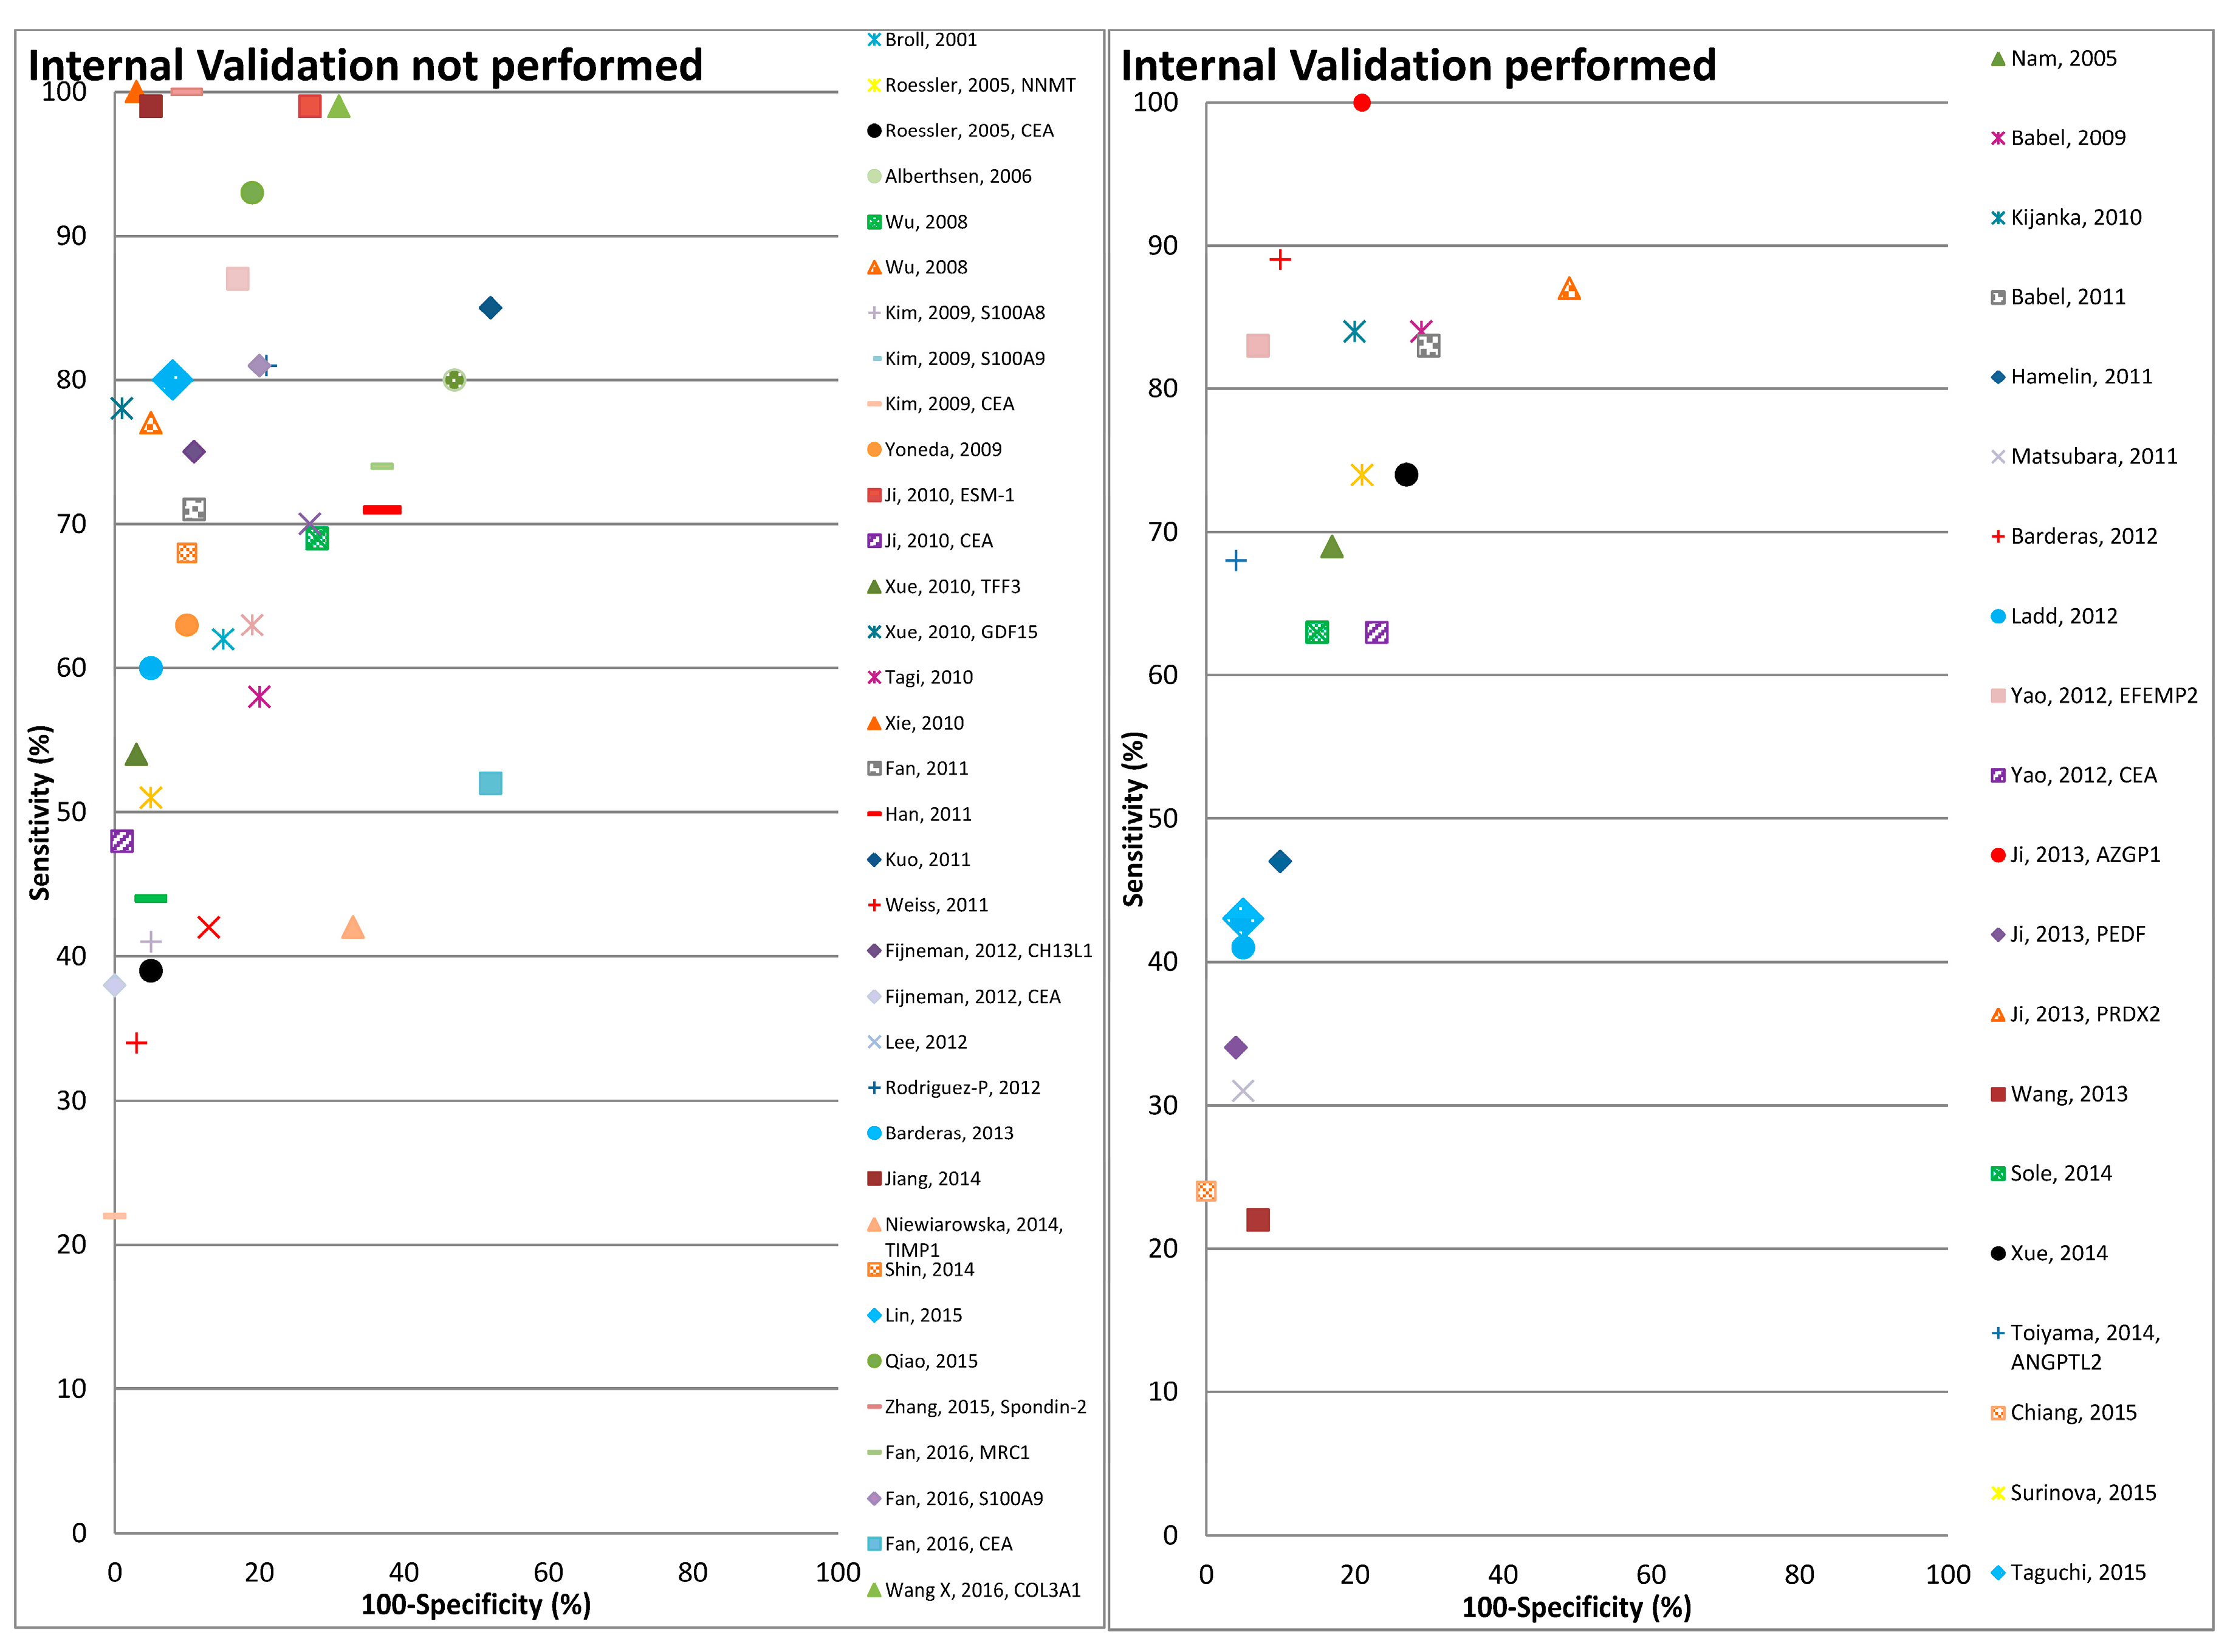
Figure 3.
Graphical representation of diagnostic performance of protein markers with respect to molecular function of these protein markers.
Figure 3.
Graphical representation of diagnostic performance of protein markers with respect to molecular function of these protein markers.


Table 1.
Study characteristics of the cell line secretome studies.
| First Author, Year, Country [Ref] | Platform | Cell Lines Used | Study Sample (Tissue) | Study Samples (Blood) | |||||||||||||
|---|---|---|---|---|---|---|---|---|---|---|---|---|---|---|---|---|---|
| SW480 | SW620 | HCT-116 | Colo205 | Caco-2 | HT-29 | LoVo | SW48 | HCT-15 | Colo320 | Others | Sample Size(N) CRC Cn | % Late Stage (III/IV) CRC | Mean Age (Range/±SD) CRC Cn | % Males CRC Cn | |||
| Combination Marker Studies | |||||||||||||||||
| Wu, 2008, Taiwan [35] | MALDI, SDS | x | x | - | 169 paired CRC & NC | 201 201 | 50 | 63.5 (24–88) (24–84) | 52 55 | ||||||||
| Wu, 2008, Taiwan [36] | MALDI, IHC | x | x | x | 1 | 241 CRC & 231 NM | 280 147 | 60 | 60.1 (19–88) (24–84) | 50 55 | |||||||
| Babel, 2009, Spain [50] | PrMA, IHC | x | x | x | x | x | 3 | 45 paired CRC & NM | 52 42 | 62 | 71 (±10.6) 61.7 (±16.0) | 62 60 | |||||
| Tagi, 2010, Japan [40] | qRT-PCR, IHC | x | x | x | x | x | x | x | x | 7 | 130 CRC | 105 100 | 44 | 39.2 (23–59) 66.8 (26–93) | - | ||
| Babel, 2011, Spain [51] | PhMA, IHC | x | x | x | x | x | x | x | x | 8 | 25 paired CRC & NM | 50 46 | 66 | 70.8 (41–91) 59.6 (34–89) | 66 63 | ||
| Fan, 2011, Taiwan [38] | qRT-PCR, WB, IHC | x | x | x | - | 10 CRC &NC/64 CRC | 86 72 | 59 | - | - | |||||||
| Weiss, 2011, Germany [59] | SDS, IHC | x | 4 | 4 paired CRC & NM | 59 45 | 75 | (37–87) (17–87) | 75 49 | |||||||||
| Barderas, 2012, Spain [52] | PhMA, WB | x | x | x | x | x | x | x | x | 8 | 6 paired CRC & NM | 50 46 | 66 | 70.8 (±15.7) 60.9 (±11.4) | 66 61 | ||
| Ladd, 2012, USA [65] | LC/MS-MS | x | x | - | - | 32 32 | 47 | 68.1 67.8 | 0 0 | ||||||||
| Lee, 2012, Korea [48] | IHC, WB | x | x | x | x | x | 6 | 120 paired CRC & NM | 219 75 | 47 | -- | 63 63 | |||||
| Barderas, 2013, Spain [53] | MS, SDS | 2 | - | 40 20 | 68 | 67.5 (43–85) 60.5 (49–88) | 58 60 | ||||||||||
| Shin, 2014, Korea [46] | LC/MS-MS | x | 1 | - | 228 77 | 40 | 62.6 (±8.7) 68.2 (±7.0) | 60 43 | |||||||||
| Chiang, 2015, Taiwan [37] | qRT-PCR, IHC | x | x | x | - | 132 paired CRC & NC | 120 120 | 49 | 65.3 (±12.7) 45.3 (±10.1) | 61 51 | |||||||
| Lin, 2015, Singapore [49] | MS, WB | x | - | - | 45 47 | 67 | - - | 33 - | |||||||||
| Taguchi, 2015, USA [67] | AbMA, MS | x | x | x | x | x | x | x | x | - | 66 CRC & 20 NM | 60 60 | 50 | - 55.7 (±9.9) | 40 73 | ||
| Individual Marker Studies | |||||||||||||||||
| Nam, 2004, USA [66] | MA, WB | x | x | x | x | 2 | 36 paired CRC & NM | 49 18 | - | - | - | ||||||
| Xue, 2010, China [28] | LC/MS-MS | x | x | - | 69 CRC | 144 156 | 53 | 59 (27–88) 56 (25–81) | 53 54 | ||||||||
| Rodriguez-Pineiro, 2012, Spain [54] | MALDI | x | - | - | 31 33 | 39 | 69.0 (± 9.0) | - | |||||||||
| Toiyama, 2014, Japan [43] | qRT-PCR, IHC | x | x | x | x | 1 | 195 paired CRC & NM | 195 45 | 47 | 66.7 (±10.7) 57.2 (±13.4) | 58 56 | ||||||
| Qiao, 2015, China [24] | LC-MS, WB | x | x | x | 5 | 90 paired CRC & NM | 42 48 | - | 65.5 (±10.97) 41 (±16.28) | 67 44 | |||||||
| Zhang, 2015, China [33] | qRT-PCR, WB, IHC | x | x | x | x | x | - | 90 paired CRC & NC | 43 38 | - | - | - | |||||
| Fan, 2016, China [31] | LC/MS-MS | x | x | x | 3 | - | 112 96 | 37 | 58.9 (±7.94) 61.5 (±7.94) | ||||||||
| Wang X, 2016, China [26] | MA, WB, IHC | x | x | x | x | x | - | 90 CRC & matched NM | 86 68 | - | - | - | |||||
Note: Age is in years; -: means not specified by the study; x: this type of cell line used by the study. Abbreviations: CRC: Colorectal Cancer; Cn: Controls; NC: Normal colonic tissue; NM: Normal mucosa. AbMA: Antibody microarray; IHC: Immunohistochemistry; LC-MS: Liquid chromatography-mass spectrometry; LC/MS-MS: Liquid chromatography-tandem mass spectrometry; MA: Microarray; MALDI: Matrix-assisted laser desorption/ionization; MS: Mass spectrometry; PhMA: Phage microarray; PrA: Protein array; PrMA: Protein microarray; qRT-PCR: Quantitative reverse transcription polymerase chain reaction; SDS: SDS PAGE or sodium dodecyl sulphate-polyacrylamide gel electrophoresis; SPM: Spectrophotometrically with protein assay; WB: Western Blot.
Table 2.
Patient characteristics of the tumor tissue proteome/TIF studies.
| First Author, Year, Country, [Ref] | Platform | Study Samples (Tumor Tissue) | Study Samples (Blood) | |||||||
|---|---|---|---|---|---|---|---|---|---|---|
| Sample Size (N) Cases NM | % Late Stage (III/IV) CRC | Mean Age (Range/±SD) CRC | % Males CRC | Sample Size (N) CRC Cn | % Late Stage (III/IV) CRC | Mean Age (Range/±SD) CRC Cn | % Males CRC Cn | |||
| Combination Marker Studies | ||||||||||
| Broll, 2001, Germany [56] | SPM | 38 paired CRC & NC | - | - | - | 122 65 | 44 | 68.3 (32–92) 66.4 (27–89) | 49 48 | |
| Alberthsen, 2006, Denmark [60] | SELDI-TOF MS | 32 CRC tumors | 50 | - | 63 | 119 34 | 49 | - (50–80) | 56 53 | |
| Yoneda, 2009, Japan [41] | MA, IHC | - | - | - | - | 159 40 | 42 | (38–90) (29–85) | 67 53 | |
| Kijanka, 2010, Ireland [62] | IHC | 43 CRC 19 NM | - | - | - | 43 40 | - | - | - | |
| Xie, 2010, China [27] | GeMS, TiMA | 93 paired CRC & NC | 3 | 66.05 ± 13.89 | 53 | 42 42 | - | - | - | |
| Hamelin, 2011, France [61] | MALDI, IHC | 20 paired CRC & NC | 70 | - | 50 | 112 90 | 50 | 70 (± 11) 58 (± 4) | 54 60 | |
| Kuo, 2011, Taiwan [39] | IHC | 104 paired CRC & NM | 92 | - | 47 | 59 52 | 58 | - | 58 - | |
| Matsubara, 2011, Japan [42] | IHC, RPPM | 20 tissues | - | - | - | 26 87 | 35 | 63.0 (±12.0) 43.0 (±16.0) | 50 64 | |
| Wang, 2013, China [25] | MALDI, IHC | 248 CRC 75 NM | - | - | - | 143 85 | 46 | 54.7 (±1.02) 52.5 (±1.19) | 58 51 | |
| Jiang, 2014, China [23] | IHC | 98 CRC 30 NC | 61 | (28–88) | 62 | 182 101 | - | 61 (23–86) (21–62) | 52 45 | |
| Surinova, 2015, Germany, CR [58] | LC/MS-MS | 16 paired CRC & NC | 25 | 62.3 ± 9.5 | 81 | 202 67 | 50 | 67 (59–74.8) 49 (52–65) | 56 76 | |
| Xue, 2014, China [29] | WB | 190 paired CC & NC | 45 | 66 (22–95) | 43 | 120 40 | 37 | 66.8 (26–93) 39.2 (23–59) | 41 - | |
| Wang Y, 2016, China [32] | LC/MS-MS | TIF 16 AOM-DSS mice | - | - | - | 16 16 | 56 | (35–67) | 56 | |
| Xie, 2016, China[34] | LC/MS-MS | TIF ApcMin/+ & WT mice | - | - | - | 30 30 | - | (31–70) (31–70) | 60 57 | |
| Individual Marker Studies | ||||||||||
| Roessler, 2005, Germany [57] | SDS | 18 paired CRC & NM | 28 | 73.3 (±9.7) | 61 | 109 317 | 40 | - (12–89) | - | |
| Kim, 2009, Korea [47] | 2-D DIGE, MS, IHC | 6 paired CRC & NM | 33 | 53.5 (±11.4) | 50 | 77 21 | 52 | - | ||
| Ji, 2010, Korea [45] | MA, WB, IHC | 66 paired CRC & NM | - | - | - | 100 78 | 49 | - | 61 - | |
| Han, 2011, China [21] | LC/MS-MS | 28 paired CRC & NM | 61 | 62.2 (±14.3) | 57 | 70 70 | - | - | - | |
| Fijneman, 2012, The Netherlands [63] | GeLC/MS-MS | TIFFabplCre;apc15lox/+C57Bl/6 mice | - | - | - | 8 36 | 63 | 71.8 (±6.4) 60.2 (±13.8) | 50 42 | |
| Hosono, 2012, Japan [44] | IHC | 62 adenoma | - | - | - | 62 A 34 | - | 67.7 (±8.2) 67.6 (±15.9) | 63 59 | |
| Yao, 2012, China [30] | IHC | 88 CRC 16 NM | 41 | (35–88) | 57 | 122 79 | - | - | - - | |
| Ji, 2013, China [22] | IHC, LC/MS-MS | 294 CRC | 71 | 59.55 ± 12.34 | 55 | 405 84 | 48 | - | 55 56 | |
| Niewiarowska, 2014, Poland [64] | IHC | 38 CRC tissues | - | - | - | 43 24 | 88 | 67.1 (±1.89) 55.7 (±7.3) | 63 | |
| Sole, 2014, Spain [55] | LC/MS-MS | 70 CRC 34 NM | 0 | 62.5 (50–69) | 23 | 80 77 | 55 | 67 (34–89) 66 (22–83) | 65 51 | |
Note: Age is in years; -: means not specified by the study; A: The study population consisted of Adenoma cases only. Abbreviations: CRC: Colorectal Cancer; Cn: Controls; 2-D DIGE: 2D-differential gel electrophoresis; GeLC/MS-MS: Nano-liquid chromatography-tandem mass spectrometry; GeMS: In-gel digestion coupled with mass spectrometric analysis; IHC: Immunohistochemistry; LC/MS-MS: Liquid chromatography-tandem mass spectrometry; MA: Microarray; MALDI: Matrix-assisted laser desorption/ionization; NC: Normal colonic tissue; NN: Nonneoplastic; NM: Normal mucosa; RPPM: Reverse phase protein microarray; SDS: SDS PAGE or sodium dodecyl sulphate-polyacrylamide gel electrophoresis; SELDI-TOF MS: surface-enhanced laser desorption ionization time of flight mass spectrometry; SPM: Spectrophotometrically with protein assay; TiMA: Tissue microarray; TIF: Tissue interstitial fluid; WB: Western Blot.
Table 3.
Diagnostic performance of cell line secretome markers validated in blood.
| First Author, Year, [Ref] | Proteins | Sensitivity (95%CI) % | Specificity (95%CI) % | Area under the Curve (95%CI) | Method | Validation | ||||||||||
|---|---|---|---|---|---|---|---|---|---|---|---|---|---|---|---|---|
| CEA | CA19-9 | ACVR2B | AZGP1 | GDF15 | LRG1 | S100A9 | MAPKAP3 | TIMP1 | PIM1 | Others | ||||||
| Cell Line Secretome Combination Marker Studies | ||||||||||||||||
| Wu, 2008 [35] | x | CRMP2 | 77 (71–83) | 95 (91–98) | 0.75 (0.68–0.78) | ELISA | No | |||||||||
| Wu, 2008 [36] | x | Mac-2BP | 69 (63–74) | 72 (64–79) | 0.774 (0.727–0.816) | ELISA | No | |||||||||
| Babel, 2009 [50] | x | x | x | 84 (71–93) | 71 (55–84) | 0.85 | ELISA | BS | ||||||||
| Tagi, 2010 [40] | x | DK, S-p53 (Stg.1) | 58 (48–68) | 80 (71–87) | - | ELISA | No | |||||||||
| Babel, 2011 [51] | SULF1, MST1/STK4 & phages NHSL1, GTF2i, SREBF2, GRN | 83 (70–92) | 70 (55–83) | 0.86 | ELISA | BS | ||||||||||
| Fan, 2011 [38] | x | SEC61β | 71 (60–80) | 89 (79–95) | 0.838 (0.774–0.903) | ELISA, WB | No | |||||||||
| Weiss, 2011 [59] | x | sE-cadherin | 34 (22–48) | 97 (87–100) | - | ELISA | No | |||||||||
| Barderas, 2012 [52] | x | x | x | FGFR4 & phages GRN, NHSL1, SREBF2 | 89 (77–96) | 90 (78–97) | 0.925 | ELISA | BS | |||||||
| Ladd, 2012 [65] | x | x | IGFBP2, MAPRE1 | 41 (24–60) | 95 (81–100) | 0.724 | ELISA | SS | ||||||||
| Lee, 2012 [48] | x | HMGB1 | 42 (35–49) | 87 (77–94) | 0.643 | ELISA | No | |||||||||
| Barderas, 2013 [53] | x | x | S100A8/A9, SERPINI1 | 60 (43–75) | 95 (75–100) | 0.884 | ELISA | No | ||||||||
| Shin, 2014 [46] | x | PAI-1, TRFM | 68 (62–74) | 90 (81–96) | 0.821 (0.731–0.890) | ELISA | No | |||||||||
| Chiang, 2015 [37] | x | BST2 | 24 (17–33) | 100 (97–100) | 0.872 (0.828–0.916) | ELISA | SS | |||||||||
| Lin, 2015 [49] | x | LAMB1 | 80 (65–90) | 92 (80–98) | 0.911 (0.85–0.97) | ELISA | No | |||||||||
| Taguchi, 2015 [67] | x | MAPRE, AK1 | 43 (30–56) | 95 (86–99) | - | ELISA | BS | |||||||||
| Cell Line Secretome Individual Marker Studies | ||||||||||||||||
| Nam, 2005 [66] | Defensin α6 | 69 (54–81) | 83 (58–96) | - | ELISA | SS | ||||||||||
| Xue, 2010 [28] | x | TFF3 | 54 (46–62) 78 (70–85) | 97 (93–99) 99 (96–100) | 0.730 (0.670–0.791) 0.897 (0.856–0.938) | ELISA | No | |||||||||
| Rodriguez-P, 2012 [54] | Clusterin | 81 (63–93) | 79 (61–91) | 0.845 (0.747–0.942) | ELISA | No | ||||||||||
| Toiyama, 2014 [43] | ANGPTL2 | 70 (63–76) | 96 (86–100) | 0.885 (0.838–0.923) | ELISA | SS | ||||||||||
| Qiao, 2015 [24] | COL6A3 | 93 (81–99) | 81 (67–91) | 0.885 | ELISA | No | ||||||||||
| Zhang, 2015 [33] | Spondin-2 | 100 (92–100) | 90 (76–97) | 0.959 | ELISA | No | ||||||||||
| Fan, 2016 [31] | x | x | MRC1 | 74 (65–82) 81 (73–88) 52 (42–62) | 63 (53–73) 80 (71–88) 48 (38–58) | 0.744 (0.678–0.810) 0.873 (0.826–0.920) 0.464 (0.384–0.544) | ELISA | No | ||||||||
| Wang X, 2016 [26] | x | COL3A1 | 99 (94–100) 70 (59–79) | 69 (57–80) 73 (61–83) | 0.92 0.791 | ELISA | No | |||||||||
Abbreviations: BS: Bootstrap method; ELISA: Enzyme-linked immunosorbent assay; SS: Split Sampling method; WB: Western Blot. Abbreviations for proteins: ACVR2B: Activin receptor type-2B; AK1: Adenylate Kinase 1; ANGPTL2: Angiopoietin-like protein 2; AZGP1: Zinc-α-2-glycoprotein; BST2: Bone marrow stromal antigen 2; CA 19-9: Carbohydrate antigen 19-9; CEA: Carcinoembryonic antigen; COL3A1: Collagen alpha-1(III); COL6A3: Collagen alpha-3(VI) chain; CRMP-2: Collapsin response mediator protein-2; DK: Dermokine; GDF15: Growth/differentiation factor 15; GRN: Granulin; GTF2i: General transcription factor; FGFR4: Fibroblast growth factor receptor 4; HMGB1: High mobility group protein B1; IGFBP2: Insulin like growth factor binding protein 2; LAMB1: Laminin β-1; LRG1: Leucine-rich alpha-2-glycoprotein; MAC-2BP/TAA90K: Mac-2 binding protein/Tumor-associated antigen 90 K; MAPKAPK3: Mitogen-activated protein kinase-activated protein kinase 3; MAPRE1: Microtubule-associated protein RP/EB family member 1; MRC1: Macrophage mannose receptor 1; MST1/STK4: Mammalian STE20-like protein kinase 1; NHSL1: NHS-like protein 1; PAI-1: Plasminogen activator inhibitor-1; PIM1: Serine/threonine-protein kinase pim-1; S-p53: Serum-p53; S100A8/A9: S100 calcium-binding protein A8/A9; SEC61β: Protein transport protein Sec61 subunit beta; SERPINI1: Neuroserpin; SREBF2: Sterol regulatory element binding protein 2; SULF1: Sulfatase 1; TFF3: trefoil factor; TIMP1: Tissue inhibitor of metalloproteinases 1; TRFM: Melanotransferrin; -: means not specified by the study; x: this type of protein was identified by the study.
Table 4.
Diagnostic performance of tumor tissue proteome/TIF markers validated in blood.
| First Author, Year, [Ref] | Proteins | Sensitivity (95%CI) % | Specificity (95%CI) % | Area under the Curve (95%CI) | Method | Validation | ||||||||||
|---|---|---|---|---|---|---|---|---|---|---|---|---|---|---|---|---|
| CEA | CA19-9 | ACVR2B | AZGP1 | GDF15 | LRG1 | S100A9 | MAPKAP3 | TIMP1 | PIM1 | Others | ||||||
| Tumor Tissue Proteome Combination Marker Studies | ||||||||||||||||
| Broll, 2001 [56] | x | VEGF | 62 (53–71) | 85 (74–93) | - | ELISA | No | |||||||||
| Alberthsen, 2006 [60] | HNP1, HNP2, HNP3 | 80 (72–87) | 53 (35–70) | - | ELISA | No | ||||||||||
| Yoneda, 2009 [41] | x | x | Cystatin SN | 63 (55–71) | 90 (76–97) | - | ELISA | No | ||||||||
| Kijanka, 2010 [62] | ZNF700, TSLC1, LASS5, p53, TCF3, SNP29, ZNF638, ICLN, ZNF346, AOPJ75, HMGB1, BAC85857 | 84 (70–93) | 80 (64–91) | - | PrA | SS | ||||||||||
| Xie, 2010 [27] # | A1AT, CTSD | 100 (92–100) | 97 (87–100) | - | WB | No | ||||||||||
| Hamelin, 2011 [61] | x | x | HSP60 | 47 (38–57) | 90 (82–95) | 0.77 (0.70–0.84) | ELISA | SS | ||||||||
| Kuo, 2011 [39] | x | PLSCR1 | 85 (73–93) | 48 (34–62) | 0.80 | WB | No | |||||||||
| Matsubara, 2011 [42] | x | Adipophilin | 31 (15–52) | 95 (88–99) | 0.783 | RPPM | SS | |||||||||
| Wang, 2013 [25] | x | Kininogen-1 | 22 (16–30) | 93 (85–97) | - | ELISA | CV | |||||||||
| Jiang, 2014 [23] | DC-SIGN, DC-SIGNR | 99 (96–100) | 95 (89–98) | 0.989 | ELISA | No | ||||||||||
| Xue, 2014 [29] | x | x | x | 74 (65–82) | 73 (57–86) | 0.805 (0.738–0.872) | ELISA | LOOCV | ||||||||
| Surinova, 2015 [58] | x | x | CP, PON1, SERPINA3 | 70 (63–76) | 79 (67–88) | 0.84 (0.75–0.92) * | SRM | TFCV | ||||||||
| Wang Y, 2016 [32] | x | TUBB5 | 63 (36–85) | 81 (54–96) | 0.74 | MRM | No | |||||||||
| Xie, 2016 [34] | CELA1, CEL2A, CTRL, TRY2 | 87 (70-96) | 83 (65-94) | 0.90 (0.83–0.98) | MRM | No | ||||||||||
| Tumor Tissue Proteome Individual Marker Studies | ||||||||||||||||
| Roessler, 2005 [57] | x | NNMT | 51 (41–61) 39 (30–49) | 95 (92–97) 95 (92–97) | 0.84 0.78 | ELISA | No | |||||||||
| Kim, 2009 [47] | x | x | S100A8 | 41 (30–53) 44 (33–56) 22 (13–33) | 95 (76–100) 95 (76–100) 100 (94–100) | 0.91 0.89 0.78 | WB | No | ||||||||
| Ji, 2010 [45] | x | ESM-1 | 99 (95–100) 48 (38–58) | 73 (62–82) 99 (94–100) | 0.94 0.733 | ELISA | No | |||||||||
| Han, 2011 [21] | STOML2 | 71 (59–81) | 63 (51–74) | 0.77 | ELISA | No | ||||||||||
| Fijneman, 2012 [63] | x | CHI3L1 | 75 (35–97) 38 (9–76) | 89 (74–97) 100 (90–100) | 0.81 0.86 | ELISA | No | |||||||||
| Hosono, 2012 [44] A | TNF-R1 | 93 (84–98) | 82 (65–93) | - | ELISA | No | ||||||||||
| Yao, 2012 [30] | x | EFEMP2 | 83 (75–89) 63 (54–72) | 93 (85–98) 77 (66–86) | 0.923 (0.885–0.961) 0.728 (0.659–0.797) | ELISA | SS | |||||||||
| Ji, 2013 [22] | x | PEDF PRDX2 | 100 (99–100) 34 (29–39) 87 (83–90) | 79 (69–87) 96 (89–99) 51 (40–62) | - | ELISA | SS | |||||||||
| Niewiarowska, 2014 [64] | x | 67 (51–81) | 67 (45–85) | 0.666 | ELISA | No | ||||||||||
| Sole, 2014 [55] § | COL10A1 | 63 (52–74) | 85 (75–92) | 0.75 | ELISA | SS | ||||||||||
Note: #: The sensitivity and specificity values are for tissue array based validation and not serum based; *: The confidence interval for area under the curve in this study was reported for 99% CI; §: The sensitivity and specificity values are for CRC or Adenoma cases; A: The sensitivity and specificity values are for only Adenoma cases and not CRC; -: means not specified by the study; x: this type of protein was identified by the study. Abbreviation: A: Adenoma; CV: Cross-validation method; ELISA: Enzyme-linked immunosorbent assay; LOOCV: Leave-one-out cross validation; MRM: Multiple reaction monitoring; PrA: Protein Array; RPPM: Reverse phase protein microarray; SRM: Selected reaction monitoring used in tandem mass spectrometry; SS: Split Sampling method; TFCV: Ten-fold Cross validation; WB: Western Blot. Abbreviations for proteins: A1AT: α1 antitrypsin; ACVR2B—Activin receptor type-2B; AOPJ75: KIAA0310 protein; AZGP1: Zinc-α-2-glycoprotein; BAC85857: Unnamed protein product; CA 19-9: Carbohydrate antigen; CEA: Carcinoembryonic antigen 19-9; CELA1: chymotrypsin-like elastase 1; CELA2: chymotrypsin-like elastase 2A; CHI3L1: Chitinase-3-like protein 1; COL10A1: Collagen alpha-1(X) chain; CP: Ceruloplasmin; CTRL: chymopasin; CTSD: Cathepsin D; DC-SIGN: Dendritic cell-specific ICAM-3 grabbing nonintegrin; DC-SIGNR: DC-SIGN-related protein/L-SIGN, CD209L; GDF15: Growth/differentiation factor 15; EFEMP2: EGF-containing fibulin-like extracellular matrix protein 2; ESM-1: Endothelial cell-specific molecule-1; HMGB1: High mobility group protein B1; HNP1: Human neutrophil peptide 1; HNP2: Human neutrophil peptide 2; HNP3: Human neutrophil peptide 3; HSP60: Heat shock protein 60; ICLN: Methylosome subunit plCln; LASS5: Longevity assurance gene homologous 5; LRG1: Leucine-rich alpha-2-glycoprotein; MAPKAPK3: Mitogen-activated protein kinase-activated protein kinase 3; NNMT: Nicotinamide N-Methyltransferase; PEDF: Pigment epithelium derived factor; PIM1: Serine/threonine-protein kinase pim-1; PLSCR1: phospholipid scramblase 1; PON1: Serum paraoxonase/arylesterase 1; PRDX2: Peroxiredoxin 2; S100A8/A9: S100 calcium-binding protein A8/A9; SERPINA3: Serpin peptidase inhibitor clade A; SNP29: Synaptosomal-associated protein 29; STOML2: Stomatin like 2; TCF3: E2A immunoglobulin enhancer-binding factor E12/E47; TIMP1: Tissue inhibitor of metalloproteinases 1; TNF-R1: Tumor necrosis factor receptor 1; TRY2: trypsin 2; TSLC1: Tumour suppressor in lung cancer I; TUBB5: tubulin beta-5 chain; VEGF: Vascular endothelial growth factor; ZNF346: Zinc finger protein 346; ZNF638: Zinc finger protein 638; ZNF700: Zinc finger protein 700.
© 2017 by the authors. Licensee MDPI, Basel, Switzerland. This article is an open access article distributed under the terms and conditions of the Creative Commons Attribution (CC BY) license (http://creativecommons.org/licenses/by/4.0/).
Share and Cite
MDPI and ACS Style
Bhardwaj, M.; Erben, V.; Schrotz-King, P.; Brenner, H. Cell Line Secretome and Tumor Tissue Proteome Markers for Early Detection of Colorectal Cancer: A Systematic Review. Cancers 2017, 9, 156. https://doi.org/10.3390/cancers9110156
AMA Style
Bhardwaj M, Erben V, Schrotz-King P, Brenner H. Cell Line Secretome and Tumor Tissue Proteome Markers for Early Detection of Colorectal Cancer: A Systematic Review. Cancers. 2017; 9(11):156. https://doi.org/10.3390/cancers9110156
Chicago/Turabian StyleBhardwaj, Megha, Vanessa Erben, Petra Schrotz-King, and Hermann Brenner. 2017. "Cell Line Secretome and Tumor Tissue Proteome Markers for Early Detection of Colorectal Cancer: A Systematic Review" Cancers 9, no. 11: 156. https://doi.org/10.3390/cancers9110156
Note that from the first issue of 2016, this journal uses article numbers instead of page numbers. See further details here.