
Quality-of-Life (QOL) during Screening for Phase 1 Trial Studies in Patients with Advanced Solid Tumors and Its Impact on Risk for Serious Adverse Events

 ,
,
Abstract
:1. Introduction
2. Methods
Statistical Considerations
3. Results
3.1. Demographics
3.2. QOL and Social Support Analysis
3.3. Risk of Replacement
3.4. Risk of SAE
3.5. Other Outcomes
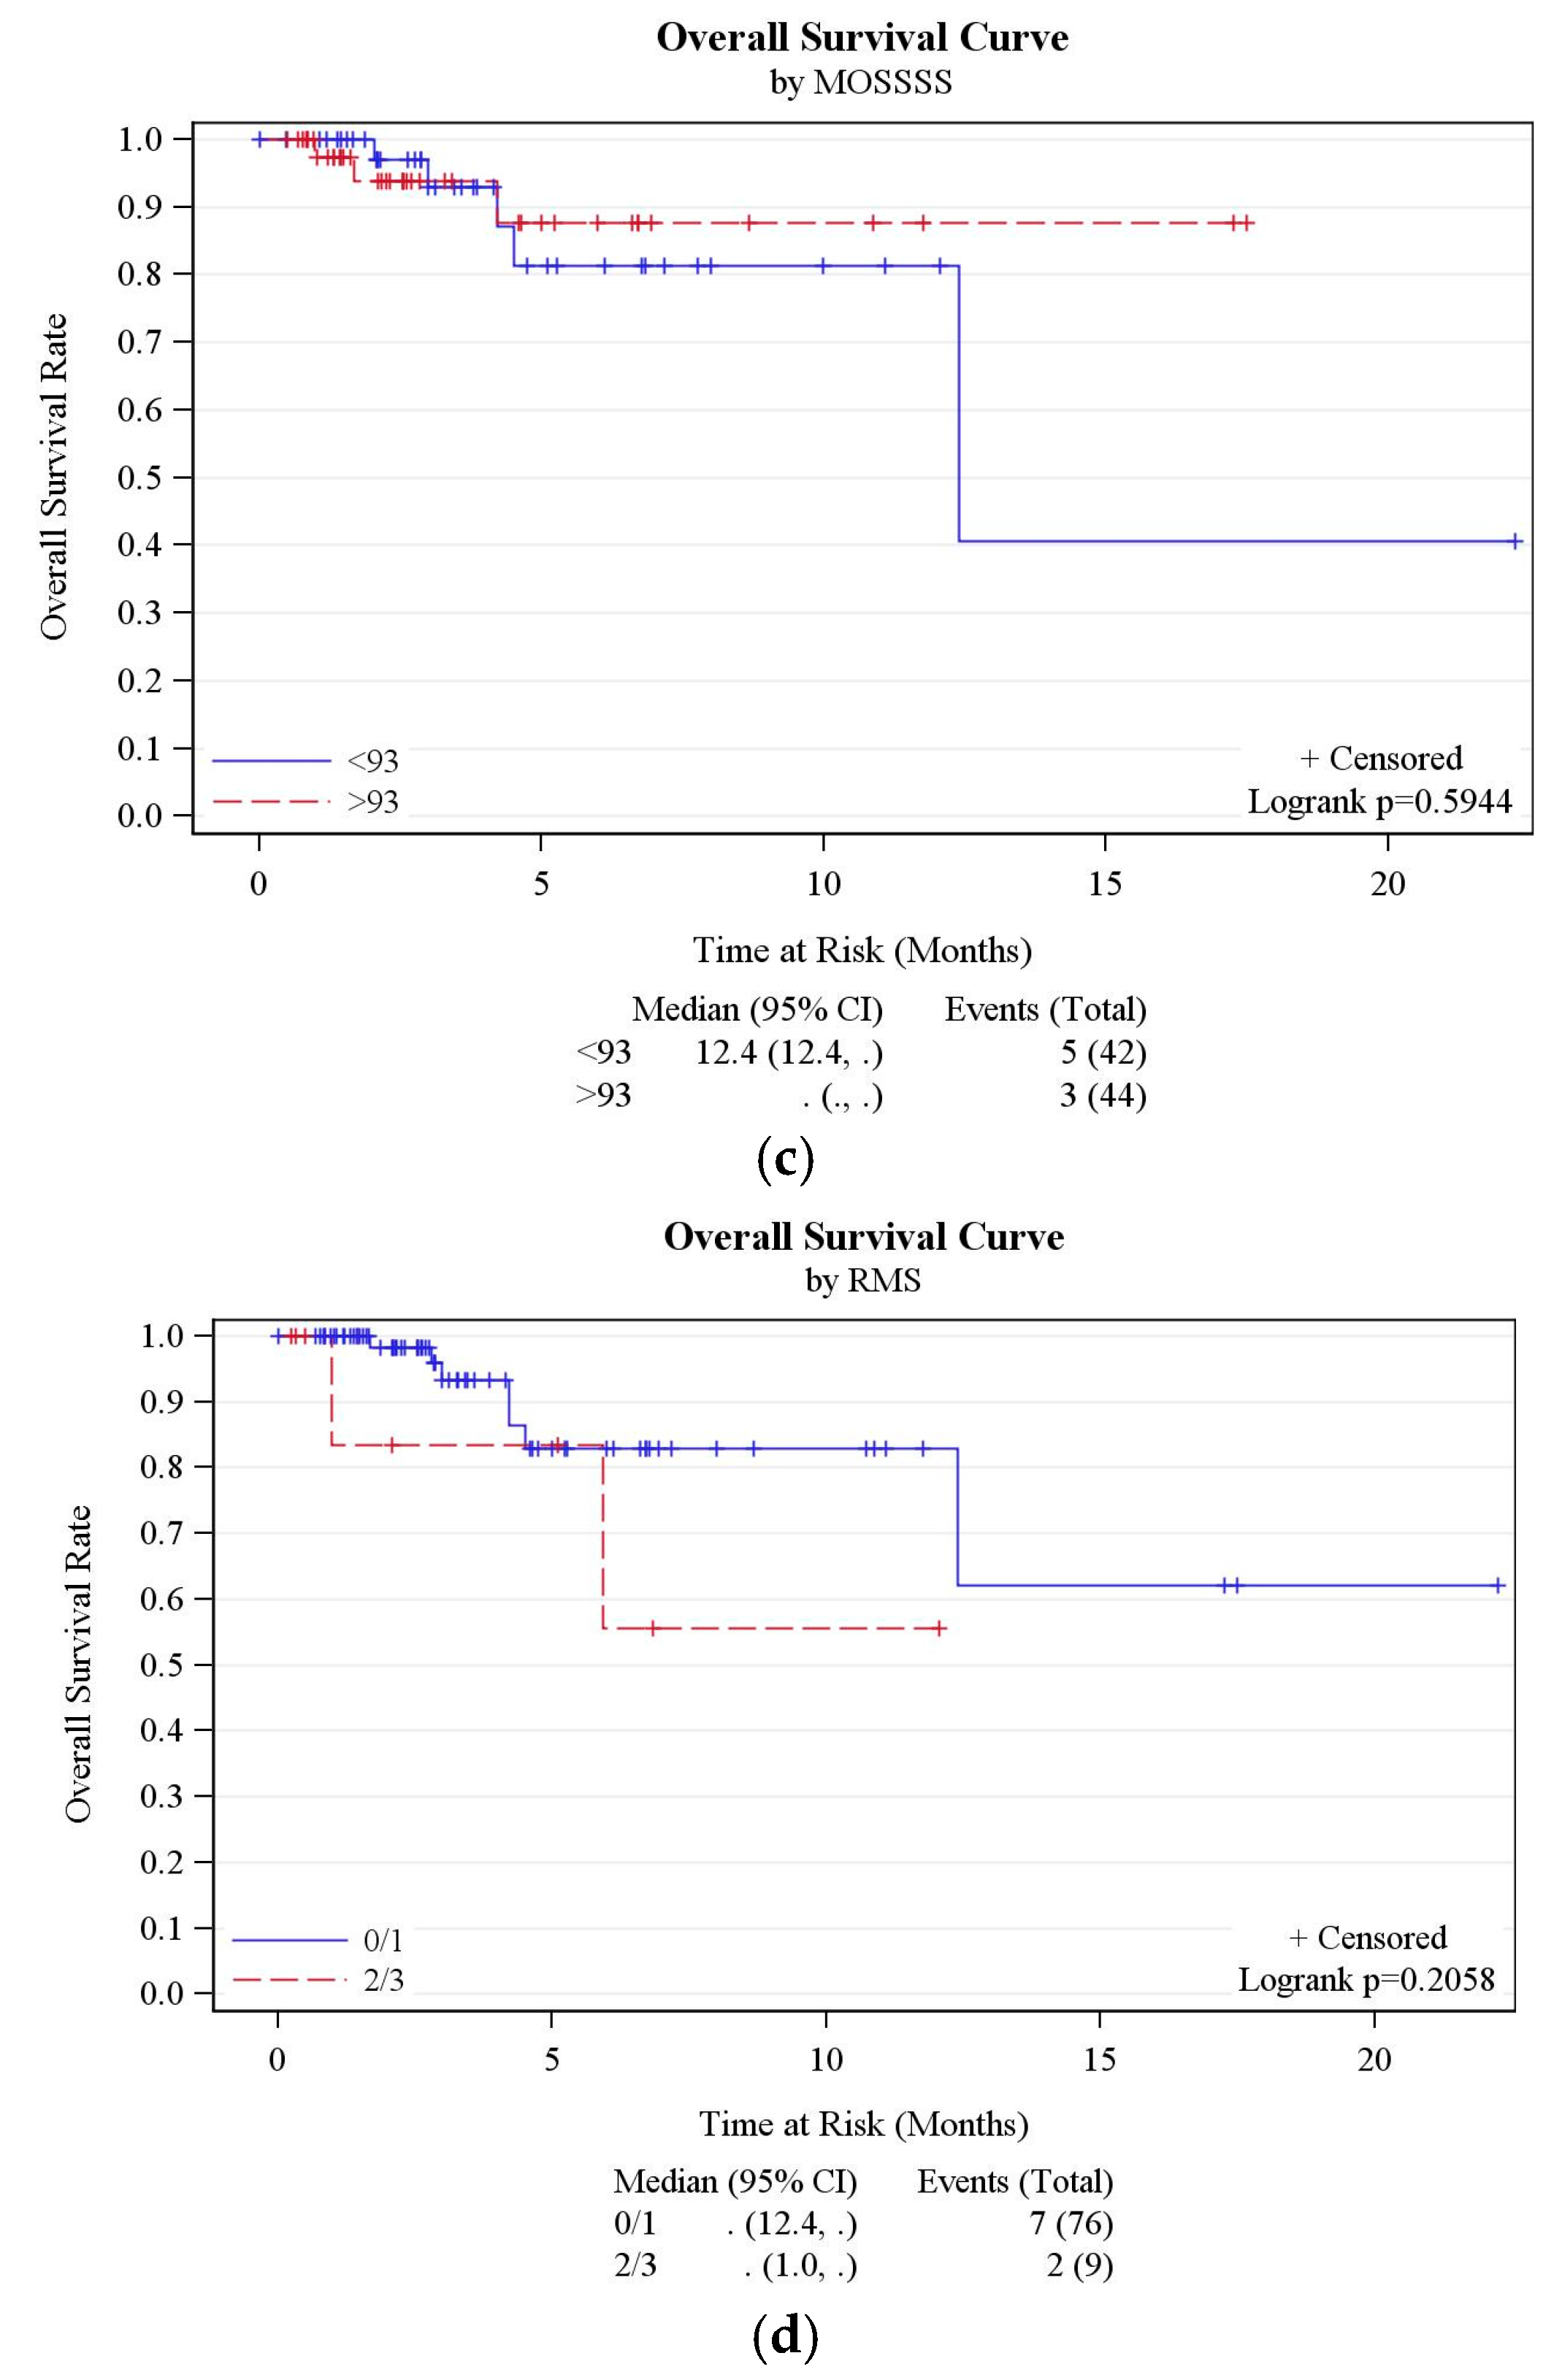
3.6. RMS Analysis
4. Discussion
5. Conclusions
Supplementary Materials
Acknowledgments
Author Contributions
Conflicts of Interest
References
- Decoster, G.; Stein, G.; Holdener, E.E. Responses and toxic deaths in phase I clinical trials. Ann. Oncol. 1990, 1, 175–181. [Google Scholar] [CrossRef] [PubMed]
- Roberts, T.G.; Goulart, B.H.; Squitieri, L.; Stallings, S.C.; Halpern, E.F.; Chabner, B.A.; Gazelle, G.S.; Finkelstein, S.N.; Clark, J.W. Trends in the risks and benefits to patients with cancer participating in phase 1 clinical trials. JAMA 2004, 292, 2130–2140. [Google Scholar] [CrossRef] [PubMed]
- Wheler, J.; Tsimberidou, A.; Hong, D.; Naing, A.; Falchook, G.; Fu, S.; Moulder, S.; Stephen, B.; Wen, S.; Kurzrock, R. Risk of serious toxicity in 1181 patients treated in phase I clinical trials of predominantly targeted anticancer drugs: The MD anderson cancer center experience. Ann. Oncol. 2012, 23, 1963–1967. [Google Scholar] [CrossRef] [PubMed]
- Molife, L.; Alam, S.; Olmos, D.; Puglisi, M.; Shah, K.; Fehrmann, R.; Trani, L.; Tjokrowidjaja, A.; de Bono, J.; Banerji, U. Defining the risk of toxicity in phase I oncology trials of novel molecularly targeted agents: A single centre experience. Ann. Oncol. 2012, 23, 1968–1973. [Google Scholar] [CrossRef] [PubMed]
- Bachelot, T.; Ray-Coquard, I.; Catimel, G.; Ardiet, C.; Guastalla, J.P.; Dumortier, A.; Chauvin, F.; Droz, J.P.; Philip, T.; Clavel, M. Multivariable analysis of prognostic factors for toxicity and survival for patients enrolled in phase I clinical trials. Ann. Oncol. 2000, 11, 151–156. [Google Scholar] [CrossRef] [PubMed]
- Rogatko, A.; Babb, J.S.; Wang, H.; Slifker, M.J.; Hudes, G.R. Patient characteristics compete with dose as predictors of acute treatment toxicity in early phase clinical trials. Clin. Cancer Res. 2004, 10, 4645–4651. [Google Scholar] [CrossRef] [PubMed]
- Pond, G.R.; Siu, L.L.; Moore, M.; Oza, A.; Hirte, H.W.; Winquist, E.; Goss, G.; Hudes, G.; Townsley, C.A. Nomograms to predict serious adverse events in phase II clinical trials of molecularly targeted agents. J. Clin. Oncol. 2008, 26, 1324–1330. [Google Scholar] [CrossRef] [PubMed]
- Arkenau, H.T.; Olmos, D.; Ang, J.E.; de Bono, J.; Judson, I.; Kaye, S. Clinical outcome and prognostic factors for patients treated within the context of a phase I study: The royal marsden hospital experience. Br. J. Cancer 2008, 98, 1029–1033. [Google Scholar] [CrossRef] [PubMed]
- Arkenau, H.T.; Barriuso, J.; Olmos, D.; Ang, J.E.; de Bono, J.; Judson, I.; Kaye, S. Prospective validation of a prognostic score to improve patient selection for oncology phase I trials. J. Clin. Oncol. 2009, 27, 2692–2696. [Google Scholar] [CrossRef] [PubMed]
- Olmos, D.; A’hern, R.P.; Marsoni, S.; Morales, R.; Gomez-Roca, C.; Verweij, J.; Voest, E.E.; Schöffski, P.; Ang, J.E.; Penel, N.; et al. Patient selection for oncology phase I trials: A multi-institutional study of prognostic factors. J. Clin. Oncol. 2012, 30, 996–1004. [Google Scholar] [CrossRef] [PubMed]
- Charlson, M.E.; Pompei, P.; Ales, K.L.; MacKenzie, C.R. A new method of classifying prognostic comorbidity in longitudinal studies: Development and validation. J. Chronic Dis. 1987, 40, 373–383. [Google Scholar] [CrossRef]
- Cleves, M.A.; Sanchez, N.; Draheim, M. Evaluation of two competing methods for calculating Charlson’s comorbidity index when analyzing short-term mortality using administrative data. J. Clin. Epidemiol. 1997, 50, 903–908. [Google Scholar] [CrossRef]
- Santos, A.D.; Fernand ez Acenero, M.J.; Garcia Gonzalez, J.I.; Martin, M.M.; Paniagua, A.P. Survival analysis of clear cell renal carcinoma according to the Charlson comorbidity index. J. Urol. 2008, 179, 857–861. [Google Scholar] [CrossRef] [PubMed]
- Lubke, T.; Monig, S.P.; Schneider, P.M.; Holscher, A.H.; Bollschweiler, E. Does Charlson-comorbidity index correlate with short-term outcome in patients with gastric cancer? Zentralbl. Chir. 2003, 128, 970–976. [Google Scholar] [PubMed]
- Von Pawel, J.; Gatzemeier, U.; Pujol, J.L.; Moreau, L.; Bildat, S.; Ranson, M.; Richardson, G.; Stepper, C.; Riviere, A.; Camlett, I.; et al. Phase II comparator study of oral versus intravenous topotecan in patients with chemosensitive small-cell lung cancer. J. Clin. Oncol. 2001, 19, 1743–1749. [Google Scholar] [CrossRef] [PubMed]
- Beitz, J.; Gnecco, C.; Justice, R. Quality-of-life end points in cancer clinical trials: The U.S. food and drug administration perspective. J. Natl. Cancer Inst. Monogr. 1996, 20, 7–9. [Google Scholar]
- Dancey, J.; Zee, B.; Osoba, D.; Whitehead, M.; Lu, F.; Kaizer, L.; Latreille, J.; Pater, J.L. Quality of life scores: An independent prognostic variable in a general population of cancer patients receiving chemotherapy. Qual. Life Res. 1997, 6, 151–158. [Google Scholar] [CrossRef] [PubMed]
- Bukberg, J.; Penman, D.; Holland, J.C. Depression in hospitalized cancer patients. Psychosom. Med. 1984, 46, 199–212. [Google Scholar] [CrossRef] [PubMed]
- Guidry, J.; Aday, L.; Zhang, D.; Winn, R. The role of informal and formal social support networks for patients with cancer. Cancer Pract. 1996, 5, 241–246. [Google Scholar]
- Nausheen, B.; Gidron, Y.; Peveler, R.; Moss-Morris, R. Social support and cancer progression: A systematic review. J. Psychosom. Res. 2009, 67, 403–415. [Google Scholar] [CrossRef] [PubMed]
- Kroenke, C.H.; Kubzansky, L.D.; Schernhammer, E.S.; Holmes, M.D.; Kawachi, I. Social networks, social support, and survival after breast cancer diagnosis. J. Clin. Oncol. 2006, 24, 1105–1111. [Google Scholar] [CrossRef] [PubMed]
- Cella, D.F.; Tulsky, D.S.; Gray, G.; Sarafian, B.; Linn, E.; Bonomi, A.; Silberman, M.; Yellen, S.B.; Winicour, P.; Brannon, J. The functional assessment of cancer therapy scale: Development and validation of the general measure. J. Clin. Oncol. 1993, 11, 570–579. [Google Scholar] [CrossRef] [PubMed]
- Scott, N.; Fayers, P.; Aaronson, N.; Bottomley, A.; de Graeff, A.; Groenvold, M.; Gundy, C.; Koller, M.; Petersen, M.A.; Sprangers, M. EORTC QLQ-C30, Reference Values; EORTC: Brussels, Belgium, 2008. [Google Scholar]
- Sherbourne, C.D.; Stewart, A.L. The MOS social support survey. Soc. Sci. Med. 1991, 32, 705–714. [Google Scholar] [CrossRef]
- American Academy of Hospice and Palliative Medicine; Center to Advance Palliative Care; Hospice and Palliative Nurses Association; Last Acts Partnership; National Hospice and Palliative Care Organization. National consensus project for quality palliative care: Clinical practice guidelines for quality palliative care, executive summary. J. Palliat. Med. 2004, 7, 611–627. [Google Scholar]
- Bonnetain, F.; Bouche, O.; Conroy, T.; Arveux, P.; Raoul, J.L.; Giovannini, M.; Etienne, P.L.; Mitry, E.; Seitz, J.F.; Rougier, P.; et al. Longitudinal quality of life study in patients with metastatic gastric cancer. Analysis modalities and clinical applicability of QoL in randomized phase II trial in a digestive oncology. Gastroenterol. Clin. Biol. 2005, 29, 1113–1124. [Google Scholar] [CrossRef]
- Anwar, S.; Tan, W.; Yu, J.; Hutson, A.; Javle, M.; Iyer, R. Quality-of-life (QoL) as a predictive biomarker in patients with advanced pancreatic cancer (APC) receiving chemotherapy: Results from a prospective multicenter phase 2 trial. J. Gastrointest. Oncol. 2014, 5, 433–439. [Google Scholar] [PubMed]
- Spigel, D.R.; Patel, J.D.; Reynolds, C.H.; Garon, E.B.; Hermann, R.C.; Govindan, R.; Olsen, M.R.; Winfree, K.B.; Chen, J.; Liu, J.; et al. Quality of life analyses from the randomized, open-label, phase III PointBreak study of pemetrexed-carboplatin-bevacizumab followed by maintenance pemetrexed-bevacizumab versus paclitaxel-carboplatin-bevacizumab followed by maintenance bevacizumab in patients with stage IIIB or IV nonsquamous non-small-cell lung cancer. J. Thorac. Oncol. 2015, 10, 353–359. [Google Scholar] [PubMed]
- Stark, D.; Kiely, M.; Smith, A.; Velikova, G.; House, A.; Selby, P. Anxiety Disorders in cancer patients: Their nature, associations, and relation to quality of life. J. Clin. Oncol. 2002, 20, 3137–3148. [Google Scholar] [CrossRef] [PubMed]
- Cella, D. Factors influencing quality of life in cancer patients: Anemia and fatigue. Semin. Oncol. 1998, 25, S43–S46. [Google Scholar]
- Ludwig, H.; Fritz, E. Anemia in cancer patients. Semin. Oncol. 1998, 25, S2–S6. [Google Scholar]
- Demetri, G.D. Anaemia and its functional consequences in cancer patients: Current challenges in management and prospects for improving therapy. Br. J. Cancer 2001, 84, S31–S37. [Google Scholar] [CrossRef] [PubMed]
- Marín Caro, M.M.; Laviano, A.; Pichard, C. Nutritional intervention and quality of life in adult oncology patients. Clin. Nutr. 2007, 26, 289–301. [Google Scholar] [CrossRef] [PubMed]
- Meyers, C.A.; Albitar, M.; Estey, E. Cognitive impairment, fatigue, and cytokine levels in patients with acute myelogenous leukemia or myelodysplastic syndrome. Cancer 2005, 104, 788–793. [Google Scholar] [CrossRef] [PubMed]
- Luckett, T.; King, M.T.; Butow, P.N.; Oguchi, M.; Rankin, N.; Price, M.A.; Hackl, N.A.; Heading, G. Choosing between the EORTC QLQ-C30 and FACT-G for measuring health-related quality of life in cancer clinical research: Issues, evidence and recommendations. Ann. Oncol. 2011, 22, 2179–2190. [Google Scholar] [CrossRef] [PubMed]
- Kemmler, G.; Holzner, B.; Kopp, M.; Dünser, M.; Margreiter, R.; Greil, R.; Sperner-Unterweger, B. Comparison of two quality-of-life instruments for cancer patients: The functional assessment of cancer therapy-general and the european organization for research and treatment of cancer quality of life questionnaire-C30. J. Clin. Oncol. 1999, 17, 2932. [Google Scholar] [CrossRef] [PubMed]
- Aaronson, N.K.; Ahmedzai, S.; Bergman, B.; Bullinger, M.; Cull, A.; Duez, N.J.; Filiberti, A.; Flechtner, H.; Fleishman, S.B.; de Haes, J.C.; et al. The european organization for research and treatment of cancer QLQ-C30: A quality-of-life instrument for use in international clinical trials in oncology. J. Natl. Cancer Inst. 1993, 85, 365–376. [Google Scholar] [CrossRef]
- Hyman, D.M.; Eaton, A.A.; Gounder, M.M.; Pamer, E.G.; Pettiford, J.; Carvajal, R.D.; Ivy, S.P.; Iasonos, A.; Spriggs, D.R. Predictors of early treatment discontinuation in patients enrolled on phase I oncology trials. Oncotarget 2015, 6, 19316–19327. [Google Scholar] [CrossRef] [PubMed]
- Brawley, O.W. The study of accrual to clinical trials: Can we learn from studying who enters our studies? J. Clin. Oncol. 2004, 22, 2039–2040. [Google Scholar] [CrossRef] [PubMed]
- Simon, M.S.; Du, W.; Flaherty, L.; Philip, P.A.; Lorusso, P.; Miree, C.; Smith, D.; Brown, D.R. Factors associated with breast cancer clinical trials participation and enrollment at a large academic medical center. J. Clin. Oncol. 2004, 22, 2046–2052. [Google Scholar] [CrossRef] [PubMed]
- Warnecke, R.B.; Johnson, T.P.; Kaluzny, A.D.; Ford, L.G. The community clinical oncology program: Its effect on clinical practice. Jt. Comm. J. Qual. Improv. 1995, 21, 336–339. [Google Scholar] [CrossRef]
- Horstmann, E.; McCabe, M.S.; Grochow, L.; Yamamoto, S.; Rubinstein, L.; Budd, T.; Shoemaker, D.; Emanuel, E.J.; Grady, C. Risks and benefits of phase 1 oncology trials, 1991 through 2002. N. Engl. J. Med. 2005, 352, 895–904. [Google Scholar] [CrossRef] [PubMed]
- Italiano, A.; Massard, C.; Bahleda, R.; Vataire, A.L.; Deutsch, E.; Magne, N.; Pignon, J.P.; Vassal, G.; Armand, J.P.; Soria, J.C. Treatment outcome and survival in participants of phase I oncology trials carried out from 2003 to 2006 at Institut Gustave Roussy. Ann. Oncol. 2008, 19, 787–792. [Google Scholar] [CrossRef] [PubMed]
- Shanafelt, T.D.; Bowen, D.A.; Venkat, C.; Slager, S.L.; Zent, C.S.; Kay, N.E.; Reinalda, M.; Tun, H.; Sloan, J.A.; Call, T.G. The physician-patient relationship and quality of life: Lessons from chronic lymphocytic leukemia. Leuk. Res. 2009, 33, 263–270. [Google Scholar] [CrossRef] [PubMed]
- Kwan, M.L.; Tam, E.K.; Ergas, I.J.; Rehkopf, D.H.; Roh, J.M.; Lee, M.M.; Somkin, C.P.; Stewart, A.L.; Kushi, L.H. Patient-physician interaction and quality of life in recently diagnosed breast cancer patients. Breast Cancer Res. Treat. 2013, 139, 581–595. [Google Scholar] [CrossRef] [PubMed]
- Tremolada, M.; Schiavo, S.; Varotto, S.; Basso, G.; Pillon, M. Patient satisfaction in italian childhood cancer survivors: Human aspects of treatment as a key factor in patients’ quality of life. Health Soc. Work 2015, 40, e148–e155. [Google Scholar] [CrossRef]


| Patient Demographics | |||
|---|---|---|---|
| AGE (years) | Range: 30–84 | Mean: 61.2 | Median: 63 |
| GENDER | MALE | 38 | 41% |
| FEMALE | 54 | 59% | |
| CANCER | Gastrointestinal tract | 39 | 42% |
| Respiratory tract | 22 | 25% | |
| Gynecological | 10 | 11% | |
| Sarcoma | 8 | 9% | |
| Breast | 4 | 4% | |
| Head + Neck | 3 | 3% | |
| Endocrine | 3 | 3% | |
| Lymphoma | 2 | 2% | |
| Skin | 1 | 1% | |
| Questionnaire | Event Identifier | N | N * | Mean | Standard Deviation | Median | Min | Max | p-Value Compared with Baseline Score) |
|---|---|---|---|---|---|---|---|---|---|
| EORTC QLQ C-30 | BASELINE | 92 | 87 | 75.3 | 14.4 | 77.2 | 42.5 | 96.9 | - |
| VISIT1 | 87 | 61 | 74.6 | 13.7 | 77.8 | 37.5 | 95.0 | 0.563 | |
| VISIT2 | 61 | 34 | 78.9 | 13.6 | 80.1 | 43.1 | 97.5 | 0.593 | |
| VISIT3 | 34 | 23 | 78.1 | 16.5 | 83.6 | 38.3 | 97.5 | 0.191 | |
| VISIT4 | 26 | 13 | 79.7 | 11.6 | 80.6 | 53.3 | 96.1 | 0.654 | |
| FACT-G | BASELINE | 92 | 86 | 73.7 | 14.2 | 75.0 | 28.7 | 94.4 | - |
| VISIT1 | 87 | 61 | 74.8 | 13.4 | 75.9 | 31.5 | 94.2 | 0.166 | |
| VISIT2 | 61 | 34 | 75.3 | 14.9 | 74.9 | 29.6 | 98.1 | 0.293 | |
| VISIT3 | 34 | 23 | 79.6 | 13.9 | 77.9 | 50.0 | 99.0 | 0.094 | |
| VISIT4 | 26 | 13 | 78.8 | 10.9 | 82.7 | 60.2 | 98.1 | 0.420 | |
| MOSSSS | BASELINE | 92 | 86 | 87.0 | 17.0 | 93.4 | 19.7 | 100 | - |
| VISIT1 | 87 | 60 | 85.8 | 19.2 | 97.4 | 19.7 | 100 | 0.878 | |
| VISIT2 | 61 | 34 | 89.9 | 15.5 | 96.7 | 22.4 | 100 | 0.073 | |
| VISIT3 | 34 | 23 | 90.8 | 11.7 | 97.4 | 59.2 | 100 | 0.041 | |
| VISIT4 | 26 | 13 | 90.8 | 13.4 | 96.1 | 56.6 | 100 | 0.440 |
| Questionnaire | Variable | Level | N Obs * | N ** | Mean ^ | Standard Deviation | Median ^ | Min | Max | p-Value |
|---|---|---|---|---|---|---|---|---|---|---|
| EORTC QLQ C-30 | DLT | Yes | 6 | 5 | 69.7 | 11.1 | 67.5 | 60.0 | 87.8 | 0.245 |
| No | 86 | 82 | 75.6 | 14.6 | 78.8 | 42.5 | 96.9 | |||
| CYCLE1 completed | Yes | 62 | 59 | 76.8 | 13.4 | 80.7 | 42.5 | 94.7 | 0.218 | |
| No | 30 | 28 | 72.1 | 16.1 | 73.2 | 43.1 | 96.9 | |||
| Replacement | No | 80 | 77 | 75.7 | 13.5 | 77.2 | 42.5 | 96.4 | 0.867 | |
| Yes | 12 | 10 | 72.3 | 20.9 | 79.9 | 43.1 | 96.9 | |||
| RMS | 0/1 | 76 | 74 | 75.6 | 14.7 | 77.6 | 42.5 | 96.9 | 0.252 | |
| 2/3 | 9 | 6 | 68.3 | 16.1 | 66.4 | 43.6 | 88.1 | |||
| SAE | No | 69 | 64 | 77.0 | 14.0 | 81.2 | 42.5 | 96.4 | 0.044 | |
| Yes | 23 | 23 | 70.6 | 14.8 | 67.8 | 43.1 | 96.9 | |||
| FACT-G | DLT | Yes | 6 | 5 | 68.7 | 8.8 | 71.3 | 57.4 | 79.8 | 0.331 |
| No | 86 | 81 | 74.0 | 14.4 | 75.0 | 28.7 | 94.4 | |||
| CYCLE1 completed | Yes | 62 | 58 | 73.6 | 14.5 | 75.0 | 28.7 | 94.4 | 0.959 | |
| No | 30 | 28 | 73.8 | 13.8 | 74.5 | 46.2 | 94.4 | |||
| Replacement | No | 80 | 76 | 73.4 | 14.3 | 75.0 | 28.7 | 94.4 | 0.697 | |
| Yes | 12 | 10 | 75.6 | 14.0 | 77.4 | 55.8 | 93.3 | |||
| RMS | 0/1 | 76 | 73 | 74.3 | 14.4 | 75.0 | 28.7 | 94.4 | 0.243 | |
| 2/3 | 9 | 6 | 67.9 | 14.0 | 63.3 | 55.6 | 85.2 | |||
| SAE | No | 69 | 63 | 74.9 | 14.5 | 79.6 | 28.7 | 94.4 | 0.190 | |
| Yes | 23 | 23 | 70.6 | 13.0 | 67.3 | 52.8 | 93.3 | |||
| MOSSSS | DLT | Yes | 6 | 5 | 75.3 | 30.6 | 81.9 | 23.7 | 100.0 | 0.344 |
| No | 86 | 81 | 87.8 | 15.9 | 93.4 | 19.7 | 100.0 | |||
| CYCLE1 completed | Yes | 62 | 58 | 85.9 | 18.9 | 92.1 | 19.7 | 100.0 | 0.977 | |
| No | 30 | 28 | 89.3 | 12.3 | 94.1 | 57.9 | 100.0 | |||
| Replacement | No | 80 | 76 | 85.9 | 17.7 | 92.1 | 19.7 | 100.0 | 0.155 | |
| Yes | 12 | 10 | 95.4 | 6.6 | 98.0 | 79.0 | 100.0 | |||
| RMS | 0/1 | 76 | 73 | 87.0 | 18.0 | 94.7 | 19.7 | 100.0 | 0.365 | |
| 2/3 | 9 | 6 | 84.7 | 13.9 | 88.8 | 61.8 | 100.0 | |||
| SAE | No | 69 | 64 | 87.1 | 16.4 | 92.8 | 19.7 | 100.0 | 0.659 | |
| Yes | 23 | 22 | 87.0 | 19.3 | 94.7 | 23.7 | 100.0 |
| Variable | Statistic | Replacement | Overall | p-Value | |
|---|---|---|---|---|---|
| NO (n = 35) | YES (n = 12) | ||||
| FACT-G | Mean (SD)/N | 70.9 (14.6)/34 | 75.6 (14)/10 | 72 (14.5)/44 | 0.419 |
| Median (Range) | 70.2 (28.7, 93.3) | 77.4 (55.8, 93.3) | 72.6 (28.7, 93.3) | ||
| EORTC | Mean (SD)/N | 73.5 (15.1)/34 | 72.3 (20.9)/10 | 73.2 (16.3)/44 | 0.986 |
| Median (Range) | 74 (42.5, 93.9) | 79.9 (43.1, 96.9) | 75.8 (42.5, 96.9) | ||
| MOSSSS | Mean (SD)/N | 83.8 (17.8)/34 | 95.4 (6.6)/10 | 86.4 (16.6)/44 | 0.041 |
| Median (Range) | 90.1 (19.7, 100) | 98 (78.9, 100) | 91.4 (19.7, 100) | ||
| CCI | Mean (SD)/N | 8.2 (1.7)/35 | 9 (1.5)/12 | 8.4 (1.6)/47 | 0.121 |
| Median (Range) | 8 (3, 11) | 9 (6, 12) | 9 (3, 12) | ||
| Variable | Hazard Ratio (95% CI) | p-Value |
|---|---|---|
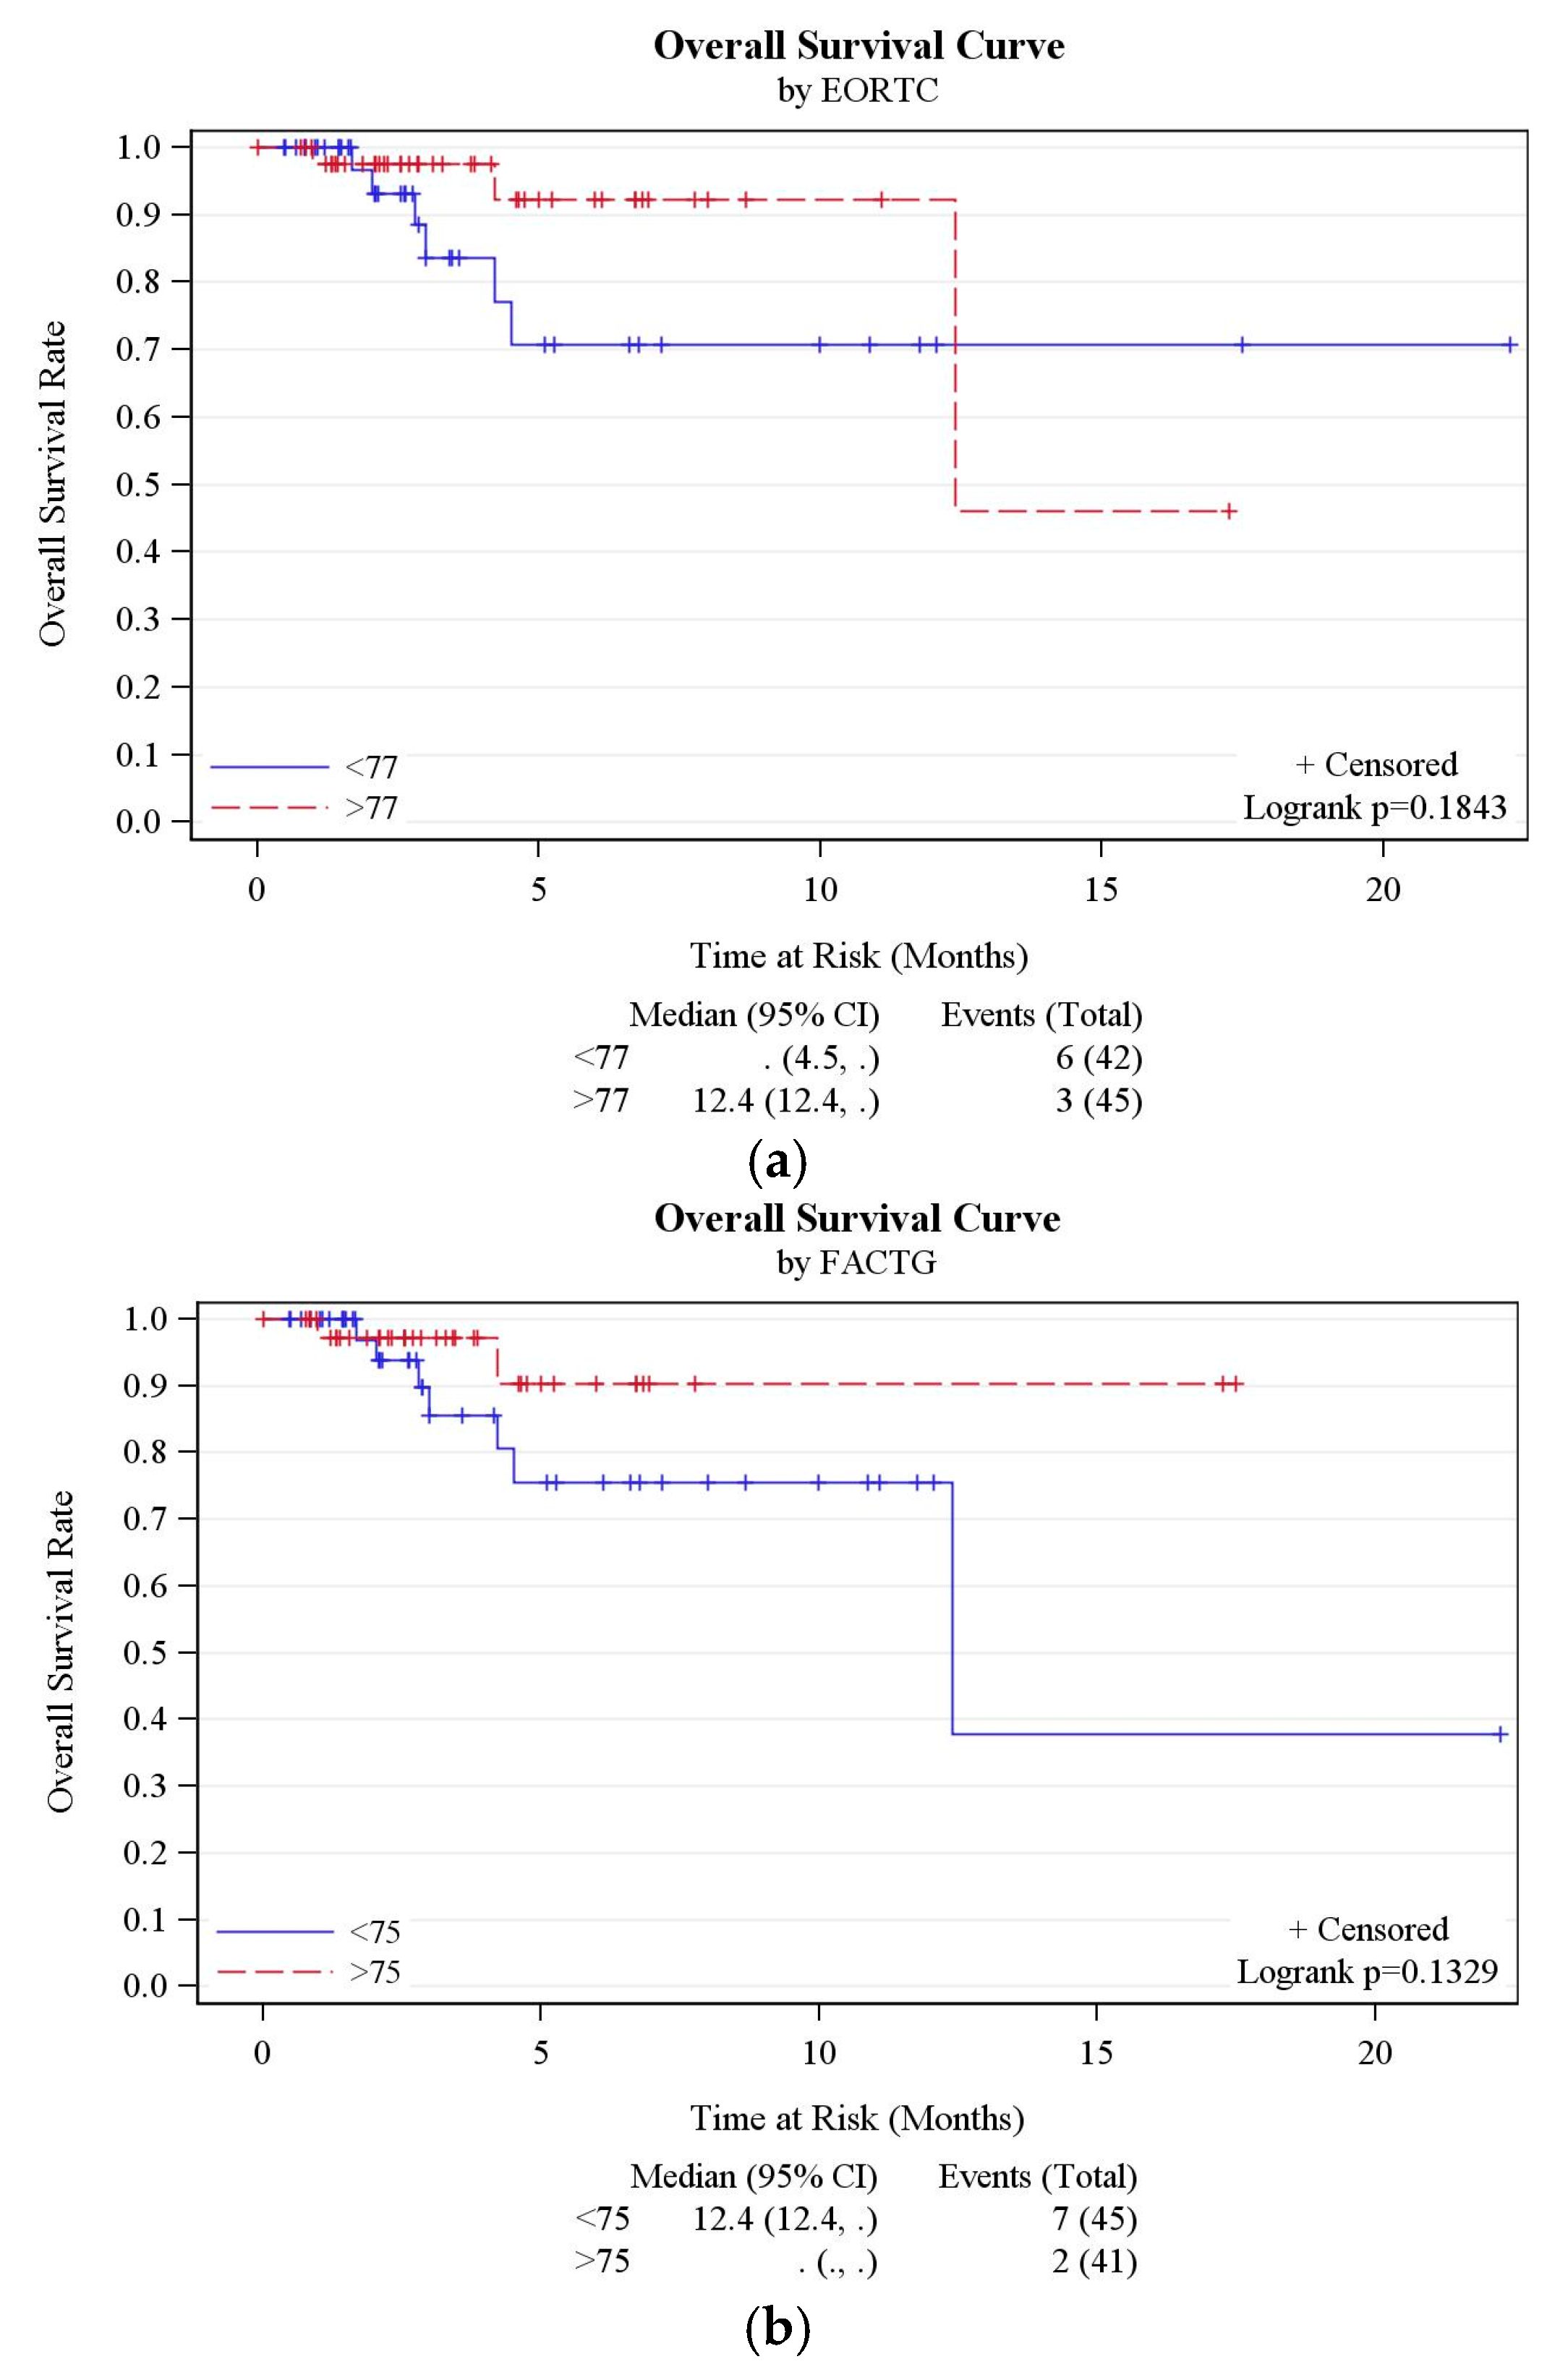
| FACT-G | 0.96 (0.91, 1.01) | 0.087 |
| EORTC | 0.97 (0.93, 1.01) | 0.133 |
| MOSSSS | 0.98 (0.95, 1.02) | 0.366 |
| CCI | 1.44 (0.89, 2.35) | 0.142 |
| RMS | 2.70 (0.54, 13.52) | 0.226 |
| FACT-G group | 3.12 (0.65, 15.04) | 0.156 |
| EORTC group | 2.47 (0.62, 9.91) | 0.201 |
| MOSSSS group | 1.47 (0.35, 6.16) | 0.598 |
© 2017 by the authors. Licensee MDPI, Basel, Switzerland. This article is an open access article distributed under the terms and conditions of the Creative Commons Attribution (CC BY) license (http://creativecommons.org/licenses/by/4.0/).
Share and Cite
Anwar, S.; Tan, W.; Hong, C.-C.; Admane, S.; Dozier, A.; Siedlecki, F.; Whitworth, A.; DiRaddo, A.M.; DePaolo, D.; Jacob, S.M.; et al. Quality-of-Life (QOL) during Screening for Phase 1 Trial Studies in Patients with Advanced Solid Tumors and Its Impact on Risk for Serious Adverse Events. Cancers 2017, 9, 73. https://doi.org/10.3390/cancers9070073
Anwar S, Tan W, Hong C-C, Admane S, Dozier A, Siedlecki F, Whitworth A, DiRaddo AM, DePaolo D, Jacob SM, et al. Quality-of-Life (QOL) during Screening for Phase 1 Trial Studies in Patients with Advanced Solid Tumors and Its Impact on Risk for Serious Adverse Events. Cancers. 2017; 9(7):73. https://doi.org/10.3390/cancers9070073
Chicago/Turabian StyleAnwar, Sidra, Wei Tan, Chi-Chen Hong, Sonal Admane, Askia Dozier, Francine Siedlecki, Amy Whitworth, Ann Marie DiRaddo, Dawn DePaolo, Sandra M. Jacob, and et al. 2017. "Quality-of-Life (QOL) during Screening for Phase 1 Trial Studies in Patients with Advanced Solid Tumors and Its Impact on Risk for Serious Adverse Events" Cancers 9, no. 7: 73. https://doi.org/10.3390/cancers9070073