
Wearable Food Intake Monitoring Technologies: A Comprehensive Review


Abstract
:1. Introduction
1.1. Goals of The Review
- Up-to-date review of recent novel approaches: There is a lack of comprehensive survey papers surrounding the current state-of-the-art in wearable food intake monitoring. The wide range of food intake monitoring and wearable dietary assessment approaches carry different advantages and drawbacks. Considering that increasingly more research is aimed towards objective dietary assessment, up-to-date reviews of technology and methodology are needed for this field.Some previous surveys in this field have been created in the past. Amft [10], and Fontana and Sazonov [11] each bring about a thorough survey that addresses a wide range of topics on chewing and swallowing detection using wearable sensors. Amft and Troster [12] also generated a short survey comparing sensors in different body locations. Although the reviews mentioned above provided an important milestone for food intake detection and characterization, these reviews mostly focus on sensor hardware, and do not provide detailed comparison between wearable technologies in food intake monitoring needed to make an informed decision on which sensing platform to use. As a result, we build on prior surveys to cover the more recent approaches in wearable sensors on food intake monitoring.Recently, there have been a few other surveys related to food intake measures. Burke et al. [13] focus on note-based approaches including a discussion on electronic diaries (personal digital assistant), but not wearable sensor technology. Fischer [14] provides a fair amount of prior work, however focuses mainly on automated chew event monitoring using chewing sounds. Stumbo [15] provides a detailed review of visual (camera-based) approaches of food intake monitoring. Kalantarian et al. [16] honed in on piezoelectric- and audio-based approaches for food intake monitoring. However, these surveys fall short of discussing the trade-offs of each sensing approach needed to make an informed decision, including sensing algorithms and comfort assessment.
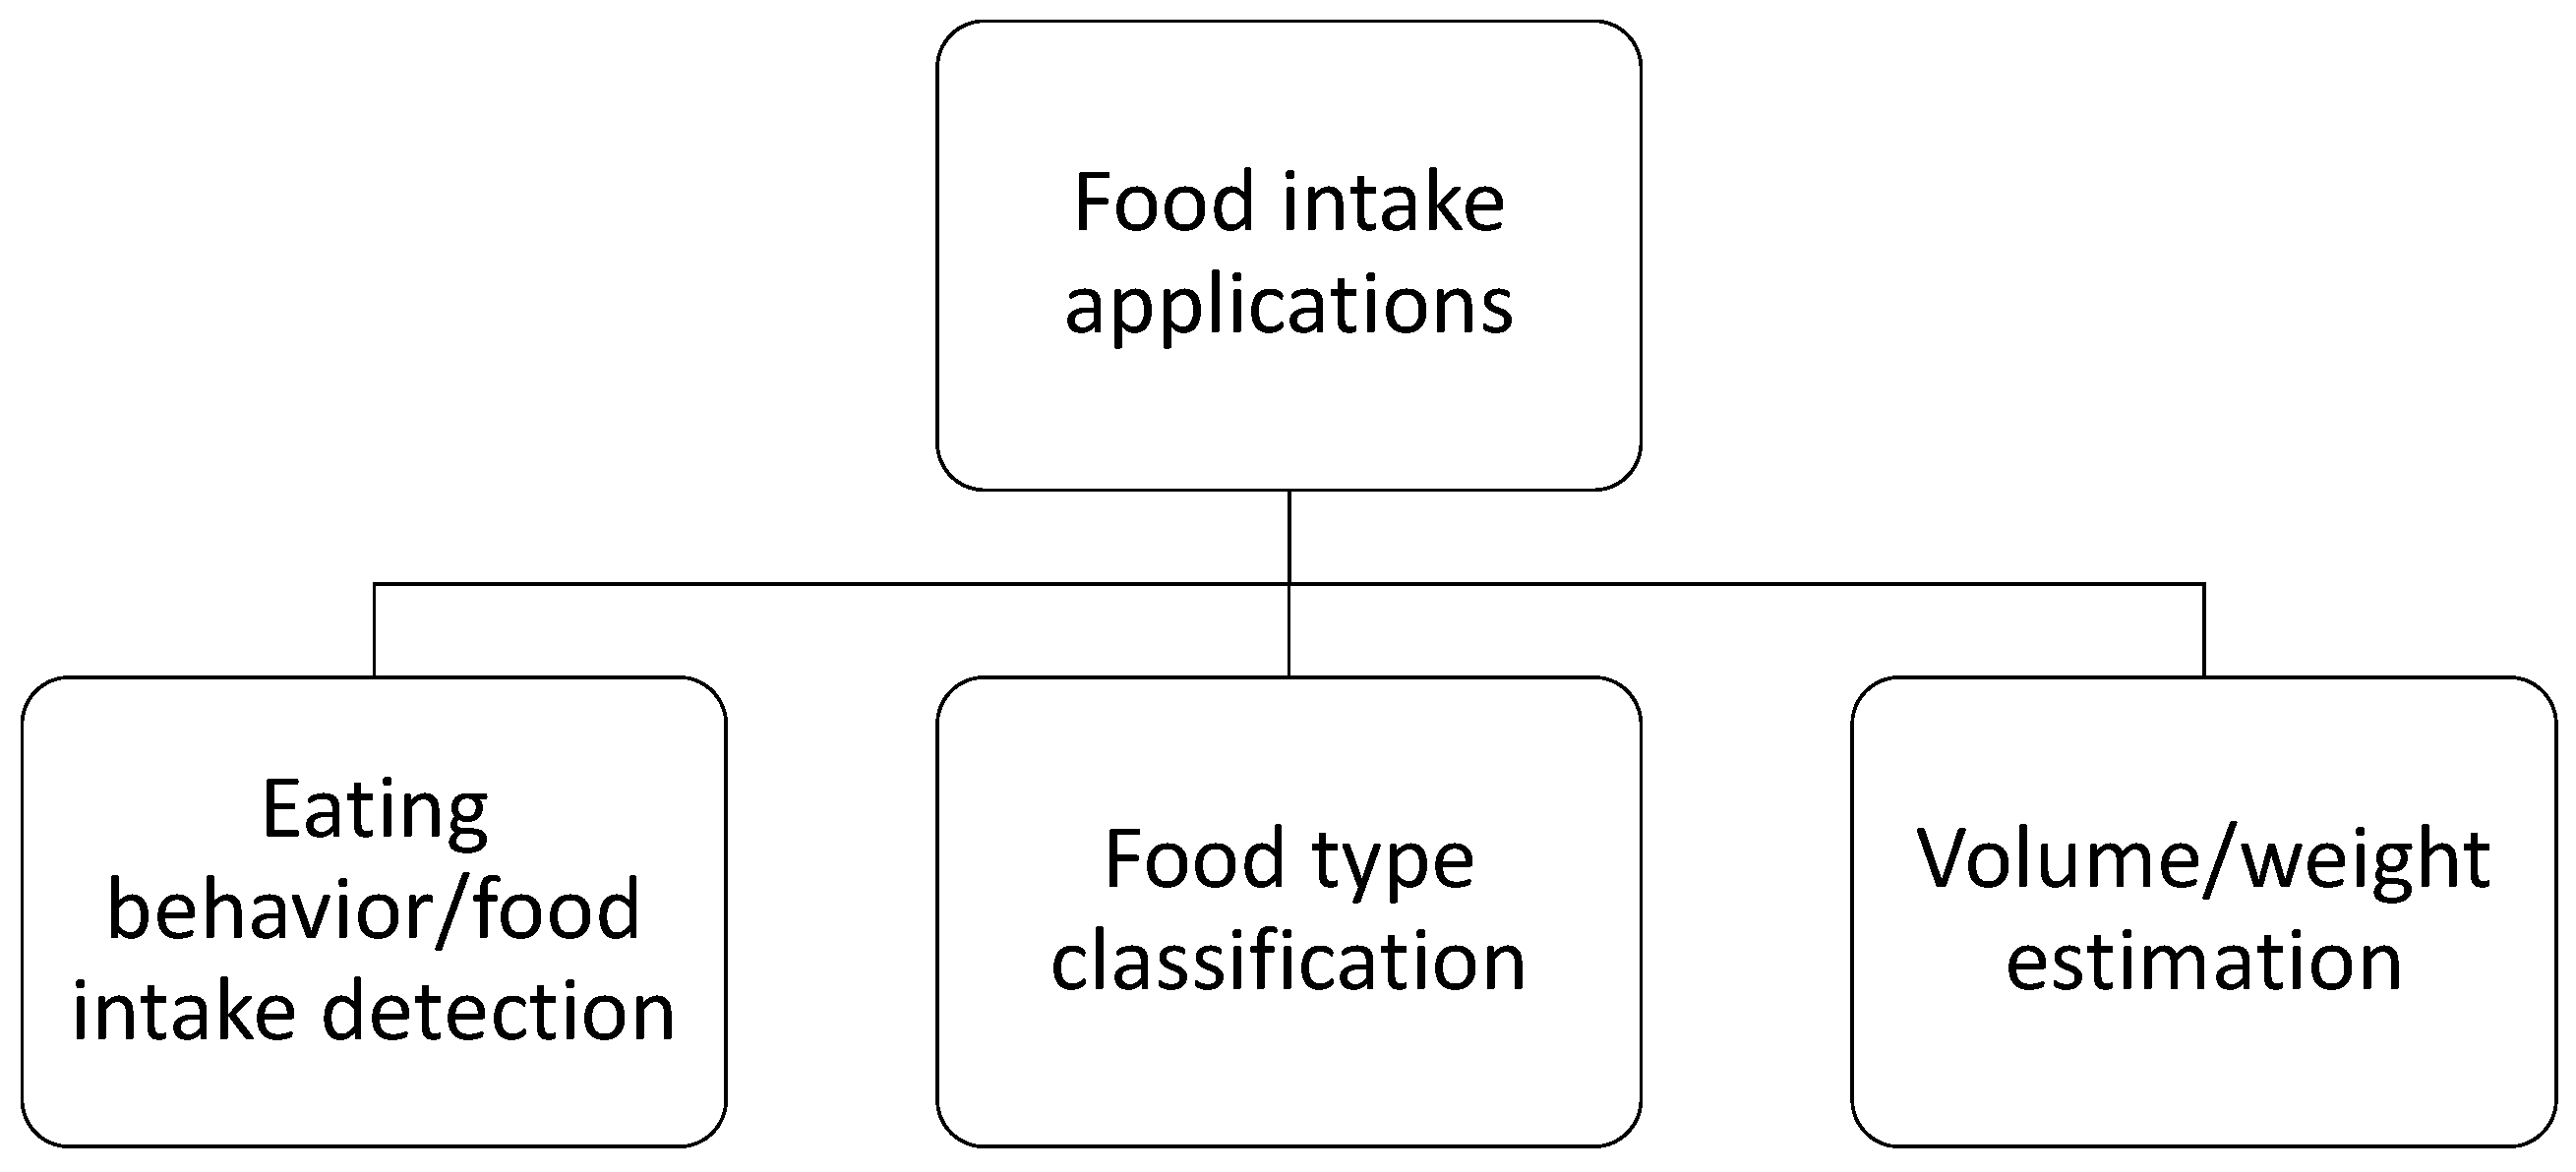
- Application-oriented review: In this review, we focus not only on modalities but also on food intake applications. Approaches are classified based on these applications: eating behavior determination, food type classification, and volume/weight estimation. By using this differentiation, a comprehensive comparison can be established comparing drawbacks/advantages as well as signal processing analytic approaches. Real-life applications are likewise mentioned creating a clearer connection between the application and the corresponding wearable sensor.
- Signal processing and machine learning-oriented review: Recognizing that signal processing plays a vital role in analyzing data from wearable sensors for food intake monitoring, we will focus a section on analyzing signal processing methods to investigate various approaches of data acquisition and feature extraction. Schemes are classified based on food intake monitoring applications: eating behavior/food intake detection, volume estimation and food type classification. In these signal processing procedures, we will provide an exhaustive survey of specific classification algorithms. Tamura and Kimura [17] provide a review on wearable food intake monitoring but do not significantly address signal processing.
1.2. Organization of this Survey
2. Background
2.1. Food Intake
2.2. Food Intake Monitoring
2.3. Related Works on the Manual Approach
- Conventional self-report method: There have been several attempts to monitor food intake by self-report on paper. Block [34] comprehensively analyzed the validation, agreements with known results and conclusions regarding self-report methods, such as the history method, the 24-h dietary recall method and the seven-day method. Bingham [35] represented a clearer comparison between methods instituted by showing the percentages of errors in each method in people who finally completed the survey. As in the review, the percentages misclassification of results into quartiles of the distribution of nutrition intake are around 10%, and only 15% of participants completed the method. Moreover, self-report methods discourages people from taking part in food intake monitoring due to lack of convenience [35].
- Self-report method using smart phones: With the popularity of smart phones, self-report approaches have improved in convenience and time to complete self-monitoring. The network capability on a smart phone also allows this approach to have more features, such as a quick response from doctors and real-time self-monitoring. Wohler [36] developed a food intake survey system on the Motorola Q9h smart phone. The system allows participants to record full days of meals and to send the data to an SQLite database for analysis in the background. The system provides improved user experience than the paper self-report approach. A similar approach by Tsai et al. [37] had a comparable process to Wohler et al. [36], but focuses particularly on calorie intake.
- Food frequency questionnaire: The manual approach in dietary assessment also involves using food frequency questionnaires (FFQ), using questionnaire systems (e.g., applications, websites, etc.) to collect food consumption frequency of foods and beverages over a period of time, but not for every single meal. For example, Fellaize [38] developed an FFQ system called Food4Me to gather food intake data for every four-day period. Besides, Green [39] also generated an FFQ method named 3-d weighed food record (3d-WFR) with a three-day frequency.
2.4. Existing Works on the Automatic Approach
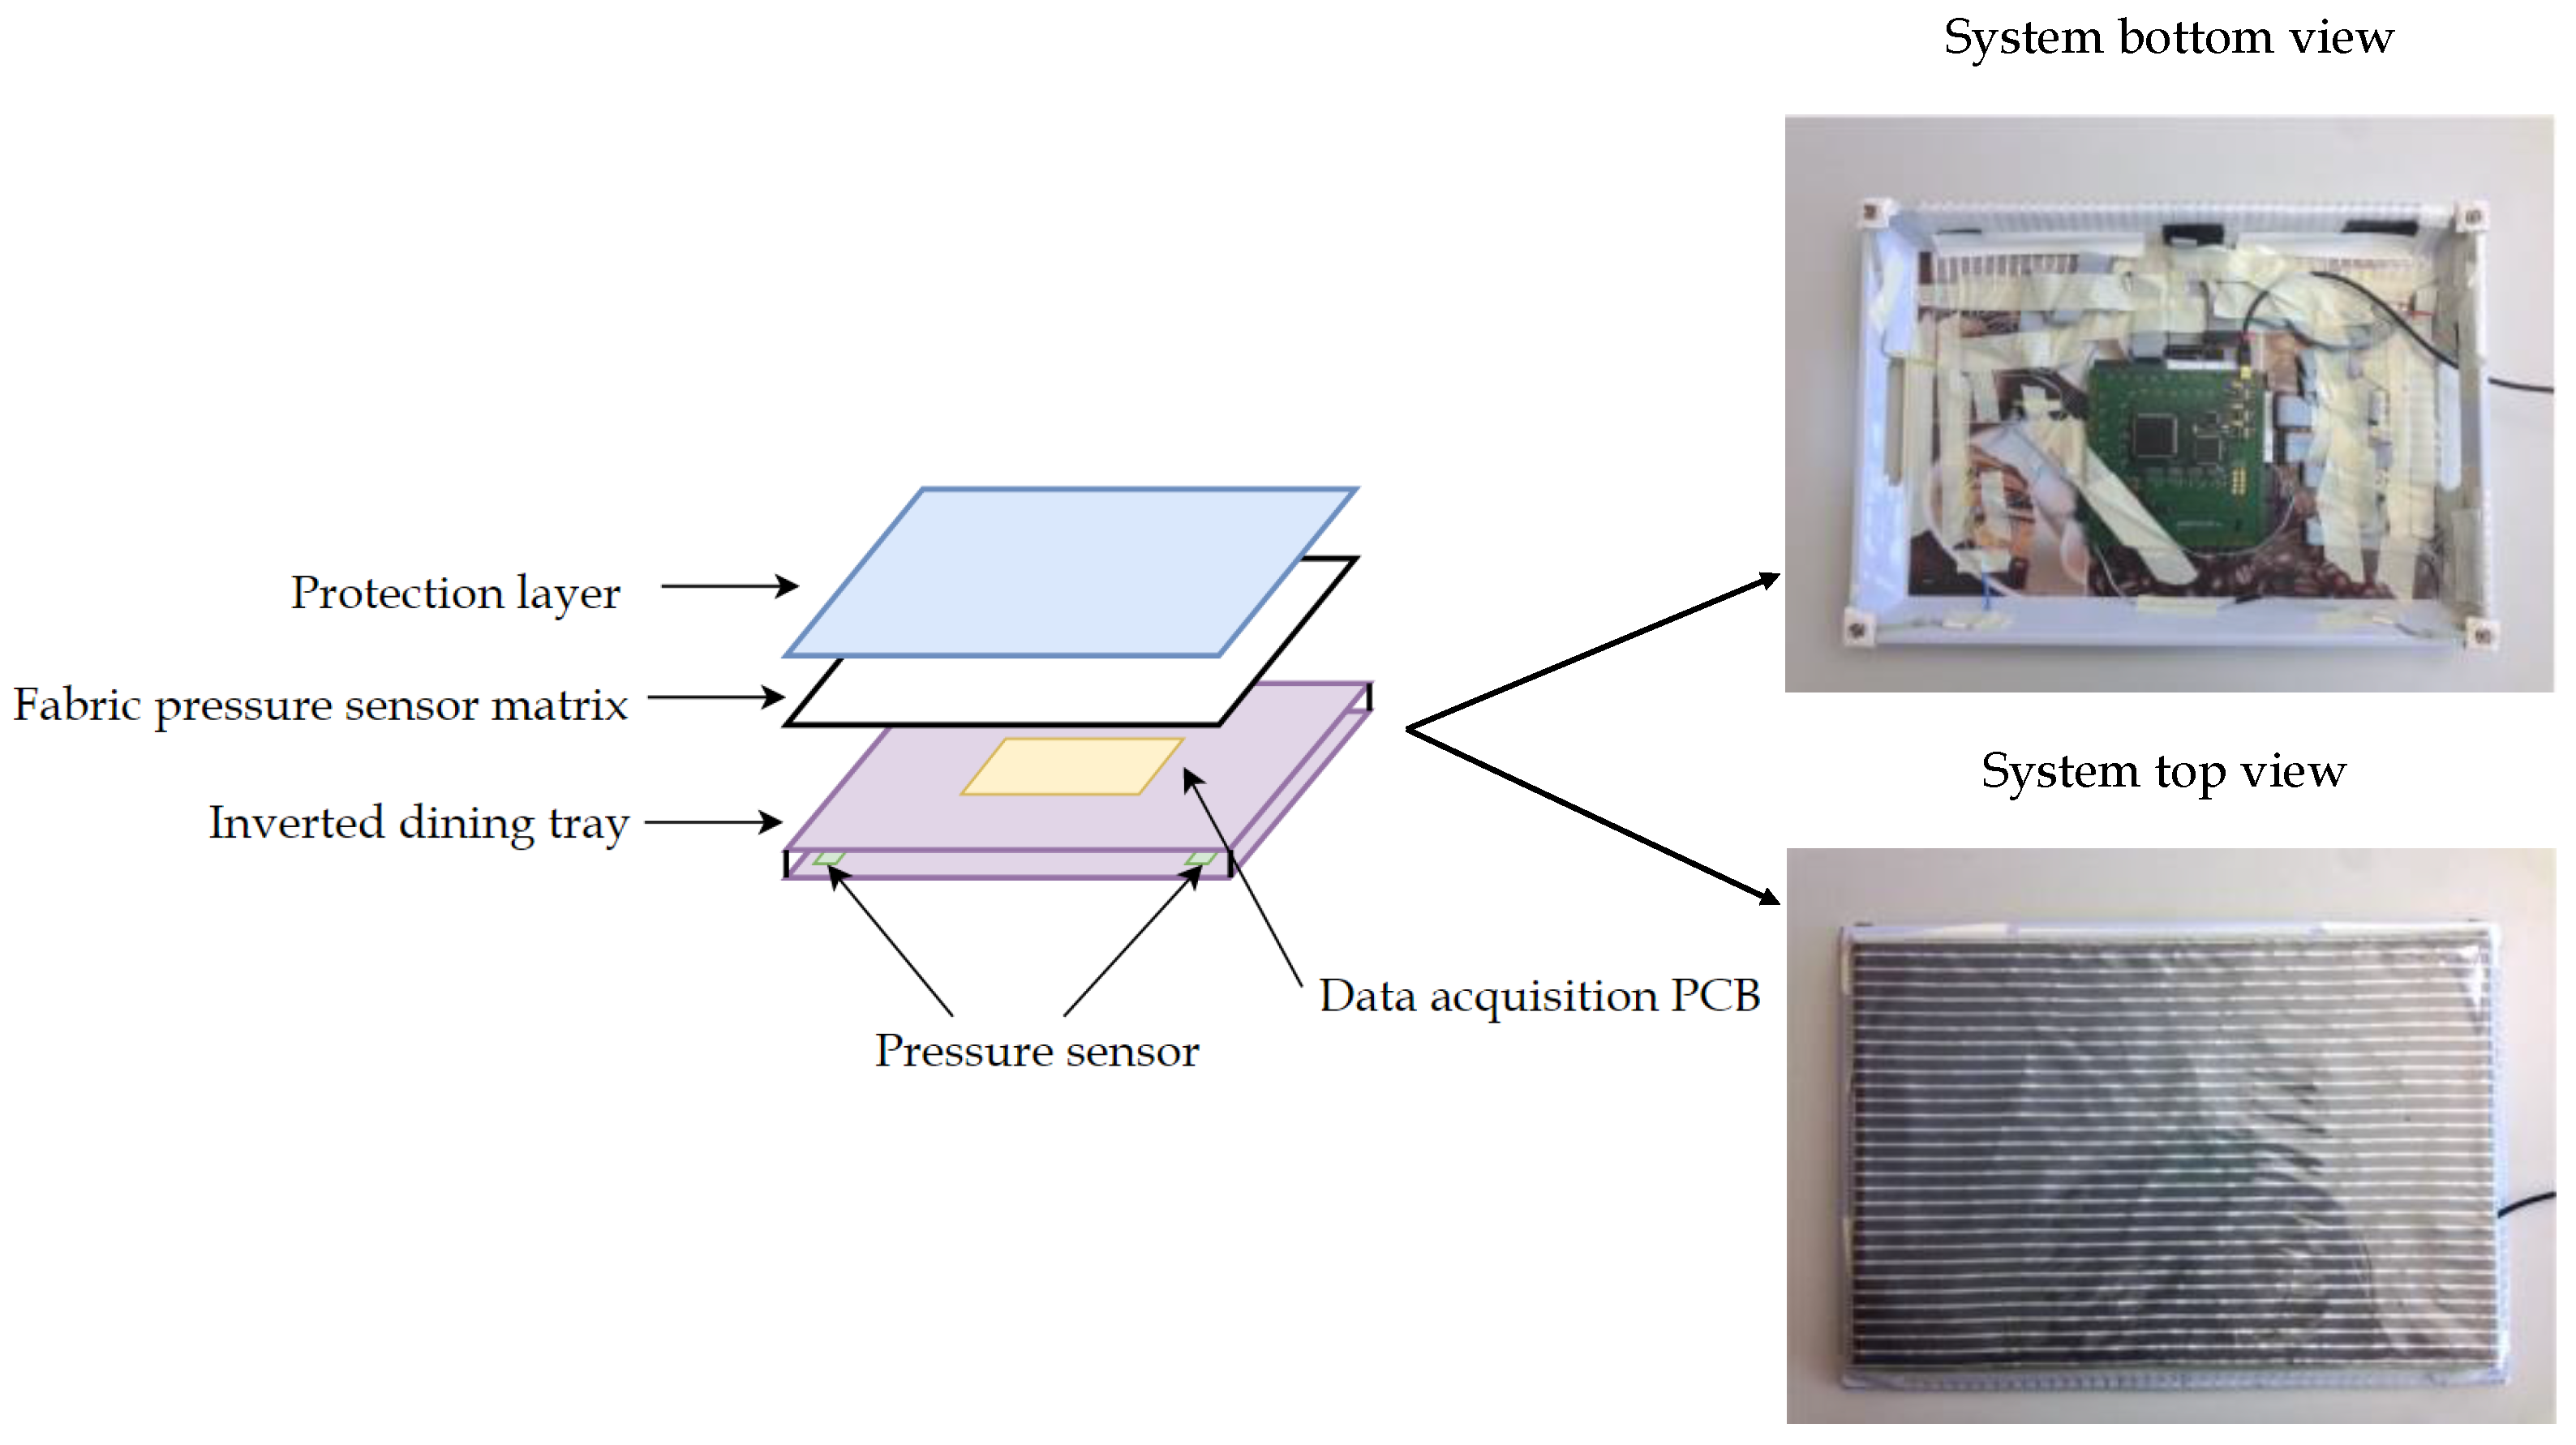
- Pressure method: The pressure method takes advantage of force sensors embedded in a tablecloth or underneath a table. This approach is not wearable, but is novel in food intake monitoring. The earliest study about the pressure approach was performed by Chang et al. [41]. The research exploits a weight sensor enclosed under the table. This weighing surface can measure the amount of food transferred between parts of the table and the amount of food consumed by each person at the table when there are changes in the plates’ weight. In order to detect and distinguish how people eat a weight matching algorithm is designed, taking into account changes in weight on different plates. The accuracy of this method is approximately 80%, showing a promising start for a novel approach. Recent research using pressure sensors was conducted by Zhou et al. [42], shown in Figure 3. This system is basically a pressure sensor with the upper layer serving as both protection and a dining surface. Specific eating actions (e.g., cutting, scooping and transporting food) are detected when someone dines on this tablecloth. The sensor is less of a burden than the one in Chang et al. [41]. However, it is capable of detecting only eating movements without either weight estimation or food classification.
- Surveillance-video method: In contrast to wearable camera approaches, which will be discussed in Section 5.2, the surveillance-video approach employs an external camera for automatic food intake detection. Cadavid et al. [43] developed an active appearance model system for chewing detection based on captured images of the human face from an external camera during the eating process. The chewing detection is marked by the quasi-periodic nature of chewing fetched in the model parameters.
- Doppler sensing method: Another existing automatic approach to food intake monitoring is using microwave Doppler motion sensors. Tanigawa et al. [45] explored the use of the Doppler effect in their system to sense the Doppler signal of mastication produced from vertical jaw movements. The distinct moving speed of the jaw during mastication is determined from the equation of the relationship between Doppler frequency and moving speed.
2.5. Why a Wearable-Based Approach?
3. Applications of Food Intake Monitoring
3.1. Objective Measure of Caloric Intake
3.2. Detection of Eating Behavior
3.3. Inpatient Hospital Care
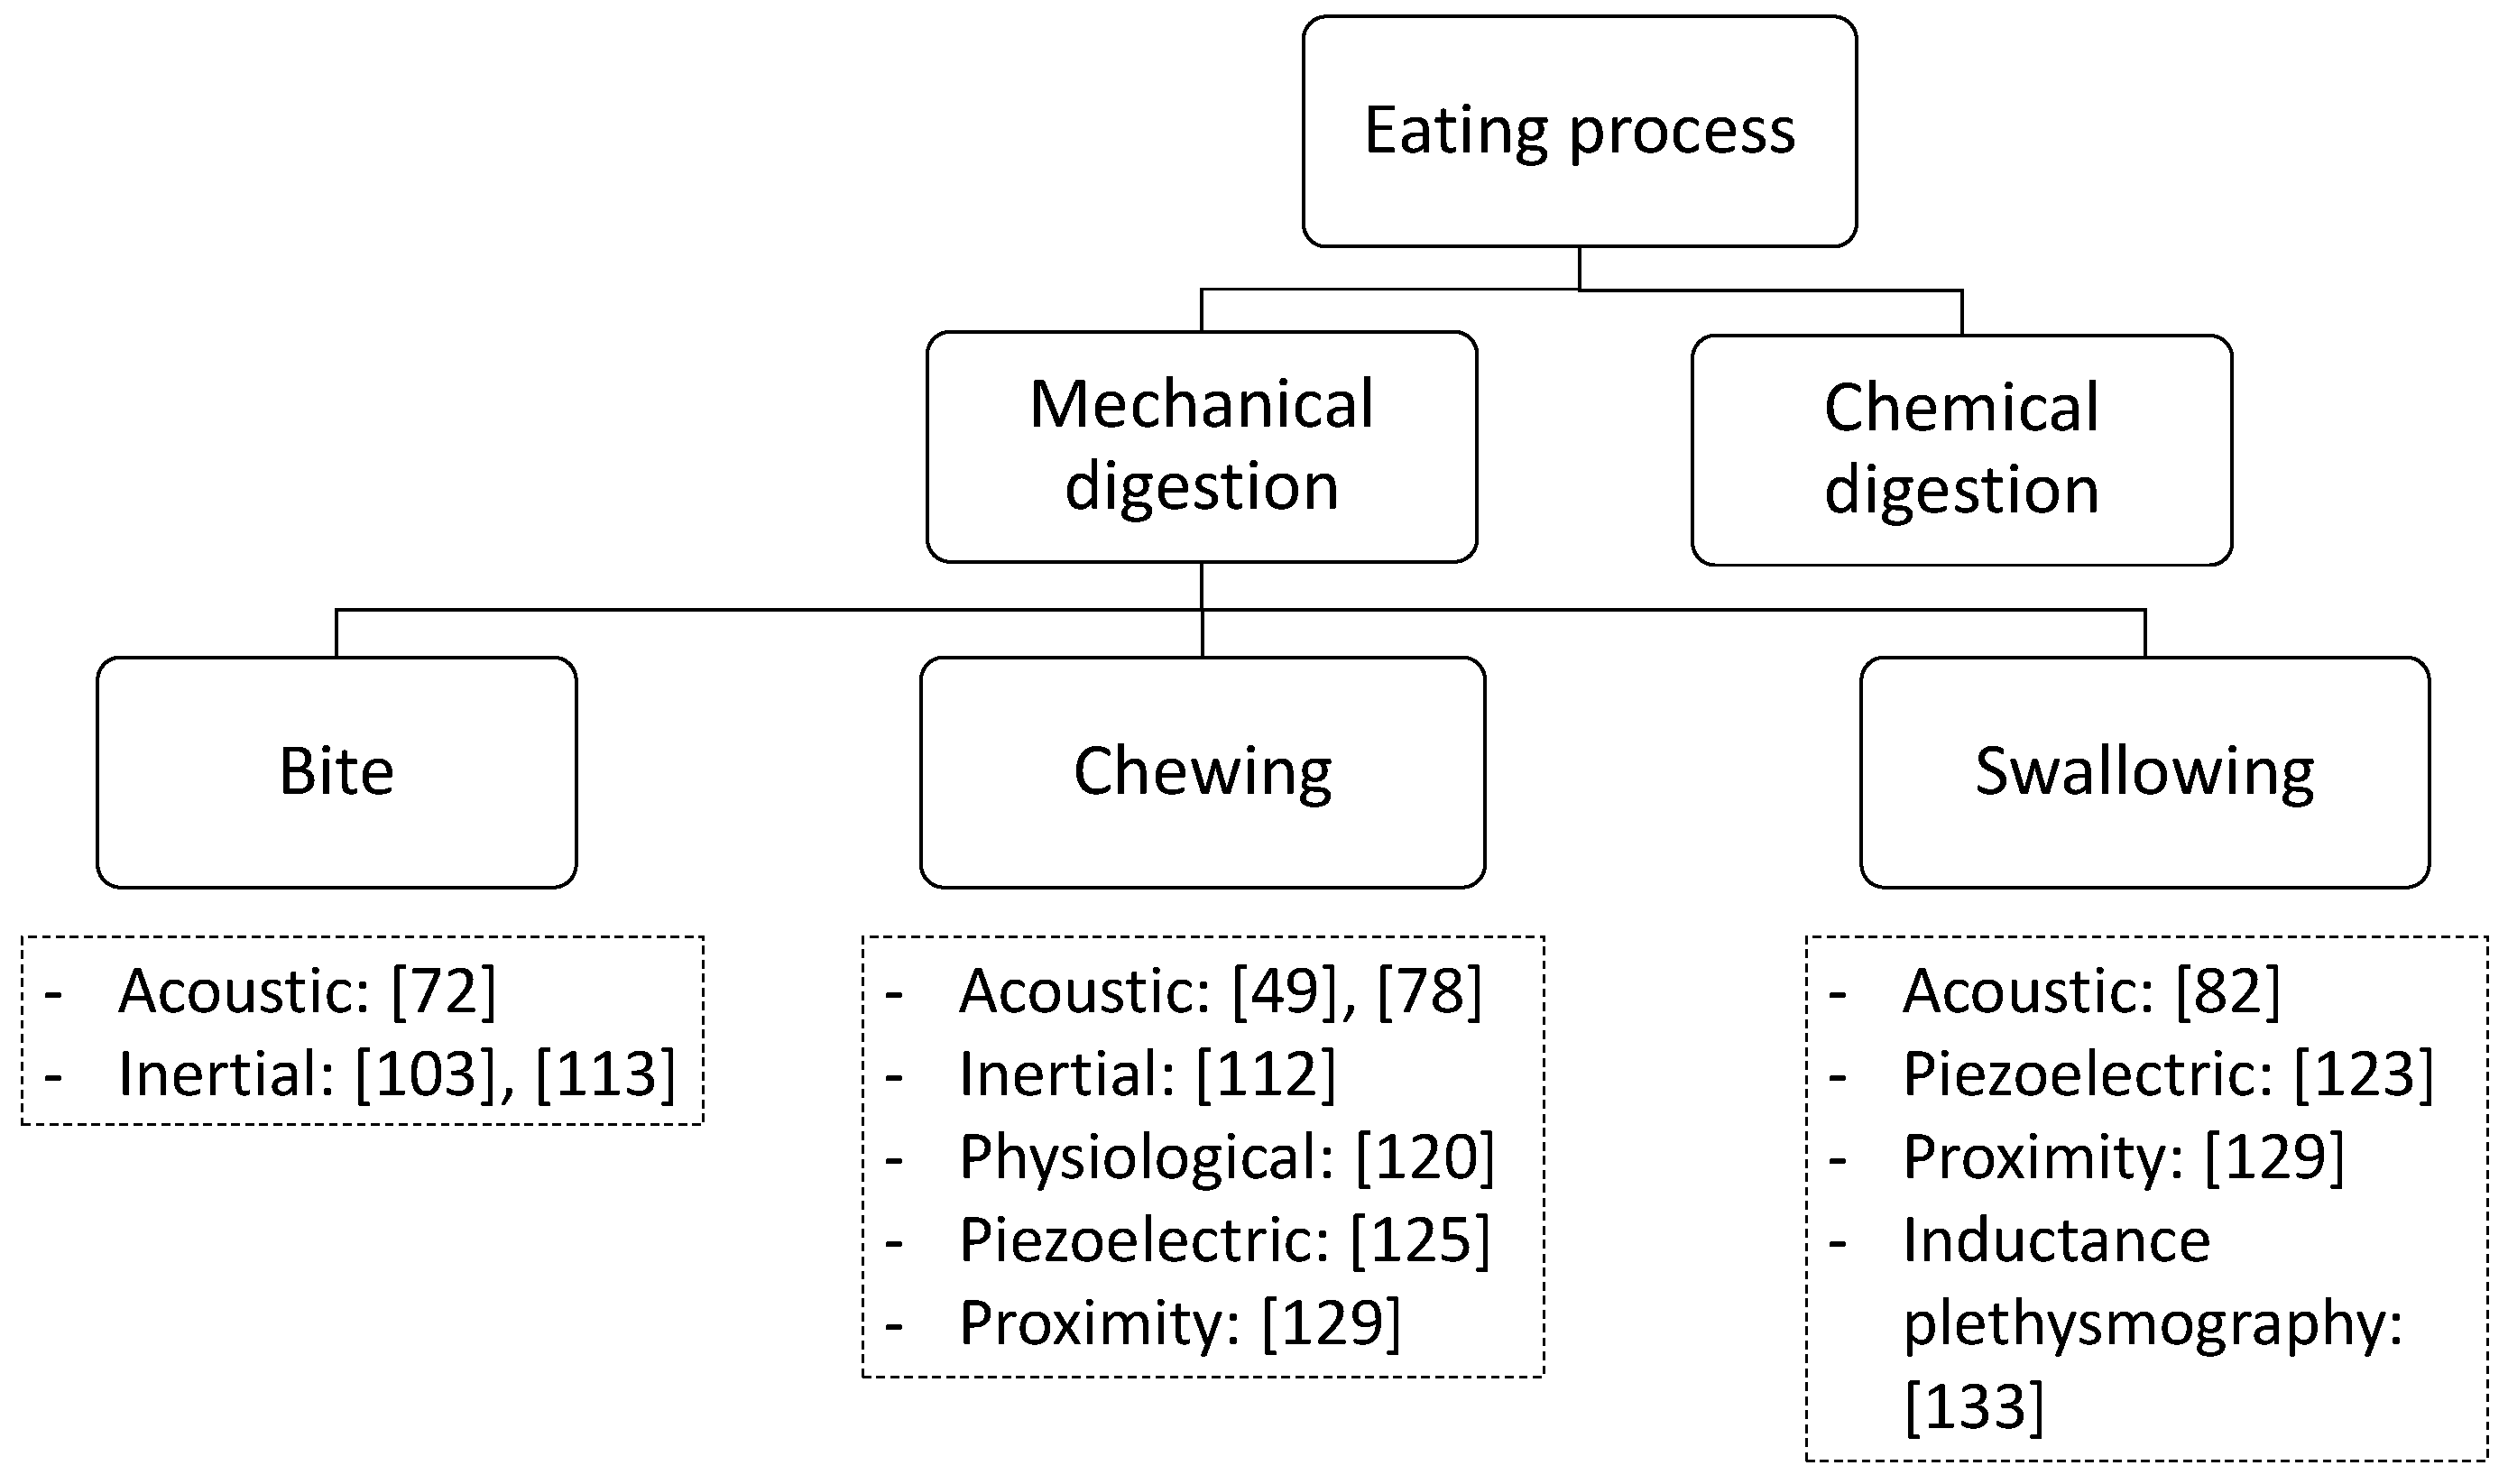
4. Food Intake Mechanisms
- Mechanism of bite: Bite is recognized as the very first stage in food intake. It involves two main steps: movement of wrist and hand to transport food to the mouth and movement of jaw muscles to take a bite. Wrist movements are typified by characteristic rolling motions (pronation and supination) to deliver food from cutlery to mouth [51]. Following this is the jaw movements for the mouth to obtain the food. The lateral pterygoid muscle is responsible for the abduction of jaw (opening mouth), while temporalis, masseter and medial pterygoid muscles assist the adduction (closing mouth, moving mouth side to side and grinding teeth) [71].
- Mechanisms of chewing (mastication): The mechanical digestion involves the physical degradation of food [72]. This digestion occurs mainly from the mouth, passing through the pharynx and esophagus. It starts in the oral digestion with the mastication process, or chewing, to produce bolus, which is later swallowed down into the esophagus [73]. In greater detail, during the oral process, the ingested food is moved from the front of the mouth to the teeth so that it can be broken down by crushing and grinding with the teeth [74]. The jaw’s muscles’ movements in this stage are similar to those in the mechanisms of bite with continuously indicative motions of lateral pterygoid and temporalis muscles to open and close the mouth [71].
- Mechanisms of swallowing: The process begins with the voluntary phase. The bolus, after being formed by folding and manipulating the mixture of food particles and saliva with the tongue, is moved into the back of the tongue to prepare for swallowing [27]. In the involuntary pharyngeal phase, the swallowing reflex is triggered to open and close the upper esophageal sphincter. During this phase, pharyngeal constrictor muscles push the bolus into the esophagus via a stripping action. The last phase, the involuntary esophageal phase, consists of continuous peristalsis by sequential contraction of the superior, middle and inferior pharyngeal constrictor muscles of the esophagus to push the bolus to the stomach [75,76]. These movements of smooth and striated muscles in pharynx and esophagus play a vital role in the source of input for wearable sensors.
5. Wearable Sensing Approaches
5.1. Acoustic Approach
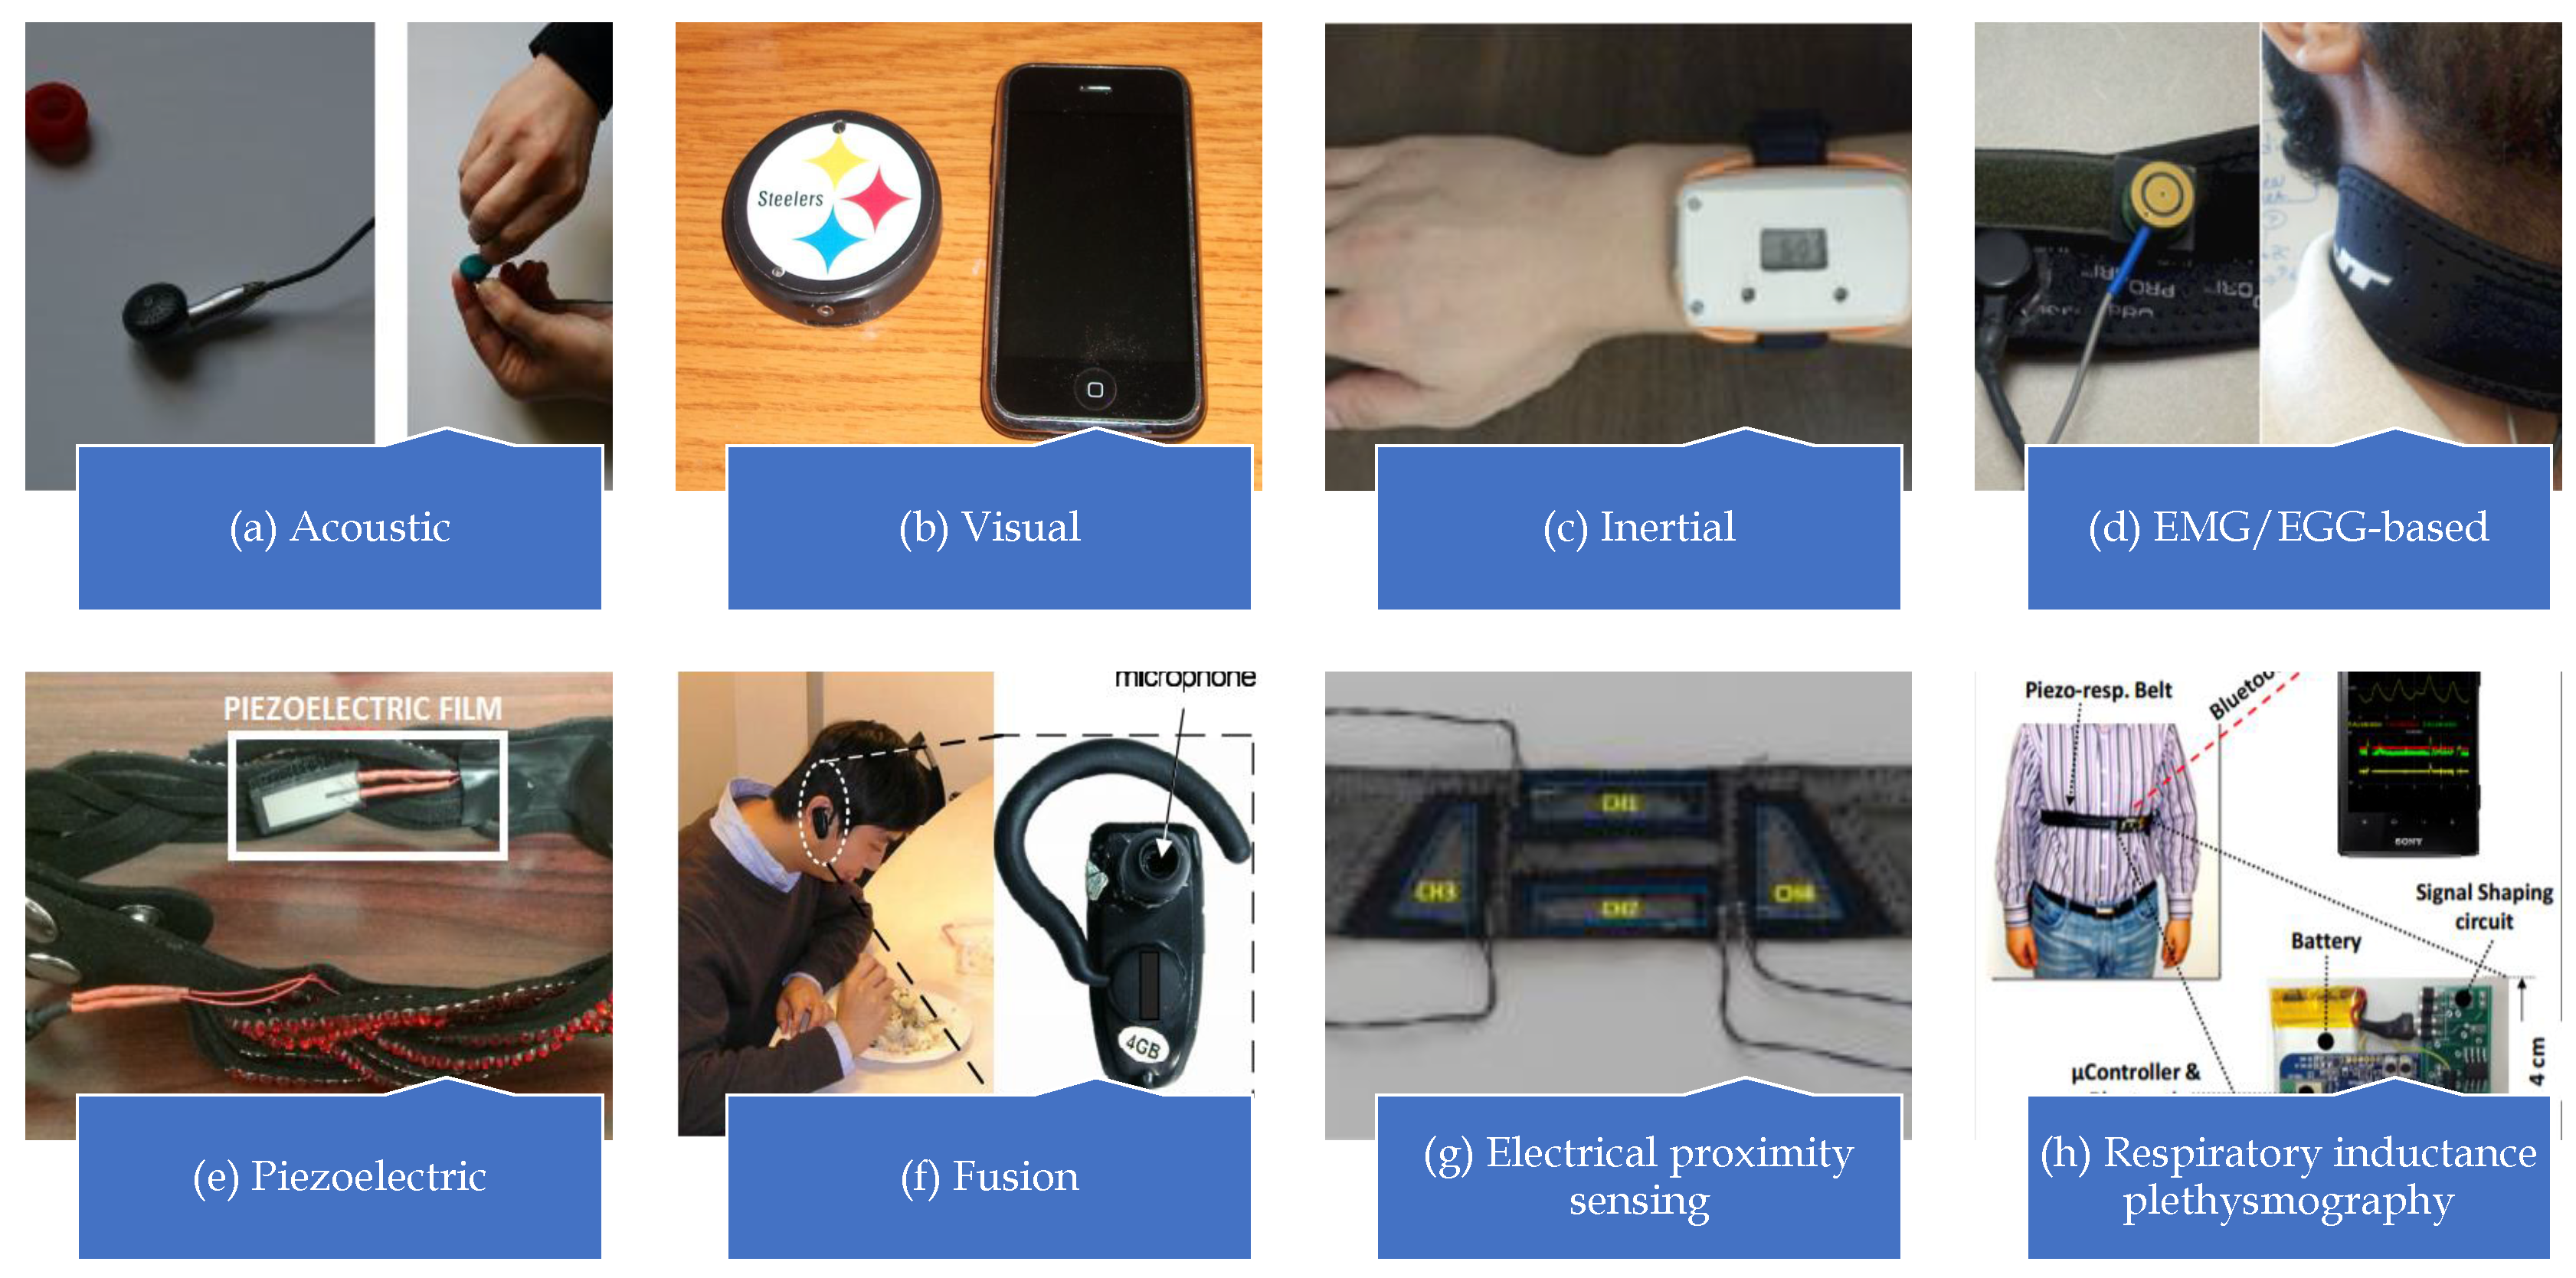
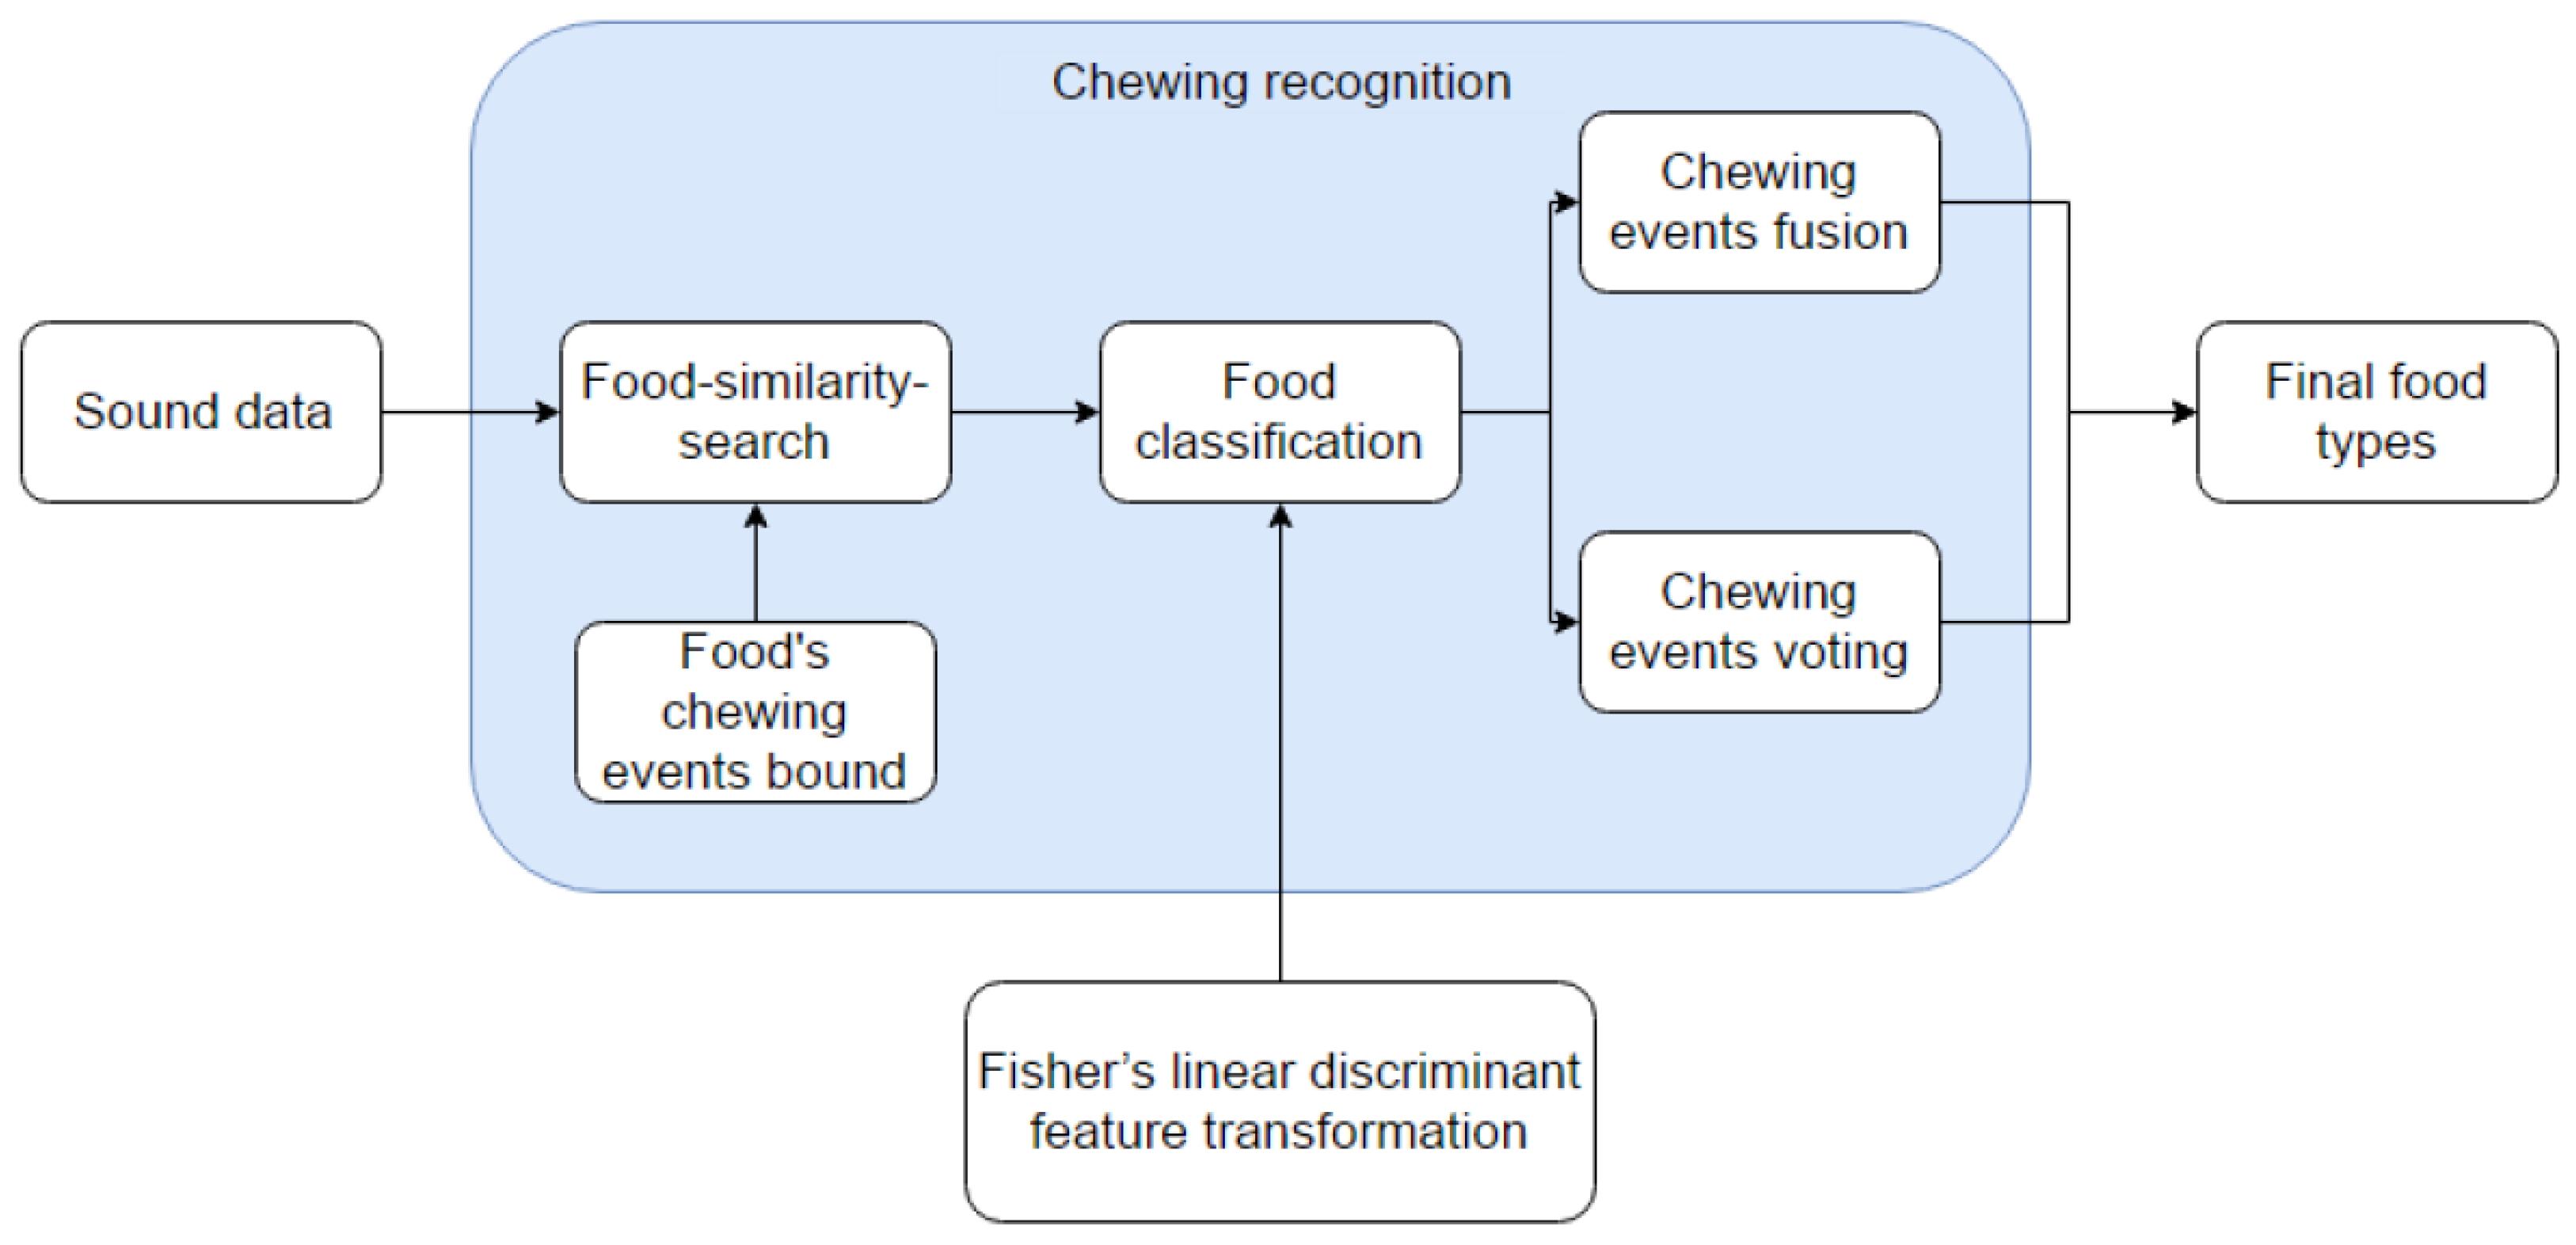
- Chewing detection: Detecting and assessing chewing sound by acoustic means has become one of the most appealing topics in food intake monitoring. It attracts increasingly more research in this field day-by-day. Overall, existing approaches focus on using wearable systems, such as microphones, to accumulate sound waves, employing a certain methodology for classifying and analyzing chewing events. Amft [49] specified their vibration-based detecting system using a condenser microphone embedded in an ear pad for food classification, which is demonstrated in Figure 4a. Amft et al. [77] further expanded the food classification to chewing and bite weight recognition. The chewing recognition procedure employs the chewing sequences, waveforms of sounds indicating chewing captured by ear pad sensors. The chewing sequences are distinguished by the feature similarity search event recognition algorithm. This chewing detection later leads to the bite weight recognition from micro-structure variables. Their sound-based recognition system for bite weight shows high accuracy results with only 19% error on one type of food: apple. However, the study only includes three kinds of food (apple, potato chips and lettuce), which is insufficient to make comprehensive conclusions about the effectiveness of this approach. Another study from Amft et al. [78] goes into an in-depth analysis of chewing sounds, as well as specifies the methodology of the procedure and the most appropriate position of the microphone (inner ear, directed towards the eardrum).There is a number of other research studies relating to automatic chewing detection. One of them is from Yatani and Truong [79], which is adept at differentiating chewing events from, as well as the softness of the food from the collected sounds. In addition, Olubanjo et al. [80] concentrated on differentiating chewing acoustic events from noisy surroundings with a template-matching method. The study shows a positive result of up to 83.3% on relatively sizeable data samples (13 different tasks, including five solid, four liquid food and four tracheal and non-tracheal events) to support the validity of the result. A similar approach developed by Pabler and Fischer [81] is also capable of detecting chewing sounds. Pabler and Fischer [82] further utilized this method by developing a low computational cost algorithm for detecting food intake sound. Similarly, Pabler et al. [83] took advantage of chewing sound in the breakdown process detected by the sensor system in the outer ear canal. Other studies that are likewise capable of detecting chewing events with the count numbers of chewing and food texture classification are proposed in [84,85].The microphone is not the singular sensor for this approach. A strain sensor is also feasible for detecting vibration in chewing events. Sazonov and Fontana [86] embedded a strain sensor below the outer ear to capture the motion of the lower jaw caused by the posterior border of the mandible’s ramus relative to the temporal bone [87].
- Swallowing detection: Swallowing detection is basically parallel to chewing detection since swallowing is the next phase of chewing in mechanical digestion. The acoustic approach is also feasible for this detection. As mentioned in Section 4, swallowing consists of the open/close of the upper esophageal sphincter and the pushing of bolus by peristaltic waves, which are significant sources of vibration.Several significant studies on wearable sensor have been proposed on this type of food intake detection. Sazonov et al. [87] developed a system containing a throat microphone placed over the laryngopharynx in the throat. The signal is strong in this position because it is close to the origin of the swallowing sound. Moreover, the system includes the hardware/software parts for capturing and scoring sounds’ data. Sazonov et al. [64] analyzed in greater detail the methodologies for the acoustic detection of swallowing events. The proposed methods for detection are based on the following time-frequency decompositions: msFS (mel-scale Fourier spectrum) and WPD (wavelet packet decomposition) with classification performed by support vector machine (SVM). Overall, the method shows sufficient results of approximately 86.7% with a test size of 80 subjects.
- Combined chewing/swallowing detection: Since chewing and swallowing processes correlate with each other, fusion approaches can be employed to detect their events continuously. Lopez-Meyer et al. [88] proposed an SVM model-based approach to detect food intake period from information extracted from the instantaneous swallowing frequency (ISF) signal and the binary indicators of chewing. In another study, Kalantarian et al. [89] generated spectrograms for audio clips corresponding to four types of swallowing and chewing events (sandwich chews/swallows, water swallows and no action) and afterward applying feature extraction for distinguishing those events. Other methods do not focus on chewing and swallowing events, but on food classification. AutoDietary from Bi et al. [90] is a significant example. It is shown to have positive performance in distinguishing solid food and liquid food with the results of 99.7% and 97.8% accuracy, respectively.
5.2. Visual/Camera Approach
5.3. Inertial Approach
- Gyroscope: MEMS (microelectromechanical systems) gyroscopes are suitable for the wrist motion in automatic food intake monitoring because they belong to the nano-scaled vibrating structure gyroscope that is identical to rotating movements. One of the most pioneering method in this approach is developed by Dong et al. [51,106,107,108,109]. The device in this method, which is illustrated in Figure 4c, applies the MEMS gyroscope to automatically track wrist motion every time the users take a bite of food from the radical velocity [51]. The system is capable of getting a positive result with 80% accuracy for detecting bite events across 139 meals with restricted food selection in the laboratory condition. In another method, Scisco et al. [110] took advantage of the relationship between wrist motion and bite and likewise employed the gyroscope in the device.
- Accelerometer: The accelerometer is also taken into account for the inertial approach. Since motions and the types of this sensor vary, different research in this field is performed. For example, Thomaz et al. [111] described a method using a three-axis accelerometer embedded in a smart watch, which attempts to recognize the eating process, food types and food intake amount. A similar approach, developed by Mendi et al. [112], is even adept at sending data from the accelerometer to the smart phone via Bluetooth. In another advance in the most recent study, Ye et al. [113,114] proposed an automatic structure using two accelerometers simultaneously: wrist-worn and head-mounted accelerometers on such devices as the Pebble Watch and Google Glass to detect chewing events and eating duration with high accuracy: 89.5% in a dataset of 12,003 epochs in which 3325 epochs are chewing-related under the laboratory condition. Another similar inertial system developed by Amft et al. [115] employed four motion sensors at two positions on each arm (upper and lower) to detect drinking and eating gestures and further to detect chewing and swallowing sounds. The accuracy of this system is significant, of approximately 94% among four types of gestures (cutlery, hand, spoon and drink) with two subjects in its experiment. Besides being utilized in the arm positions, a three-axis accelerometer can be embedded in the temple of glasses to detect the intake of crunchy food [116]. In addition, apart from the three-axis accelerometer, Wang et al. [117] exploited a single axis accelerometer embedded in flexible types of wearable objects (glasses, filler, earphone) to detect chewing frequency generated by the temporal muscle.
- Gyroscope-accelerometer combination: A combination of gyroscope and accelerometer provides an alternative method for the inertial approach. Eskandar [118] embedded two three-axis accelerometers and a two-axis gyroscope for bite detection. However, despite utilizing six axes, the accuracy is humble, with only 46% for single bite recognition across 22,383 manually-labeled bites. It proves that the amount of gyroscope/accelerometer with the related number of axes is not proportional to the detection’s accuracy.
5.4. Physiological Approach
- EGG sensor: The EGG sensor utilizes the motion-induced variations of the electrical impedance, as the amplitude and/or phase change of high-frequency voltage, between two electrodes positioned on the larynx [119]. Because of the characteristic of contacting with the larynx, EGG has a high potential for wearable food intake monitoring. Farooq et al. [52] proposed a testing scheme to evaluate the validity of practicing EGG in food intake detection by setting up the Laryngograph (EGG-D200 from Laryngograph, Ltd., Wallington, U.K. (illustrated in Figure 4d)) around the participant’s neck during the experiment. The swallowing frequency signal will then be recorded by two electrodes embedded in the Laryngograph to detect eating events. The results afterward would be evaluated comparatively with the acoustic method using a microphone placed over the laryngopharynx. Accordingly, the EGG method presents greater accuracy results: 89.7% over 81.1% on female subjects and 90.3% over 85.2% on male subjects among 25 subjects (13 females and 12 males in selected meal choice under the laboratory condition).
- EMG sensor: EMG has widely been employed in food intake monitoring research. Because of its efficiency in detecting chewing and swallowing signals, EMG focuses on mastication with the bolus size and hardness of the food intake, rather than food classification. For example, Woda et al. [122,123] employed EMG to scrutinize the effect of food hardness, bolus size, chewing cycles and sequence duration in specific food types and testing subject classes. On the other hand, Kohyama et al. [124] took into account mastication efforts for finely-cut foods with the use of the EMG. A further research work of Kohyama et al. featuring EMG investigates more in-depth how chewing behavior is influenced by dental status and age with different types of food [125].
5.5. Piezoelectric Approach
- Chewing detection: Besides the application in swallowing detection, the piezoelectric approach is harnessed in chewing detection. Farooq and Sazonov [127] presented the utilization of piezoelectric film sensors for identifying jaw movements during the chewing process. The experimental process contains 12 subjects under no restricted laboratory condition while wearing the sensors for one day. The study more forwardly investigates the detection accuracy over a range of different ensemble classifiers with base learners (more details in Section 6). The average Z-score accuracy of ensembles is 90.76%. Farooq and Sazonov [53] furthermore worked on the the comparison between piezoelectric strain sensor (demonstrated in Figure 4e) and plotter drawn strain sensor in automatic chew counting. Two sensors are positioned below one ear for capturing jaw movements. This study proves a comparatively similar effectiveness in chewing detection between piezoelectric and printed strain sensors (error rates of 8.09% and 8.29%, respectively). Their latter work on this piezoelectric approach specifies the jaw movements on the temporalis muscle as the source of the input signal to the piezoelectric film sensor [128]. Additional works on the piezoelectric method merge it with other approaches for expanding the detected aspects besides chewing and swallowing.
- Swallowing detection: Taking advantage of this specification, Kalantarian et al. [129] used piezoelectric sensors to capture the motion of the throat’s skin during the swallowing process. Similar to the system in capacitive sensing, this method embeds sensors in a necklace, worn around the user’s neck, for swallowing detection. The study is capable of classifying three types of food (chip, sandwich and water) besides recognizing the state of food (solid or liquid) with an average accuracy of 86% from a population of 10 subjects in a lab-controlled environment.
5.6. Fusion Approach
5.7. Other Approaches
5.7.1. Electrical Proximity Sensing
5.7.2. Respiratory Inductance Plethysmography Sensing
5.8. Comparison
6. Signal Processing Scheme
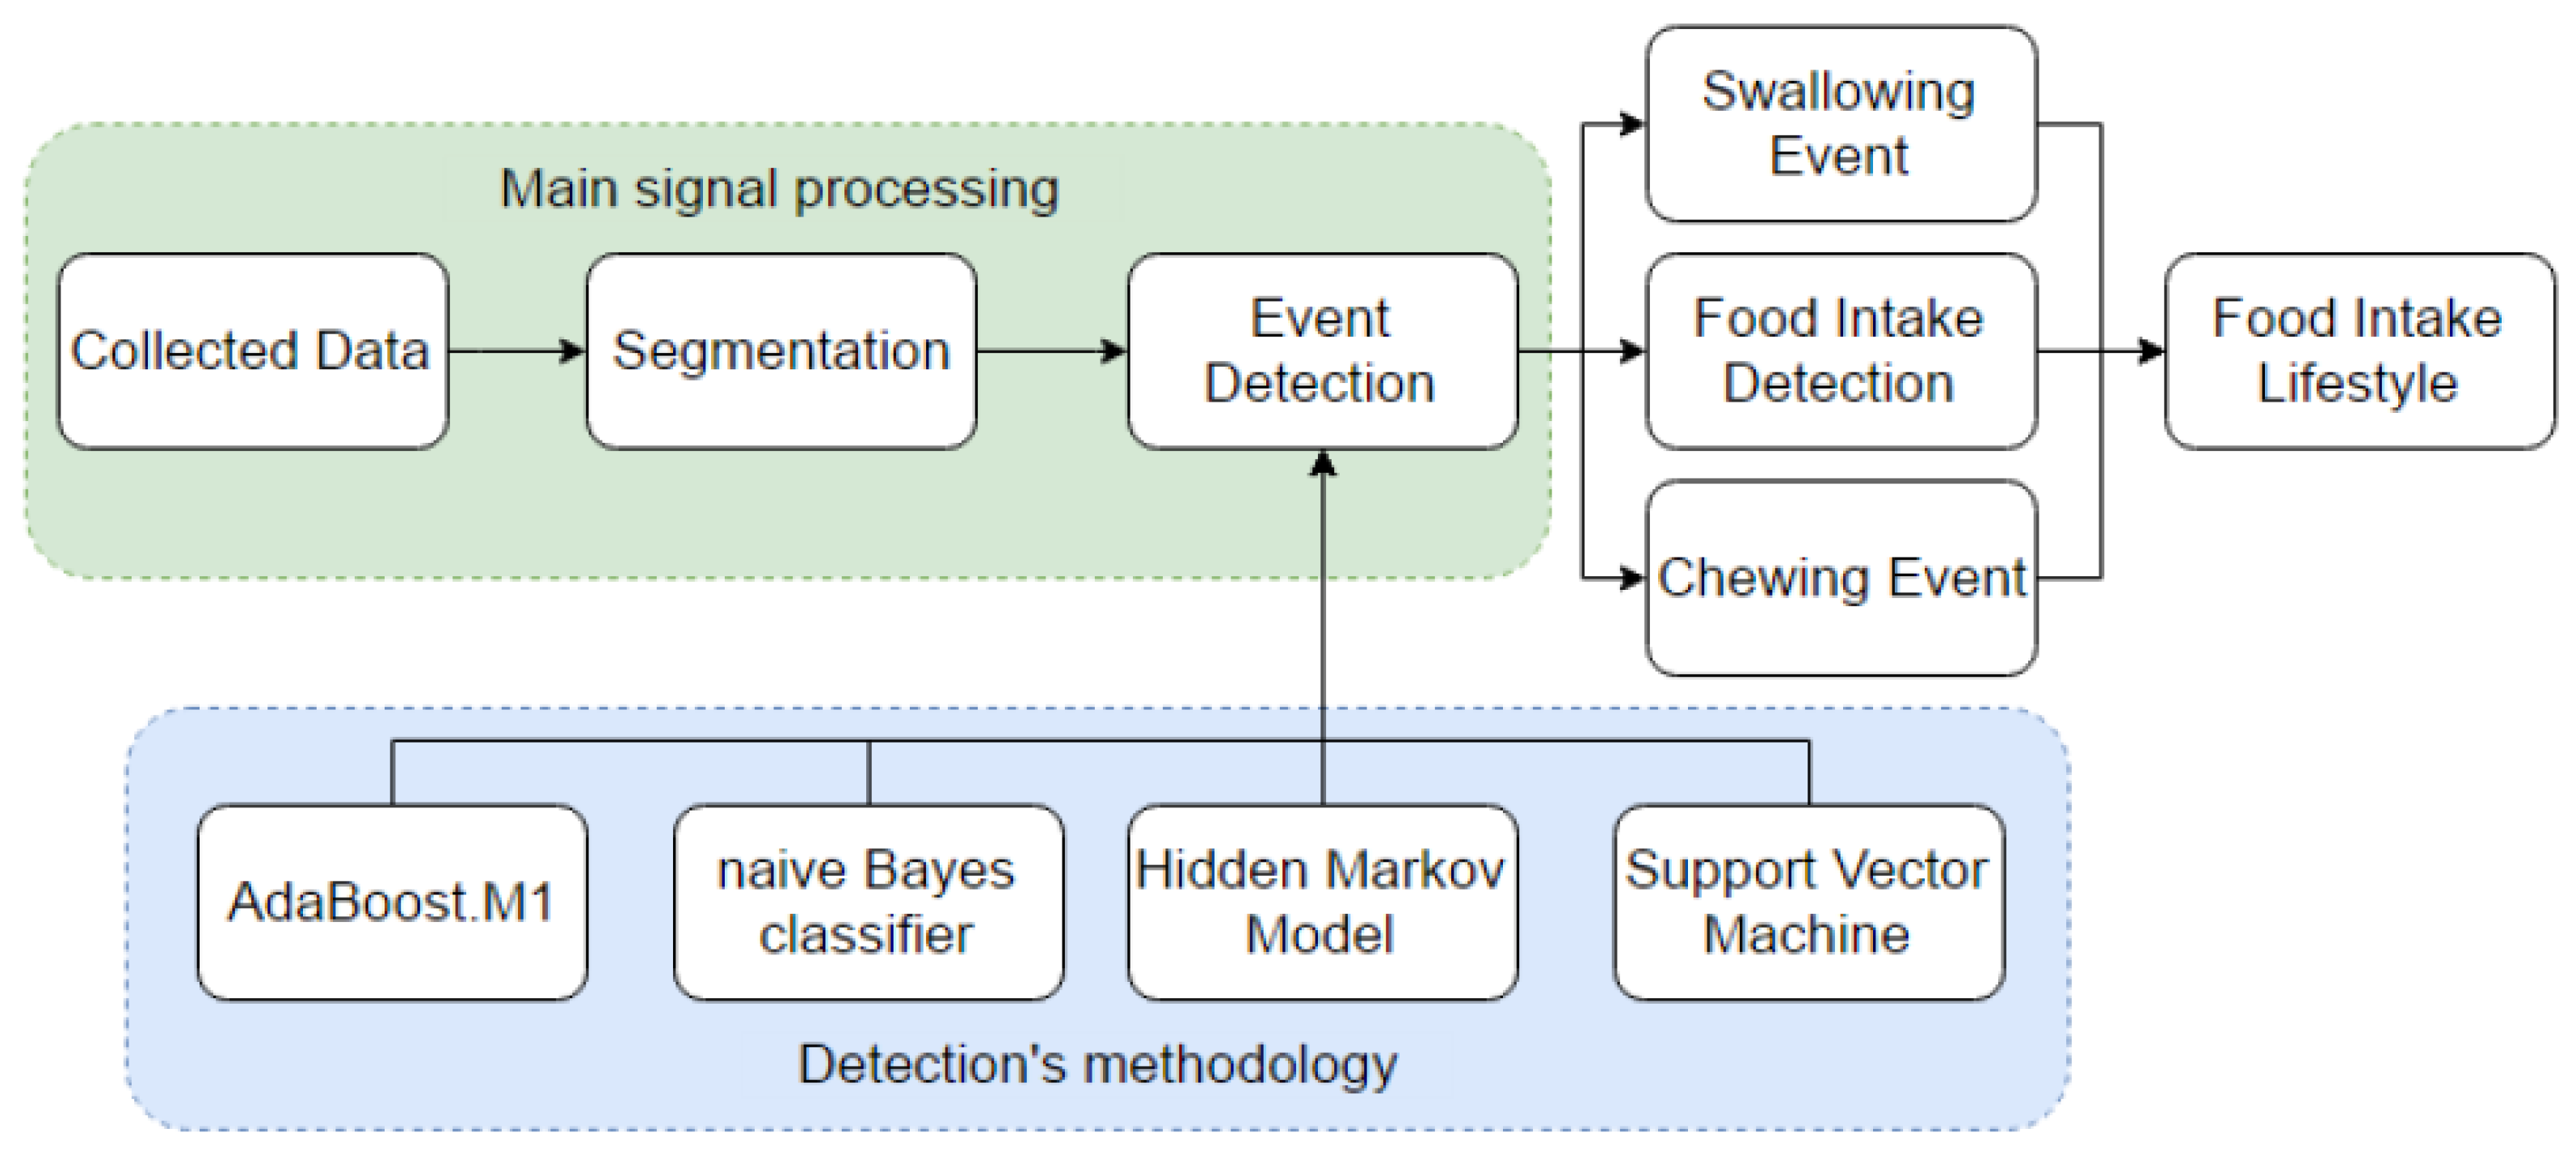
6.1. Eating Behavior/Food Intake Detection
6.2. Food Type Classification
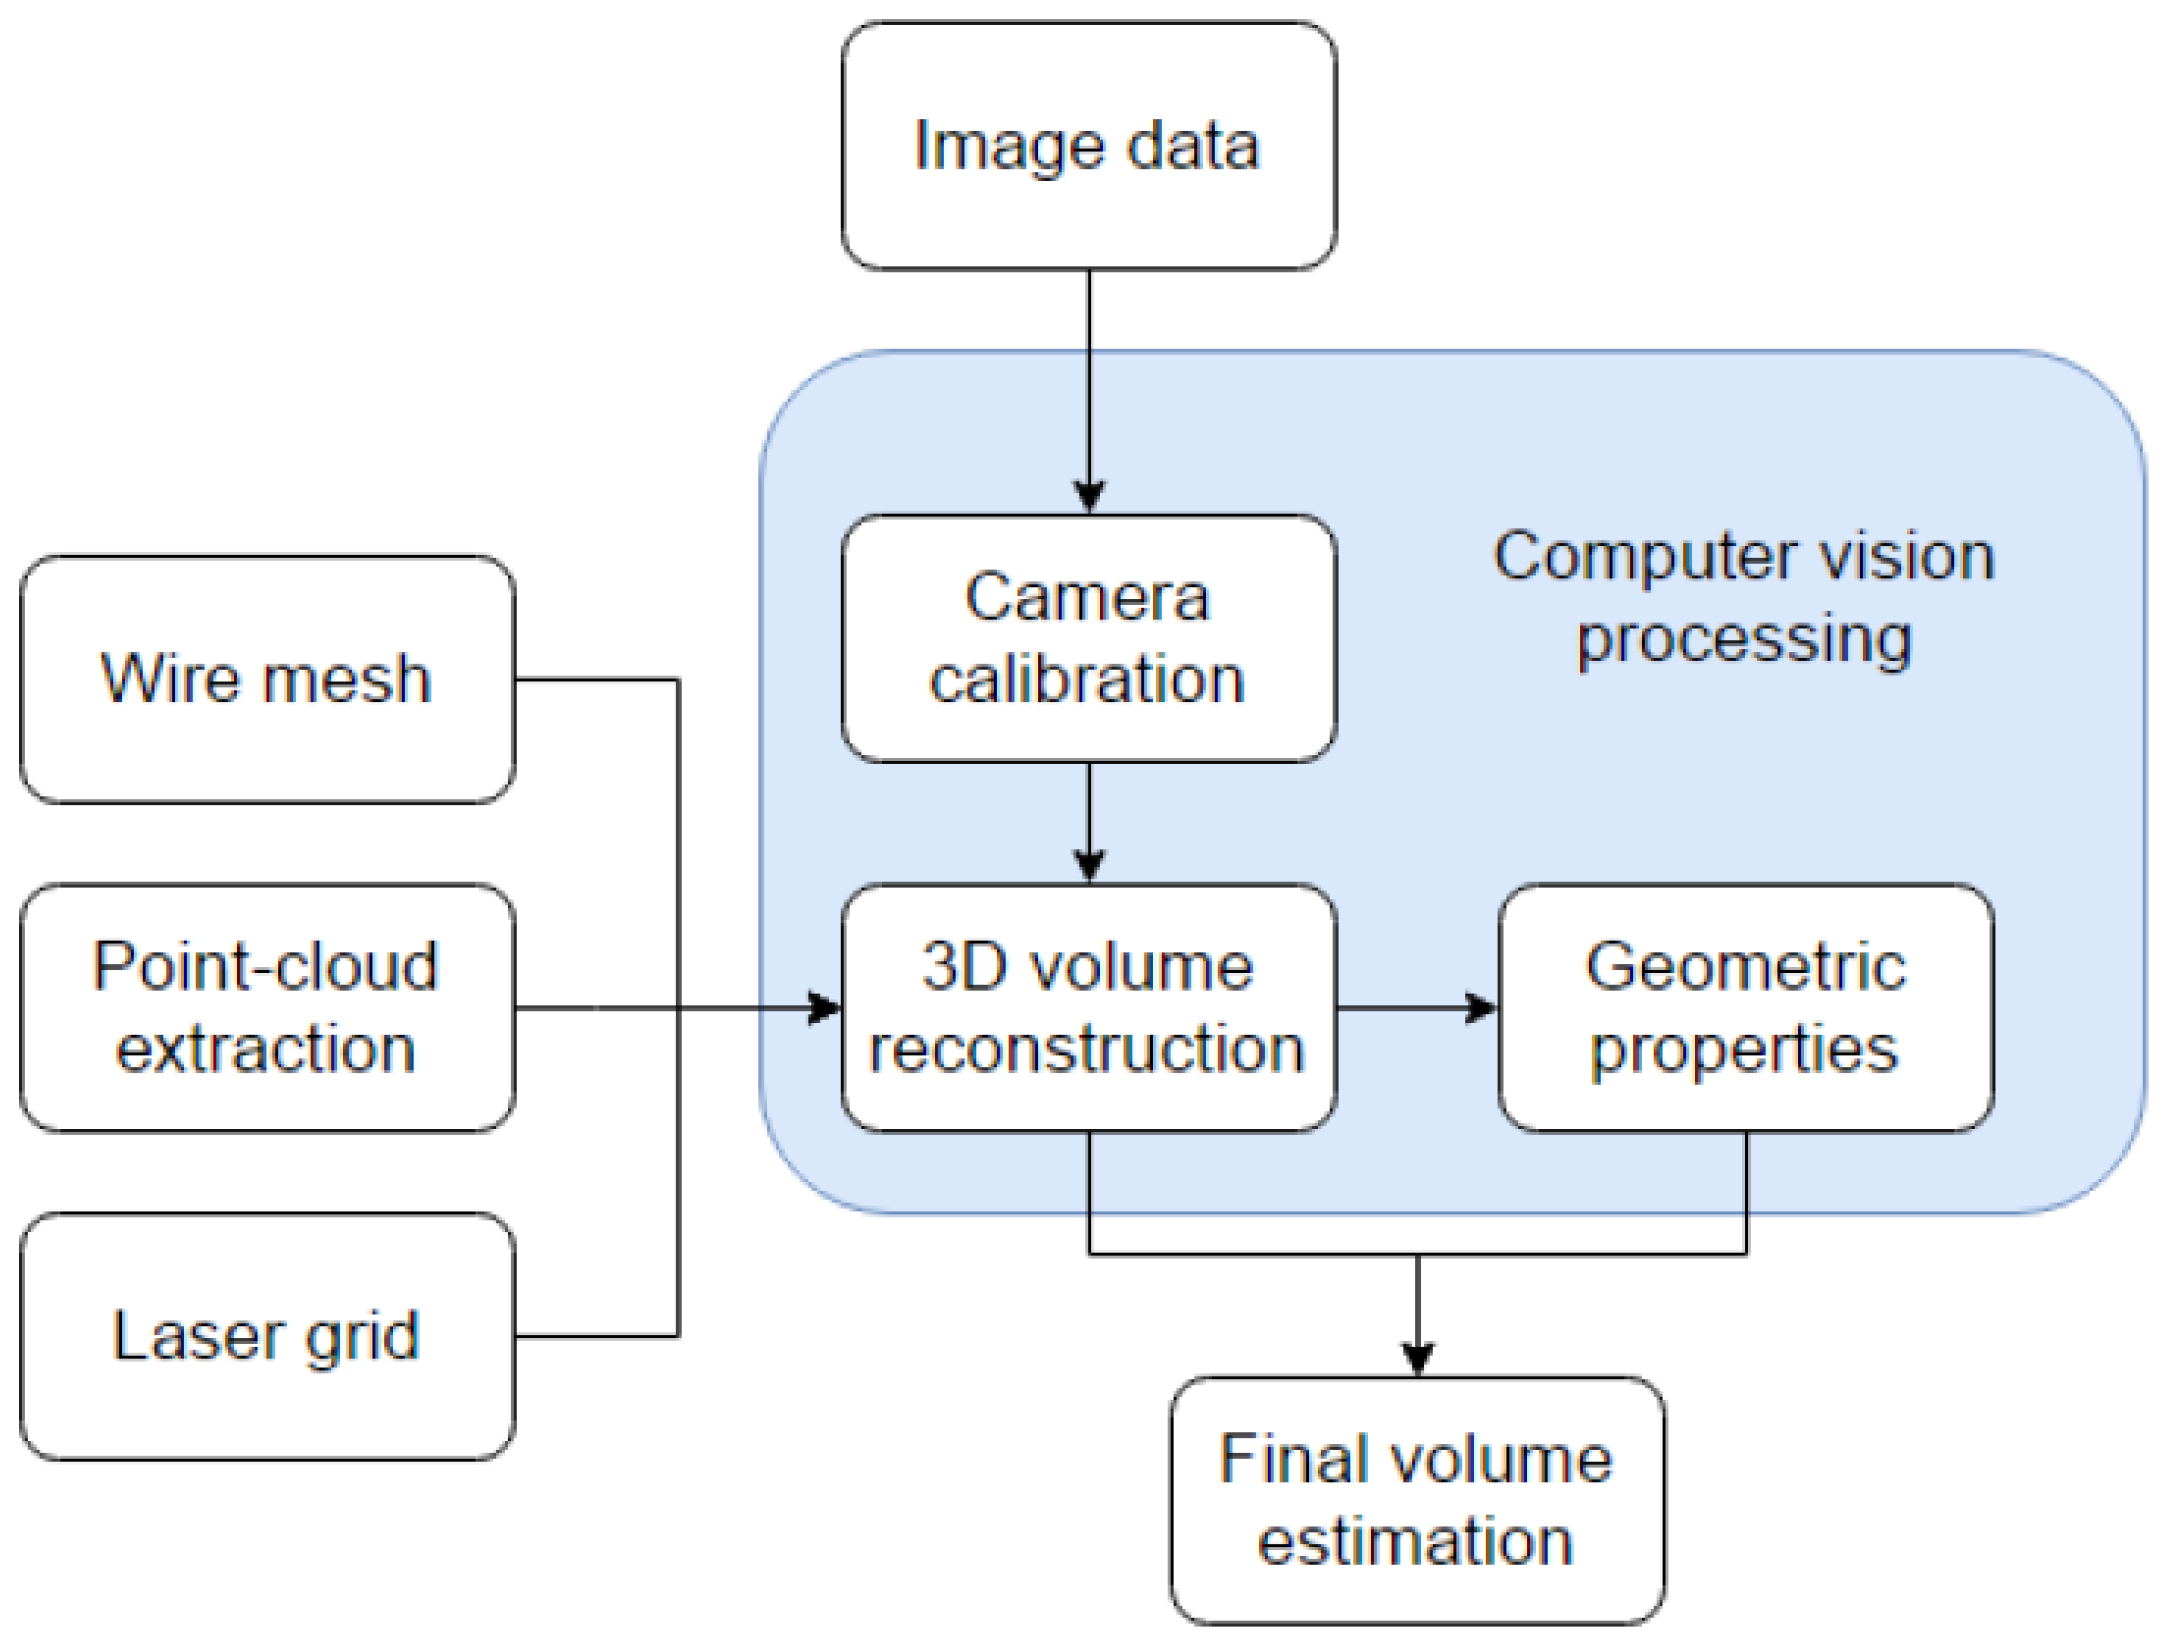
6.3. Volume Estimation
7. Discussion
8. Conclusions
Author Contributions
Conflicts of Interest
References
- Hou, Y.; Yin, Y.; Wu, G. Dietary essentiality of “nutritionally non-essential amino acids” for animals and humans. Exp. Biol. Med. 2015, 240, 997–1007. [Google Scholar] [CrossRef] [PubMed]
- Volkow, N.D.; Wang, G.J.; Baler, R.D. Reward, dopamine and the control of food intake: Implications for obesity. Trends Cogn. Sci. 2011, 15, 37–46. [Google Scholar] [CrossRef] [PubMed]
- Mayer, J.; Thomas, D.W. Regulation of food intake and obesity. Science 1967, 156, 328–337. [Google Scholar] [CrossRef] [PubMed]
- Bazzano, L.A.; He, J.; Ogden, L.G.; Loria, C.M.; Vupputuri, S.; Myers, L.; Whelton, P.K. Fruit and vegetable intake and risk of cardiovascular disease in US adults: The first National Health and Nutrition Examination Survey Epidemiologic Follow-up Study. Am. J. Clin. Nutr. 2002, 76, 93–99. [Google Scholar] [PubMed]
- Seidell, J.C. Societal and personal costs of obesity. Exp. Clin. Endocrinol. Diabetes 1998, 106, 7–10. [Google Scholar] [CrossRef] [PubMed]
- Cawley, J.; Meyerhoefer, C.; Biener, A.; Hammer, M.; Wintfeld, N. Savings in Medical Expenditures Associated with Reductions in Body Mass Index Among US Adults with Obesity, by Diabetes Status. Pharmacoeconomics 2015, 33, 707–722. [Google Scholar] [CrossRef] [PubMed]
- Sonntag, D.; Ali, S.; De Bock, F. Lifetime indirect cost of childhood overweight and obesity: A decision analytic model. Obesity 2016, 24, 200–206. [Google Scholar] [CrossRef] [PubMed]
- Basiotis, P.P.; Welsh, S.O.; Cronin, F.J.; Kelsay, J.L.; Mertz, W. Number of days of food intake records required to estimate individual and group nutrient intakes with defined confidence. J. Nutr. 1987, 117, 1638–1641. [Google Scholar] [PubMed]
- Darby, A.; Strum, M.W.; Holmes, E.; Gatwood, J. A Review of Nutritional Tracking Mobile Applications for Diabetes Patient Use. Diabetes Technol. Ther. 2016, 18, 200–212. [Google Scholar] [CrossRef]
- Amft, O. Automatic Dietary Monitoring Using on-Body Sensors. Ph.D. Thesis, Chemnitz University of Technology, Chemnitz, Germany, 2008. [Google Scholar]
- Fontana, J.M.; Sazonon, E. Detection and characterization of food intake by wearable sensors. In Wearable Sensors: Fundamentals, Implementation and Applications, 1st ed.; Sazonov, E., Neuman, M.R., Eds.; Academic Press: New York, NY, USA, 2014; Chapter 7.4; pp. 591–616. [Google Scholar]
- Amft, O.; Tröster, G. On-body sensing solutions for automatic dietary monitoring. IEEE Pervasive Comput. 2009, 8, 62–70. [Google Scholar] [CrossRef]
- Burke, L.E.; Warziski, M.; Starrett, T.; Choo, J.; Music, E.; Sereika, S.; Stark, S.; Sevick, M.A. Self-monitoring dietary intake: Current and future practices. J. Ren. Nutr. 2005, 15, 281–290. [Google Scholar] [CrossRef] [PubMed]
- Päßler, S.; Fischer, W.J. Food intake monitoring: Automated chew event detection in chewing sounds. IEEE J. Biomed. Health Inform. 2014, 18, 278–289. [Google Scholar] [CrossRef] [PubMed]
- Stumbo, P.J. New technology in dietary assessment: A review of digital methods in improving food record accuracy. Proc. Nutr. Soc. 2013, 72, 70–76. [Google Scholar] [CrossRef] [PubMed]
- Kalantarian, H.; Mortazavi, B.; Alshurafa, N.; Sideris, C.; Le, T.; Sarrafzadeh, M. A comparison of piezoelectric-based inertial sensing and audio-based detection of swallows. Obes. Med. 2016, 1, 6–14. [Google Scholar] [CrossRef]
- Tamura, T.; Kimura, Y. Review of monitoring devices for food intake. CICSJ Bull. 2016, 34, 73. [Google Scholar]
- Morton, G.; Cummings, D.; Baskin, D.; Barsh, G.; Schwartz, M. Central nervous system control of food intake and body weight. Nature 2006, 443, 289–295. [Google Scholar] [CrossRef] [PubMed]
- Schwartz, M.W.; Woods, S.C.; Porte, D.; Seeley, R.J.; Baskin, D.G. Central nervous system control of food intake. Nature 2000, 404, 661–671. [Google Scholar] [PubMed]
- Heil, D.P. Predicting activity energy expenditure using the Actical® activity monitor. Res. Q. Exerc. Sport 2006, 77, 64–80. [Google Scholar] [CrossRef] [PubMed]
- Chen, K.Y.; Sun, M. Improving energy expenditure estimation by using a triaxial accelerometer. J. Appl. Physiol. 1997, 83, 2112–2122. [Google Scholar] [PubMed]
- Fruin, M.L.; Rankin, J.W. Validity of a multi-sensor armband in estimating rest and exercise energy expenditure. Med. Sci. Sports Exerc. 2004, 36, 1063–1069. [Google Scholar] [CrossRef] [PubMed]
- Mederacke, I. Food intake increases liver stiffness in patients with chronic or resolved hepatitis C virus infection. Liver Int. 2009, 29, 1500–1506. [Google Scholar] [CrossRef] [PubMed]
- Buschang, P.; Throckmorto, G.; Travers, K.H.; Johnson, G. The effects of bolus size and chewing rate on masticatoryperformance with artificial test foods. J. Oral Rehabil. 1997, 24, 522–526. [Google Scholar] [CrossRef] [PubMed]
- Sognnaes, R. Studies on masticatory efficiency. PartsI-IV. Am. J. Orthod. 1941, 27, 309. [Google Scholar]
- Blisset, A. Effect of bolus size on chewing, swallowing, oral soft tissue and tongue movement. J. Oral Rehabil. 2007, 34, 572–582. [Google Scholar] [CrossRef] [PubMed]
- Prinz, J.F.; Heath, M.R. Bolus dimensions in normal chewing. J. Oral Rehabil. 2000, 27, 765–768. [Google Scholar] [CrossRef] [PubMed]
- Karibe, H.; Goddard, G.; Gear, R.W. Sex Differences in Masticatory Muscle Pain after Chewing. J. Dent. Res. 2003, 82, 112–116. [Google Scholar] [CrossRef] [PubMed]
- Tasaka, A.; Tahara, Y.; Sugiyama, T.; Sakurai, K. Influence of chewing rate on salivary stress hormone levels. J. Jpn. Prosthodont. Soc. 2008, 52, 482–487. [Google Scholar] [CrossRef]
- Young, V.R. Nutritional Balance Studies: Indicators of Human Requirements or of Adaptive Mechanisms? J. Nutr. 1986, 116, 700–703. [Google Scholar] [PubMed]
- Reeds, P.J. Dispensable and Indispensable Amino Acids for Humans. J. Nutr. 2000, 130, 1835S–1840S. [Google Scholar] [PubMed]
- Ogden, C.L.; Carroll, M.D.; Curtin, L.R.; McDowell, M.A.; Tabak, C.J.; Flegal, K.M. Prevalence of overweight and obesity in the United States, 1999–2004. JAMA 2006, 295, 1549–1555. [Google Scholar] [CrossRef] [PubMed]
- Ogden, C.L.; Carroll, M.D.; Kit, B.K.; Flegal, K.M. Prevalence of obesity in the United States, 2009–2010. NCHS Data Brief 2012, 131, 1–8. [Google Scholar]
- Block, G. A review of validations of dietary assessment methods. Am. J. Epidemiol. 1982, 115, 492–505. [Google Scholar] [PubMed]
- Bingham, S.; Gill, C.; Welch, A.; Day, K.; Cassidy, A.; Khaw, K.; Sneyd, M.; Key, T.; Roe, L.; Day, N. Comparison of dietary assessment methods in nutritional epidemiology: Weighed records v. 24 h recalls, food-frequency questionnaires and estimated-diet records. Br. J. Nutr. 1994, 72, 619–643. [Google Scholar] [CrossRef] [PubMed]
- Wohlers, E.M.; Sirard, J.R.; Barden, C.M.; Moon, J.K. Smart phones are useful for food intake and physical activity surveys. In Proceedings of the 2009 Annual International Conference of the IEEE Engineering in Medicine and Biology Society, Minneapolis, MN, USA, 3–6 September 2009; pp. 5183–5186.
- Tsai, C.C.; Lee, G.; Raab, F.; Norman, G.J.; Sohn, T.; Griswold, W.G.; Patrick, K. Usability and feasibility of PmEB: A mobile phone application for monitoring real time caloric balance. Mob. Netw. Appl. 2007, 12, 173–184. [Google Scholar] [CrossRef]
- Fallaize, R.; Forster, H.; Macready, A.L.; Walsh, M.C.; Mathers, J.C.; Brennan, L.; Gibney, E.R.; Gibney, M.J.; Lovegrove, J.A. Online dietary intake estimation: Reproducibility and validity of the Food4Me food frequency questionnaire against a 4-day weighed food record. J. Med. Internet Res. 2014, 16, e190. [Google Scholar] [CrossRef] [PubMed]
- Green, T.J.; Allen, O.B.; O’Connor, D.L. A three-day weighed food record and a semiquantitative food-frequency questionnaire are valid measures for assessing the folate and vitamin B-12 intakes of women aged 16 to 19 years. J. Nutr. 1998, 128, 1665–1671. [Google Scholar] [PubMed]
- Schoeller, D.A. The Role of Dexfenfluramine in the Regulation of Energy Balance Limitations in the assessment of dietary energy intake by self-report. Metabolism 1995, 44, 18–22. [Google Scholar] [CrossRef]
- Chang, K.H.; Liu, S.Y.; Chu, H.H.; Hsu, J.Y.J.; Chen, C.; Lin, T.Y.; Chen, C.Y.; Huang, P. The Diet-aware Dining Table: Observing Dietary Behaviors over a Tabletop Surface. In Proceedings of the 4th International Conference on Pervasive Computing (PERVASIVE’06), Dublin, Ireland, 7–10 May 2006; pp. 366–382.
- Zhou, B.; Cheng, J.; Sundholm, M.; Reiss, A.; Huang, W.; Amft, O.; Lukowicz, P. Smart table surface: A novel approach to pervasive dining monitoring. In Proceedings of the 2015 IEEE International Conference on Pervasive Computing and Communications (PerCom), St. Louis, MO, USA, 23–27 March 2015; pp. 155–162.
- Cadavid, S.; Abdel-Mottaleb, M.; Helal, A. Exploiting visual quasi-periodicity for real-time chewing event detection using active appearance models and support vector machines. Pers. Ubiquitous Comput. 2012, 16, 729–739. [Google Scholar] [CrossRef]
- Zhou, B.; Cheng, J.; Sundholm, M.; Lukowicz, P. From smart clothing to smart table cloth: Design and implementation of a large scale, textile pressure matrix sensor. In Proceedings of the International Conference on Architecture of Computing Systems, Lubeck, Germany, 25–28 February 2014; pp. 159–170.
- Tanigawa, S.; Nishihara, H.; Kaneda, S.; Haga, H. Detecting mastication by using microwave doppler sensor. In Proceedings of the 1st International Conference on Pervasive Technologies Related to Assistive Environments, Athens, Greece, 16–19 July 2008; p. 88.
- Westerterp, K.R.; Goris, A.H. Validity of the assessment of dietary intake: Problems of misreporting. Curr. Opin. Clin. Nutr. Metab. Care 2002, 5, 489–493. [Google Scholar] [CrossRef] [PubMed]
- Sejdić, E.; Steele, C.M.; Chau, T. A procedure for denoising dual-axis swallowing accelerometry signals. Physiol. Meas. 2010, 31, N1. [Google Scholar] [CrossRef] [PubMed]
- Hill, R.J.; Davies, P.S.W. The validity of self-reported energy intakeas determined using the doubly labelled water technique. Br. J. Nutr. 2001, 85, 415–430. [Google Scholar] [CrossRef] [PubMed]
- Amft, O. A wearable ear pad sensor for chewing monitoring. In Proceedings of the IEEE Sensors, Waikoloa, HI, USA, 1–4 November 2010; pp. 222–227.
- Sun, M.; Burke, L.E.; Mao, Z.H.; Chen, Y.; Chen, H.C.; Bai, Y.; Li, Y.; Li, C.; Jia, W. eButton: A Wearable Computer for Health Monitoring and Personal Assistance. In Proceedings of the 51st Annual Design Automation Conference, San Francisco, CA, USA, 1–5 June 2014.
- Dong, Y.; Hoover, A.; Scisco, J.; Muth, E. A New Method for Measuring Meal Intake in Humans via Automated Wrist Motion Tracking. Appl. Psychophysiol. Biofeedback 2012, 37, 205–215. [Google Scholar] [CrossRef]
- Farooq, M.; Fontana, J.M.; Sazonov, E. A novel approach for food intake detection using electroglottography. Physiol. Meas. 2014, 35, 739. [Google Scholar] [CrossRef] [PubMed]
- Farooq, M.; Sazonov, E. Comparative testing of piezoelectric and printed strain sensors in characterization of chewing. In Proceedings of the 2015 37th Annual International Conference of the IEEE Engineering in Medicine and Biology Society (EMBC), Milan, Italy, 25–29 August 2015; pp. 7538–7541.
- Liu, J.; Johns, E.; Atallah, L.; Pettitt, C.; Lo, B.; Frost, G.; Yang, G.Z. An intelligent food-intake monitoring system using wearable sensors. In Proceedings of the 2012 Ninth International Conference on Wearable and Implantable Body Sensor Networks, London, UK, 9–12 May 2012; pp. 154–160.
- Cheng, J.; Zhou, B.; Kunze, K.; Rheinländer, C.C.; Wille, S.; Wehn, N.; Weppner, J.; Lukowicz, P. Activity recognition and nutrition monitoring in every day situations with a textile capacitive neckband. In Proceedings of the 2013 ACM Conference on Pervasive and Ubiquitous Computing Adjunct Publication, Zurich, Switzerland, 8–12 September 2013; pp. 155–158.
- Dong, B.; Biswas, S. Wearable diet monitoring through breathing signal analysis. In Proceedings of the 35th Annual International Conference of the IEEE Engineering in Medicine and Biology Society (EMBC), Osaka, Japan, 3–7 July 2013; pp. 1186–1189.
- Stunkard, A.J.; Grace, W.; Wolff, H. Night eating syndrome. In Eating Disorders and Obesity: A Comprehensive Handbook; Guilford Press: New York, NY, USA, 2002; pp. 183–188. [Google Scholar]
- Kant, A.K.; Ballard-Barbash, R.; Schatzkin, A. Evening eating and its relation to self-reported body weight and nutrient intake in women, CSFII 1985-86. J. Am. Coll. Nutr. 1995, 14, 358–363. [Google Scholar] [CrossRef] [PubMed]
- Haines, P.S.; Hama, M.Y.; Guilkey, D.K.; Popkin, B.M. Weekend eating in the United States is linked with greater energy, fat, and alcohol intake. Obes. Res. 2003, 11, 945–949. [Google Scholar] [CrossRef] [PubMed]
- Popkin, B.M.; Duffey, K.; Gordon-Larsen, P. Environmental influences on food choice, physical activity and energy balance. Physiol. Behav. 2005, 86, 603–613. [Google Scholar] [CrossRef] [PubMed]
- Pliner, P.; Mann, N. Influence of social norms and palatability on amount consumed and food choice. Appetite 2004, 42, 227–237. [Google Scholar] [CrossRef] [PubMed]
- Wardle, J.; Gibson, E. Impact of Stress on Diet: Processes and Implications. In Stress and the Heart: Psychosocial Pathways to Coronary Heart Disease; Stansfeld, S., Marmot, M.G., Eds.; BMJ Books: London, UK, 2002; pp. 124–149. [Google Scholar]
- World Health Organization. The World Health Report 2001: Mental Health: New Understanding, New Hope; World Health Organization: Geneva, Switzerland, 2001. [Google Scholar]
- Sazonov, E.; Makeyev, O.; Schuckers, S.; Lopez-Meyer, P.; Melanson, E.L.; Neuman, M.R. Automatic Detection of Swallowing Events by Acoustical Means for Applications of Monitoring of Ingestive Behavior. IEEE Trans. Biomed. Eng. 2010, 57, 626–633. [Google Scholar] [CrossRef] [PubMed]
- Kondrup, J. Can food intake in hospitals be improved? Clin. Nutr. 2001, 20, 153–160. [Google Scholar] [CrossRef]
- Kondrup, J.; Johansen, N.; Plum, L.; Bak, L.; Larsen, I.H.; Martinsen, A.; Andersen, J.; Baernthsen, H.; Bunch, E.; Lauesen, N. Incidence of nutritional risk and causes of inadequate nutritional care in hospitals. Clin. Nutr. 2002, 21, 461–468. [Google Scholar] [CrossRef] [PubMed]
- Beck, A.M.; Balkn, U.; Fürst, P.; Hasunen, K.; Jones, L.; Keller, U.; Melchior, J.; Mikkelsen, B.E.; Schauder, P.; Sivonen, L.; et al. Food and nutritional care in hospitals: How to prevent undernutrition–report and guidelines from the Council of Europe. Clin. Nutr. 2001, 20, 455–460. [Google Scholar] [CrossRef] [PubMed]
- Maton, A. Human Biology and Health; Prentice Hall: Englewood Cliffs, NJ, USA, 1997. [Google Scholar]
- Protein Digestion Inside the Human Body. Available online: http://healthyeating.sfgate.com/protein-digestion-inside-human-body-6044.html (accessed on 30 December 2016).
- Protein Digestion Monitoring Kit. Available online: http://www.itsibio.com/prodm.html (accessed on 30 December 2016).
- Muscles of Mastication. Available online: http://www.musclesused.com/muscles-mastication-chewin/ (accessed on 30 December 2016).
- Hoebler, C.; Karinthi, A.; Devaux, M.F.; Guillon, F.; Gallant, D.; Bouchet, B.; Melegari, C.; Barry, J.L. Physical and chemical transformations of cereal food during oral digestion in human subjects. Br. J. Nutr. 1998, 80, 429–436. [Google Scholar] [CrossRef] [PubMed]
- Bornhorst, G.M.; Singh, R.P. Bolus formation and disintegration during digestion of food carbohydrates. Compr. Rev. Food Sci. Food Saf. 2012, 11, 101–118. [Google Scholar] [CrossRef]
- Hiiemae, K.M.; Palmer, J. Food transport and bolus formation during complete feeding sequences on foods of different initial consistency. Dysphagia 1999, 14, 31–42. [Google Scholar] [CrossRef] [PubMed]
- Pedersen, A.; Bardow, A.; Jensen, S.B.; Nauntofte, B. Saliva and gastrointestinal functions of taste, mastication, swallowing and digestion. Oral Dis. 2002, 8, 117–129. [Google Scholar] [CrossRef] [PubMed]
- Chen, J. Food oral processing—A review. Food Hydrocoll. 2009, 23, 1–25. [Google Scholar] [CrossRef]
- Amft, O.; Kusserow, M.; Tröster, G. Bite weight prediction from acoustic recognition of chewing. IEEE Trans. Biomed. Eng. 2009, 56, 1663–1672. [Google Scholar] [CrossRef] [PubMed]
- Amft, O.; Stäger, M.; Lukowicz, P.; Tröster, G. Analysis of chewing sounds for dietary monitoring. In Proceedings of the International Conference on Ubiquitous Computing, Osaka, Japan, 7–11 September 2005; pp. 56–72.
- Yatani, K.; Truong, K.N. BodyScope: A Wearable Acoustic Sensor for Activity Recognition. In Proceedings of the 2012 ACM Conference on Ubiquitous Computing, Pittsburgh, PA, USA, 5–8 September 2012; pp. 341–350.
- Olubanjo, T.; Moore, E.; Ghovanloo, M. Detecting food intake acoustic events in noisy recordings using template matching. In Proceedings of the 2016 IEEE-EMBS International Conference on Biomedical and Health Informatics (BHI), Las Vegas, NV, USA, 25–27 February 2016; pp. 388–391.
- Päßler, S.; Fischer, W.J. Acoustical method for objective food intake monitoring using a wearable sensor system. In Proceedings of the 2011 5th International Conference on Pervasive Computing Technologies for Healthcare (PervasiveHealth) and Workshops, Dublin, Ireland, 23–26 May 2011; pp. 266–269.
- Paßler, S.; Fischer, W.J. Food Intake Activity Detection Using a Wearable Microphone System. In Proceedings of the 2011 7th International Conference on Intelligent Environments (IE), Nottingham, UK, 25–28 July 2011; pp. 298–301.
- Päßler, S.; Wolff, M.; Fischer, W.J. Food intake monitoring: An acoustical approach to automated food intake activity detection and classification of consumed food. Physiol. Meas. 2012, 33, 1073. [Google Scholar] [CrossRef] [PubMed]
- Nishimura, J.; Kuroda, T. Eating habits monitoring using wireless wearable in-ear microphone. In Proceedings of the 3rd International Symposium on Wireless Pervasive Computing, Santorini, Greece, 7–9 May 2008; pp. 130–132.
- Shuzo, M.; Komori, S.; Takashima, T.; Lopez, G.; Tatsuta, S.; Yanagimoto, S.; Warisawa, S.; Delaunay, J.J.; Yamada, I. Wearable Eating Habit Sensing System Using Internal Body Sound. J. Adv. Mech. Des. Syst. Manuf. 2010, 4, 158–166. [Google Scholar] [CrossRef]
- Sazonov, E.S.; Fontana, J.M. A Sensor System for Automatic Detection of Food Intake Through Non-Invasive Monitoring of Chewing. IEEE Sens. J. 2012, 12, 1340–1348. [Google Scholar] [CrossRef] [PubMed]
- Sazonov, E.; Schuckers, S.; Lopez-Meyer, P.; Makeyev, O.; Sazonova, N.; Melanson, E.L.; Neuman, M. Non-invasive monitoring of chewing and swallowing for objective quantification of ingestive behavior. Physiol. Meas. 2008, 29, 525. [Google Scholar] [CrossRef] [PubMed]
- Lopez-Meyer, P.; Schuckers, S.; Makeyev, O.; Sazonov, E. Detection of periods of food intake using Support Vector Machines. In Proceedings of the 2010 Annual International Conference of the IEEE Engineering in Medicine and Biology, Buenos Aires, Argentina, 1–4 September 2010; pp. 1004–1007.
- Kalantarian, H.; Alshurafa, N.; Pourhomayoun, M.; Sarin, S.; Le, T.; Sarrafzadeh, M. Spectrogram-based audio classification of nutrition intake. In Proceedings of the IEEE Healthcare Innovation Conference (HIC), Seattle, WA, USA, 8–10 October 2014; pp. 161–164.
- Bi, Y.; Lv, M.; Song, C.; Xu, W.; Guan, N.; Yi, W. AutoDietary: A Wearable Acoustic Sensor System for Food Intake Recognition in Daily Life. IEEE Sens. J. 2016, 16, 806–816. [Google Scholar] [CrossRef]
- Chang, U.J.; Ko, S. A study on the dietary intake survey method using a cameraphone. Korean J. Community Nutr. 2007, 12, 198–205. [Google Scholar]
- Gemming, L.; Rush, E.; Maddison, R.; Doherty, A.; Gant, N.; Utter, J.; Ni Mhurchu, C. Wearable cameras can reduce dietary under-reporting: Doubly labelled water validation of a camera-assisted 24 h recall. Br. J. Nutr. 2015, 113, 284–291. [Google Scholar] [CrossRef] [PubMed]
- Jia, W.; Yue, Y.; Fernstrom, J.D.; Zhang, Z.; Yang, Y.; Sun, M. 3D localization of circular feature in 2D image and application to food volume estimation. In Proceedings of the 2012 Annual International Conference of the IEEE Engineering in Medicine and Biology Society, San Diego, CA, USA, 28 August–1 September 2012; pp. 4545–4548.
- Chen, H.C.; Jia, W.; Yue, Y.; Li, Z.; Sun, Y.N.; Fernstrom, J.D.; Sun, M. Model-based measurement of food portion size for image-based dietary assessment using 3D/2D registration. Meas. Sci. Technol. 2013, 24, 105701. [Google Scholar] [CrossRef] [PubMed]
- Bai, Y.; Jia, W.; Mao, Z.H.; Sun, M. Automatic eating detection using a proximity sensor. In Proceedings of the 2014 40th Annual Northeast Bioengineering Conference (NEBEC), Boston, MA, USA, 25–27 April 2014; pp. 1–2.
- Zhu, F.; Bosch, M.; Boushey, C.J.; Delp, E.J. An image analysis system for dietary assessment and evaluation. In Proceedings of the 2010 IEEE International Conference on Image Processing, Hong Kong, China, 26–29 September 2010; pp. 1853–1856.
- Zhu, F.; Bosch, M.; Schap, T.; Khanna, N.; Ebert, D.S.; Boushey, C.J.; Delp, E.J. Segmentation assisted food classification for dietary assessment. In Proceedings of the IS&T/SPIE Electronic Imaging, San Francisco, CA, USA, 23–27 January 2011.
- Zhu, F.; Bosch, M.; Woo, I.; Kim, S.; Boushey, C.J.; Ebert, D.S.; Delp, E.J. The Use of Mobile Devices in Aiding Dietary Assessment and Evaluation. IEEE J. Sel. Top. Signal Process. 2010, 4, 756–766. [Google Scholar] [PubMed]
- Zhu, F.; Bosch, M.; Khanna, N.; Boushey, C.J.; Delp, E.J. Multilevel segmentation for food classification in dietary assessment. In Proceedings of the 2011 7th International Symposium on Image and Signal Processing and Analysis (ISPA), Dubrovnik, Croatia, 4–6 September 2011; pp. 337–342.
- Puri, M.; Zhu, Z.; Yu, Q.; Divakaran, A.; Sawhney, H. Recognition and volume estimation of food intake using a mobile device. In Proceedings of the 2009 Workshop on Applications of Computer Vision (WACV), Snowbird, UT, USA, 7–8 December 2009; pp. 1–8.
- Shang, J.; Sundara-Rajan, K.; Lindsey, L.; Mamishev, A.; Johnson, E.; Teredesai, A.; Kristal, A. A pervasive Dietary Data Recording System. In Proceedings of the 2011 IEEE International Conference on Pervasive Computing and Communications Workshops (PERCOM Workshops), Seattle, WA, USA, 21–25 March 2011; pp. 307–309.
- Kong, F.; Tan, J. DietCam: Automatic dietary assessment with mobile camera phones. Pervasive Mob. Comput. 2012, 8, 147–163. [Google Scholar] [CrossRef]
- O’Loughlin, G.; Cullen, S.J.; McGoldrick, A.; O’Connor, S.; Blain, R.; O’Malley, S.; Warrington, G.D. Using a Wearable Camera to Increase the Accuracy of Dietary Analysis. Am. J. Prev. Med. 2013, 44, 297–301. [Google Scholar] [CrossRef] [PubMed]
- Kikunaga, S.; Tin, T.; Ishibashi, G.; Wang, D.H.; Kira, S. The Application of a Handheld Personal Digital Assistant with Camera and Mobile Phone Card (Wellnavi) to the General Population in a Dietary Survey. J. Nutr. Sci. Vitaminol. 2007, 53, 109–116. [Google Scholar] [CrossRef] [PubMed]
- Wang, D.H.; Kogashiwa, M.; Ohta, S.; Kira, S. Validity and Reliability of a Dietary Assessment Method: The Application of a Digital Camera with a Mobile Phone Card Attachment. J. Nutr. Sci. Vitaminol. 2002, 48, 498–504. [Google Scholar] [CrossRef] [PubMed]
- Dong, Y.; Hoover, A.; Muth, E. A Device for Detecting and Counting Bites of Food Taken by a Person during Eating. In Proceedings of the IEEE International Conference on Bioinformatics and Biomedicine (BIBM ’09), Washington, DC, USA, 1–4 November 2009; pp. 265–268.
- Dong, Y.; Scisco, J.; Wilson, M.; Muth, E.; Hoover, A. Detecting Periods of Eating During Free-Living by Tracking Wrist Motion. IEEE J. Biomed. Health Inform. 2014, 18, 1253–1260. [Google Scholar] [CrossRef] [PubMed]
- Dong, Y.; Hoover, A.; Scisco, J.; Muth, E. Detecting eating using a wrist mounted device during normal daily activities. In Proceedings of the International Conference on Embedded Systems and Applications, Las Vegas, NV, USA, 18–21 July 2011.
- Dong, Y. Tracking Wrist Motion to Detect and Measure the Eating Intake of Free-Living Humans. Ph.D. Thesis, Clemson University, Clemson, SC, USA, 2012. [Google Scholar]
- Scisco, J.L.; Muth, E.R.; Hoover, A.W. Examining the Utility of a Bite-Count–Based Measure of Eating Activity in Free-Living Human Beings. J. Acad. Nutr. Diet. 2014, 114, 464–469. [Google Scholar] [CrossRef] [PubMed]
- Thomaz, E.; Essa, I.; Abowd, G.D. A Practical Approach for Recognizing Eating Moments with Wrist-mounted Inertial Sensing. In Proceedings of the 2015 ACM International Joint Conference on Pervasive and Ubiquitous Computing (UbiComp ’15), Osaka, Japan, 7–11 September 2015; pp. 1029–1040.
- Mendi, E.; Ozyavuz, O.; Pekesen, E.; Bayrak, C. Food intake monitoring system for mobile devices. In Proceedings of the 2013 5th IEEE International Workshop on Advances in Sensors and Interfaces (IWASI), Bari, Italy, 13–14 June 2013; pp. 31–33.
- Ye, X.; Chen, G.; Gao, Y.; Wang, H.; Cao, Y. Assisting Food Journaling with Automatic Eating Detection. In Proceedings of the 2016 CHI Conference Extended Abstracts on Human Factors in Computing Systems (CHI EA ’16), San Jose, CA, USA, 7–12 May 2016; pp. 3255–3262.
- Ye, X.; Chen, G.; Cao, Y. Automatic Eating Detection using head-mount and wrist-worn accelerometers. In Proceedings of the 2015 17th International Conference on E-Health Networking, Application Services (HealthCom), Dalian, China, 12–15 October 2015; pp. 578–581.
- Amft, O.; Junker, H.; Troster, G. Detection of eating and drinking arm gestures using inertial body-worn sensors. In Proceedings of the Ninth IEEE International Symposium on Wearable Computers (ISWC’05), Osaka, Japan, 18–21 October 2005; pp. 160–163.
- Biallas, M.; Andrushevich, A.; Kistler, R.; Klapproth, A.; Czuszynski, K.; Bujnowski, A. Feasibility Study for Food Intake Tasks Recognition Based on Smart Glasses. J. Med. Imaging Health Inform. 2015, 5, 1688–1694. [Google Scholar] [CrossRef]
- Wang, S.; Zhou, G.; Hu, L.; Chen, Z.; Chen, Y. CARE: Chewing activity recognition using noninvasive single axis accelerometer. In Proceedings of the 2015 ACM International Joint Conference on Pervasive and Ubiquitous Computing and Proceedings of the 2015 ACM International Symposium on Wearable Computers, Osaka, Japan, 7–11 September 2015; pp. 109–112.
- Eskandari, S. Bite Detection and Differentiation Using Templates of Wrist Motion. Master’s Thesis, Clemson University, Clemson, SC, USA, 2013. [Google Scholar]
- Lecluse, F.L.E.; Brocaar, M.P.; Verschuure, J. The Electroglottography and its Relation to Glottal Activity. Folia Phoniatr Logop 1975, 27, 215–224. [Google Scholar] [CrossRef]
- Abell, T.L.; Malagelada, J.R. Electrogastrography. Dig. Dis. Sci. 1988, 33, 982–992. [Google Scholar] [CrossRef] [PubMed]
- Kamen, G. Electromyographic kinesiology. In Robertson, DGE et al. Research Methods in Biomechanics; Human Kinetics Publ.: Champaign, IL, USA, 2004. [Google Scholar]
- Woda, A.; Mishellany, A.; Peyron, M. The regulation of masticatory function and food bolus formation. J. Oral Rehabil. 2006, 33, 840–849. [Google Scholar] [CrossRef] [PubMed]
- Woda, A.; Foster, K.; Mishellany, A.; Peyron, M. Adaptation of healthy mastication to factors pertaining to the individual or to the food. Physiol. Behav. 2006, 89, 28–35. [Google Scholar] [CrossRef] [PubMed]
- Kohyama, K.; Nakayama, Y.; Yamaguchi, I.; Yamaguchi, M.; Hayakawa, F.; Sasaki, T. Mastication efforts on block and finely cut foods studied by electromyography. Food Qual. Preference 2007, 18, 313–320. [Google Scholar] [CrossRef]
- Kohyama, K.; Mioche, L.; Bourdio, P. Influence of age and dental status on chewing behaviour studied by EMG recordings during consumption of various food samples. Gerodontology 2003, 20, 15–23. [Google Scholar] [CrossRef] [PubMed]
- Holler, F.J.; Skoog, D.A.; Crouch, S.R. Principles of Instrumental Analysis; Saunders College: Philadelphia, PA, USA, 2007. [Google Scholar]
- Farooq, M.; Sazonov, E. Detection of chewing from piezoelectric film sensor signals using ensemble classifiers. In Proceedings of the 2016 IEEE 38th Annual International Conference of Engineering in Medicine and Biology Society (EMBC), Orlando, FL, USA, 16–20 August 2016; pp. 4929–4932.
- Farooq, M.; Sazonov, E. A novel wearable device for food intake and physical activity recognition. Sensors 2016, 16, 1067. [Google Scholar] [CrossRef]
- Kalantarian, H.; Alshurafa, N.; Sarrafzadeh, M. A wearable nutrition monitoring system. In Proceedings of the IEEE 2014 11th International Conference on Wearable and Implantable Body Sensor Networks, Zurich, Switzerland, 16–19 June 2014; pp. 75–80.
- Sen, S.; Subbaraju, V.; Misra, A.; Balan, R.K.; Lee, Y. The case for smart watch-based diet monitoring. In Proceedings of the 2015 IEEE International Conference on Pervasive Computing and Communication Workshops (PerCom Workshops), St. Louis, MI, USA, 23–27 March 2015; pp. 585–590.
- Fontana, J.M.; Farooq, M.; Sazonov, E. Automatic ingestion monitor: A novel wearable device for monitoring of ingestive behavior. IEEE Trans. Biomed. Eng. 2014, 61, 1772–1779. [Google Scholar] [CrossRef] [PubMed]
- Dietz, P.; Leigh, D. DiamondTouch: A Multi-user Touch Technology. In Proceedings of the 14th Annual ACM Symposium on User Interface Software and Technology (UIST ’01), Orlando, FL, USA, 11–14 November 2001; pp. 219–226.
- Cheng, J.; Amft, O.; Lukowicz, P. Active Capacitive Sensing: Exploring a NewWearable Sensing Modality for Activity Recognition. In Pervasive Computing, Proceedings of the 8th International Conference Pervasive 2010, Helsinki, Finland, 17–20 May 2010; Floréen, P., Krüger, A., Spasojevic, M., Eds.; Springer: Berlin/Heidelberg, Germany, 2010; pp. 319–336. [Google Scholar]
- Bedri, A.; Verlekar, A.; Thomaz, E.; Avva, V.; Starner, T. Detecting Mastication: A Wearable Approach. In Proceedings of the 2015 ACM on International Conference on Multimodal Interaction, Seattle, WA, USA, 9–13 November 2015; pp. 247–250.
- Bedri, A.; Verlekar, A.; Thomaz, E.; Avva, V.; Starner, T. A wearable system for detecting eating activities with proximity sensors in the outer ear. In Proceedings of the 2015 ACM International Symposium on Wearable Computers, Osaka, Japan, 7–11 September 2015; pp. 91–92.
- Dong, B.; Biswas, S.; Gernhardt, R.; Schlemminger, J. A mobile food intake monitoring system based on breathing signal analysis. In Proceedings of the 8th International Conference on Body Area Networks, Boston, MA, USA, 30 September–2 October 2013; pp. 165–168.
- Dong, B.; Biswas, S. Wearable sensing for liquid intake monitoring via apnea detection in breathing signals. Biomed. Eng. Lett. 2014, 4, 378–387. [Google Scholar] [CrossRef]
- Zhou, X.; Zhuang, X.; Liu, M.; Tang, H.; Hasegawa-Johnson, M.; Huang, T. HMM-based acoustic event detection with AdaBoost feature selection. In Multimodal Technologies for Perception of Humans; Springer: Berlin/Heidelberg, Germany, 2008; pp. 345–353. [Google Scholar]
- Zieger, C. An HMM based system for acoustic event detection. In Multimodal Technologies for Perception of Humans; Springer: Berlin/Heidelberg, Germany, 2008; pp. 338–344. [Google Scholar]
- Farooq, M.; Fontana, J.M.; Boateng, A.F.; Mccrory, M.A.; Sazonov, E. A Comparative Study of Food Intake Detection Using Artificial Neural Network and Support Vector Machine. In Proceedings of the 12th International Conference on Machine Learning and Applications (ICMLA), Miami, FL, USA, 4–7 December 2013.
- Fontana, J.M.; Farooq, M.; Sazonov, E. Estimation of feature importance for food intake detection based on Random Forests classification. In Proceedings of the 35th Annual International Conference of the IEEE Engineering in Medicine and Biology Society (EMBC), Osaka, Japan, 3–7 July 2013; pp. 6756–6759.
- Duda, R.O.; Hart, P.E.; Stork, D.G. Pattern Classification; John Wiley & Sons: New York, NY, USA, 2012. [Google Scholar]
- US Department of Agriculture, ARS. USDA National Nutrient Database for Standard Reference, Release 22; US Department of Agriculture: Washington, DC, USA, 2009.


| Body Positions | Comfort | Applications | Highest Accuracy | Advantages | Challenges | Current Applicability | Obtrusiveness | |
|---|---|---|---|---|---|---|---|---|
| Acoustic approach | Neck/outer ear/inner ear-toward eardrum | Moderate. Contact with skin sometimes required | Chewing, swallowing events detection | 85% for swallowing and chewing event detection [80]; 98.5% for food state classification [64] | Simple to implement; acceptable accuracy; most suitable for food intake detection, chewing rates | Denoise pre-process needed; accuracy decreased in a noisy environment | Mostly still under testing in laboratory condition | Obtrusive |
| Visual approach | Upper body (neck, chest, etc.)/external by smart phone | High. Attach on clothes/taking pictures with smart phone | Volume estimation, food type classification | 90.6% for food type classification; 94.3% for volume estimation with large data of images [100] | So far the most suitable with the highest accuracy on food type classification | Dependent on battery, especially those using the smart phone’s camera | Applicable in real-life scenarios (eButton [50]) | Unobtrusive |
| Inertial approach | Wrist-neck-head-upper and lower arms | Moderate. Contact with skin required | Bite event detection, food type classification, food amounts | 89.5% for eating detection [113,114]; 94% on eating gesture detection [115] | Able to be embedded in highly wearable items groceries, bracelets, etc. | Limited by eating gestures and bites of food; contact makes it uncomfortable | Real-life scenarios are still questionable [51]; high accuracy in the laboratory condition | Unobtrusive |
| EMG/EGG-based approach | Neck | Low. Contact with skin needed, especially with the neck | Swallowing, chewing events detection, bolus size, food hardness | 86.6% for EGG’s swallowing detection [52] | EGG: novel approach, but still has high accuracy; EMG: traditional approach dealing with mastication’s properties | Highly limited at the neck; EMG sometimes needs exact positions on neck to detect signal | Limited to the laboratory scenario | Obtrusive |
| Piezoelectric approach | Neck | Low. Close contact with skin needed, especially with the neck | Swallowing event recognition | 86% for food states and food type classification (only three kinds of foods) [129] | Limited amount of noises in collected data leads to a less complicated framework | Closed neckband needed for data acquisition | Lab-controlled environment only | Obtrusive |
| Fusion approach | Flexibly (ear, wrist, external, etc.) | High. Existing methods embedded in comfortable devices (smart watch, ear pad) | Swallowing, chewing events detection, food type classification, weight and volume estimation | 92.0% for eating gesture detection [130]; 85.5% for eating mode detection [131] | Combines applications (food types, chewing/swallowing detection); increases accuracy with appropriate framework; high comfort; flexible positions | Actual accuracy has not yet met expectations | Can be tested beyond the lab-controlled environment with acceptable accuracy [127] | Unobtrusive |
| Other approach | ||||||||
| Electrical proximity sensing | Neck | High. Flexible to implement in different body locations | Swallowing and chewing events recognition | 95.3% for eating event detection [134,135] | Does not need direct contact with the skin; flexible positions | Combination of multiple proximity sensors needed for high accuracy | Still in the laboratory circumstance | Obtrusive |
| Respiratory inductance plethysmography sensing | Waist | Moderate. Worn as a belt | Swallowing detection | 88% for swallowing detection [56,137] | Does not require contact with skin; utilizes an indirect eating signal | Accuracy needs improving | Still limited to the laboratory condition | Unobtrusive |
© 2017 by the authors. Licensee MDPI, Basel, Switzerland. This article is an open access article distributed under the terms and conditions of the Creative Commons Attribution (CC BY) license ( http://creativecommons.org/licenses/by/4.0/).
Share and Cite
Vu, T.; Lin, F.; Alshurafa, N.; Xu, W. Wearable Food Intake Monitoring Technologies: A Comprehensive Review. Computers 2017, 6, 4. https://doi.org/10.3390/computers6010004
Vu T, Lin F, Alshurafa N, Xu W. Wearable Food Intake Monitoring Technologies: A Comprehensive Review. Computers. 2017; 6(1):4. https://doi.org/10.3390/computers6010004
Chicago/Turabian StyleVu, Tri, Feng Lin, Nabil Alshurafa, and Wenyao Xu. 2017. "Wearable Food Intake Monitoring Technologies: A Comprehensive Review" Computers 6, no. 1: 4. https://doi.org/10.3390/computers6010004