Improved Capacity and Fairness of Massive Machine Type Communications in Millimetre Wave 5G Network †


1
School of Computing, Science, and Engineering, University of Salford, Salford M5 4WT, UK
2
College of Engineering, University of Anbar, P.O. Box 55431, Anbar, Iraq
*
Author to whom correspondence should be addressed.
†
This paper is an extended version of our paper published in the 9th Computer Science & Electronic Engineering Conference (CEEC), Colchester, UK, 27–29 September 2017.
Computers 2018, 7(1), 16; https://doi.org/10.3390/computers7010016
Submission received: 8 January 2018
/
Revised: 9 February 2018
/
Accepted: 10 February 2018
/
Published: 13 February 2018
(This article belongs to the Special Issue Selected Papers from the 9th Computer Science and Electronic Engineering Conference (CEEC 2017))
Abstract
:In the Fifth Generation (5G) wireless standard, the Internet of Things (IoT) will interconnect billions of Machine Type Communications (MTC) devices. Fixed and mobile wearable devices and sensors are expected to contribute to the majority of IoT traffic. MTC device mobility has been considered with three speeds, namely zero (fixed) and medium and high speeds of 30 and 100 kmph. Different values for device mobility are used to simulate the impact of device mobility on MTC traffic. This work demonstrates the gain of using distributed antennas on MTC traffic in terms of spectral efficiency and fairness among MTC devices, which affects the number of devices that can be successfully connected. The mutual use of Distributed Base Stations (DBS) with Remote Radio Units (RRU) and the adoption of the millimetre wave band, particularly in the 26 GHz range, have been considered the key enabling technologies for addressing MTC traffic growth. An algorithm has been set to schedule this type of traffic and to show whether MTC devices completed their traffic upload or failed to reach the margin. The gains of the new architecture have been demonstrated in terms of spectral efficiency, data throughput and the fairness index.
1. Introduction
The emergence of low power consumption wireless technologies is one of the main enablers of the Internet of Thing (IoT) and the emergence of the Fifth Generation (5G) wireless standard in 2020 will be the key to IoT growth and its establishment as a tangible concept to the user.
A key enabling factor for IoT traffic growth is the proliferation of wearable devices and sensors. These devices can be worn on a person and have the potential to communicate to the network directly through wireless connectivity or indirectly through a smartphone using Bluetooth, ZigBee and Wi-Fi or any other standards. Such devices include smart watches, smart glasses, smart health sensors, fitness sensors, navigation and tracking devices and so forth [1]. The huge growth of mobile traffic is generated by billions of connected devices. Moreover, the introduction of Machine Type Communications (MTC) is significantly accelerating this growth. To meet these demands, 5G must have the technologies to support such growth.
MTC describes technologies, algorithms and mechanisms that enable connected devices and services to perform data transaction seamlessly without human intervention. Seamless MTC connectivity is vital, especially when the number of devices involved can be significantly large and therefore, it would be meaningful and more sensible if the MTC devices communicate directly without human intervention [2].
One of the main challenges of the future 5G network is how to handle massive MTC traffic due to billions of connected devices and machines that need wireless connectivity. In IoT, a huge number of MTC devices (billions of sensors) will need access to the network periodically to transmit their payloads with very low data rates requirements. These devices include wireless sensors, weather and environment sensors and vehicular communication [3]. In addition, there are wearable sensors that are used to measure user health status (body temperature, blood pressure and heart beat)—these wearable devices monitor the health of patients and can trigger an alert when a health issue arises.
Globally, 325 million MTC wearable devices existed in 2016, where 11 million of them have embedded cellular connections. This figure is anticipated to reach 11.6 billion connected devices in 2021, exceeding the world population in that year [4]. These devices include car GPS systems and tracking devices, smart metering and utilities, health sensors that help patient’s record their health status, home and office security, maintenance sensors, building automation, automotive and consumer electronic gadgets. This growth in smarter devices and MTC connections is an indication of the massive growth of IoT, which brings together people, machines, processes and data, to make mobile computing and machine connectivity very pervasive in the 5G era. MTC capabilities are experiencing an evolution from 2G to 3G, 4G and new wireless technologies. As per Cisco Virtual Network Index (VNI), the traffic size of the M2M category will dramatically increase from 0.157 Exabytes per month in 2016 to 2.224 Exabytes per month in 2021, with a Compound Annual Growth Rate (CAGR) of 70% [4], as shown in Figure 1.
In this paper, the concept of Distributed Base Stations (DBS) with Remote Radio Units (RRUs) is adopted in order to sidestep the lack of coverage that characterises millimetre wave band (mmWave) communications, particularly in the pioneer band at 26 GHz [5]. The use of RRUs in a mobile network was originally proposed to improve the indoor coverage of a cellular network [6]. In Reference [7], RRUs were used to improve the network coverage in high data rate demands areas, the authors conducted empirical measurements regarding the links connecting the BBUs and RRUs. An algorithm was developed in Reference [8] in order to optimise the number of RRUs deployed in a network using game theory. Multipoint transmission coordination of distributed RRUs has been investigated in References [9,10]. While the first investigation on using remote antennas in the mmWave band was introduced in Reference [11], where the author has demonstrated the importance of remote antennas on minimising the shadow fading of wireless networks in the Local Multipoint Distribution Service (LMDS) band.
In Reference [12], the authors have investigated how to support MTC services through HetNets with relay deployments and Carrier Aggregation (CA) in the Long Term Evolution (LTE) network. However, they only considered fixed (stationary) sensors such as weather sensors and used a single base station that is equipped with omnidirectional antenna. The authors in Reference [13] have proposed a mechanism for the traffic engineering of MTC through multi-objective optimization and enhances the performance of both machine traffic and human traffic. The impact of MTC traffic on cellular network has been considered by Reference [14], where the authors have proposed a general framework to evaluate the MTC performance in cellular network.
In mmWave bands, however, there are few contributions on MTC traffic in these bands. In Reference [15], MTC communication has been studied at a 40 GHz carrier frequency with 5 m link distance and the study has been conducted for healthcare sector. An experimental channel measurement has been conducted at 60 GHz for an indoor scenario [16], which shows channel interdependency that can help predict channel parameters in Machine-to-Machine (M2M)/MTC sensor network. Also in Reference [17], a 60 GHz channel capacity and bit rate analyses has been presented and compared with the sub 6 GHz links from IoT perspectives—the authors have found that the use of the mmWave band is a viable solution for the provision of a high performance links to support IoT.
This paper, however, investigates the joint use of DBS network architecture and the adoption of mmWave, particularly 26 GHz, to cope with the massive traffic of MTC connections, where fixed sensors and wearable sensors are supported by 5G in the IoT environment. The rest of the paper is structured as follows: Connected Health (CH) is discussed in Section 2. In Section 3, the DBS structure is clarified, while the network model is described in Section 4. In Section 5, the problem formulation is discussed, followed by the resource assignment algorithm in Section 6. The simulation result is presented and discussed in Section 7. The gain of using DBS network architecture is discussed in Section 8. Finally, the conclusions are drawn in Section 9.
2. Connected Health
The 5G network will support sensors with very low energy consumption, e.g., one battery charge every 15 years. This new paradigm will be very beneficial for medical connected devices such as blood pressure or insulin body sensors. 5G will provide healthcare solutions through connected health (CH), which could be for prevention, providing medical information and monitoring.
In References [18,19], a measurement of different medical sensors has been collected as shown in Table 1. These sensors are used to be connected to patient’s body for continuous measurements and feedback. Some of them are used for rehabilitation, which need continuous transmission and monitoring. These sensors include Electroencephalography (EEG), electrocardiography (EKG), body temperature, heartbeat, insulin level and blood pressure. A new technology studying a prototype chip that is used to predict a heart attack before it happens by measuring some biological parameters and to warn its user.
These sensors are classified into three types: (i) “wearable” sensor: where a patient can wear these sensors to start collecting their data. This type of sensor includes temperature, pressure and accelerometer sensors; (ii) The second type is “implantable” in the patient’s body, such as camera pill and insulin level sensors, which need to be injected into the body; (iii) The third category is “stationary” sensors, which are placed in a medical centre for example, so that these sensors will surround patients and be used to collect information about patient behaviours, such as visual sensors—for more details on body sensors please refer to Reference [20]. The connected health diagram is shown in Figure 2, where a group of patients are uploading their information through the wireless local area network (WLAN) of the medical centre. In this scenario, a user can use their smartphone as a gateway for M2M links; the smartphone will periodically collect information from these sensors through e.g., (Bluetooth, Wi-Fi) with a special M2M application made for this purpose. The M2M Gateway sends the data using the 5G cellular network to a special server, which is M2M data management to manage and store the data. After that, these data are sent to a medical centre for monitoring and further processing.
3. Distributed Base Station
In the radio access network (RAN) [21], the cellular network is modelled with Base Stations (BS)s that are responsible for providing coverage and resource assignment to the users. The default architecture is three sectors implementation, in which the BS is transmitting with directional antennas in three directions. All antennas are co-located at the BS location, the term CBS will be used for future representation of Co-located BS. An alternative approach is DBS network architecture. DBS splits the BS into two parts: the BBU part located at the centre and RRUs part that are mounted on remote towers apart from their corresponding BBUs.
In this scheme, the RRUs are connected with fibre links to their corresponding BBUs. Fibre links are used to power the RRUs and carry the signalling.
The DBS network fits well with C-RAN network architecture. In C-RAN, BS comprises a number of distributed RRUs that are connected with high speed fibre links to their BBUs, where all data processing is handled. Signalling is carried over these dedicated links—called fronthaul—which connect the RRUs to the BBU [22]. RRUs have the ability to improve the signal to interference plus noise ratio (SINR) in their deployment area. The SINR mapping is shown in Figure 3, where DBS architecture is used, representing three BBUs and for each BBU there are two RRU, the path loss and shadow fading map is shown here, comparing default CBS architecture with no remote antennas with a DBS architecture with two remote antennas. As shown in this figure, SINR is improved in the regions where RRUs are existed. RRU system design includes transceivers, duplexers, analogue to digital conversion (ADC), filtering processes and power amplifier (PA) stage. DBS network architecture paves a new paradigm for 5G UDN deployment, by making the next generation network architecture efficient, flexible and scalable.
The adoption of RRUs in next generation network has many advantages, such as [23]:
- Smaller footprint and higher software flexibility.
- Easier installation, lower site rental costs, remote and easier upgrades.
- Optimized coverage, with potential multipoint transmission enabled by runtime precoding, which support spatial multiplexing [9].
- Higher energy and spectral efficiency network.
In this work, RRUs are exploited to forward traffic to the cell edge users, where remote RRUs share the resources with the BBU using the same centralised scheduler. RRUs have been located apart from the BBU in order to provide optimum coverage and capacity to all surrounding users [24].
4. Network Model
The network model is described in Figure 4, where mmWave nodes operating at 26 GHz with multiple RRUs connect a finite number of MTC devices, with different sensor types. Four networks have been considered, each with specific device requirements. These network ranges from net-1 with the least demanding MTC devices to net-4, with the most stringent requirements. The MTC devices are either fixed, such as smart meters or mobile such as health monitoring sensors; which have been modelled with three different speeds, to evaluate their performance, namely (0, 30 and 100) kmph, as such sensors are expected to be worn by the mobile user.
Orthogonal Frequency Division Multiplexing (OFDM) is used as the waveform in this work due to its high performance in dealing with multipath signals, lower computational complexity and direct compatibility with Multiple-Input Multiple-Output (MIMO) system. The system bandwidth is divided into small divisions called Resource Blocks (RB). Each RB is allocated to a single MTC sensor for single Transmission Time Interval (TTI), each TTI equals to 1 ms [25].
In Reference [3] the authors have studied the requirements of real-time fixed smart metres, they have found that data transaction by these smart metres occur every Ts = 120 s, where smart metres transfer data by accessing the network for Ta = 430 ms and transmit their payload at a rate of Rb = 60 kbps. This is the most stringent fixed sensor requirement, as other sensors are less stringent. For instance, some weather sensors access the network to upload data at periods of five minutes. Additionally, some health sensors require uploading data with very low rate (heart beat Rb = 640 bps, body temperature at 2.4 bps and blood pressure at rate of 1.92 kbps [19]). However, EEG has the highest demands of 98 kbps as shown in Table 1 and therefore, a margin of 100 kbps is used in the setting of our algorithm.
4.1. The mmWave Bands
Due to spectrum scarcity in the legacy spectrum below 3 GHz, the 5G system will extend its frequency to the mm-wave bands, particularly from 20 to 90 GHz, because there is a vast amount of unexploited bandwidth. This step is revolutionary because of the very different propagation rules, severe atmospheric attenuation and hardware constraints that characterise mm-wave communication. These challenges, however, can be overcome by using beamforming and larger scale antenna arrays. It is generally accepted that the mm-wave communication is better used with small-cell radius below 200 m, in order to reduce the high path loss and atmospheric attenuation (by making APs closer to the users). Fortunately, this action of using dense mm-wave hotspots fits with the trend of current network densification by small-cells [26,27,28].
As per the Federal Communications Commission (FCC), International Telecommunication Union (ITU) and the UK Office of Communications (Ofcom), released the many bandwidths at mmWave band for point-to-point communications and broadband wireless systems with light license [29]. This band includes: 500 MHz at 26 GHz band in the UK, LMDS band from 28 to 30 GHz and 38 GHz, the license-free band at 60 GHz and the E-band at 71–76 GHz, 81–86 GHz and 92–95 GHz [26]. The mmWave node has three sectors with directional antennas patterns:
where θ3dB is the 3 dB horizontal beam width that is equals to 65 degree, θ ranged from −180 to 180 degree and Am is the maximum attenuation that’s equal to 20 dB [25]. All MTC devices are equipped with omnidirectional antennas with 0 dB gain. The network model parameters used in the simulation are shown in Table 2.
4.2. Path Loss
Channel measurements such as in [30,31] demonstrate that mmWave is sensitive to blockages, with different path loss between LOS and NLOS transmission. These signals have high penetration loss through solid materials and high rain attenuation due to scattering [26]. Therefore, LOS transmission is limited by the existence of blockage. Furthermore, NLOS transmission as a result of reflected LOS from blockage surface are generally week but usually can contribute to cover the shadowed areas caused by blockages [31]. In general, LOS propagation is similar to the free space, with a path loss exponent of 2 [32]. While the path loss exponent of NLOS link is shown in [30,32] to be larger than the LOS exponent, of around 3.86 at UT Austin campus and 5.76 in New York city downtown. Recent path loss model for mmWave above 6 GHz has been released by 3GPP in [33,34].
The Macroscopic path loss between a BS and MTC device is represented by the propagation path loss as shown in Figure 5. where:
with
for LOS transmission, and:
for NLOS transmission [34], f is the carrier frequency in GHz, d3D is the distance in metres between BS and MTC device as described in Figure 5 and hBS is the height of the BS. The distribution of the shadow fading is log-normal, with different standard deviation for each scenario, outdoor, indoor, office layout, LOS/NLOS. All these details are given in the 3rd Generation Partnership Project (3GPP) documentations in [34] in Table 7.4.1-1.
4.3. MTC Traffic Model
This traffic model of MTC is represented by the case when devices have a finite amount of data to transmit and hence the name finite buffer. When this finite data is transmitted, the session is finished and the devices are then removed from the resource scheduler and enter a waiting time during which they start collecting new data for a new session. Finite buffer includes device transmission or reception of a given rate Rb and for finite time intervals Ta, when this time is finished the device is removed from the scheduling process, collects new data for a finite time interval Ts, after that the device starts a new session [35].
The simulation time should be long enough to accommodate for the sensor's activity time, in which all transmissions occur and sleeping time in which data collection occurs. In this work, 400 ms is considered for the session time (active), after this the session expires; a data collection session starts which lasts for two minutes. The simulation results obtained when using finite buffer traffic model are tends to be more realistic compared with “full buffer” traffic model because in normal cellular network, users are not expected to request an infinite amount of data, which is the case characterised by the full buffer model.
4.4. Inter-Cell-Interference
Inter-Cell Interference (ICI) is one of the main challenges that degrades the performance of wireless network, particularly at the cell-edge areas. ICI is caused by reusing the same time-frequency resources is used in nearby cells, which cause co-channel interference. ICI increase significantly in the next generation UDN network architecture, because network deployment is with high densification. With the dramatic increase of ICI from surrounding cells, ICI coordination (ICIC) is necessary to cope with excess interference. One of the most effective ICIC is the Fractional Frequency Reuse (FFR) [36]. The impact of ICI from the surrounding cells has been considered in this work in order to realise an accurate traffic and fairness measurements of the network model.
4.5. System Interoperability
There are several MTC solutions that have been developed in order to address a certain demands and services. This has resulted in a dispersion of the technical solutions, which make current M2M markets are much segmented [19].
Therefore, in order to have interoperability between MTC applications and cellular networks service, the European Telecommunications Standards Institute (ETSI) has established a technical committee that focus on M2M Service. There are two reference terminologies for MTC: the 3GPP—MTC and IEEE 802.16p, which include enhancements to support machine-to-machine communications (M2M). Both focus on improving network access and core networks. These two schemes are complement to M2M service by ETSI. Therefore, it is possible to combine M2M service by ETSI with any M2M from 3GPP or IEEE, which result in a cellular-centric M2M architecture. In addition, in order to avoid market dispersion and reduce unnecessary and arbitrary standardisations, the “oneM2M” Partnership Project was founded in 2012, the focus is to develop “one” standard for M2M and IoT specification and on consolidating M2M services and standard activities into one unified framework, known as oneM2M [37].
5. Problem Formulation
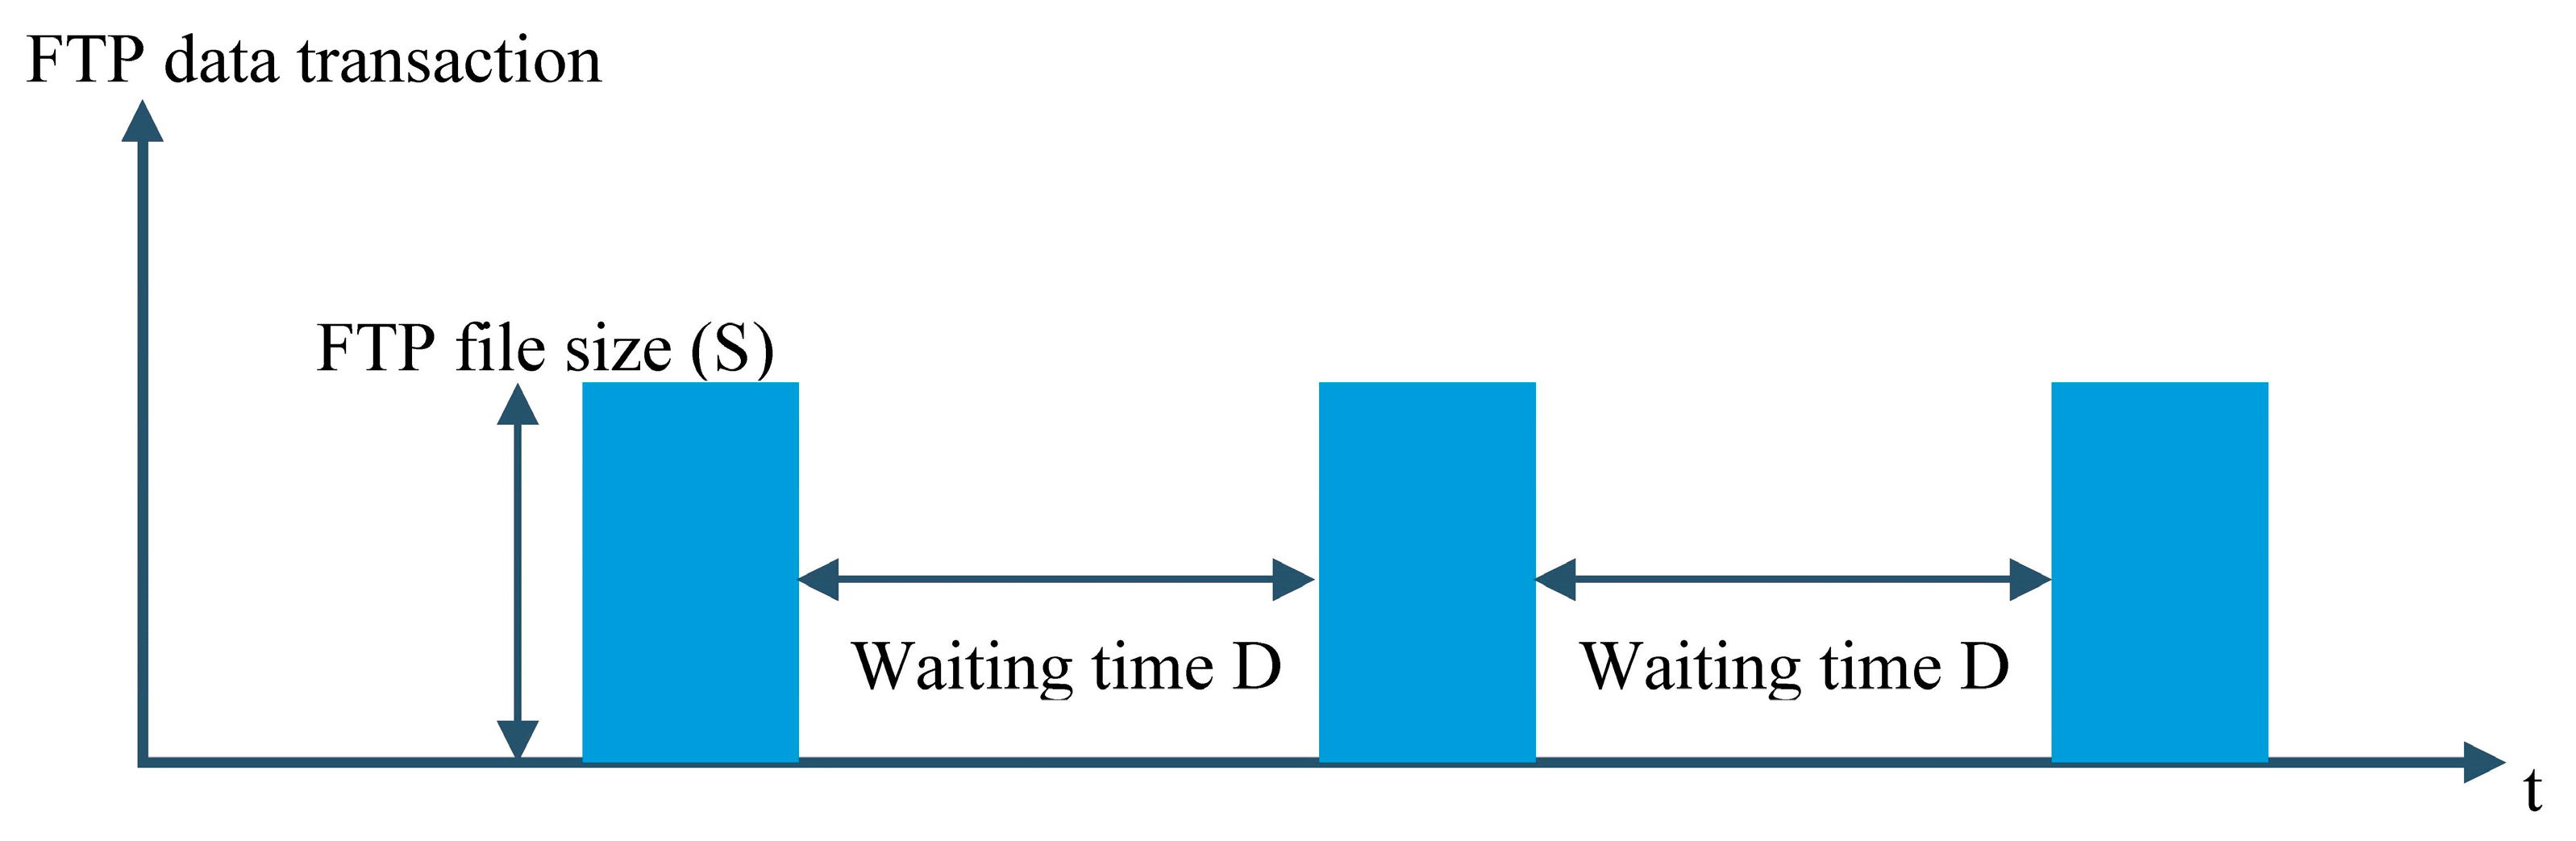
The 3GPP Model [33] defines FTP bursty traffic according to three parameters: file size S, reading time D and the number of devices i, as shown in Figure 6. The device data rate will be:
where xi is the device achievable data throughput and ti is the time required to download Si data (time from the start of reception of the packet until the last bit of the packet is delivered).
In finite buffer traffic model, which characterise MTC category, the device will stop using the network resources once the payload is successfully transmitted. Therefore, the MTC device data throughput is measured by calculating all successfully transmitted bits are taken into account. This means we actually count how many bits are transmitted in less than simulation time (400 ms), which is generally less than the capacity equation.
The traffic density of ROI is defined as the total traffic originating from the total sensor networks within the ROI. Therefore, R is the overall traffic density, which represents the sum rate of the data throughput r of all devices in all sensors networks:
where: n1, n2, n3 and n4 are four sensor networks with different requirements, j, k, m and n represent the number of MTC devices in the four sensor networks, respectively.
Each network has MTC devices that have certain traffic requirements in order to fulfil their data transaction in a certain time interval. The traffic model of MTC is described as a as low data rate, with small-packet burst traffic [13].
As per 3GPP documentation in [38], “an FTP session is a sequence of file transfers separated by reading times”. There are two main parameters of FTP session: the file size to be transferred and the reading time, which is “the time interval between end of download of previous file and the user request for the next file”. S has a log-normal distribution with probability distribution function (PDF) as [38]:
Therefore, the machines should complete their data transaction of (Si) with a data rate of xi during the allowed time of each type. Any machine that fails to reach this bound will be in outage and their data packets will be discarded.
Once RB resources are granted to a machine, they shall be removed from the total resources in order to avoid giving the same RB to more than one machine at a particular tti, thus:
where, Xn is the available RBs after removing the assigned RBs Xa from the total number of RBs XT. The same holds correct for the MTC device, any device that complete their data transaction should also be removed from the total number of MTC devices that require scheduling, therefore:
where, Yav represents the MTC sensor that yet to complete data transaction, YT represents the total number of devices in the simulation and Ys represents the scheduled devices that successfully completed their data transaction.
6. Simulation and Resource Assignment
In sensors network, MTC devices access the cellular network periodically every Ts, in order to transmit their payload for a short period of time Ta. During Ta, the devices should achieve a minimum data throughput of Rb ≥ xi for transmitting the devices payload. After that, MTC devices enter a waiting time during which these devices collect new data for a new session. The authors in [3] have investigated the requirements of real-time smart devices under MTC, they have found that data transaction occur every Ts = 120 s, where these devices make data transaction for Ta = 430 ms. For the sake of safety, and considering the worst case in this work, an access time for these devices has been set to 400 ms = 400 TTI, where MTC devices need to complete their payload transfer.
The simulation and resource assignment of MTC devices is described in Algorithm 1. The simulation is initialised by setting a ROI, in which the BSs and devices (sensors) are generated within that ROI. The simulation lasts for 400 TTIs to allow the sensors to upload their payload. This time has been selected based on stringent MTC devices requirements, as indicated in [3,12]. The number of RBs is defined as well according to the system bandwidth. The algorithm then checks the available MTC devices that request data transmission and the assigned scheduler try to grant resources, taking into account the fairness among them as well as their data rate flow. Three different schedulers have been used to demonstrate the impact of using DBS architecture for MTC traffic in sensors network. The schedulers used are Round Robin (RR), Proportional Fair (PF) and best CQI (b-CQI) algorithm. After checking the link quality model, the BBUs receive devices feedback and the corresponding scheduler will assign resources. Any RB that has been assigned will be removed from the available resources to avoid granting the same RB for more than one device at the same TTI. Furthermore, all devices that completed data transaction before Ta has elapsed will also be removed from the available set of devices that need access. The resource manager will assign RBs until all available RB is exhausted or all devices complete their data transaction. After that the data throughput is calculated for devices that successfully completed data transaction within the allowed time (400 TTI). The peak, average and cell-edge throughput is calculated in order to demonstrate the importance of DBS architecture over CBS. The peak and cell-edge data throughput represent a 5% of the Cumulative Distribution Function (CDF) of the total data throughput, where the peak throughput denotes the average of the best 5% of MTC devices throughput and the cell-edge throughput denotes the average of the worst 5% of MTC devices throughput.
For DBS scheme, up to 6 RRUs have distributed per BBU. All MTC devices will have resources scheduling (RS) processed at the BBU end with RR, PF, or best CQI. The BBUs receive the devices CQI through all RRUs, where there is a single RS algorithm that’s responsible for resource allocation for all UEs connected to the BBUs and their corresponding RRUs.
| Algorithm 1: Proposed Resource Assignment Algorithm | |
| Define ROI % region of interest | |
| set τ = 400 tti % simulation time, this represents the transmission time Ta | |
| define network geometry as either: CBS, with no RRUs % network set as three sectored sites or DBS, with up to 4 RRUs per BBU. % network set as BBU and RRUs set a 4 × 4 MIMO system for both CBS&DBS.% MIMO type 4 × 4 (CLSM) set network size of 21 BBUs, 6 RRUs per BBU and MTC devices. % network size per 150 m ISD, 21 BBUs, up to 6 RRUs per BBU, with MTC devices. set three RS algorithms: RR, PF, best CQI. % these the scheduling algorithms that can be used to schedule MTC traffic. | |
| Generate BBUs/RRUs per ROI % within ROI, generate the network BSs. | |
| Set finite MTC devices per node % distribute MTC devices with ftp traffic model | |
| for each TTI do | |
| Check available sensors Yavail/available resources NRB % how many devices require network access. | |
| if devices outside ROI then | |
| reallocate these devices inside ROI % inclusion area only inside ROI | |
| end if | |
| for each Tx Node do | |
| Receive all devices feedback % CQI of MTC devices | |
| Schedule sensors according to resources availability % start RS | |
| if Rb ≤ xi kbps then % if MTC device did not reach the threshold | |
| assign RB % add more resources | |
| Xn(RB) = XT(RB) − Xa(RB) % Remove assigned RB | |
| Check the fairness and data rate flow for all devices | |
| end if | |
| Calculate channel state (link quality model), SINR % as per CQI | |
| Perform SINR→throughput mapping | |
| Calculate Rb, SE and J index % performance metrics | |
| Aggregate cell throughput % for all MTC devices per cell (BBU) | |
| end for | |
| if Rb > xi then % when MTC device completed data transaction | |
| Receive sensor payload % receive the successfully transmitted packets % successful transaction | |
| Yav(MTC) = YT(MTC) − Ys(MTC) % Remove scheduled sensors | |
| end if | |
| end for | |
7. Simulation Results and Discussion
In this study, multiple bandwidth allocations have been used to support different number of machines. In addition, we have used many transmission modes for each bandwidth to assess their impact on future MTC traffic. We have calculated the number of devices that have completed data transaction successfully within the allowed time period (400 TTI). We have also traced all these devices to calculate how much the data rate along with their wideband SINR and the amount of resource assigned per TTI. Table 3, Table 4 and Table 5 show the number of health sensors that successfully sent their payload (100 kbps) during the allowed time intervals 400 ms and for device speed of (0, 30 and 100) kmph that simulate stationary, low speed and fast-moving users in car, respectively. The figures in these tables are for the most stringent sensors demands, normally; some sensors need to transmit a very low data with very long time intervals. Such sensors are less stringent and can easily satisfy their demands with this approach. Taking into account the fact that most of the current sensors support only one antenna, to reduce their size, power consumption and increase their battery life time, Single Input Single Output (SISO) figures are the lower bound for the number of MTC devices that can be supported based on the allocated bandwidth. When MTC devices are equipped with two antennas, the BS can configure MIMO links, with diversity or Closed Loop Spatial Multiplexing (CLSM), which significantly increases the data rate. As we can see in Table 3, Table 4 and Table 5, the data throughput of MIMO figures is much higher than SISO figures for the allocated bandwidth.
Generally, we have used 500 devices in order to check the dimension of the connectivity and weather these devices completed their data transaction in time or not. For a certain bandwidth/number of resources, the MTC devices have been added group by group in every simulation until some devices cannot have enough resources to complete data transaction (considered in outage). This is done to ensure how many MTC devices can be supported per the allocated bandwidth, where a maximum of 474 out of 500 devices have successfully completed their data transaction, as shown in Table 3—MIMO figure with 20 MHz bandwidth.
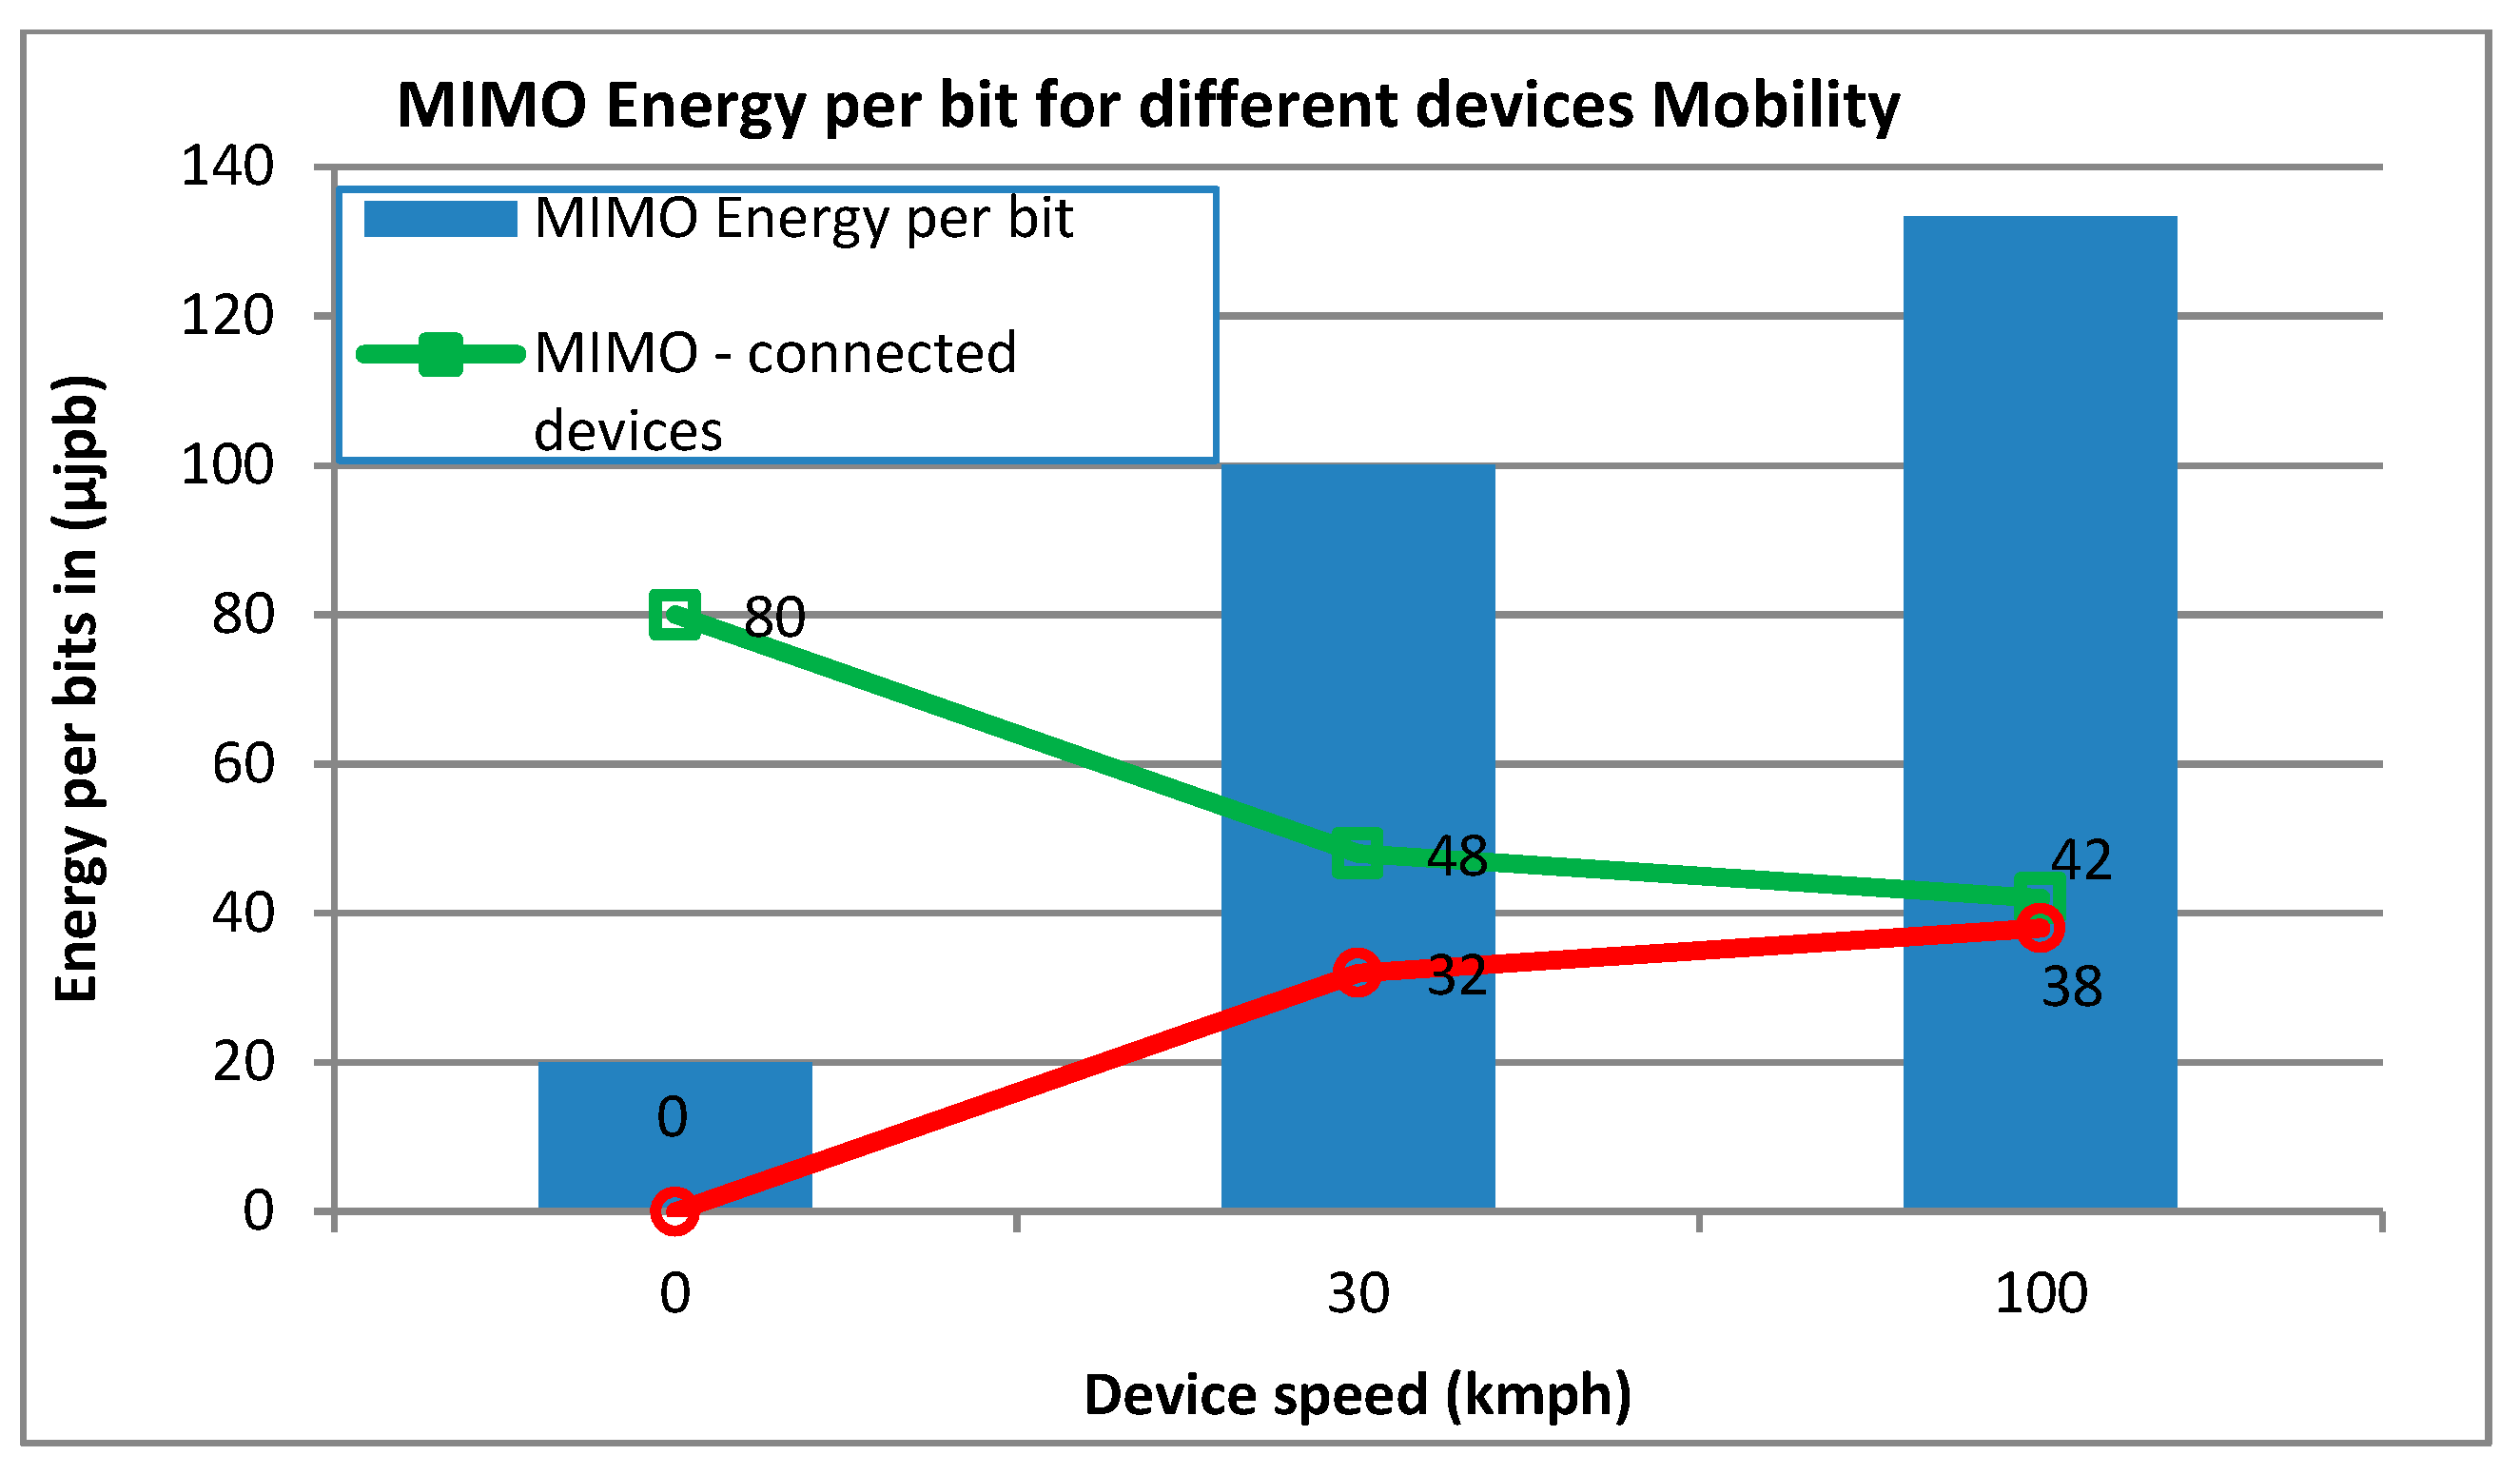
In addition, as the user move faster, there will be considerable increase in handover rate and channel estimation time. This will decrease the data rate of MTC devices, which consequently decrease the number of MTC devices that can be simultaneously connected based on certain bandwidth. A test has been made for 80 sensors with speed of 0 kmph, 30 kmph and 100 kmph and for each speed, the simulation has been repeated to investigate the impact on the connected devices with bandwidth allocation of 5 MHz [39]. Higher mobility of devices will also increase the power consumption of the devices, Figure 7 and Figure 8 show the energy per bit in micro joule per bit (μjpb) for all MTC devices including those in outage (devices that fail to make full data transaction) and for SISO and MIMO.
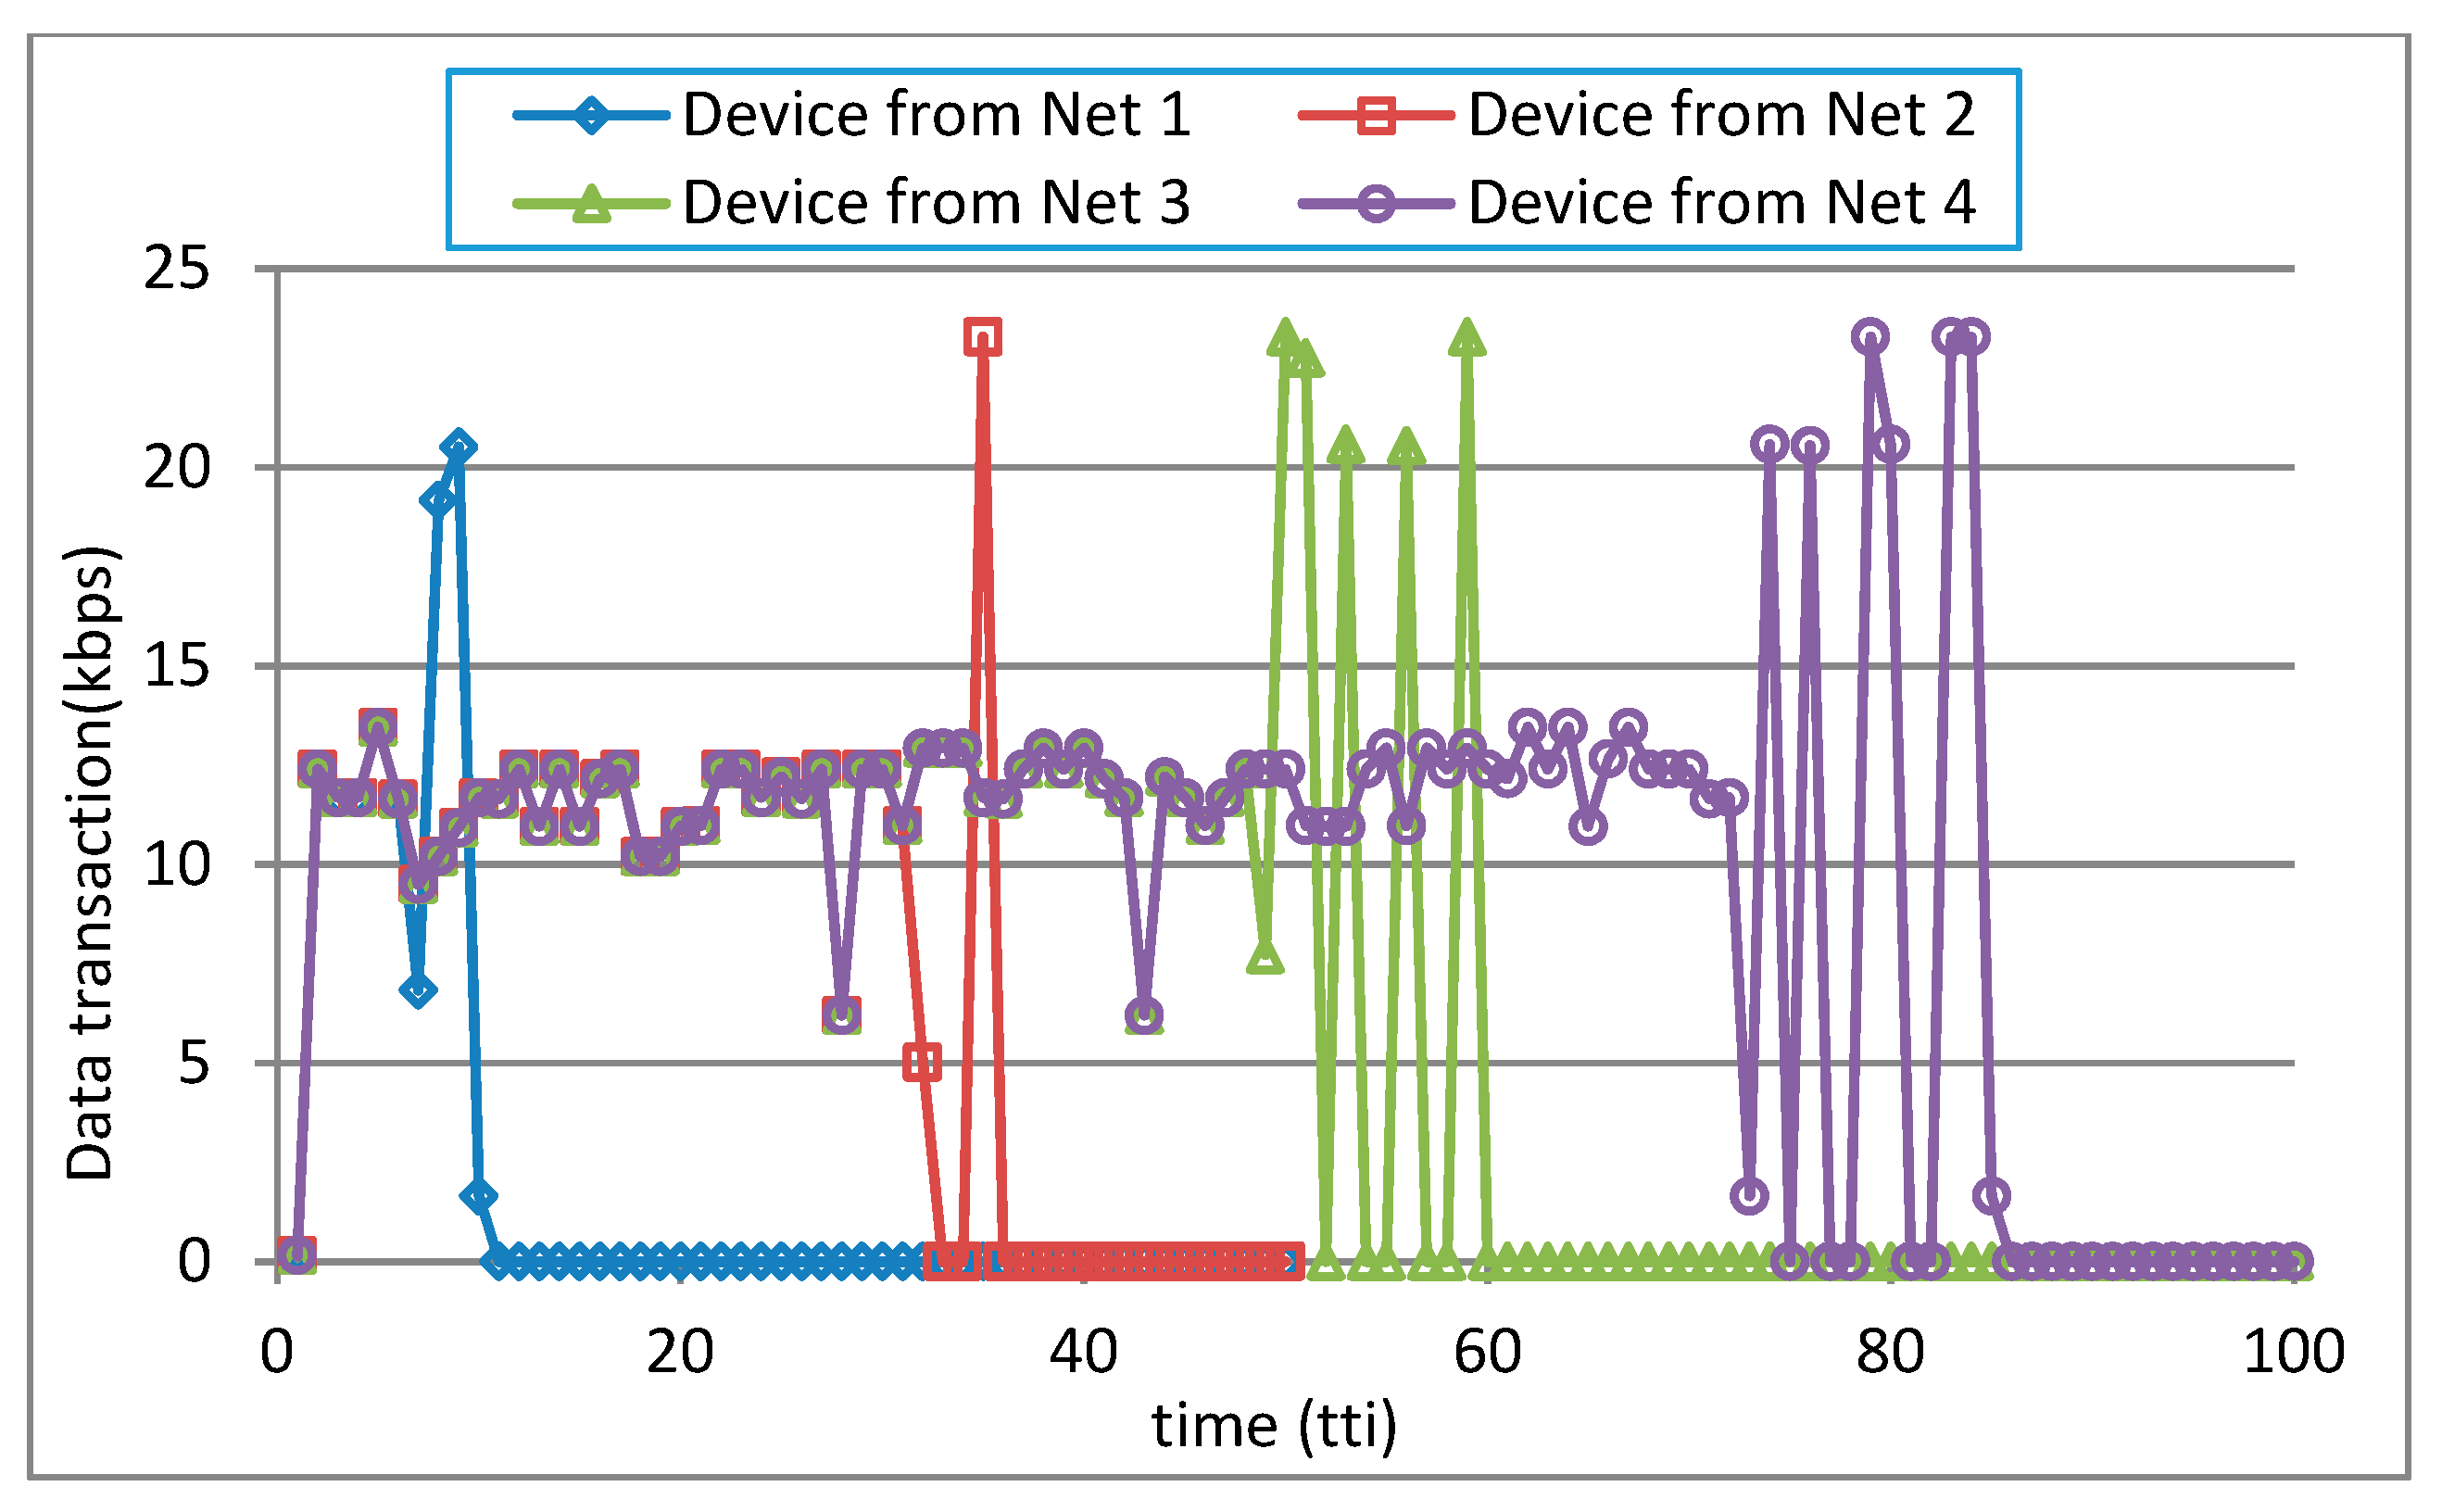
Figure 9 shows the data transaction from four different MTC devices, each belong to a certain corresponding sensor network. Each device has different requirements in term of the ftp file size to be transferred and the required time for this transaction to be completed. Therefore, as depicted in Figure 9, the devices that have low requirements have completed their data transaction sooner than those devices with higher data requirements (larger ftp file size).
8. Scheduling and Fairness with RRUs
Scheduling considered here is a centralised scheduling in which all the network resources will be assigned and processed at the BBUs end. RRUs do not have their own scheduler or resources but rather act as a transparent relay to their corresponding BBUs, to improve the resources use efficiency. Scheduling DBS network with distributed RRUs will not only improve the data throughput but also the resources fairness.
Fairness index [40] rates how equally the resources are distributed over N number of devices, defined by:
where x is a vector of length N, which contain the data throughput achieved by the N devices.
The scheduling simulation has been conducted as per Algorithm 1 for RR, PF and best CQI algorithms. Seven BSs has been considered with 30 devices per node. This is because that the network size is determined by the inter-site distance (ISD). ISD has been set to 150 in order to simulate dense network scheme in mmWave which help compensate for the high path loss at this band [30,41,42]. Therefore, with our chosen 600 m2 ROI, there are only seven sites that “fit” in the ROI, expanding the ROI will insure more sites in the simulation but will NOT affect the result, as the ISD is the same.
Generally, we have used 500 devices in order to check the dimension of the connectivity and weather these devices completed their data transaction in time or not. As per the network model table, there are 500 MTC devices in total under test. For a certain bandwidth/number of resources, the devices have been added group by group until some devices cannot have enough resources to complete data transaction (considered in outage). As shown in Table 3—MIMO figure, for instance, there are 474 devices that completed their payload transfer. This has been elaborated in the section of results and discussion. The outcome is shown as per Table 3, Table 4 and Table 5, where a maximum of 474 out of 500 devices have successfully completed their data transaction (MIMO at 20 MHz). Then when it comes to show the scheduling, spectral efficiency calculation and fairness calculation, only 30 devices were used, in order to check the successfully received bits, calculate the consumed energy per bit, to all devices in test, which in this case 30 devices only (for the sake of simplicity).
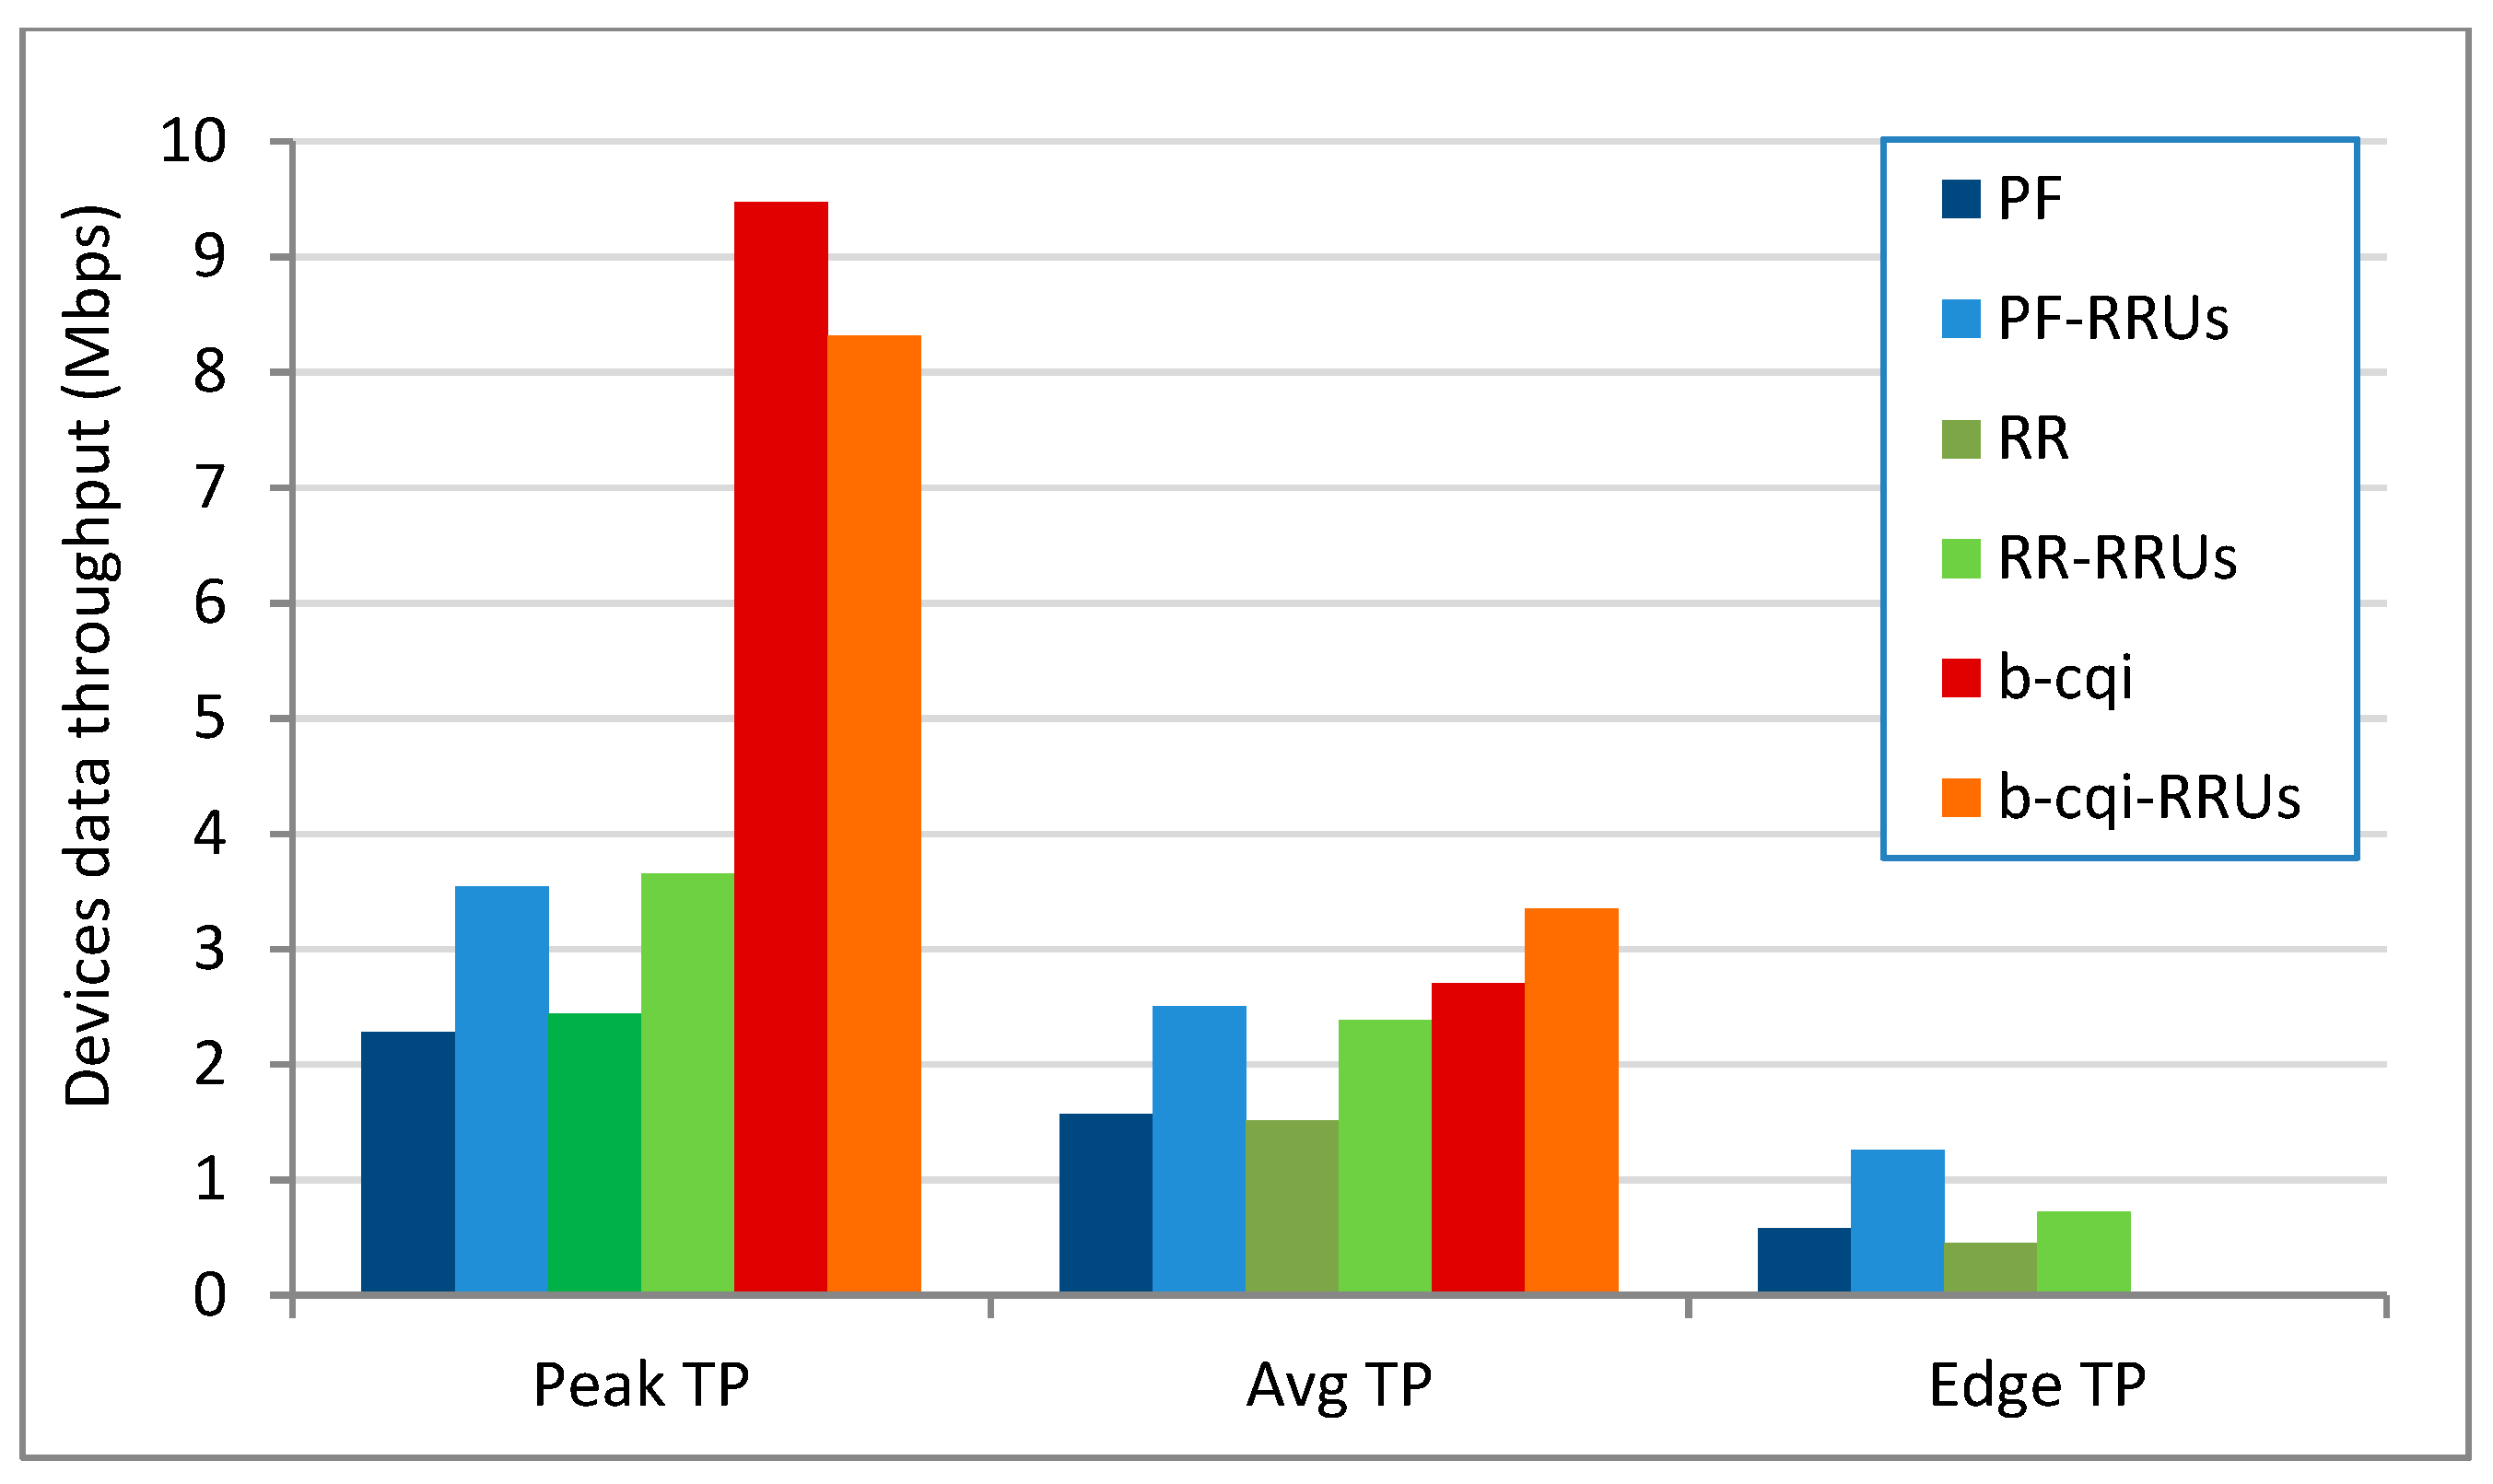
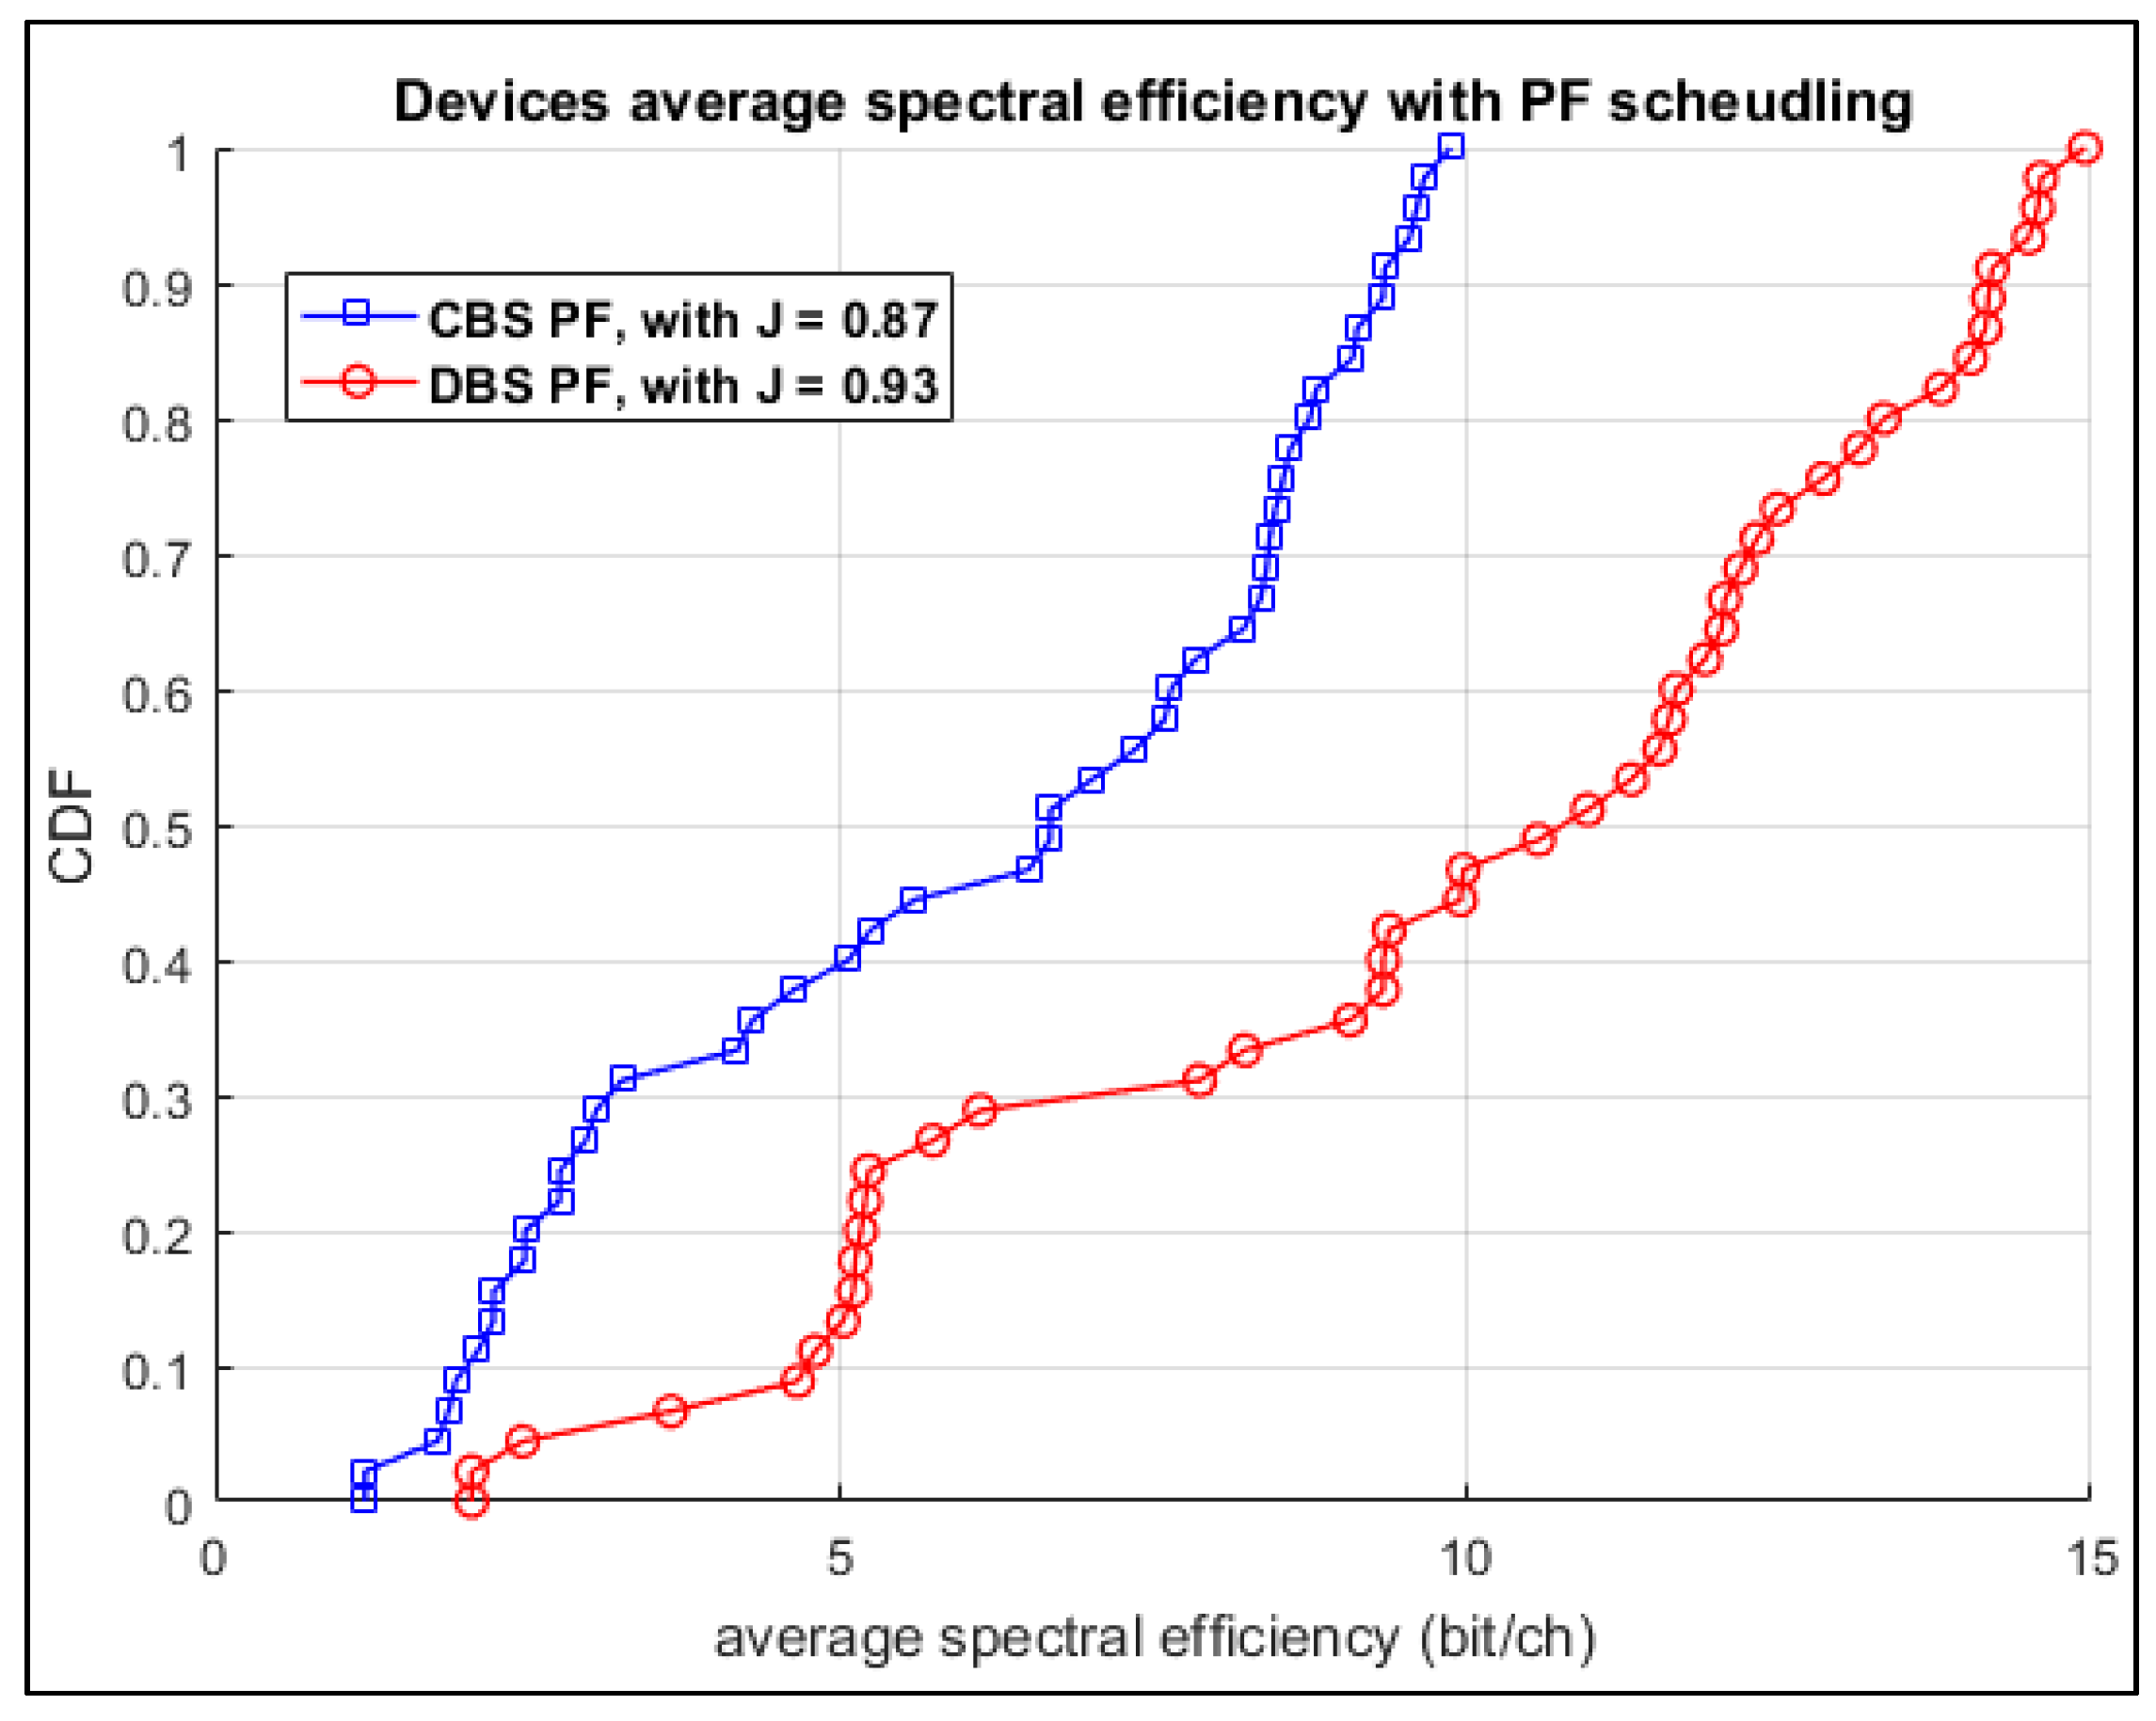
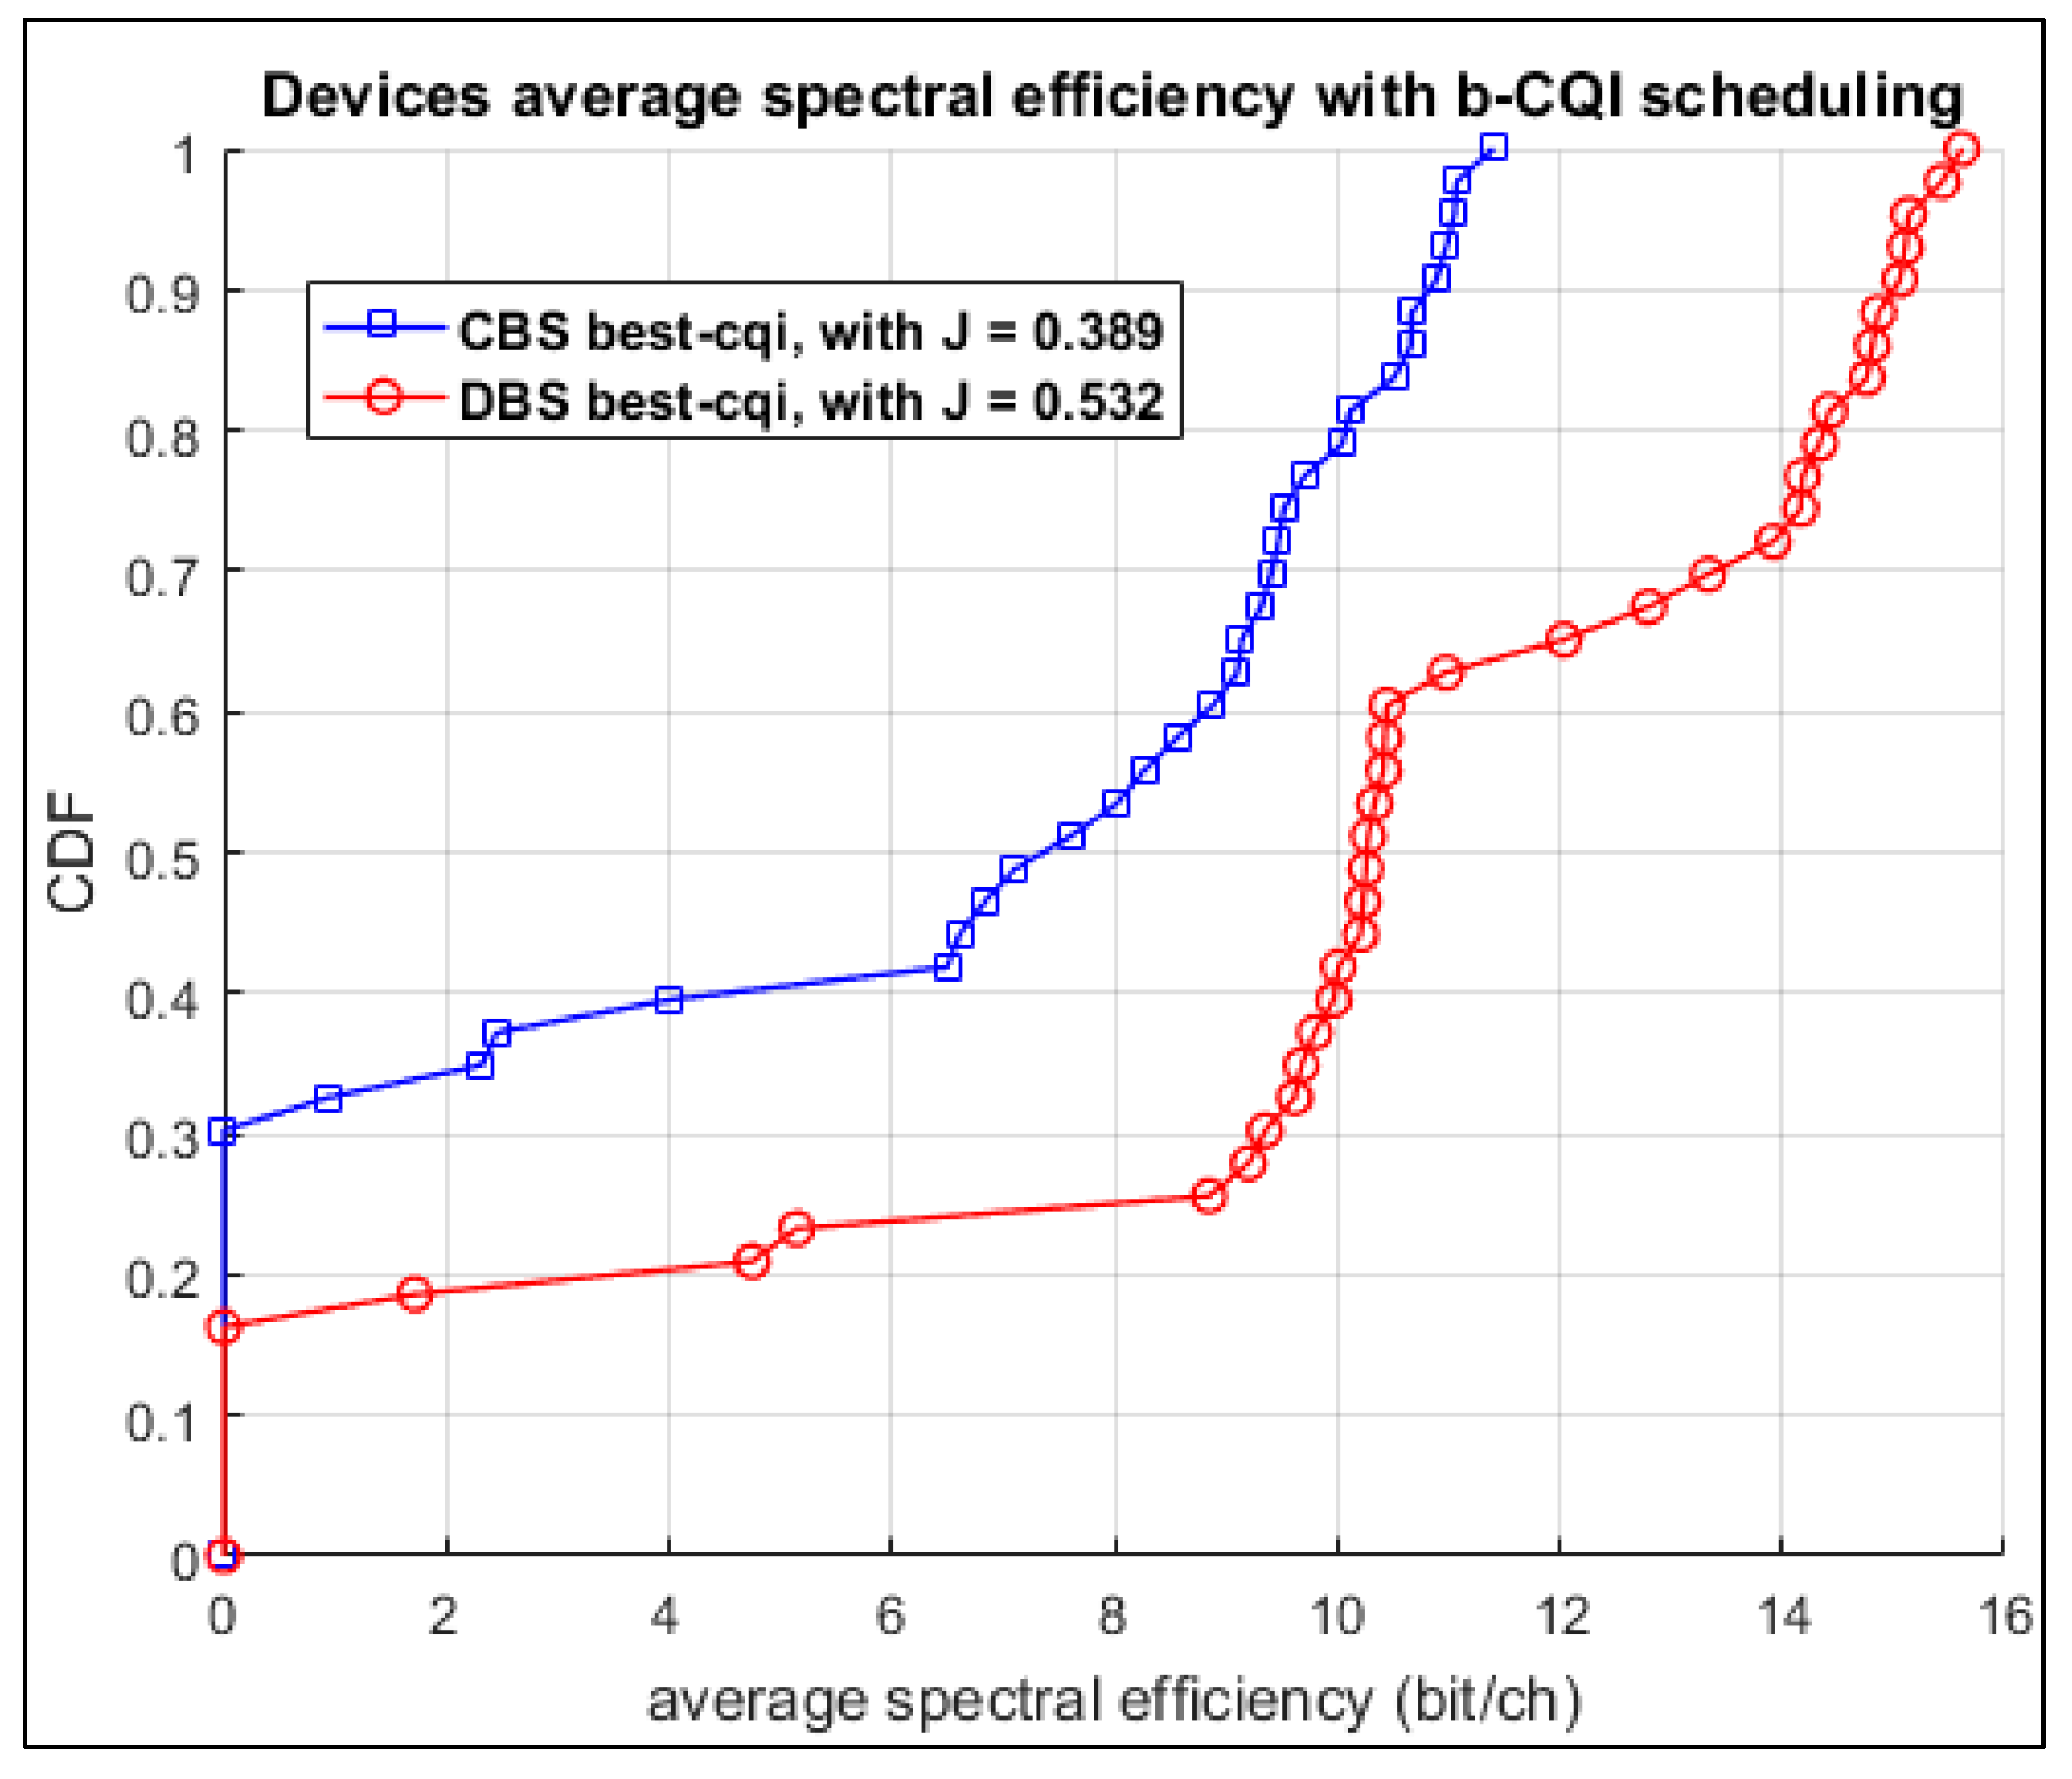
As shown in Figure 10, the peak, average and cell edge data throughput has been shown for both DBS and CBS architecture. The data throughput here is calculated from all successfully transmitted bits from all MTC devices during the simulated TTIs. The simulated time here is the time (in TTI) required by the corresponding MTC devices in order to complete full data transaction, as depicted in Algorithm 1. It is shown that DBS has better average and cell edge performance but it is sacrificing the peak data throughput, except for best-CQI scheduler due to its greedy nature, as it gives its resources to devices having high SINR, ignoring those at the cell-edge. Figure 11, Figure 12 and Figure 13 present the CDF of the MTC average spectral efficiency of the three scheduling algorithms used in Algorithm 1, which show that DBS has improved the system performance in terms of average spectral efficiency in all scheduling algorithms.
Fairness index j on the other hand has also improved due to the distributed RRUs of DBS architecture. The resources and data throughput in the former architecture guarantee a fairer distribution over the N devices in the simulation model. Figure 14 demonstrates the fairness of CBS and DBS architecture, where DBS shows better resource fairness, the data label shows the percentage gain in fairness of DBS over CBS network, due to the spatial distribution of remote antennas.
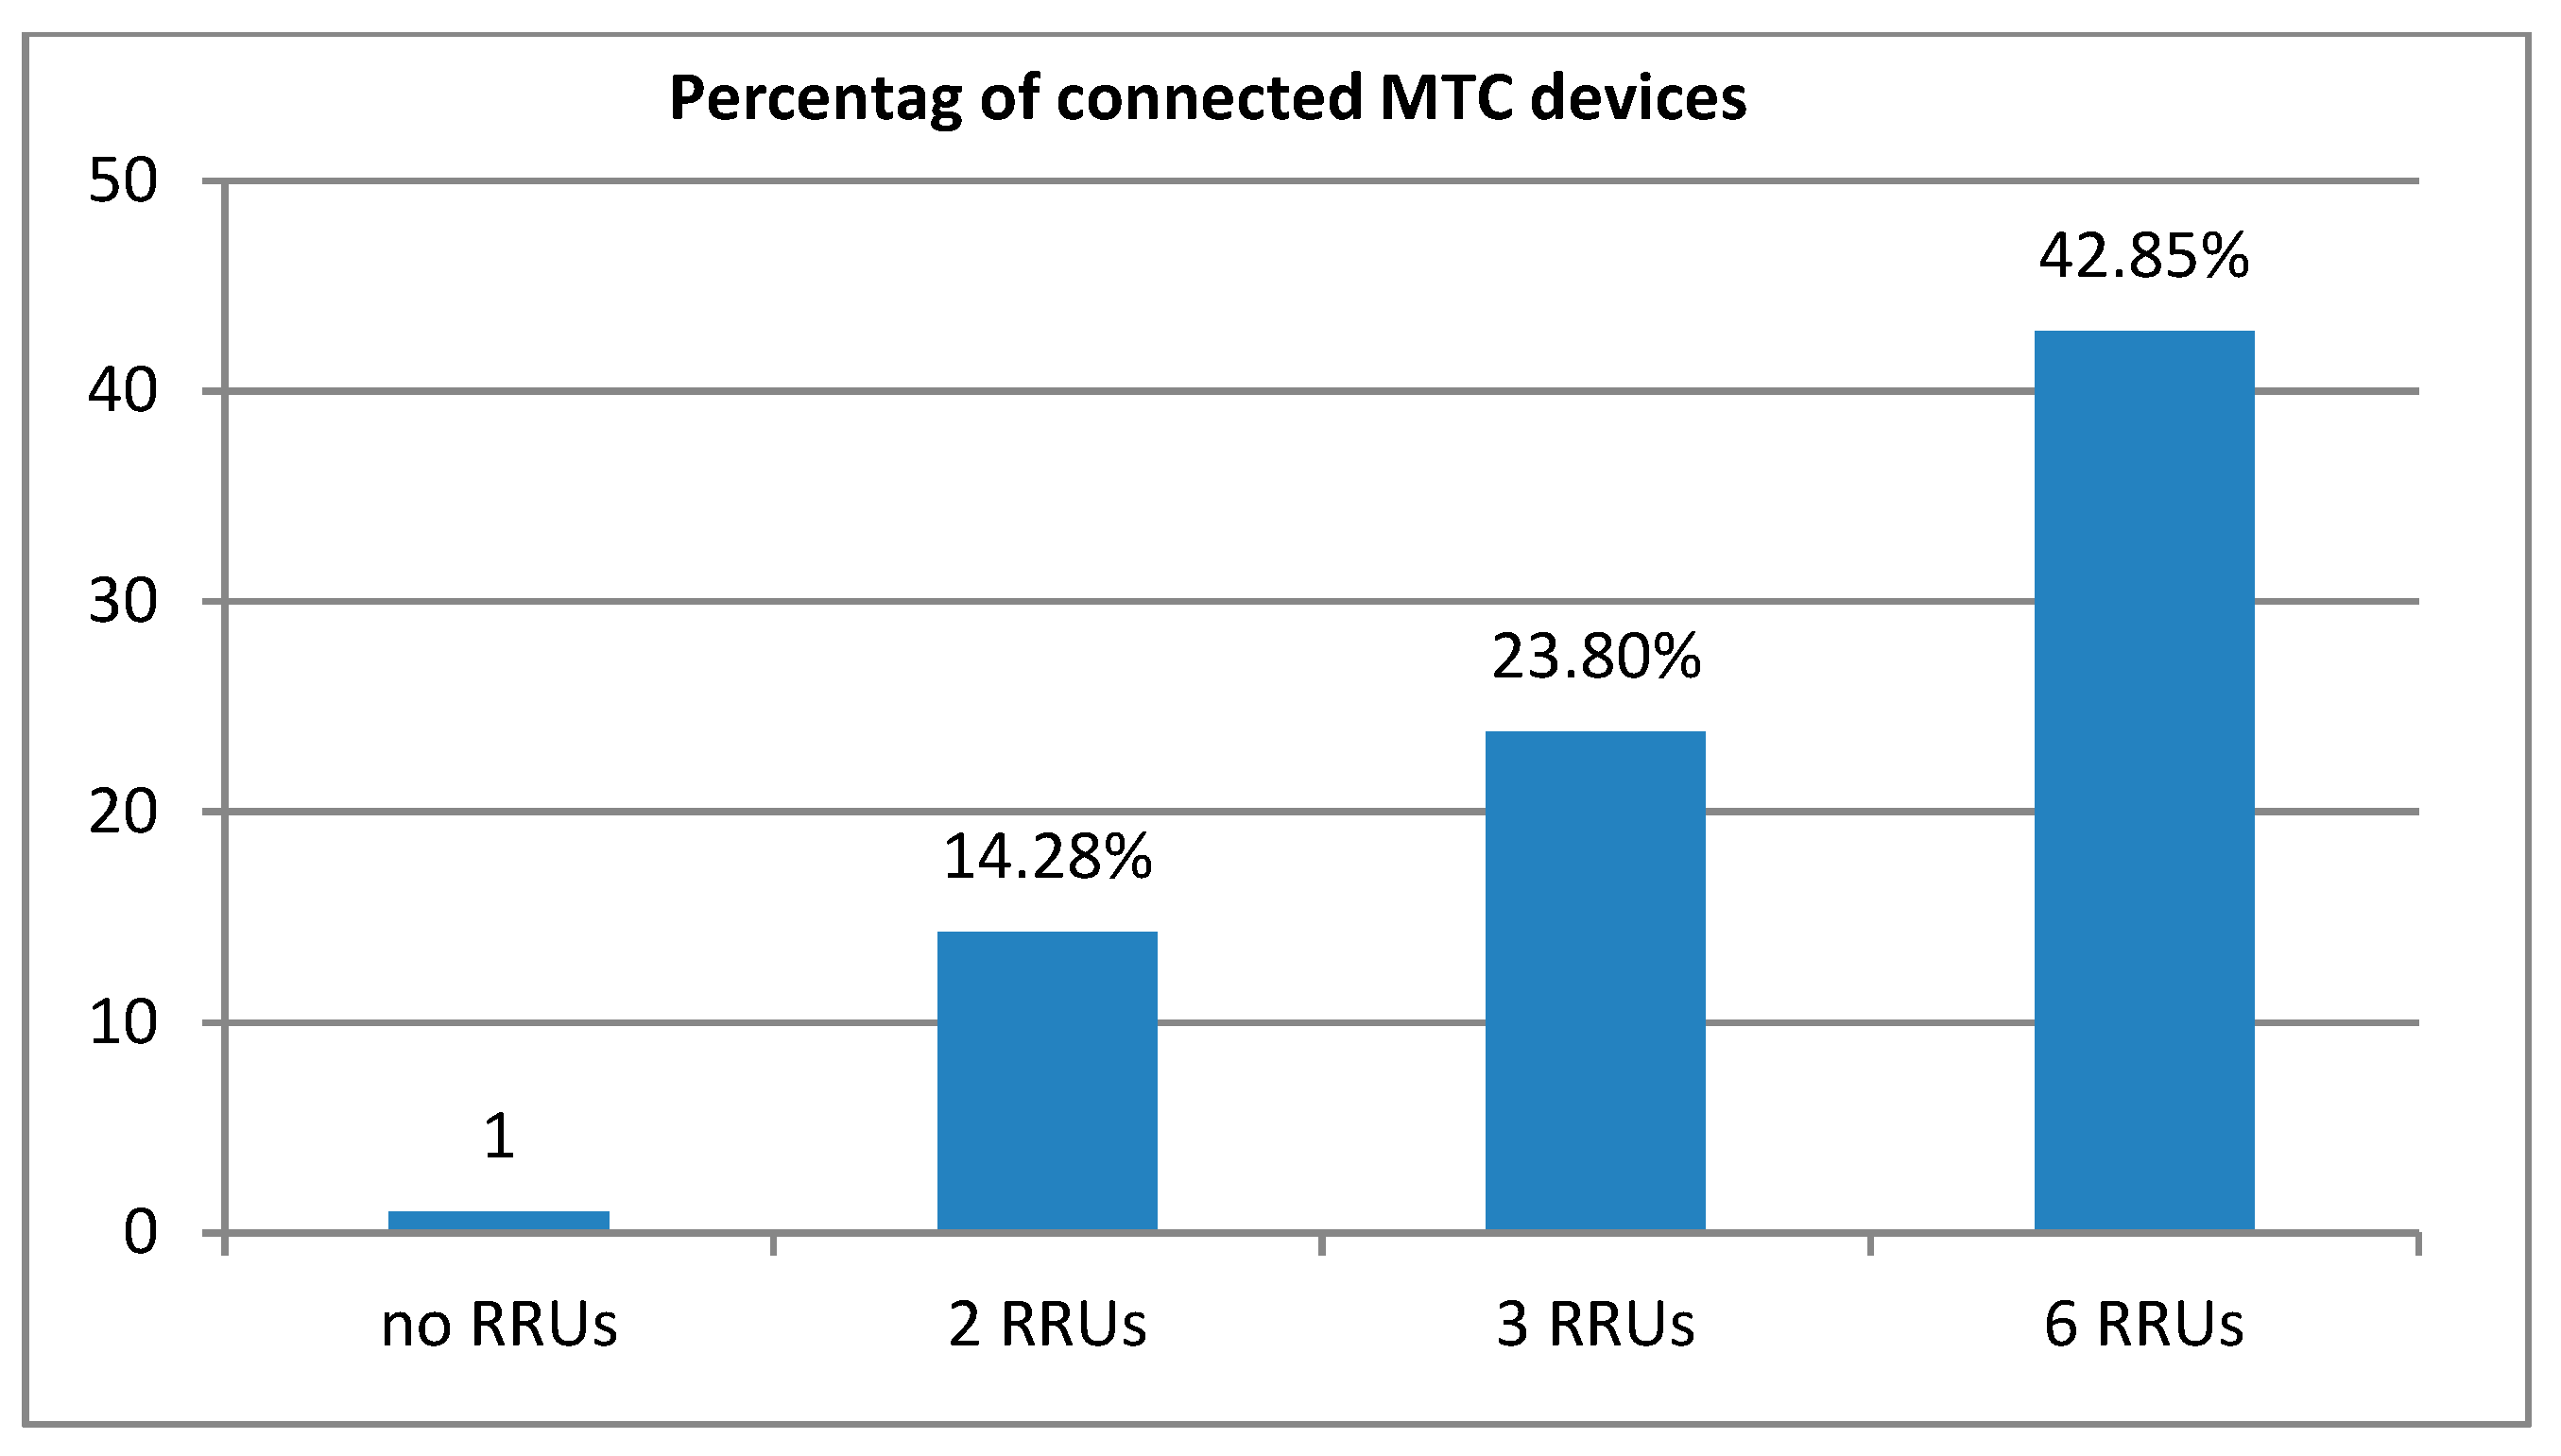
Distributing RRUs can have larger gain when the position of these RRUs is well optimised, deploying higher number of RRUs in DBS architecture can highly improve the number of successfully connected MTC machines without simultaneously increasing the system bandwidth. Figure 15 shows the improvement of using remote antennas on increasing the number of connected devices.
9. Conclusions
The focus of this work is on supporting massive MTC traffic in next generation 5G networks. The MTC category will contribute to the majority of future IoT traffic, where everything will become connected to the internet. In addition, as mmWave suffer poor channel condition due to high path loss, the excess loss in MTC links can be compensated by distributing remote antennas. RRUs can provide higher SINR in the areas of their deployments, which reflect a significant improvement in spectral efficiency and eventually connect larger number of MTC devices, without simultaneously increasing the allocated bandwidth. Increasing the number of remote antennas will reflect a better performance in term of resource fairness and network capacity and connectivity.
In general, implementing DBS network architecture improves the performance of both machine traffic and human traffic. In addition, DBS architecture can provide a greener network with greater power and spectrum efficiency.
Acknowledgments
This work is fully sponsored by the Ministry of Higher Education and Scientific Research (MOHESR), University of Anbar, Iraq.
Author Contributions
Naser Al-Falahy and Omar Alani conceived and designed the presented idea and experiments. Naser Al-Falahy performed the experiments/simulation and performed the computations; Naser Al-Falahy and Omar Alani analysed the data. Omar Alani supervised the findings of this work. Naser Al-Falahy wrote the paper, and revised by Omar Alani. All authors discussed the results and contributed to the final manuscript.
Conflicts of Interest
The authors declare no conflict of interest.
References
- Cisco. Cisco Visual Networking Index: Global Mobile Data Traffic Forecast Update, 2015–2020. White Paper. 2016. Available online: https://www.cisco.com/c/dam/m/en_in/innovation/enterprise/assets/mobile-white-paper-c11-520862.pdf (accessed on 12 February 2018).
- Chin, W.H.; Fan, Z.; Haines, R. Emerging Technologies and Research Challenges for 5G Wireless Network. IEEE Wirel. Commun. 2014, 21, 106–112. [Google Scholar] [CrossRef]
- Adke, P.; Bumanlag, J.; Edelman, B.; Doetsch, U. Spectrum Needs for Wireless Smart Meter Communications; University of Colorado: Boulder, CO, USA, 2011. [Google Scholar]
- Cisco. Cisco Visual Networking Index: Global Mobile Data Traffic Forecast Update, 2016–2021. White Paper. 2017. Available online: https://www.cisco.com/c/en/us/solutions/collateral/service-provider/visual-networking-index-vni/vni-forecast-qa.pdf (accessed on 12 February 2018).
- Ofcom. Update on 5G Spectrum in the UK. 2017. Available online: https://www.ofcom.org.uk/__data/assets/pdf_file/0021/97023/5G-update-08022017.pdf (accessed on 12 February 2018).
- Saleh, A.A.M.; Rustako, A.; Roman, R. Distributed Antennas for Indoor Radio Communications. IEEE Trans. Commun. 1987, 35, 1245–1251. [Google Scholar] [CrossRef]
- Ahumada, L.; Feick, R.; Valenzuela, R.A.; Gallardo, M.; Derpich, M.; Carrasco, H. Empirical evaluation of the received power gain when remote radio heads are used to enhance the coverage area in urban environments. IEEE Trans. Wirel. Commun. 2013, 12, 2830–2839. [Google Scholar] [CrossRef]
- Romanous, B.; Bitar, N.; Zaidi, S.A.R.; Imran, A.; Ghogho, M.; Refai, H.H. A Game Theoretic Approach for Optimizing Density of Remote Radio Heads in User Centric Cloud-Based Radio Access Network. In Proceedings of the 2015 IEEE Global Communications Conference, San Diego, CA, USA, 6–10 December 2015; pp. 1–6. [Google Scholar]
- Taranetz, M.; Blazek, T.; Kropfreiter, T.; Muller, M.K.; Schwarz, S.; Rupp, M. Runtime precoding: Enabling multipoint transmission in LTE-advanced system-level simulations. IEEE Access 2015, 3, 725–736. [Google Scholar] [CrossRef]
- Matsuo, D.; Rezagah, R.; Tran, G.K.; Sakaguchi, K.; Araki, K.; Kaneko, S.; Miyazaki, N.; Konishi, S.; Kishi, Y. Shared Remote Radio Head architecture to realize semi-dynamic clustering in CoMP cellular networks. In Proceedings of the IEEE Globecom Workshops, Anaheim, CA, USA, 3–7 December 2012; pp. 1145–1149. [Google Scholar]
- Highsmith, W.R. An investigation into distributed base station design for LMDS systems. In Proceedings of the IEEE SoutheastCon 2002 (Cat. No.02CH37283), Columbia, SC, USA, 5–7 April 2002; pp. 162–165. [Google Scholar]
- Yaacoub, E.; Dawy, Z. On Using Relays with Carrier Aggregation for Planning 5G Networks Supporting M2M Traffic. In Proceedings of the 2014 IEEE 10th International Conference on Wireless and Mobile Computing, Networking and Communications (WiMob), Larnaca, Cyprus, 8–10 October 2014; pp. 124–129. [Google Scholar]
- Li, X.; Rao, J.; Zhang, H. Engineering Machine-to-Machine Traffic in 5G. IEEE Internet Things J. Eng. 2016, 3, 609–618. [Google Scholar] [CrossRef]
- Centenaro, M.; Vangelista, L. A study on M2M traffic and its impact on cellular networks. In Proceedings of the 2015 IEEE 2nd World Forum on Internet of Things (WF-IoT), Milan, Italy, 14–16 December 2016; pp. 154–159. [Google Scholar]
- Mitani, S.M.; Kanesan, T.; Mohamad, R.; Yaakob, S.; Farid, N.E. Machine-to-machine communications at millimeter wave frequencies. In Proceedings of the IEEE MTT-S International Microwave Workshop Series on: RF and Wireless Technologies for Biomedical and Healthcare Applications, IMWS-Bio, London, UK, 8–10 December 2014; pp. 1–3. [Google Scholar]
- Geng, S.; Liu, S.; Zhao, X. 60-GHz Channel Characteristic Interdependence Investigation for M2M Networks. In Proceedings of the 9th International Conference on Communications and Networking in China, Maoming, China, 14–16 August 2014; pp. 402–406. [Google Scholar]
- Yilmaz, T.; Akan, O.B. On the use of the millimeter wave and low terahertz bands for Internet of Things. In Proceedings of the IEEE World Forum on Internet of Things, WF-IoT, Milan, Italy, 14–16 December 2015; pp. 177–180. [Google Scholar]
- Misic, J.; Misic, V. Bridging between IEEE 802.15.4 and IEEE 802.11b networks for multiparameter healthcare sensing. IEEE J. Sel. Areas Commun. 2009, 27, 435–449. [Google Scholar] [CrossRef]
- Pereira, C.; Aguiar, A. Towards efficient mobile M2M communications: Survey and open challenges. Sensors 2014, 14, 19582–19608. [Google Scholar] [CrossRef] [PubMed]
- Lai, X.; Liu, Q.; Wei, X.; Wang, W.; Zhou, G.; Han, G. A survey of body sensor networks. Sensors 2013, 13, 5406–5447. [Google Scholar] [CrossRef] [PubMed]
- Erik, D.; Parkvall, S.; Johan, S. 4G LTE/LTE-Advanced for Mobile Broadband, 1st ed.; Elsevier Ltd.: Oxford, UK, 2011. [Google Scholar]
- Rost, P.; Bernardos, C.J.; de Domenico, A.; di Girolamo, M.; Lalam, M.; Maeder, A.; Sabella, D.; Wübben, D. Cloud technologies for flexible 5G radio access networks. IEEE Commun. Mag. 2014, 52, 68–76. [Google Scholar] [CrossRef]
- Lanzani, C.F.; Kardaras, G.; Boppana, D. Remote Radio Heads and the Evolution Towards 4G Networks; ALTERA Radiocomp White Paper. 2009. Available online: https://www.altera.co.jp/content/dam/altera-www/global/en_US/pdfs/literature/wp/wp-01096-rrh-4g.pdf (accessed on 12 February 2018).
- Al-Falahy, N.; Alani, O. The Impact of Base Station Antennas Configuration on the Performance of Millimetre Wave 5G Networks. In Proceedings of the Ninth International Conference on Ubiquitous and Future Networks (ICUFN), Milan, Italy, 4–7 July 2017; pp. 636–641. [Google Scholar]
- 3GPP. Evolved Universal Terrestrial Radio Access (E-UTRA); Physical Layer Procedures; ETSI TS 136 213; No. 3GPP TS 36.213 Version 8.8.0 Release 8; 3GPP: Sophia Antipolis, France, 2009; pp. 1–79. [Google Scholar]
- Khan, F.; Pi, Z. An Introduction to Millimeter-Wave Mobile Broadband Systems. IEEE Commun. Mag. 2011, 59, 101–107. [Google Scholar]
- Larew, S.G.; Thomas, T.A.; Cudak, M.; Ghosh, A. Air Interface Design and Ray Tracing Study for 5G Millimeter Wave Communications. In Proceedings of the IEEE Globecom Workshops, Atlanta, GA, USA, 9–13 December 2013; pp. 117–122. [Google Scholar]
- Al-Falahy, N.; Alani, O. Technologies for 5G Networks: Challenges and Opportunities. IEEE IT Prof. 2017, 19, 12–20. [Google Scholar] [CrossRef]
- Nie, S.; MacCartney, G.R.; Sun, S.; Rappaport, T.S. 72 GHz Millimeter Wave Indoor Measurements for Wireless and Backhaul Communications. In Proceedings of the IEEE 24th International Symposium on Personal, Indoor and Mobile Radio Communications: Mobile and Wireless Networks, London, UK, 8–11 September 2013; pp. 2429–2433. [Google Scholar]
- Rappaport, T.S.; Sun, S.; Mayzus, R.; Zhao, H.; Azar, Y.; Wang, K.; Wong, G.N.; Schulz, J.K.; Samimi, M.; Gutierrez, F. Millimeter Wave Mobile Communications for 5G Cellular: It Will Work! IEEE Access 2013, 1, 335–349. [Google Scholar] [CrossRef]
- Rajagopal, S.; Abu-Surra, S.; Malmirchegini, M. Channel Feasibility for Outdoor Non-Line-of-Sight mmWave Mobile Communication. In Proceedings of the IEEE Vehicular Technology Conference (VTC Fall), Quebec City, QC, Canada, 3–6 September 2012; pp. 1–6. [Google Scholar]
- Rappaport, T.S.; Gutierrez, F.; Ben-dor, E.; Murdock, J.N.; Qiao, Y.; Tamir, J.I. Broadband Millimeter-Wave Propagation Measurements and Models Using Adaptive-Beam Antennas for Outdoor Urban Cellular Communications. IEEE Trans. Antennas Propag. 2013, 61, 1850–1859. [Google Scholar] [CrossRef]
- 3GPP. Technical Specification Group Radio Access Network; Study on Channel Model for Frequency Spectrum above 6 GHz; 3GPP Technical Report; 3GPP: Sophia Antipolis, France, 2017; pp. 1–85. [Google Scholar]
- 3GPP. Technical Specification Group Radio Access Network; Study on Channel Model for Frequencies from 0.5 to 100 GHz; 3GPP Technical Report; TR 38.901 V14.1.1; 3GPP: Sophia Antipolis, France, 2017; pp. 1–90. [Google Scholar]
- Ameigeiras, P.; Wang, Y.; Navarro-Ortiz, J.; Mogensen, P.E.; Lopez-Soler, J.M. Traffic models impact on OFDMA scheduling design. EURASIP J. Wirel. Commun. Netw. 2012, 1, 1–13. [Google Scholar] [CrossRef]
- Al-falahy, N.; Alani, O. Network capacity optimisation in millimetre wave band using fractional frequency reuse. IEEE Access 2017. [Google Scholar] [CrossRef]
- OneM2M. Available online: http://www.onem2m.org/ (accessed on 3 January 2018).
- 3GPP—TSG-RAN1. LTE Physical Layer Framework for Performance Verification; R1-070674; 3GPP: Sophia Antipolis, France, 2007; pp. 1–21. [Google Scholar]
- Al-Falahy, N.; Alani, O. Supporting Massive M2M Traffic in the Internet of Things Using Millimetre Wave 5G Network. In Proceedings of the 9th Computer Science & Electronic Engineering Conference (CEEC), Colchester, UK, 27–29 September 2017; pp. 83–88. [Google Scholar]
- Jain, R.K.; Chiu, D.M.W.; Hawe, W.R. A Quantitative Measure of Fairness and Discrimination for Resource Allocation in Shared Computer Systems; Digital Equipment Corporation: Maynard, MA, USA, 1984; pp. 1–38. [Google Scholar]
- Peng, Z.; Li, L.; Wang, M.; Zhang, Z.; Liu, Q.; Liu, Y.; Liu, R. An Effective Coverage Scheme with Passive-Reflectors for Urban Millimeter-Wave Communication. IEEE Antennas Wirel. Propag. Lett. 2015, 15, 398–401. [Google Scholar] [CrossRef]
- Kim, T.; Park, J.; Seol, J.Y.; Jeong, S.; Cho, J.; Roh, W. Tens of Gbps support with mmWave beamforming systems for next generation communications. In Proceedings of the GLOBECOM—IEEE Global Telecommunications Conference, Atlanta, GA, USA, 9–13 December 2013; pp. 3685–3690. [Google Scholar]
Figure 1.
Cisco VNI, MTC data growth rate [4].
Figure 1.
Cisco VNI, MTC data growth rate [4].
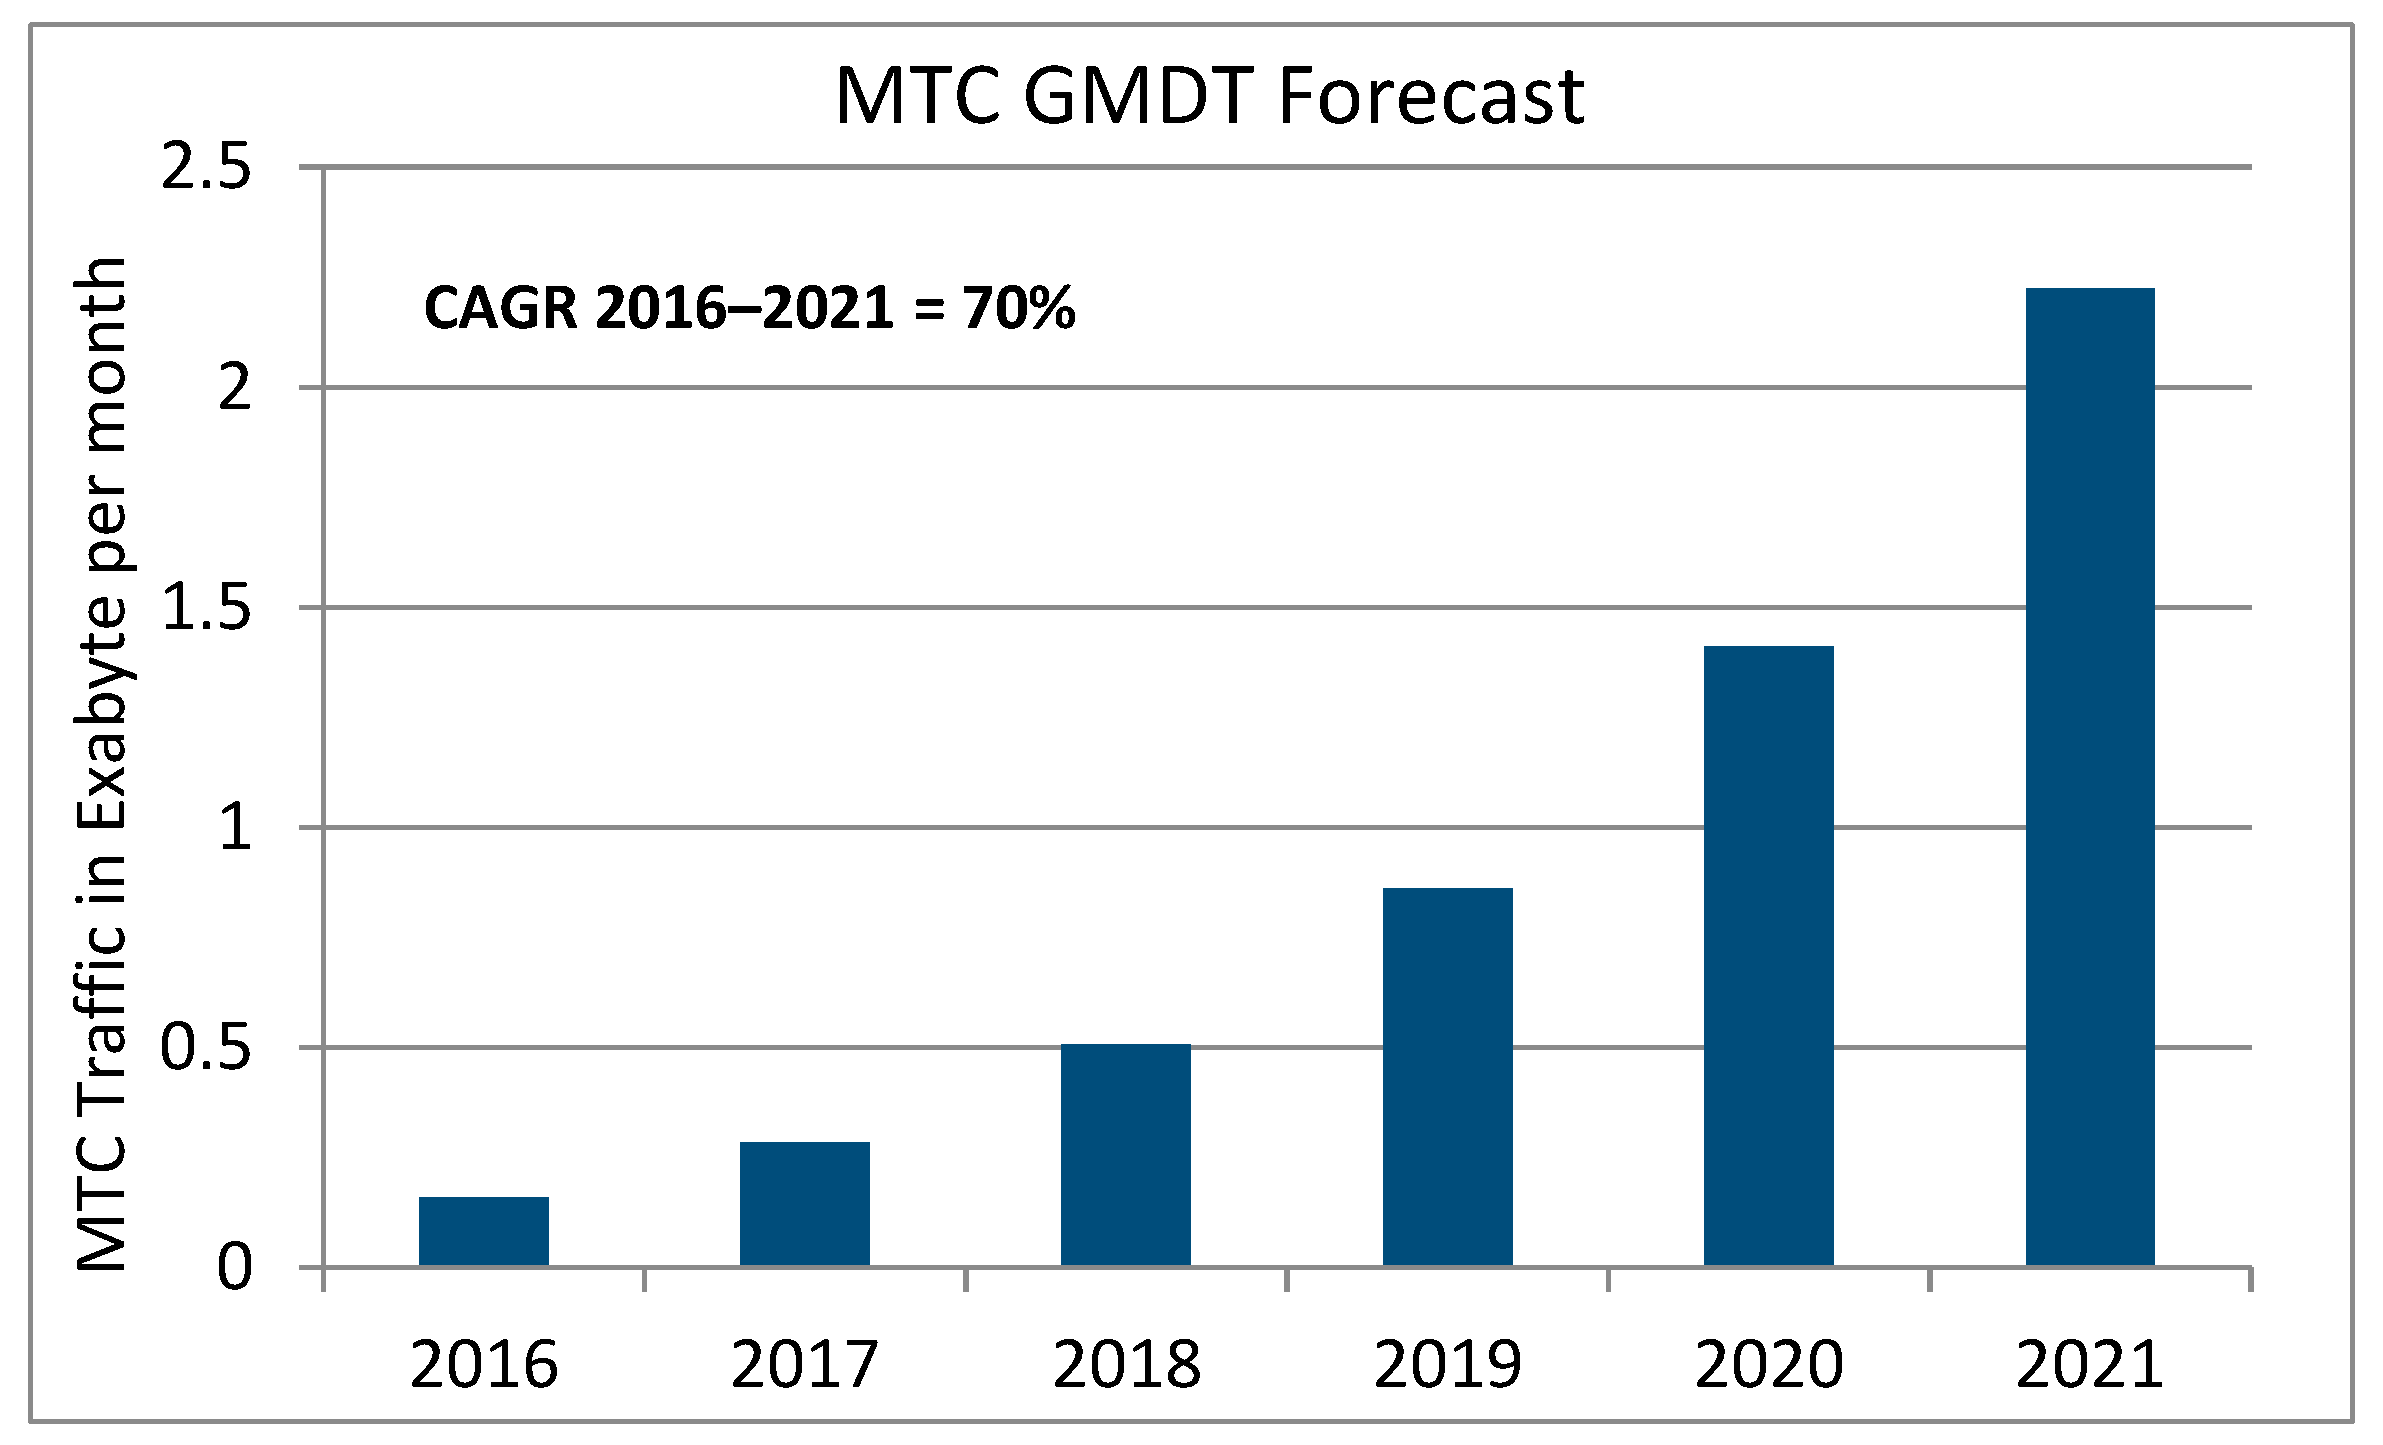
Figure 2.
Connected Health (CH), where Machine Type Communication (MTC) devices transmit to the Gateway through 5G cellular network.
Figure 2.
Connected Health (CH), where Machine Type Communication (MTC) devices transmit to the Gateway through 5G cellular network.
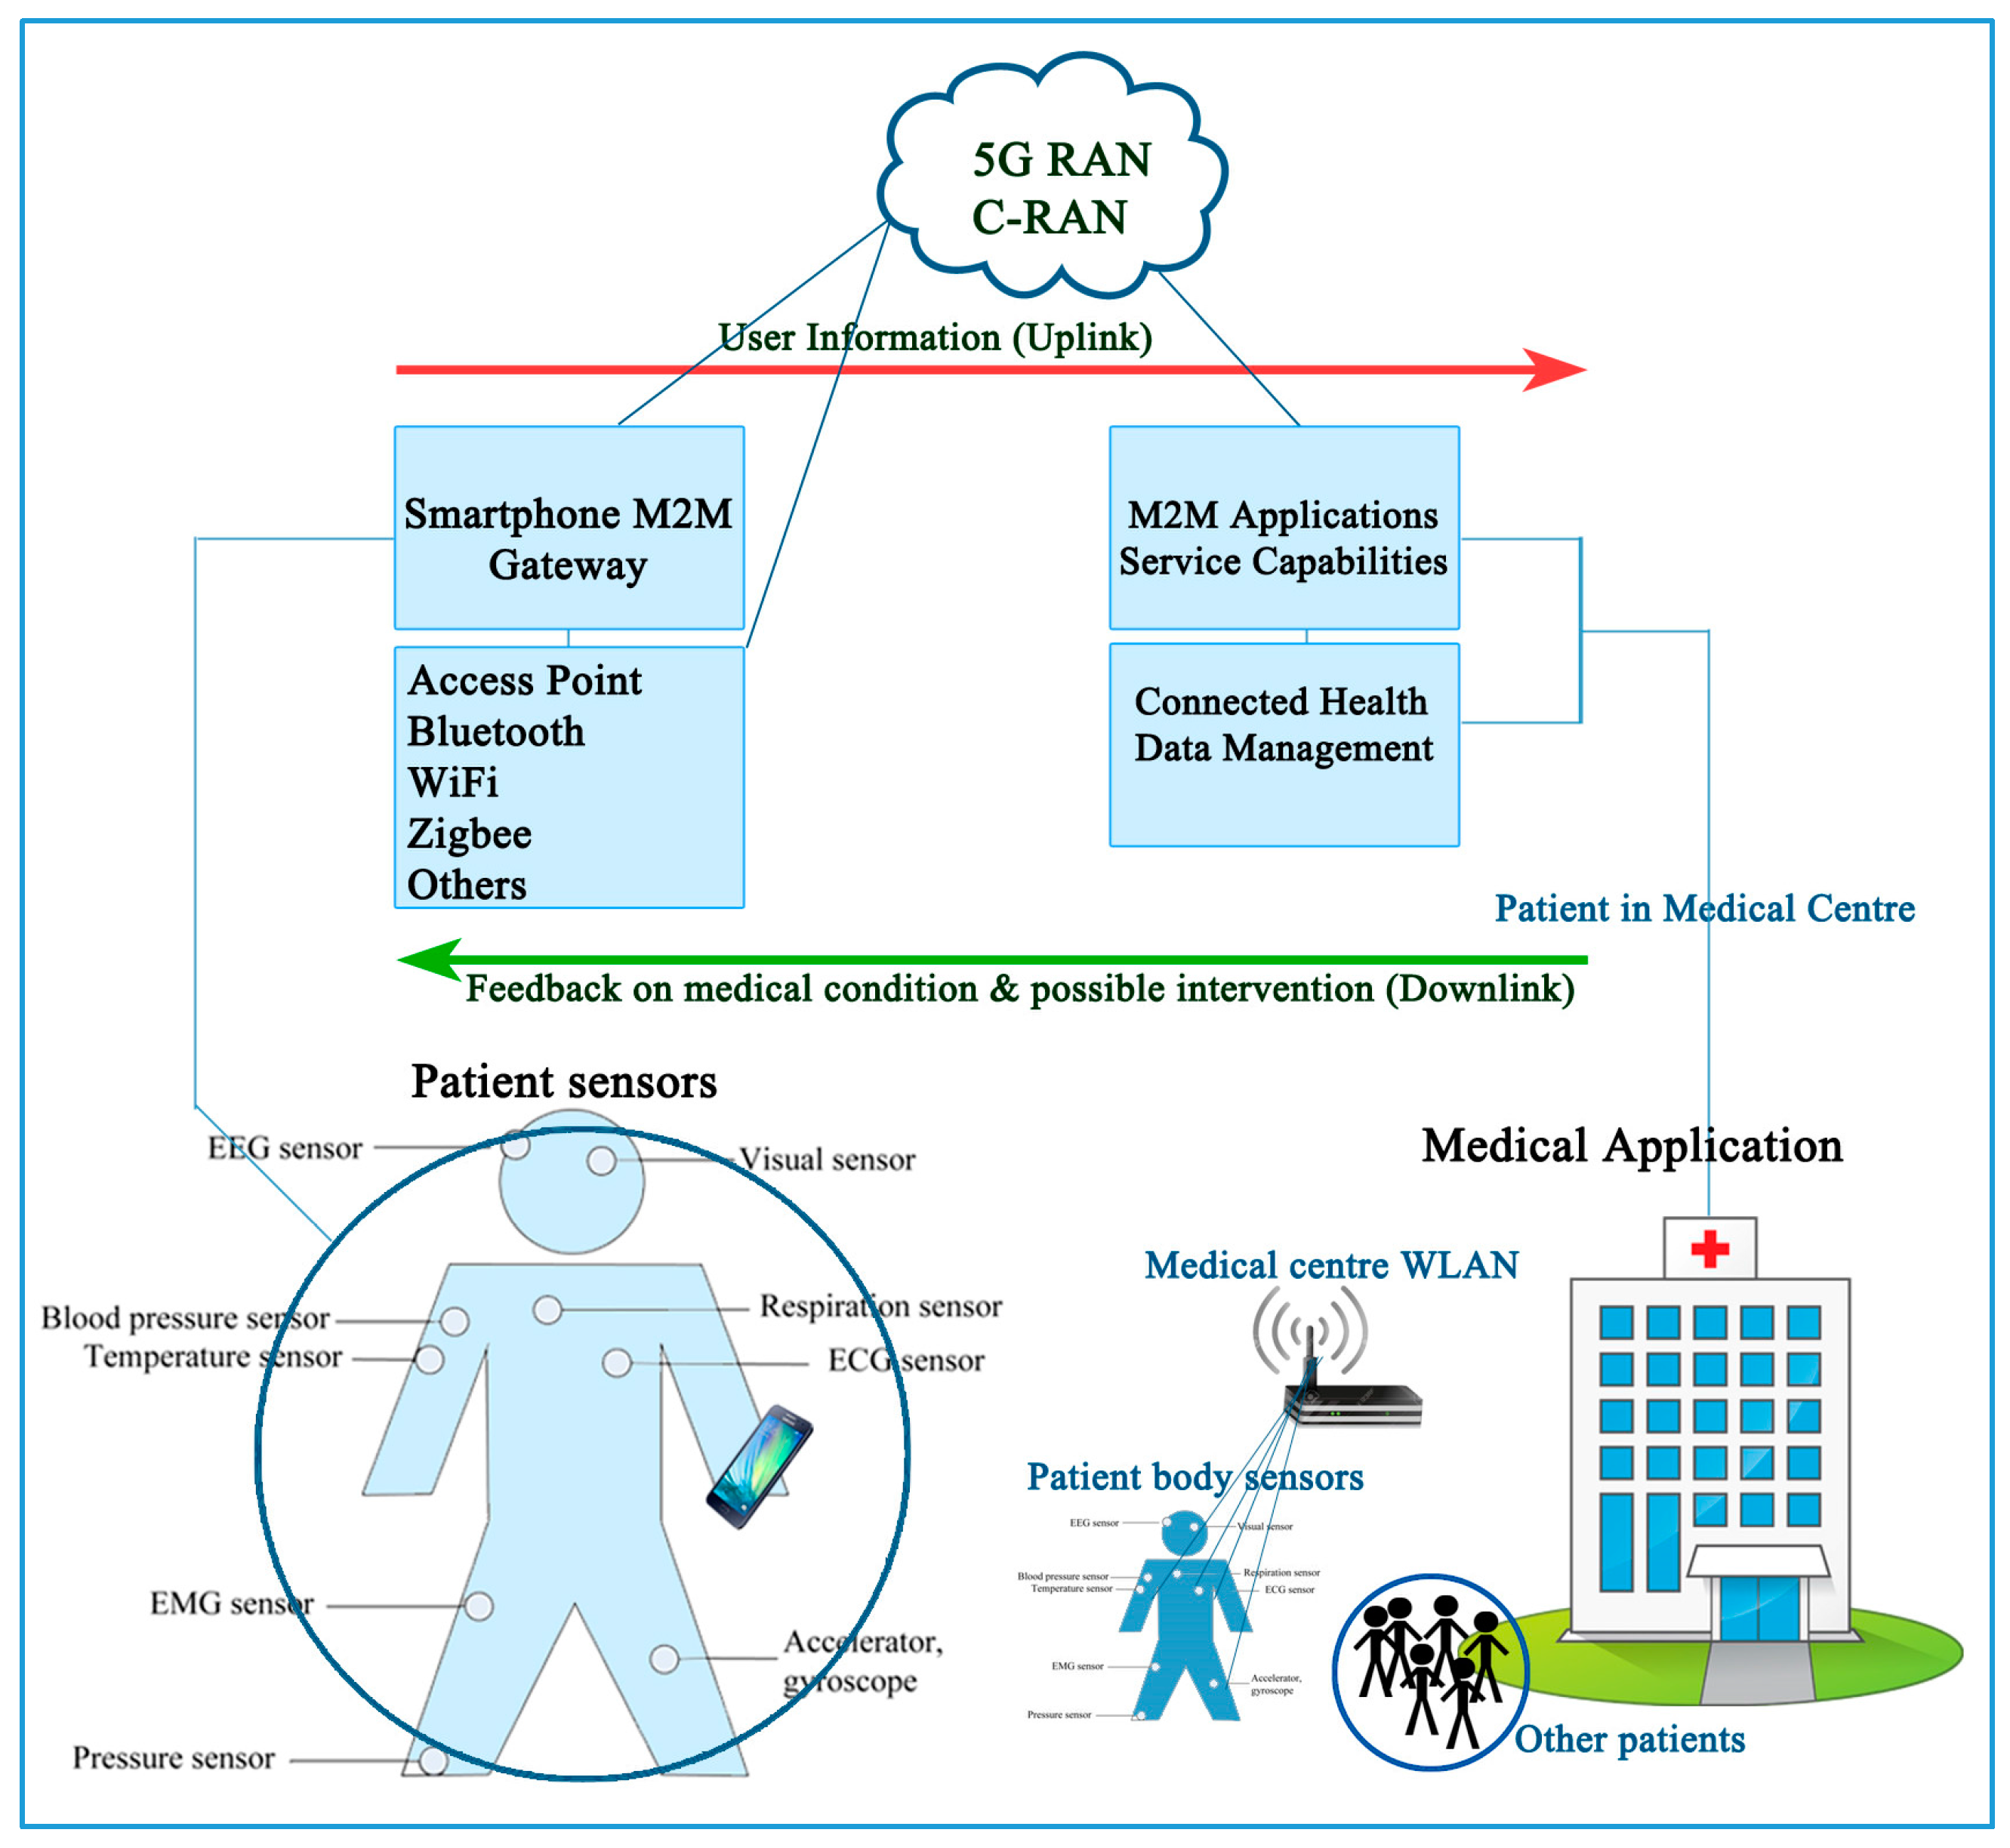
Figure 3.
The signal to interference plus noise ratio (SINR) mapping with and without Remote Radio Units (RRUs).
Figure 3.
The signal to interference plus noise ratio (SINR) mapping with and without Remote Radio Units (RRUs).
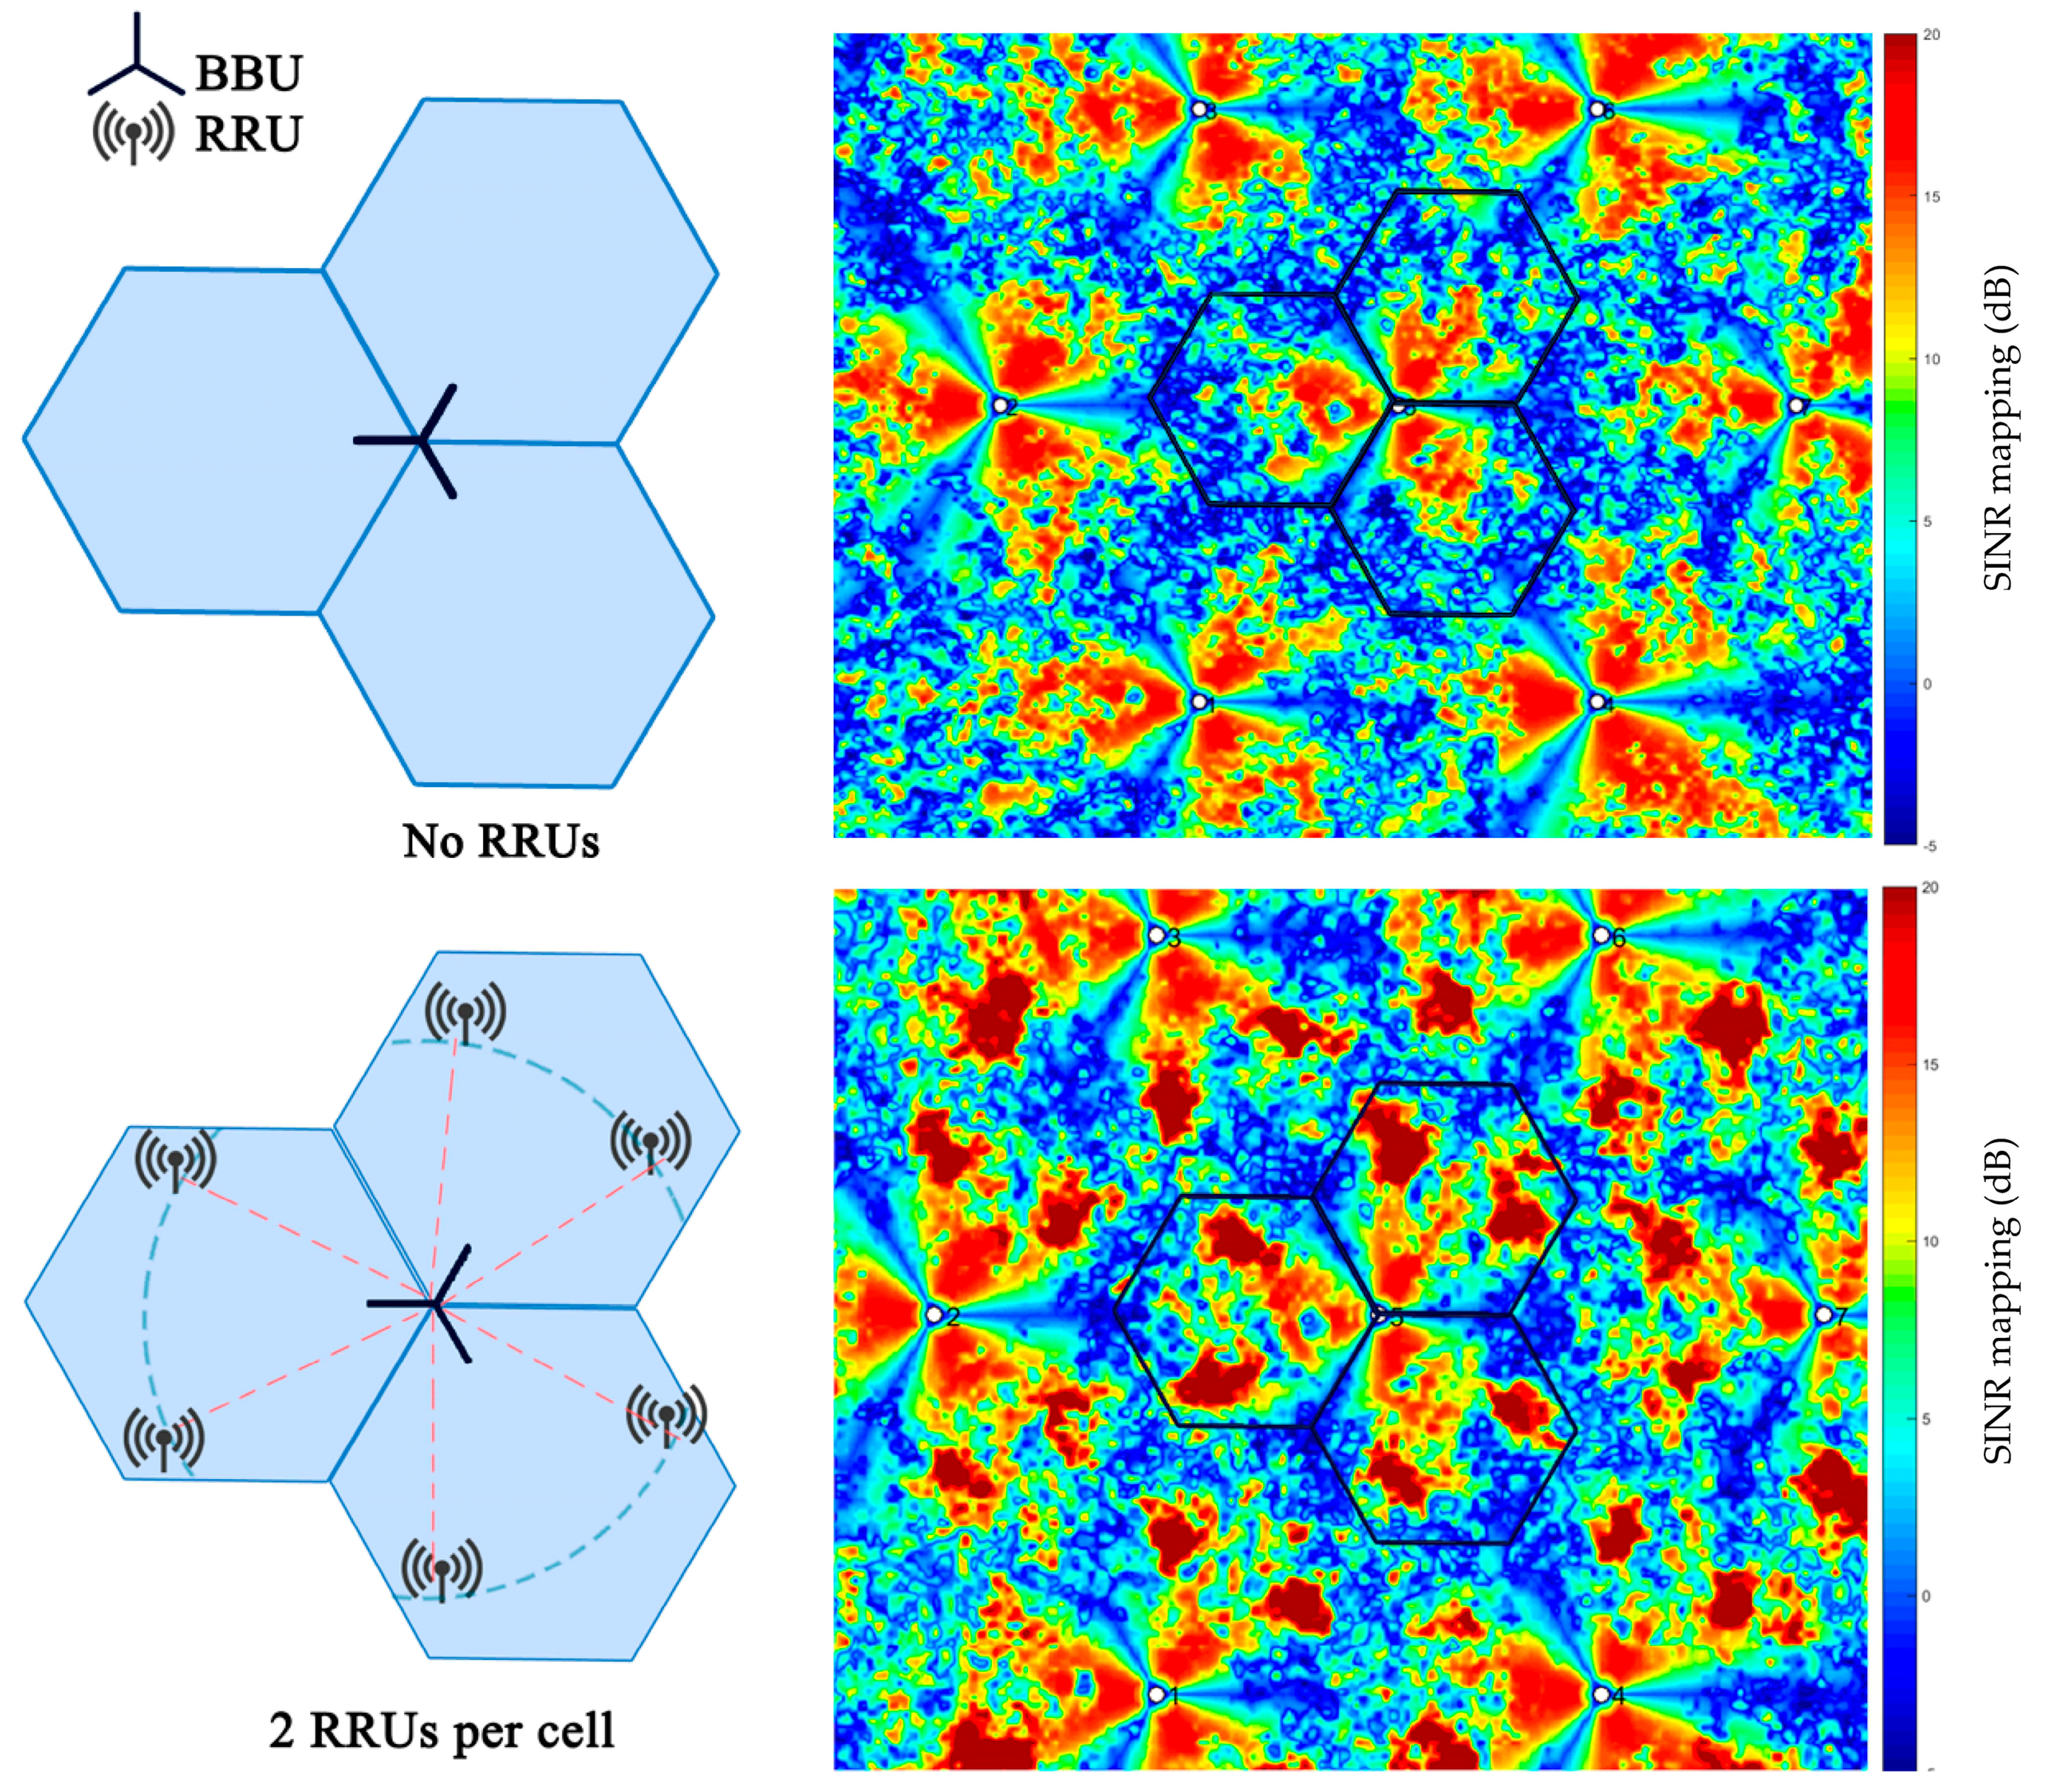
Figure 4.
Network model, where mmWave DBS network, with multiple RRUs that connect different type of sensors, MTC devices (red circles) and dashed lines represent the fronthaul links.
Figure 4.
Network model, where mmWave DBS network, with multiple RRUs that connect different type of sensors, MTC devices (red circles) and dashed lines represent the fronthaul links.
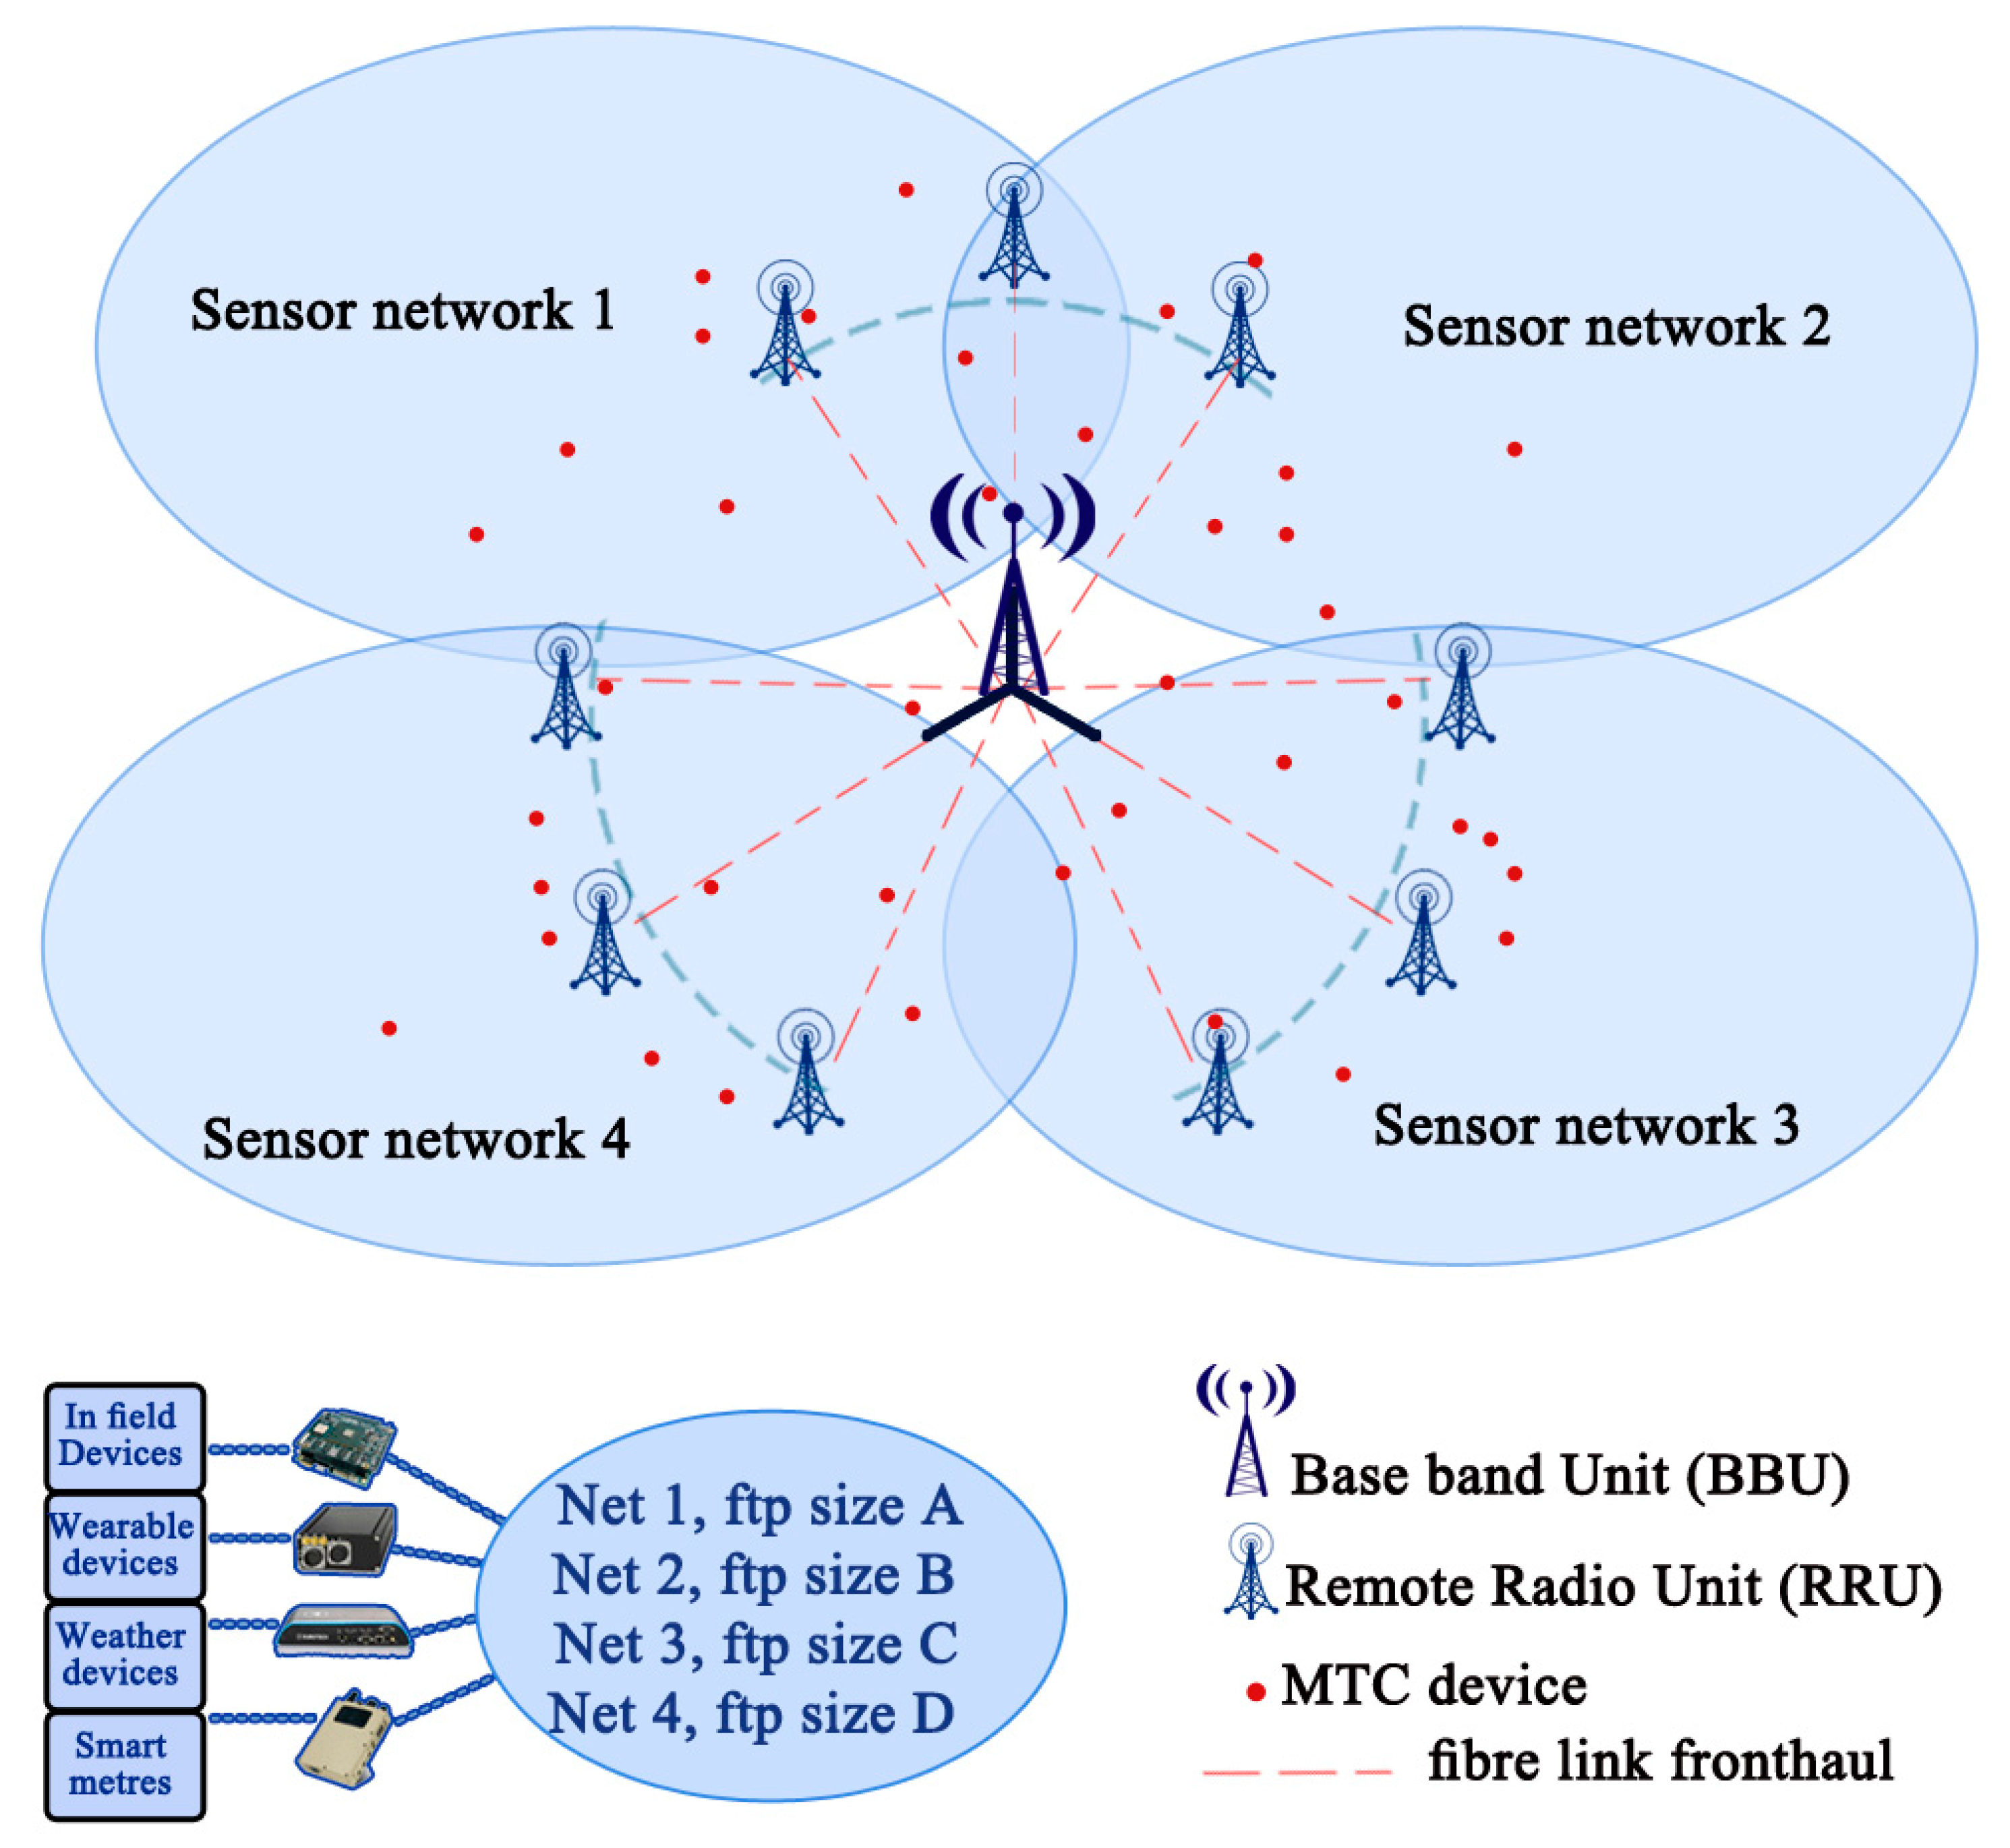
Figure 5.
Definition of d2D and d3D in path loss model.
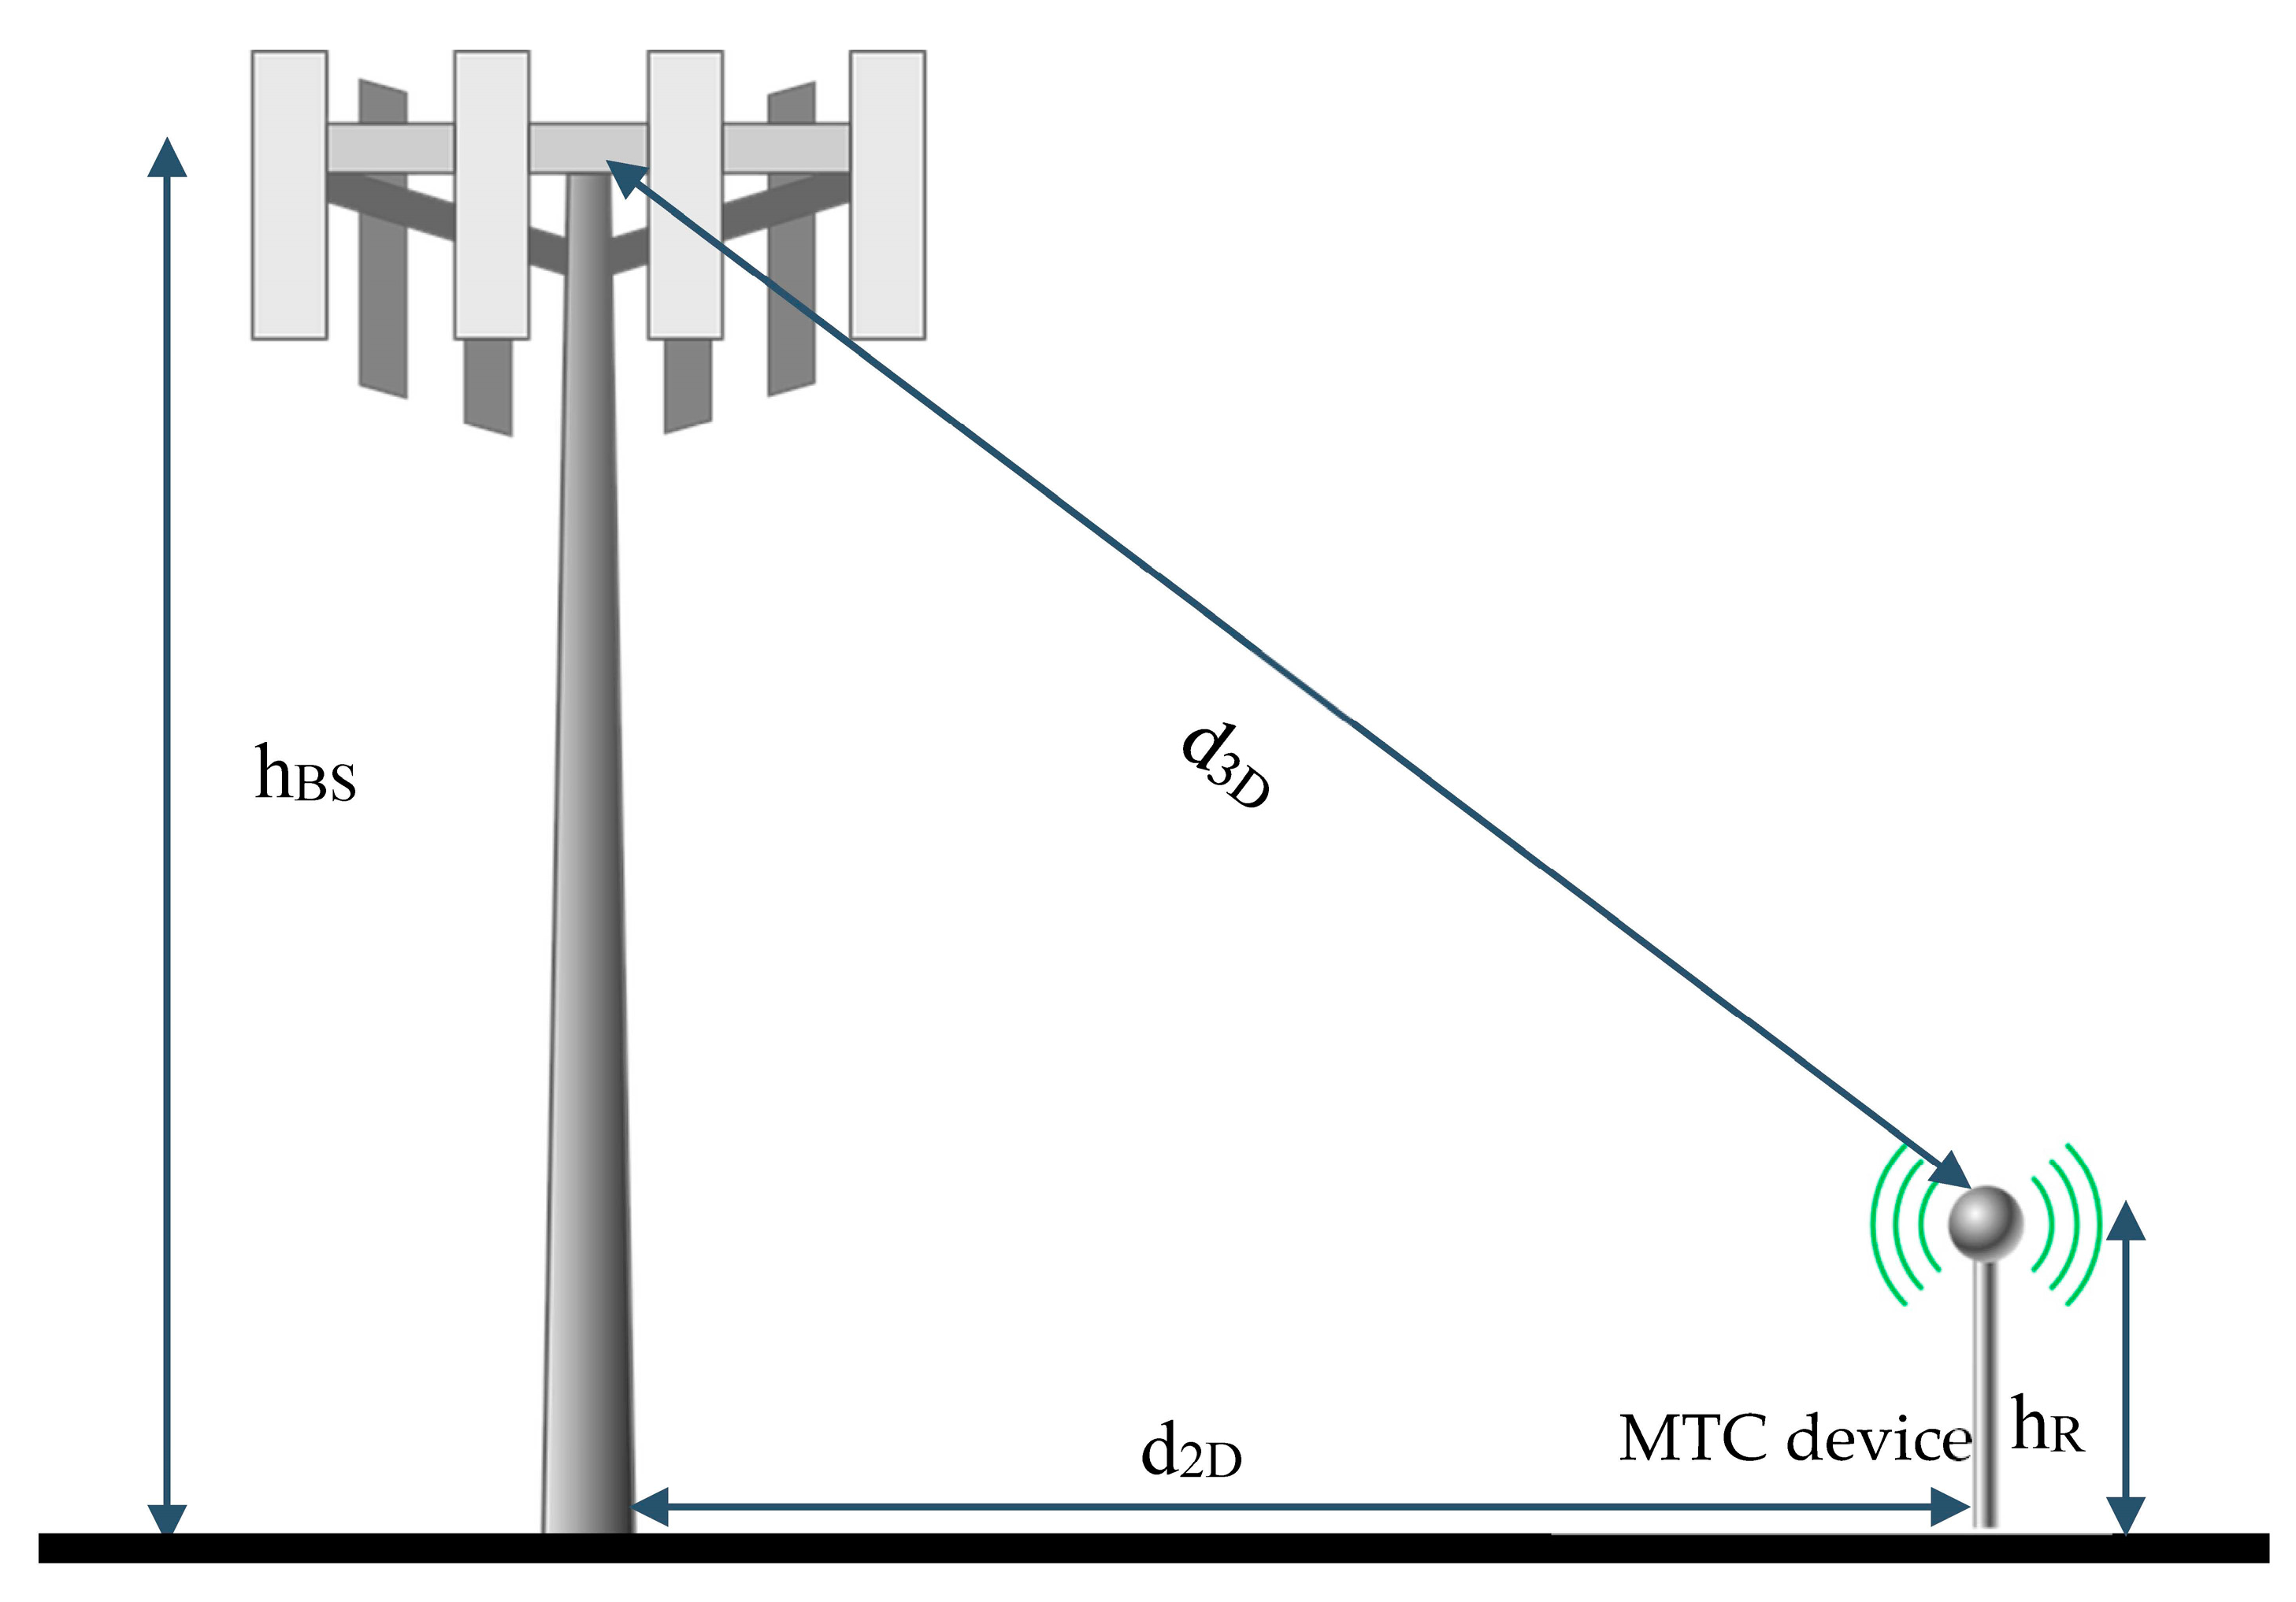
Figure 6.
MTC traffic model, 3GPP FTP.

Figure 7.
Energy per bits in μjpb with single antenna sensors, simulation has been conducted with 80 MTC devices for 5 MHz bandwidth.
Figure 7.
Energy per bits in μjpb with single antenna sensors, simulation has been conducted with 80 MTC devices for 5 MHz bandwidth.
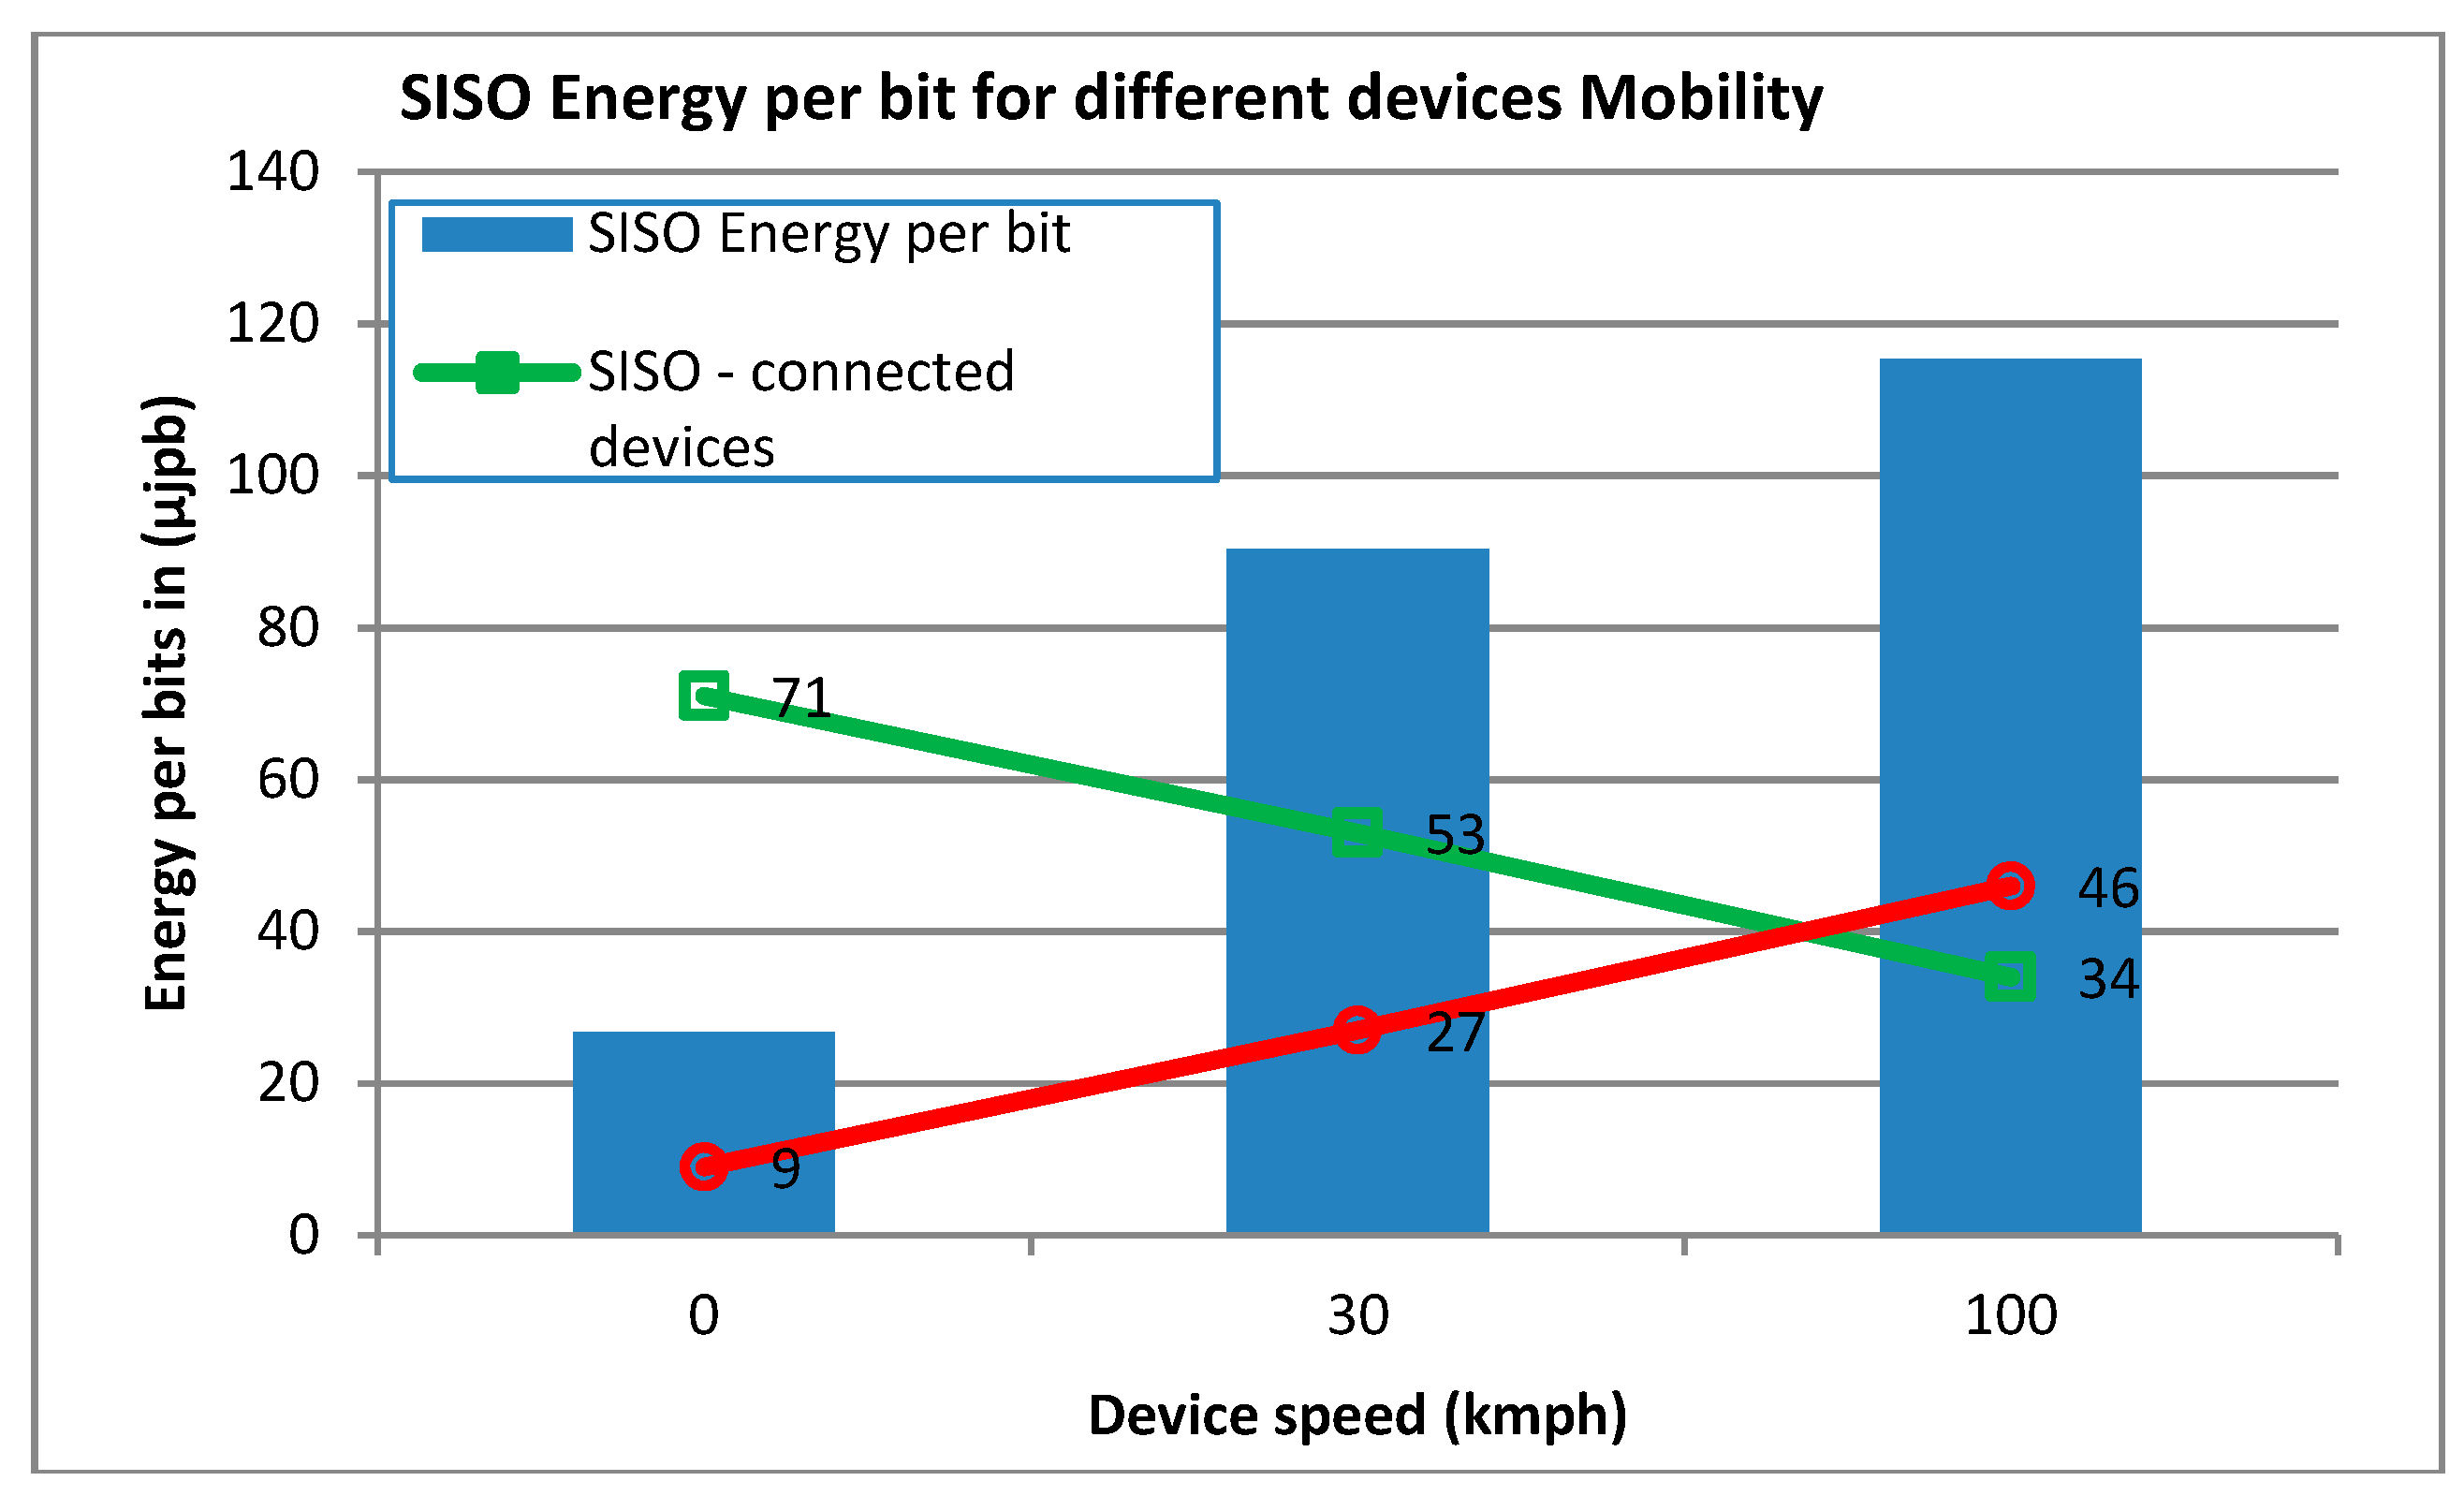
Figure 8.
Energy per bits in μjpb with two antennas sensors, simulation has been conducted with 80 MTC devices for 5 MHz bandwidth.
Figure 8.
Energy per bits in μjpb with two antennas sensors, simulation has been conducted with 80 MTC devices for 5 MHz bandwidth.

Figure 9.
Data transaction from 4 different MTC devices of four sensors networks with different requirements.
Figure 9.
Data transaction from 4 different MTC devices of four sensors networks with different requirements.

Figure 10.
Peak/avg/Edge TP with/out RRUs.

Figure 11.
Average spectral efficiency for RR scheduling algorithm, with and without distributed RRUs.
Figure 11.
Average spectral efficiency for RR scheduling algorithm, with and without distributed RRUs.
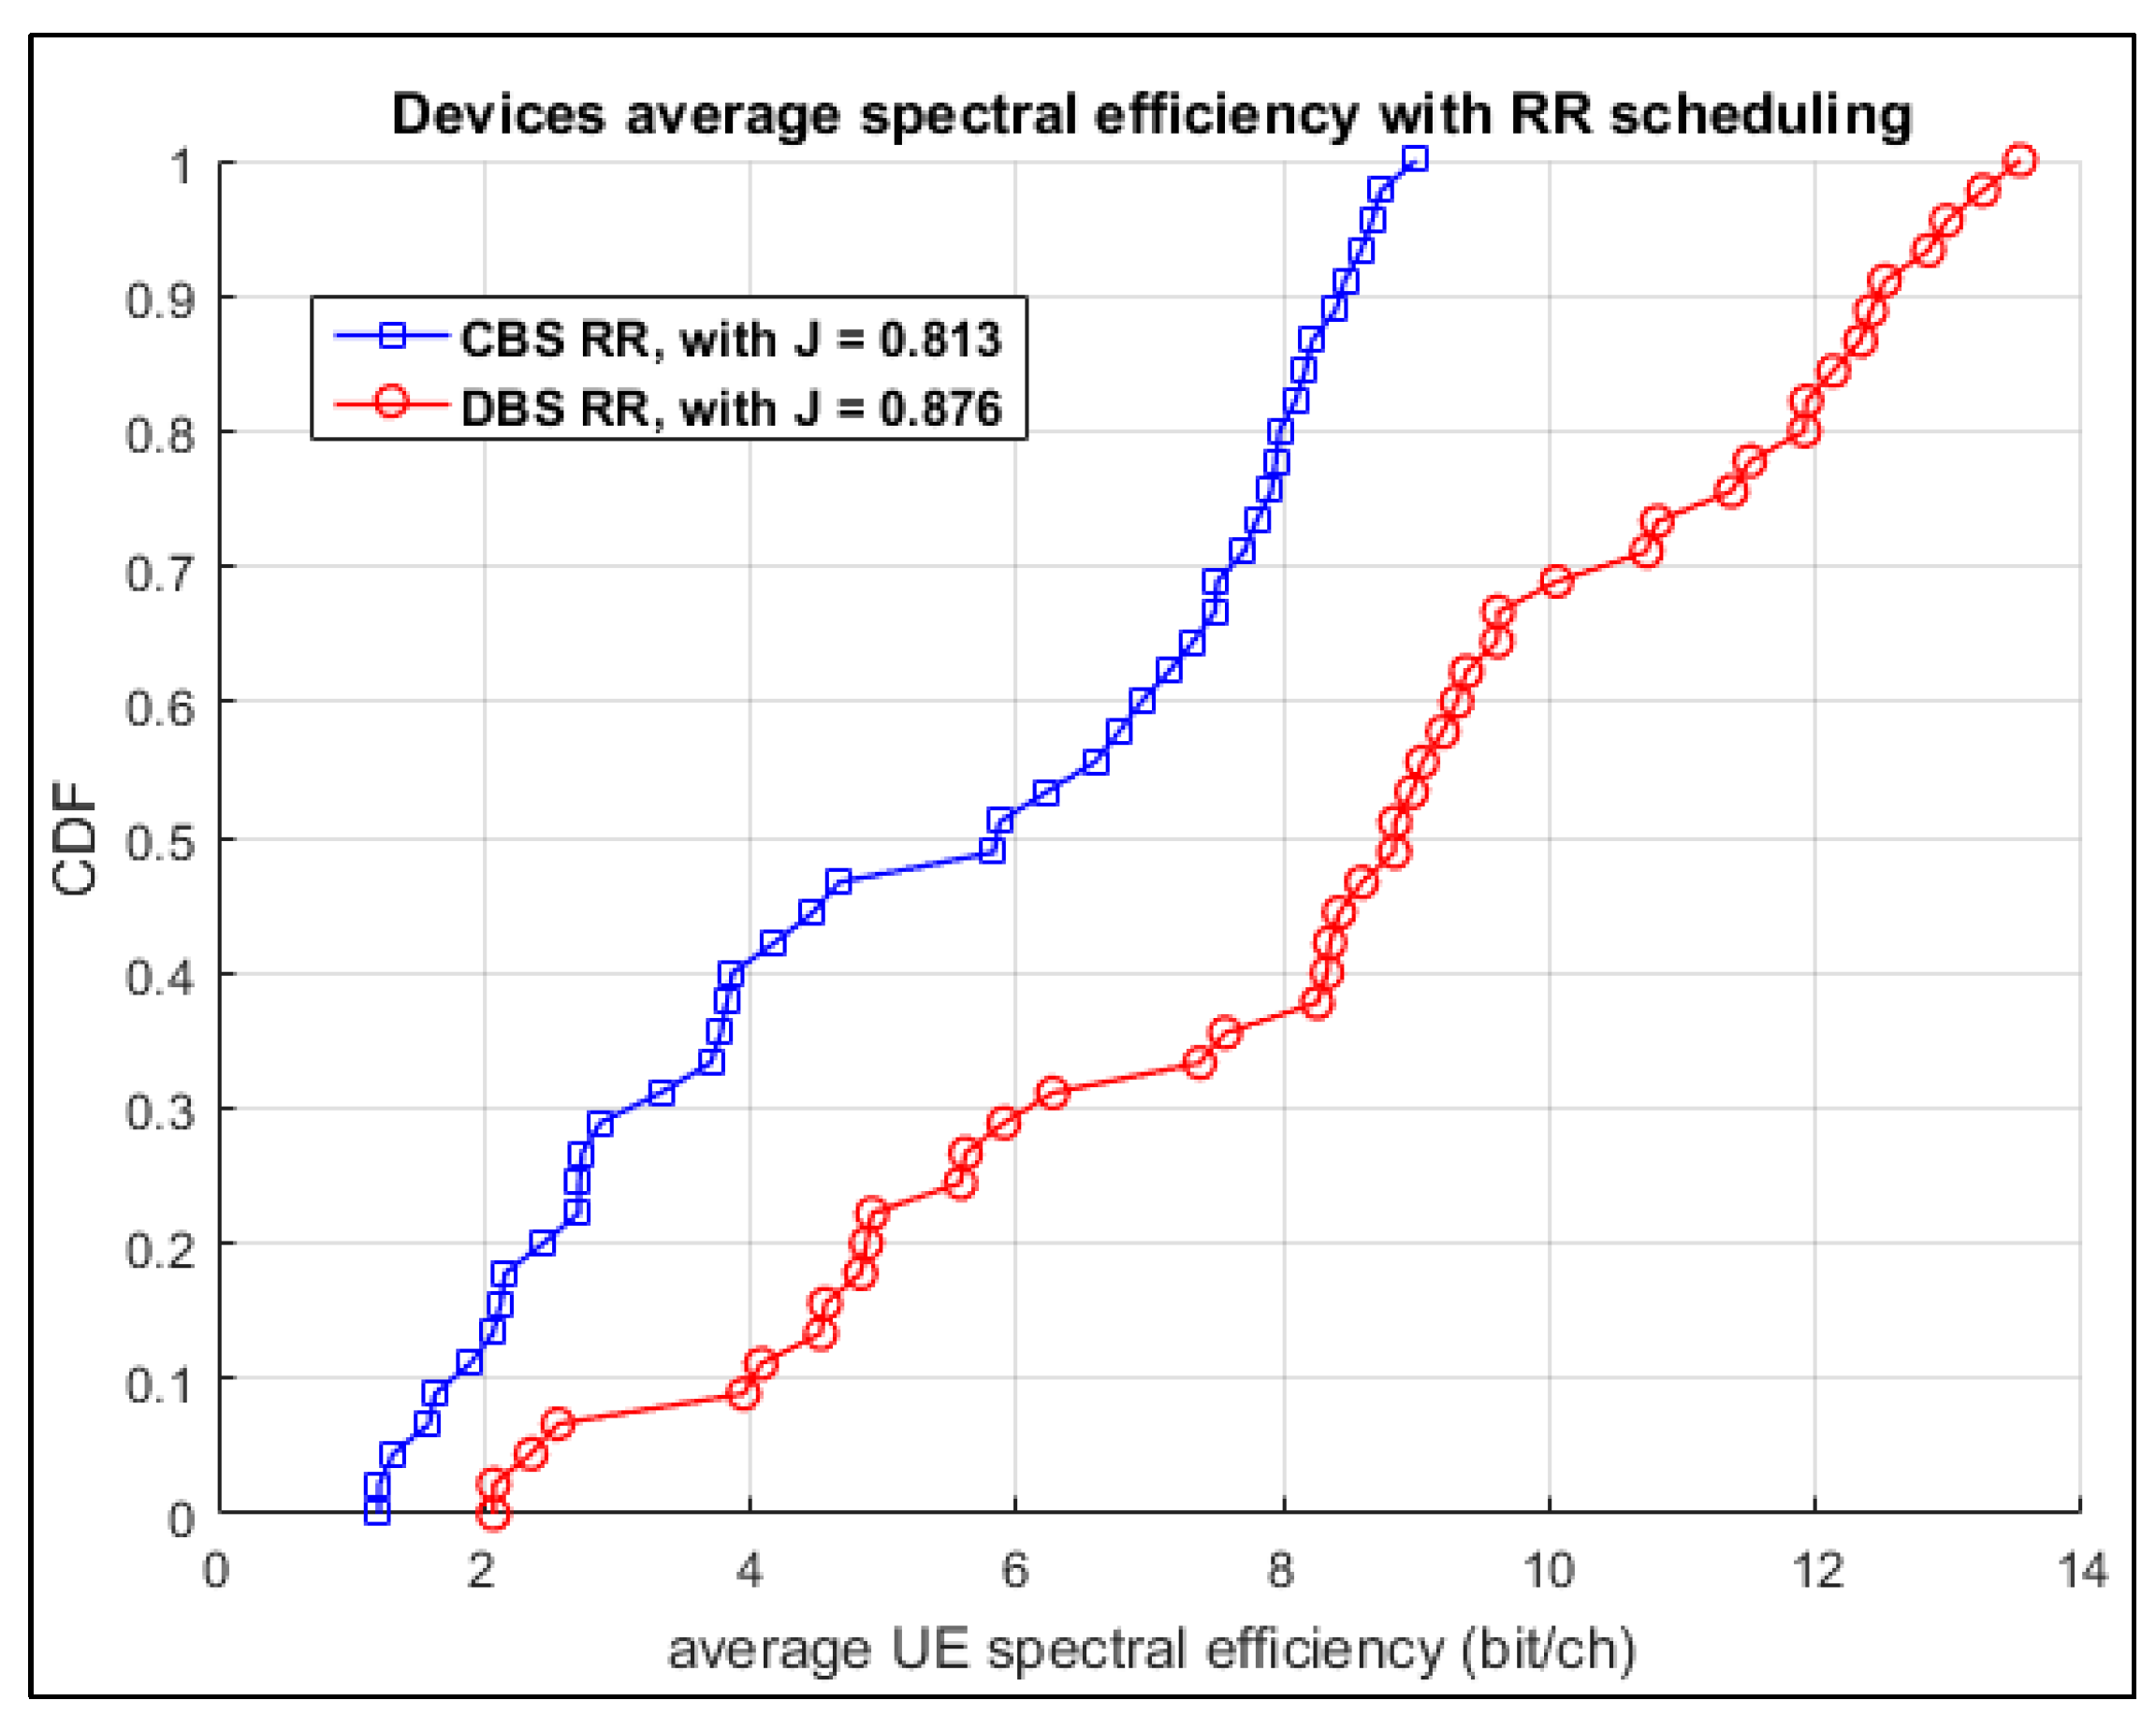
Figure 12.
Average spectral efficiency for PF scheduling algorithm, with and without distributed RRUs.
Figure 12.
Average spectral efficiency for PF scheduling algorithm, with and without distributed RRUs.

Figure 13.
Average spectral efficiency for best CQI scheduling algorithm, with and without distributed RRUs.
Figure 13.
Average spectral efficiency for best CQI scheduling algorithm, with and without distributed RRUs.

Figure 14.
Fairness Index (j) of DBS and CBS architecture, the data label is the percentage gain of fairness in DBS over CBS for every scheduling algorithm.
Figure 14.
Fairness Index (j) of DBS and CBS architecture, the data label is the percentage gain of fairness in DBS over CBS for every scheduling algorithm.
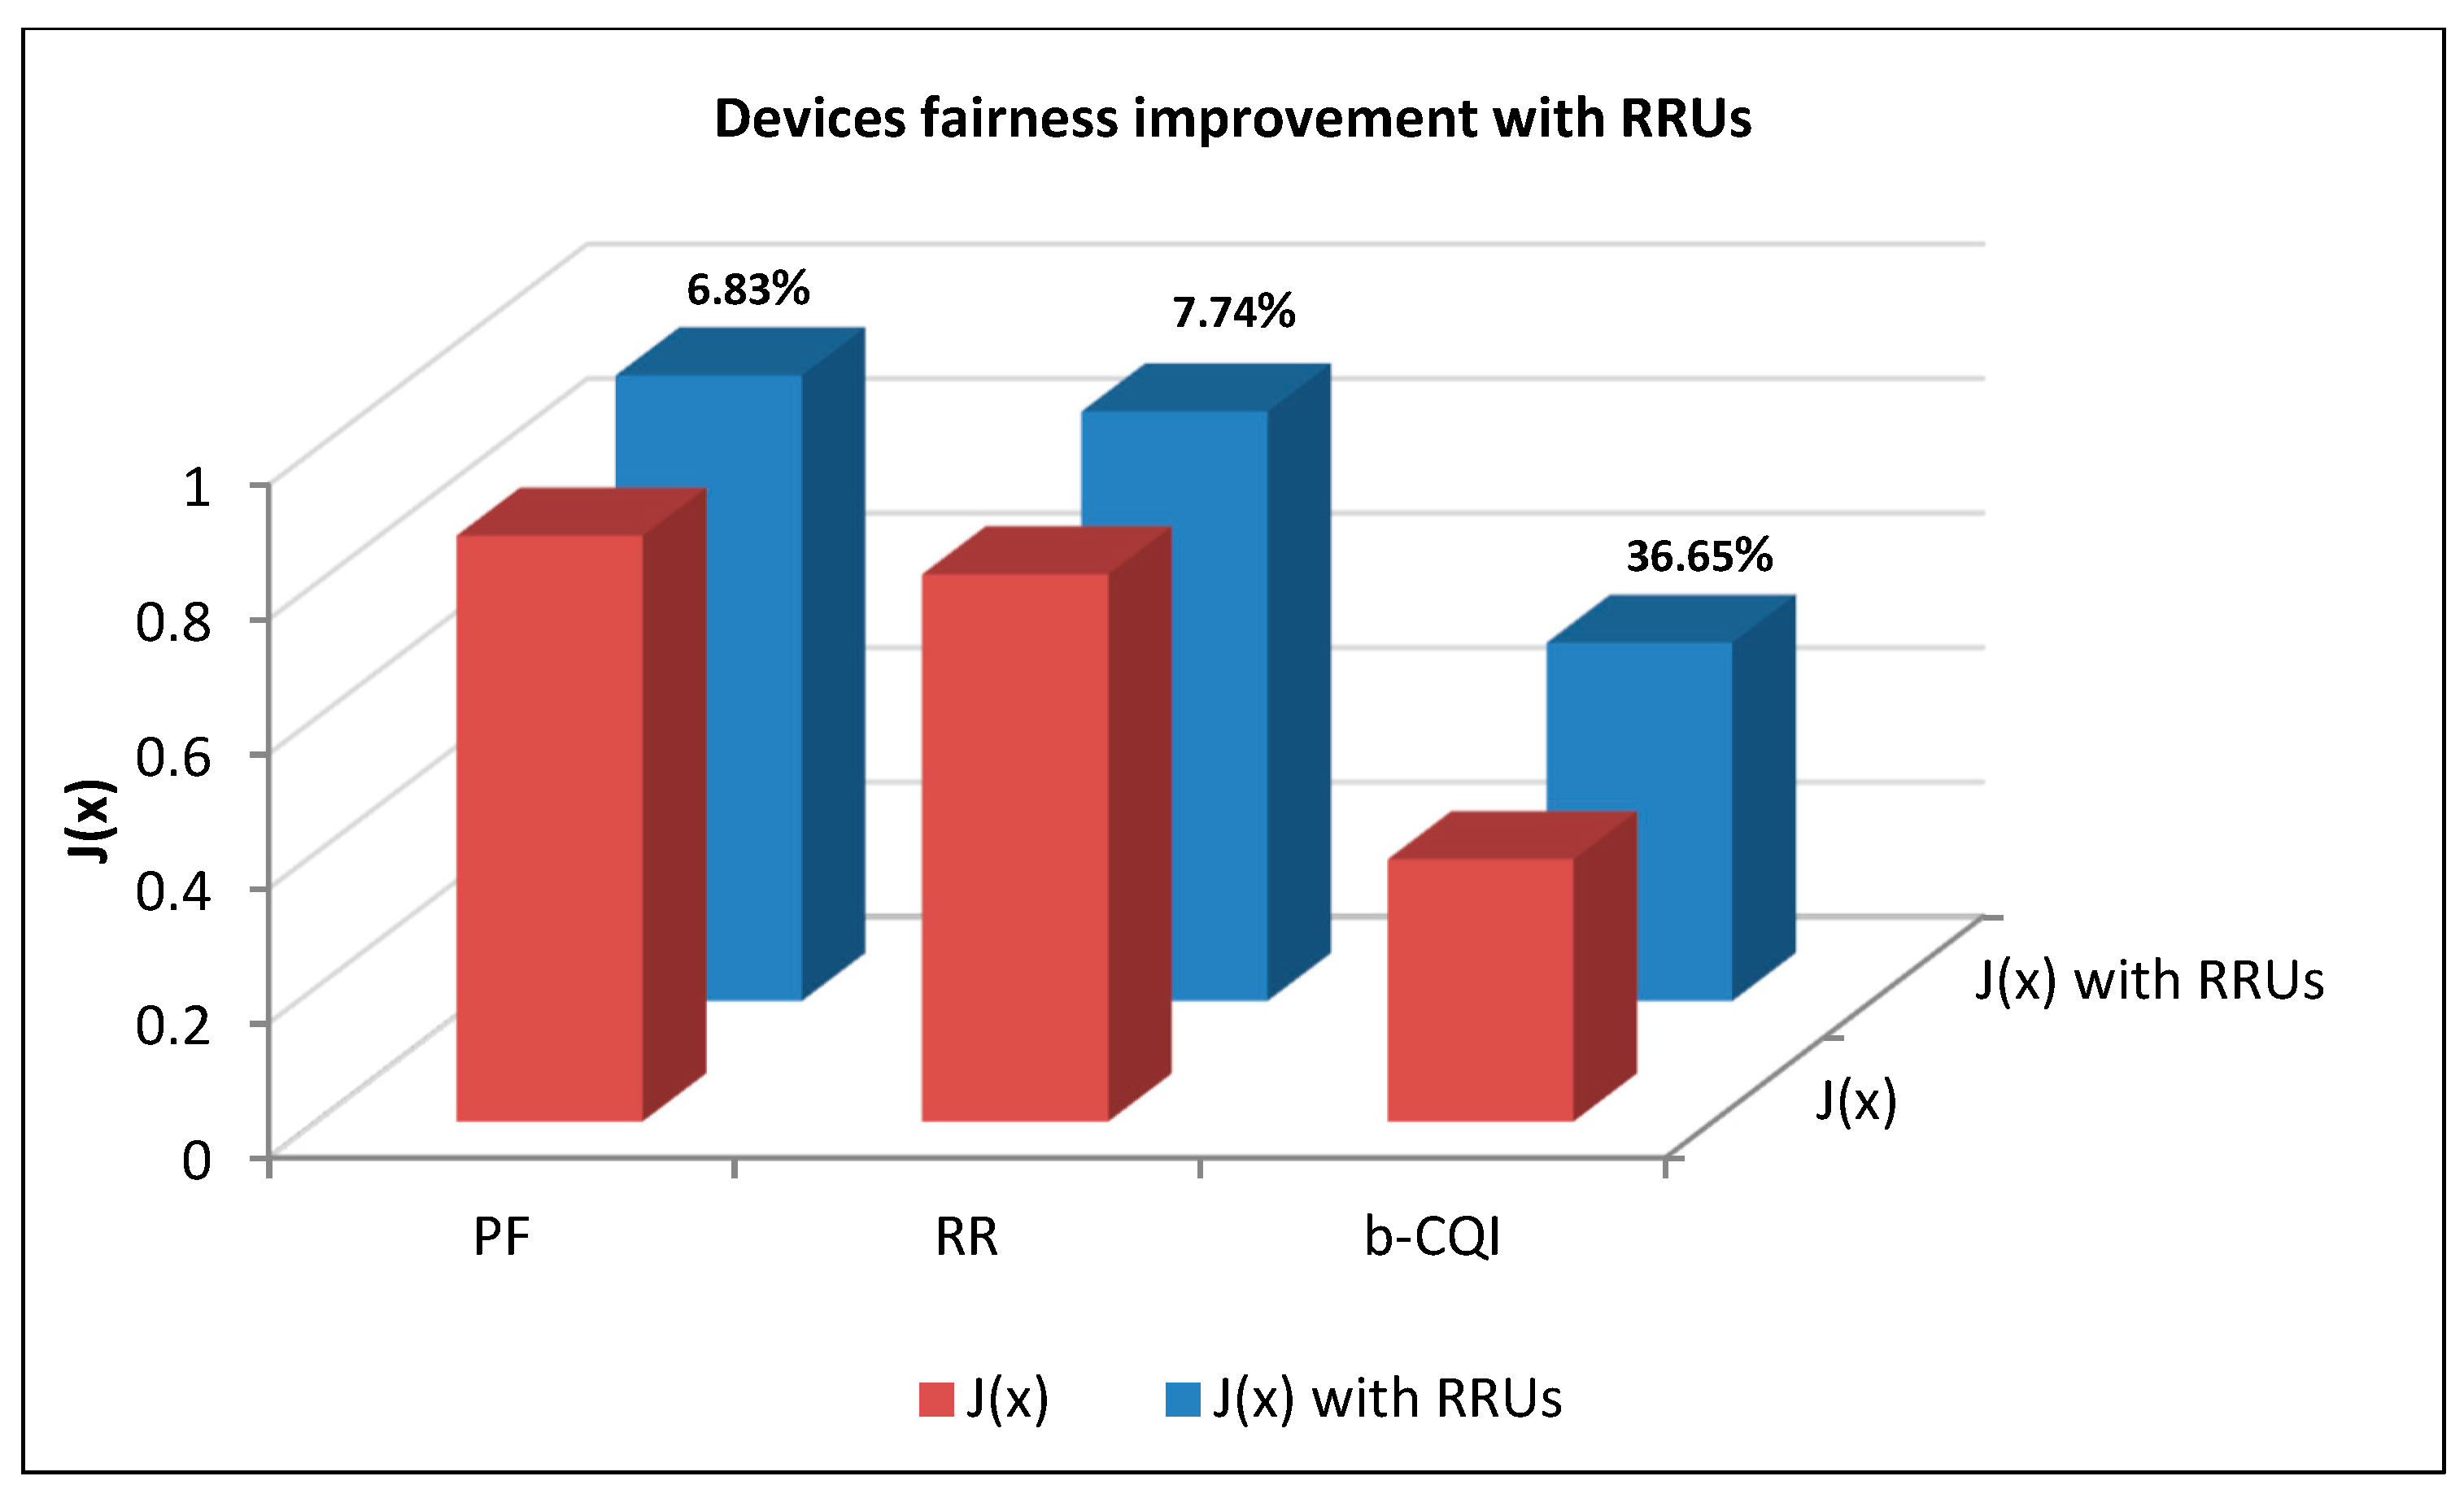
Figure 15.
The improvement in the percentage of connected devices with RRUs distribution.

| Sensor Type | Sampling Frequency (Hz) | Bits Per Sample | No. of Channels | Date Rate (bps) |
|---|---|---|---|---|
| EEG | 256 | 16 | 24 | 98,304 |
| EKG | 200 | 16 | 1 to 3 | 3200–9600 |
| blood pressure | 120 | 16 | 1 | 1920 |
| Pulse oximeter | 60 | 16 | 2 | 1920 |
| Cardiac output | 40 | 16 | 1 | 640 |
| Body temperature | 0.2 | 12 | 1 | 2.4 |
Table 2.
Network model parameters.
| Model Parameter | Value |
|---|---|
| Waveform | OFDM |
| Communication | MTC |
| Tx Power | 10 W |
| Tx antenna gain | 15 dB |
| Tx pattern | As in Equation (1) |
| Electrical tilt | −6 degree (down tilt) |
| Carrier frequency | 26 GHz |
| Inter-Site-Distance (ISD) | 150 m |
| Bandwidth | (1.4, 3, 5, 10, 20) MHz |
| Tx antenna elements | 1, 2 and 4 |
| Tx Antenna height | 10 m |
| Modulation | Adaptive (QPSK, 16QAM, 64QAM) |
| Region of interest (ROI) | ROI = 600 × 600 m2 |
| MTC devices | Up to 500 MTC devices per ROI |
| Noise Figure | 10 dB |
| Noise Density | −174 dBm/Hz |
| Traffic Model | FTP |
Table 3.
Connected MTC devices per node with 0 kmph device speed.
| Tx Mode | Allocated Bandwidth (MHz) | ||||
|---|---|---|---|---|---|
| 1.4 | 3 | 5 | 10 | 20 | |
| SISO | 12 | 27 | 64 | 175 | 371 |
| 2 × 2 MIMO | 27 | 73 | 118 | 237 | 474 |
Table 4.
Connected MTC devices per node with 30 kmph device speed.
| Tx Mode | Allocated Bandwidth (MHz) | ||||
|---|---|---|---|---|---|
| 1.4 | 3 | 5 | 10 | 20 | |
| SISO | 11 | 17 | 26 | 41 | 67 |
| 2 × 2 MIMO | 13 | 21 | 36 | 48 | 81 |
Table 5.
Connected MTC devices per node with 100 kmph device speed.
| Tx Mode | Allocated Bandwidth (MHz) | ||||
|---|---|---|---|---|---|
| 1.4 | 3 | 5 | 10 | 20 | |
| SISO | 9 | 16 | 22 | 35 | 57 |
| 2 × 2 MIMO | 12 | 18 | 31 | 39 | 59 |
© 2018 by the authors. Licensee MDPI, Basel, Switzerland. This article is an open access article distributed under the terms and conditions of the Creative Commons Attribution (CC BY) license (http://creativecommons.org/licenses/by/4.0/).
Share and Cite
MDPI and ACS Style
Al-Falahy, N.; Alani, O. Improved Capacity and Fairness of Massive Machine Type Communications in Millimetre Wave 5G Network. Computers 2018, 7, 16. https://doi.org/10.3390/computers7010016
AMA Style
Al-Falahy N, Alani O. Improved Capacity and Fairness of Massive Machine Type Communications in Millimetre Wave 5G Network. Computers. 2018; 7(1):16. https://doi.org/10.3390/computers7010016
Chicago/Turabian StyleAl-Falahy, Naser, and Omar Alani. 2018. "Improved Capacity and Fairness of Massive Machine Type Communications in Millimetre Wave 5G Network" Computers 7, no. 1: 16. https://doi.org/10.3390/computers7010016
Note that from the first issue of 2016, this journal uses article numbers instead of page numbers. See further details here.