Coordination and Cooperation Problems in Network Good Production

1
Department of Sociology/ICS, Utrecht University, Heidelberglaan 2, 3584 CS, Utrecht, The Netherlands
2
Erasmus School of Law, Erasmus University Rotterdam, Burgemeester Oudlaan 50, 3062 PA, Rotterdam, The Netherlands
*
Author to whom correspondence should be addressed.
Games 2010, 1(4), 357-380; https://doi.org/10.3390/g1040357
Submission received: 7 June 2010
/
Revised: 7 August 2010
/
Accepted: 6 September 2010
/
Published: 28 September 2010
(This article belongs to the Special Issue Social Networks and Network Formation)
Abstract
:If actors want to reach a particular goal, they are often better off forming collaborative relations and investing together rather than investing separately. We study the coordination and cooperation problems that might hinder successful collaboration in a dynamic network setting. We develop an experiment in which coordination problems are mainly due to finding partners for collaboration, while cooperation problems arise at the investment levels of partners who have already agreed to collaborate. The results show that as costs of forming links increase, groups succeed less often in solving the coordination problem. Still, if subjects are able to solve the coordination problem, they invest in a suboptimal way in the network good. It is mostly found that if cooperation is successful in terms of investment, it is due to subjects being able to monitor how much their partners invest. Moreover, subjects deal better with the coordination and cooperation problems as they gain experience.
1. Introduction
If actors want to reach a particular goal, they are often better off forming collaborative relations and investing together rather than each trying to reach the goal individually. We study the coordination and cooperation problems that endanger successful collaboration in such situations using a computerized experiment. More specifically, we study situations in which actors look for relations with others to produce what we label a “network good with complementarities.” A network good is a special form of a collective good. A classic collective good is characterized by non-excludability: the contribution of one benefits the whole group [1,2]. However, for a network good, non-excludability only takes place within social relations [3]. In other words, the contribution of a focal actor only benefits the actors who are linked to this focal actor through the network including the focal actor himself. A network good with complementarities has the characteristic that the investments in this good made by actors become more beneficial when these actors are linked to others who also invest [4]. A noteworthy example of such a good is knowledge or expertise. An actor’s ideas are often only accessible to those who are in contact with this actor. Moreover, combining the expertise of one with the know-how of another can lead to a pool of knowledge that is worth more than the sum of its uncombined parts.
Ballester et al. [4] formulate a game-theoretic model to predict how much actors invest in a network good with complementarities when the network structure of collaborations is exogenously given. There are two aspects that we explore further. First, Ballester et al. predict that in each network structure actors invest according to their Nash equilibrium strategy. If their predictions are correct, this would imply a suboptimal production of the network good. In the conditions we use in this study, actors typically have to invest more than their Nash equilibrium strategy to reach the optimal level of the network good. Although everybody would be better off doing so, this situation is not stable as each actor has an incentive to lower his investment and free-ride on others’ investments. Therefore, we address the following question in a laboratory experiment: are there circumstances that help subjects to overcome the cooperation problem, or are they mostly trapped in the suboptimal Nash equilibrium?
Second, Ballester et al. [4] assume that the network is fixed, which is perfectly realistic for some situations, but in other situations choosing with whom to form collaborative relations is an integral part of the interaction structure. For example, companies that want to develop a new product may actively approach one or more strategic partners to start an R&D alliance, while nations form pacts to develop uniform laws or common policies. To account for this class of situations we present a dynamic version of Ballester et al.’s model. This dynamic situation introduces a new problem, namely a coordination problem in creating the network of collaborative relations. The coordination problem occurs when we let actors start in an empty network. All actors would be better off if they created a particular structure of collaborative links and invest enough in the network good. However, because each actor is worse off by creating a link as long as other actors have not yet created links, nobody has a direct incentive to create the first link. Thus, before turning to the question whether the companies and nations from the above examples are able to overcome the cooperation problem, the question we should turn to is: do they succeed in starting a collaboration at all?
We perform a laboratory experiment in which groups of four subjects play a network game for several rounds. Specifically, each subject can invest in a network good with complementarities as well as propose links to the other three group members. If others accept such a link proposal, a link is formed. The subjects make their decisions in continuous time and see what others are doing. Thus, they can adapt their behavior to actions of others instantaneously. After a link is established, the investments of both subjects involved become more beneficial, but these subjects also pay link costs. As in the examples, establishing and forming collaborative relations is not free and these costs depend on the context in which the relations are considered. As long as the costs of forming links are low there is hardly any coordination problem, but the higher the link costs the more severe the coordination problem becomes. The experimental setting allows us to test whether subjects indeed have more difficulty in collaborating as the coordination problem increases by presenting the subjects with three different levels of link costs. Furthermore, we investigate whether solving the coordination problem is easier for actors who show more strategic sophistication in another type of interaction and whether experience helps to solve the coordination problem.
Even if subjects are able to overcome the coordination problem and form collaborative relations, they still face a cooperation problem. One important solution to cooperation problems that has been proposed is conditional cooperation [2]. A prerequisite for conditional cooperation is that actors have information about whether their partners are cooperating or not. Therefore, we vary whether our subjects can see how much others in their group invest in the network good.
To summarize, our paper includes the following main contributions. First, it provides an experimental test for an extended version of the model by Ballester et al. [4] that includes endogenous network formation. Second, this experimental test deals with a combination of coordination and cooperation problems. Third, we investigate the effects of actors’ strategic sophistication and experience for both types of problems.
In terms of the broader literature, this paper can be placed within a long tradition of research on understanding why actors sometimes cooperate peacefully while at other times groups of actors seem to approach Hobbes’ “war of all against all.” Within this tradition, many have been concerned with cooperation and collective good problems [1,2,5,6] and in particular with the role that social relations play (e.g., [7,8,9,10,11,12]). Our paper is also closely linked to a more recent body of literature that focuses on how networks co-evolve with behavior in coordination and cooperation problems (e.g., [13,14,15,16,17,18,19,20]).
The remainder of the paper is built up as follows: Section 2 introduces first the theoretical model and then the game derived from this model that subjects played in the experiment; Section 3 formulates expectations about the outcomes of the experiment; Section 4 describes further details about the data collection and the experiment; Section 5 provides the descriptive results, while Section 6 discusses the explanatory analyses; Section 7 concludes.
2. The General Model and the Computerized Game Version
In this section we first present a general model and then the computerized game version of this model subjects played in the experiment. The model is based on Ballester et al. [4], who study investments in a network good with complementarities for an exogenously given network. By adding opportunities to create and sever links as well as link costs to the model, we analyze situations where the network can be expected to co-evolve with the investments made. Galeotti and Goyal [21] took a similar approach by developing a “dynamic” version of the “static” model of network goods with substitutes by Bramoullé and Kranton [3].
2.1. The General Model
Let N = {1, 2,…, n} be the set of actors and let i and j be typical members of this set. Each actor i selects an investment level xi ϵ [0, ∞] and chooses with whom he would like to form links. Linking proposals are denoted by the vector hi = (hi1,…, hin) with hij ϵ {0, 1}. If actor i wants to be linked to j then hij = 1, otherwise hij = 0. Actor i cannot link with himself (hii = 0). Actors i and j obtain a link if, and only if, gij = hijhji = 1. If i and j do not both propose a link gij = 0. We assume this because the type of relations we are interested in, such as collaborations between firms or pacts between nations, need the consent of both parties almost by definition. Actor i’s links can be represented by the vector gi = (gi1, …, gin). The set of vectors of links for all actors constitutes the symmetric n × n matrix g of the network of actors. If we consider a particular network g, let then g–ij (g+ij) be the same network but with the link between i and j deleted (added). Define Ni(g) = {j ϵ N | gij = 1} as the set of actors with whom i has formed a link. Let then ηi(g) = |Ni(g)| be the degree of actor i.
Define si = (xi, hi) as the strategy of actor i including the chosen investment level as well as the link proposals. A strategy profile s = (x, h) specifies the investment levels and link proposals of all actors and let g bet the resulting network. Then, the payoff of actor i under strategy profile s is given by
![Games 01 00357 i001]() with α > 0 and β > 0 meaning that Πi is strictly concave in own investments. In other words, an actor faces decreasing marginal returns to the individual part of his investments. This ensures that the optimal individual investment level and payoffs are finite. We set productivity of joint investment λ > 0, indicating that if i and j have a link, their investments are strategic complements: an increase in j’s investment increases the optimal investment level of i. How large this increase is depends on the size of λ. With each link that i makes to another investing actor, his own investments become more beneficial. In other words, by adding a link, an actor receives a “complementarity bonus” to his investments with the size of λ times the investment of the newly created neighbor. We could say that λ offsets the decelerating effect of β to some extent. If λ would become too large, it would even prevail over β and actors could form a link and invest infinitely to earn infinite payoffs. Ballester et al. [4] therefore require that β > λ (n – 1), which is sufficient to prevent infinite payoffs if actors invest according to their Nash equilibrium strategy, i.e., if actors’ investments, given the network, are best responses to the investments of others. However, payoffs can still go to infinity if we consider the possibility that actors cooperate and invest more than their Nash equilibrium strategy. Therefore, we choose the parameters in the experiment such that β > 2λ(n – 1), which implies that there is a finite upper bound on Πi whatever the network is and whatever actors invest. Finally, the costs of forming and maintaining a link are given by c > 0.
with α > 0 and β > 0 meaning that Πi is strictly concave in own investments. In other words, an actor faces decreasing marginal returns to the individual part of his investments. This ensures that the optimal individual investment level and payoffs are finite. We set productivity of joint investment λ > 0, indicating that if i and j have a link, their investments are strategic complements: an increase in j’s investment increases the optimal investment level of i. How large this increase is depends on the size of λ. With each link that i makes to another investing actor, his own investments become more beneficial. In other words, by adding a link, an actor receives a “complementarity bonus” to his investments with the size of λ times the investment of the newly created neighbor. We could say that λ offsets the decelerating effect of β to some extent. If λ would become too large, it would even prevail over β and actors could form a link and invest infinitely to earn infinite payoffs. Ballester et al. [4] therefore require that β > λ (n – 1), which is sufficient to prevent infinite payoffs if actors invest according to their Nash equilibrium strategy, i.e., if actors’ investments, given the network, are best responses to the investments of others. However, payoffs can still go to infinity if we consider the possibility that actors cooperate and invest more than their Nash equilibrium strategy. Therefore, we choose the parameters in the experiment such that β > 2λ(n – 1), which implies that there is a finite upper bound on Πi whatever the network is and whatever actors invest. Finally, the costs of forming and maintaining a link are given by c > 0.

2.2. The Computerized Game Version Used in the Experiment
We made a computerized game version of this model for four subjects and with α = 48, β = 16, λ = 2 using the z‑Tree software [22]. The game consisted of six different scenarios: a scenario combines one of three link cost conditions (c = 10, 30, and 50) with one of two information conditions (information available about others’ investments and payoffs, no such information available) (see Table 1). Each subject played each of the six scenarios. The order in which the subjects played the six scenarios differed between sessions. Four different orderings were used and each was presented in three sessions (see Table 1). Each scenario consisted of five rounds: one unpaid trial round to gain experience with the scenario and four rounds that actually mattered for the subjects’ final earnings. In the trial rounds, subjects could freely choose investments and links to experience how different choices affect the outcomes. In total, subjects played 6 × 5 = 30 rounds of which 24 rounds were paid. During each round, subjects could continuously change their links and investments for a number of seconds that was randomly chosen between 90 and 120. This number of seconds was not announced to the subjects; they only knew that it was randomly chosen between 90 and 120 seconds.
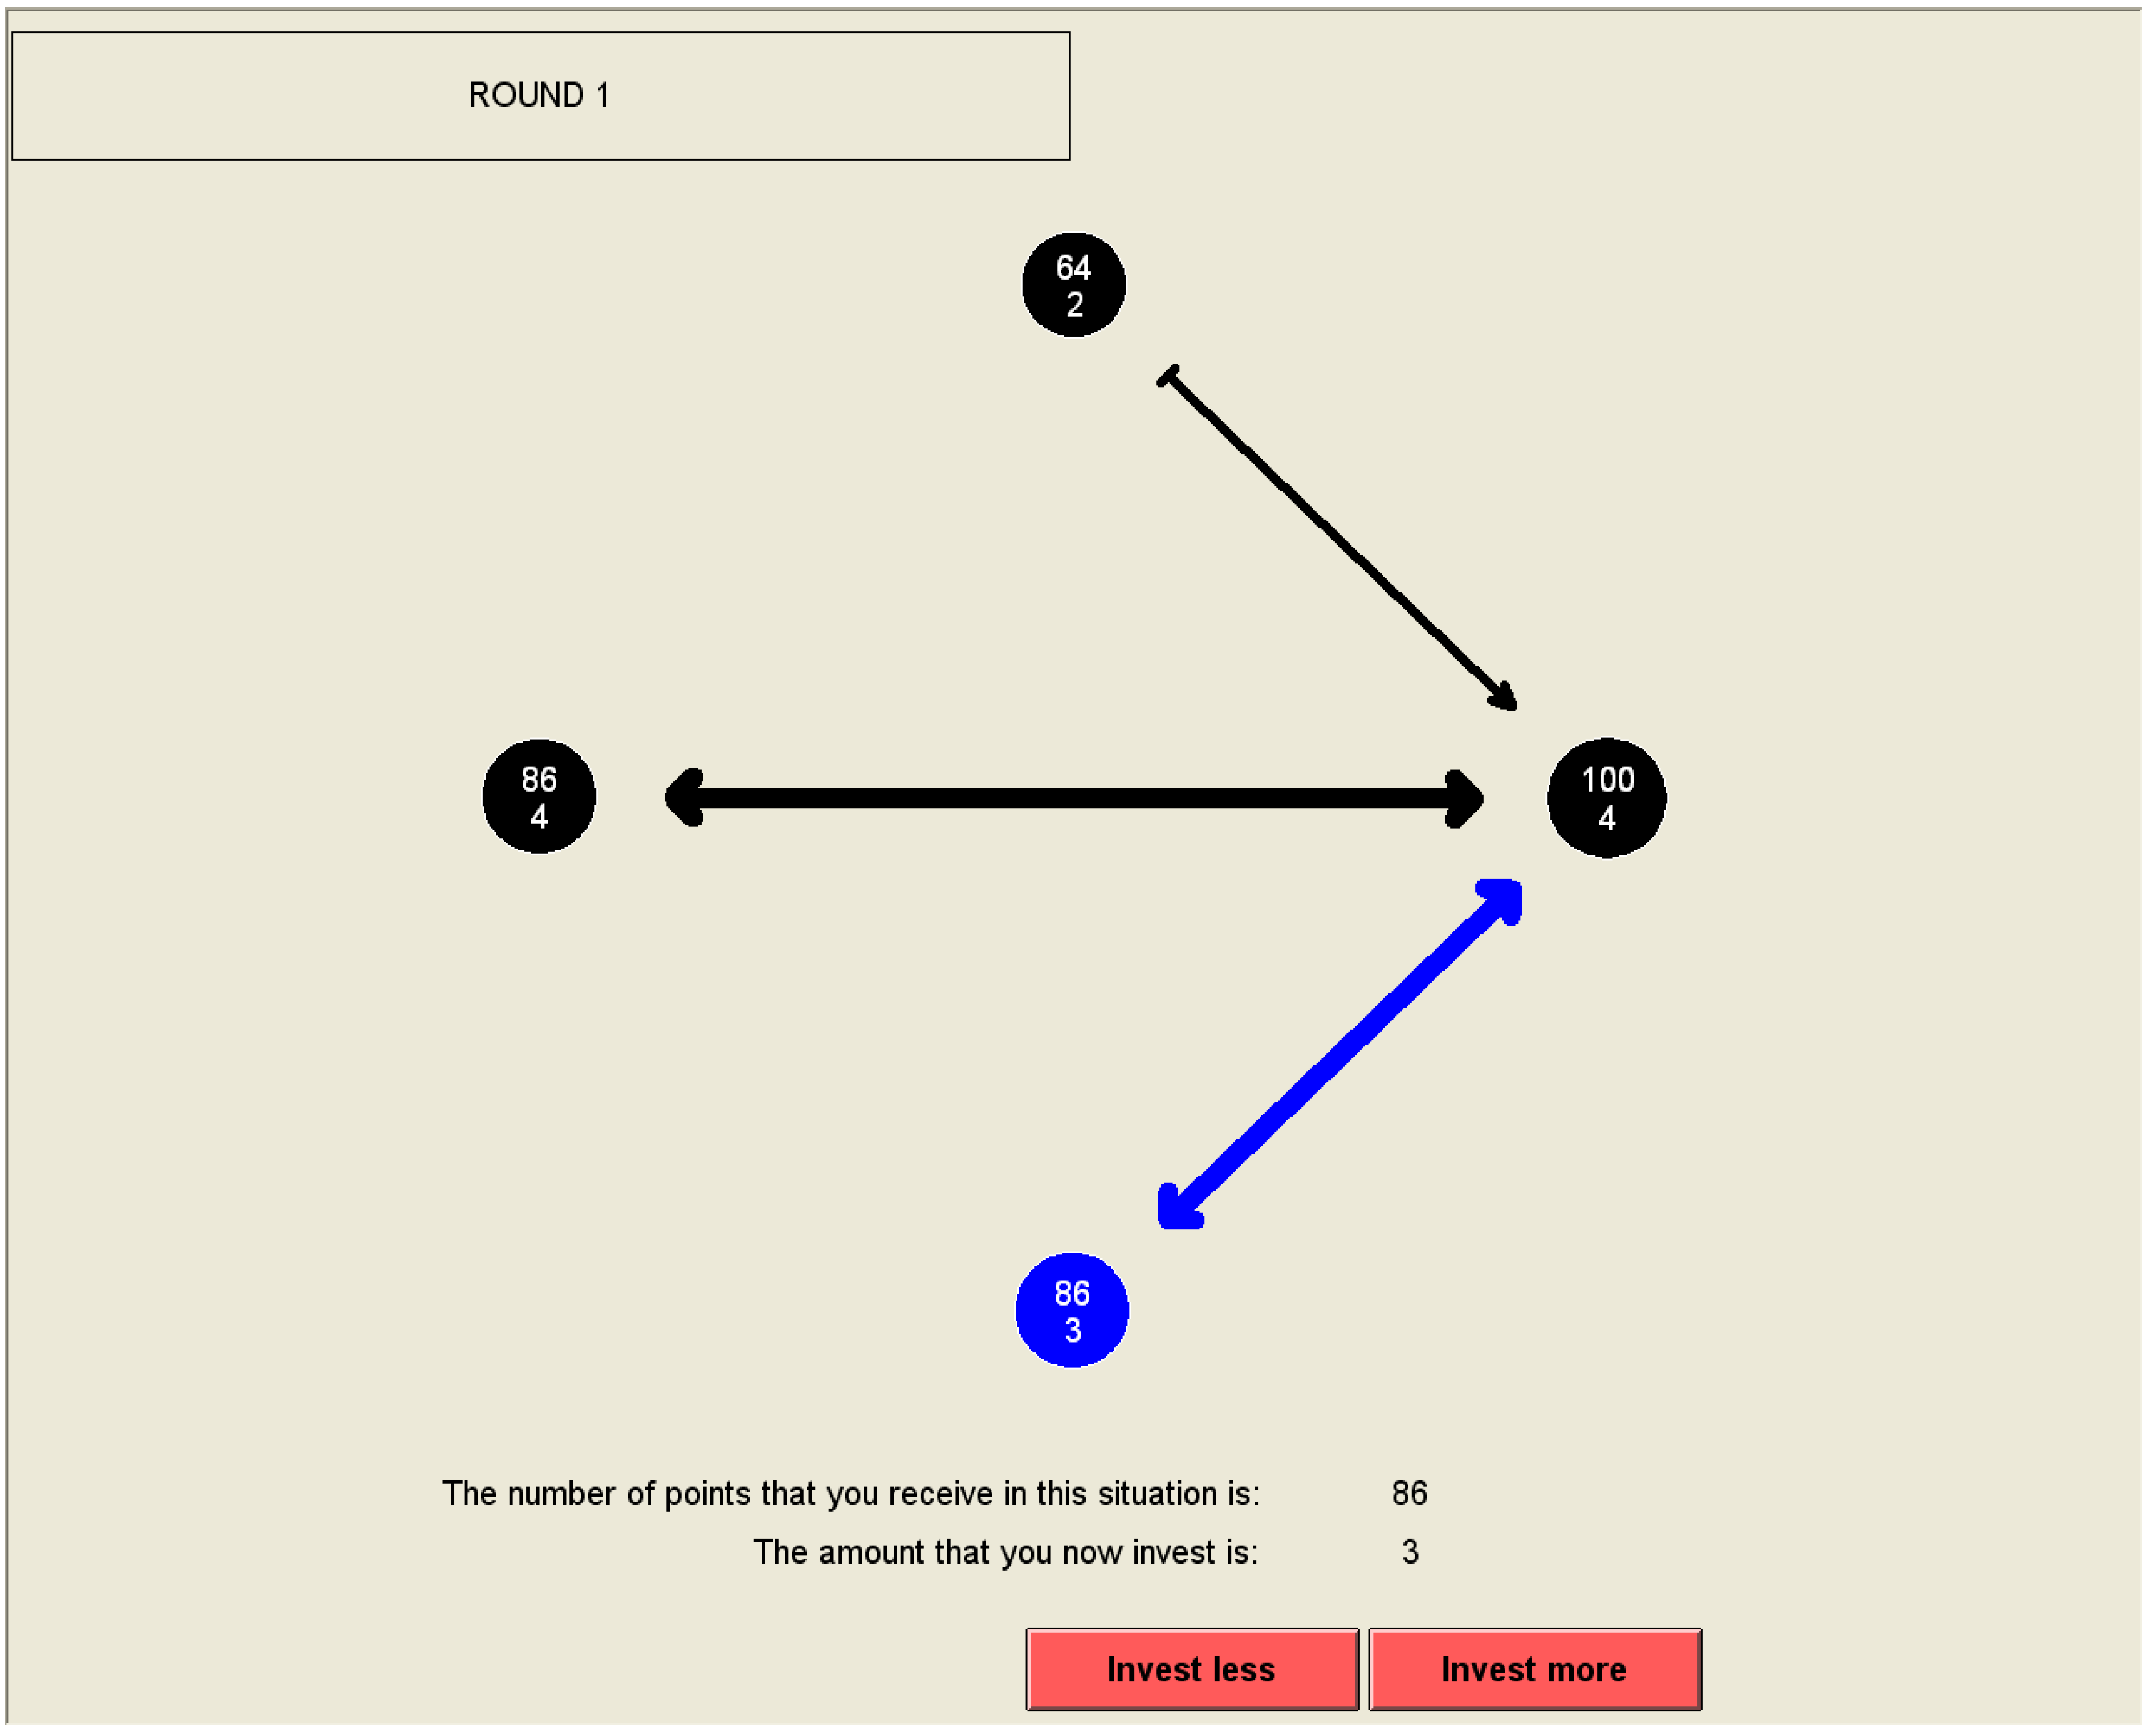
Subjects were randomly matched with three other subjects into groups of four at the start of each round. Each subject was depicted as a circle on the screen (see Figure 1). Each subject saw him or herself as a blue circle, while others in the group appeared as black circles. At the beginning of a new round, subjects were randomly shuffled into new groups. Therefore, subjects knew that the persons they were playing with in one round were very likely to be different from those they were playing with in the previous round. During the entire experiment subjects were not allowed to talk with each other.
Since points were converted to actual money, subjects are expected to have a real incentive to make conscious choices. How many points a subject earned in a round only depended on the situation at the end of that round. As follows from the payoff function of the general model, subjects’ earnings depended on their own investment level, the number of neighbors they had, how much their neighbors invested, and how high link costs were in that particular scenario. When the time of a round was up, a message appeared at the bottom of the screen indicating how much a subject earned in this round. The network remained visible in the final position so that in the information condition subjects could also see how much the other subjects invested at the end of the round and how much other subjects earned. Information on the investments and earnings of other subjects was not revealed in the no information condition. Subjects did not receive information about accumulated earnings.

Table 1.
The six scenarios and four orderings of scenarios (cells indicate link costs followed by whether or not information on others’ investments was available).
| Scenario Number | ||||||
| 1 | 2 | 3 | 4 | 5 | 6 | |
| costs = 10; | costs = 30; | costs = 50; | costs = 10; | costs = 30; | costs = 50; |
| info | info | info | no info | no info | no info | |
| costs = 50; | costs = 30; | costs = 10; | costs = 50; | costs = 30; | costs = 10; |
| info | info | info | no info | no info | no info | |
| costs = 10; | costs = 30; | costs = 50; | costs = 10; | costs = 30; | costs = 50; |
| no info | no info | no info | info | info | info | |
| costs = 50; | costs = 30; | costs = 10; | costs = 50; | costs = 30; | costs = 10; |
| no info | no info | no info | info | info | info | |
Figure 1.
Screen shot of the computerized game.

Subjects could set their investment level on any non-negative integer number by clicking the “invest more” and “invest less” buttons on their screen (see Figure 1). The instructions contained a table presenting how many points were earned for all integers from 0 to 14 when a subject did not have any links and invested individually. The investments of a subject became worth more when linked to another in the group who also invested: in addition to the individual earnings 2 × own investment level × neighbor’s investment level was received. The link costs were stated at the beginning of a new scenario. In each circle, one could the entire round see how much each subject invested and how many points this subject would earn in total if the round were to finish. Also, circles increased in size when more points were about to be earned. The exceptions were the no information scenarios, in which the circles of the other subjects were completely black and the circles did not change in size. In these scenarios, a subject only saw this information for own investments and earnings.
A subject could propose a link to another subject by clicking on the circle of this subject: a one‑sided arrow would appear to show the link proposal. A link would be established if the other also clicked on the circle of the proposing subject: the arrow then changed into a thick double-headed arrow. Proposals for links did not cost anything, only fully established links affected earnings. Links and proposals for links could be removed at any time by clicking on the circle of the other again. Since earnings only depended on the final situation in a round, subjects were only “charged” for the links they were involved in when a round ended.
Many experiments have a simultaneous-move discrete time design: subjects decide simultaneously and then the results of these choices are made known to them, and then they get another opportunity to simultaneously choose, and so on. This way, many decisions may change simultaneously, which makes coordination on any stable configuration difficult [23]. In a continuous time design, each choice of a subject is immediately common knowledge for the group, so subjects always know what they are reacting to. The advantage is that subjects do not need to infer what others are going to do as is the case when subjects have to move simultaneously. Moreover, since the effect of an action is updated immediately also in terms of points to be earned, a subject can promptly revoke an action if it turns out to be unsatisfactory. Together with the facilitation of sending signals to group members, subjects thus have more possibilities to coordinate individual actions [24]. A final advantage is that this design seems more realistic: in the situations we attempt to model, actors can take their decisions in continuous time as well and actors can adapt to changes in behavior of others. A disadvantage of this design might be that the strategic analysis strictly speaking should incorporate the dynamic nature of the game. We pay some attention to this issue below.
3. Predicting the Outcomes in the Experiment
In this section, we build on the general result by Ballester et al. [4] for fixed networks to calculate the payoffs for all possible networks in our experimental case. We use the term “Nash investments” to refer to investments that form a Nash equilibrium if the related network structure is given. We extend the notion of pairwise equilibrium [25,26] originally developed for pure network dynamics to predict outcomes of the combined link and investment choices in our experiment. Although the strict strategic analysis of the continuous time feature of our experiment would require a more sophisticated model, we chose to simplify by using a refinement of the Nash equilibrium for the one-shot game. The reason is that this provides a very precise prediction, while the dynamic analysis would probably lead to a multitude of equilibria and our prediction would still be one of them. Because the continuous time feature might actually foster cooperation, we informally address what might be a different prediction due to the continuous time feature and test empirically under which conditions the related behavior is more likely to emerge.
3.1. Investments and Payoffs for a Given Network
Ballester et al. [4] show that given the network each actor’s unique Nash investment is proportional to his Bonacich centrality for any α, β, and λ for which β > λ(n – 1). Bonacich centrality is a network centrality measure that counts all possible paths from each actor to all other actors, while path of length k have a weight wk. [27]. The weight parameter w can be chosen to fine-tune the centrality measure. The Bonacich centrality of an actor thus increases when a link is added by someone with whom the actor is connected through a path of any length. The measure reflects the feedback effects within the network: how much an actor invests does not only depend on the investments of his neighbors, but also on the investments of their neighbors, which in turn depend on the investments of their neighbors, and so on. This leads in Ballester et al.’s model to Nash investment levels that are proportional to the Bonacich centrality measure in which paths of length k are weighted by (λ/β)k: the larger the ratio λ/β the more interdependent the network is, and the more beneficial it becomes to collaborate. For regular networks, i.e., networks where each actor has the same degree η, this boils down to a Nash investment x* for every actor equal to = α/(β − ηλ). The earnings that relate to these investments are = (α2β)/(2(β −ηλ)2) − cη.
Ballester et al. [4] predict actors’ investment levels using Nash equilibrium strategies in case the network is exogenously given. Although the Nash equilibrium is an obvious solution concept, it ignores the possibility of cooperation by actors. Actors may cooperate by investing according to the socially optimal investment strategy instead of the Nash equilibrium strategy, which is attractive when the social optimum is Pareto efficient. The social optimum for a given structure is reached when actors choose investment levels such that the sum of all actors’ payoffs is highest. In regular networks, symmetry prescribes that the social optimum is reached for an investment profile in which all actors invest the same. In these networks, the socially optimal investment is = α/(β − 2ηλ), which leads to earnings equal to = α2/(2(β − 2ηλ)) − cη.
We calculated all payoffs for Nash investments and socially optimal investments for the parameter configuration used in our experiment (α = 48, β = 16, λ = 2) and all possible networks with four actors taking into account that subjects could only choose integer values for their investments. These Nash investments and socially optimal investments do not depend on the link costs. We present the results of these calculations in Table 2. Because subjects can only choose integer investments, there are multiple equilibria for some networks. We chose to display the Pareto-efficient equilibrium in Table 2, which is always unique. For some networks, there are also multiple investment combinations that are socially optimal. In that case we chose to display the most equal investment profile. Although our choices are kind of arbitrary here, note that the Pareto-optimal Nash investments are only relevant for the theoretical equilibrium analysis below and the networks related to both choice problems hardly occurred in this experiment.
When we ignore link costs (c = 0), we see in Table 2 that investments and payoffs quickly increase when there are more links in the network. These payoffs imply that actors are best off either in the empty network or in the complete network depending on the link costs. Table 2 shows also that for low link costs any addition of a link becomes beneficial if actors choose Nash investments. In the intermediate cost case, actors need to reach almost the complete network, to do better than on their own, if they choose Nash investments. If they choose socially optimal investments, a triangle would already be better than investing alone. In the high cost condition, the complete network and socially optimal investment are both necessary for all actors to do better than investing alone.
3.2. Combining Link Decisions and Investments
We use the calculations above to address the link choices that actors want to make. We start with a first hypothesis based on Ballester et al. [4] about behavior in a given network. This hypothesis states that independent of the network structure or other conditions, Nash investments will be the most common amounts invested.
Hypothesis 1. Given the network, actors are most likely to invest according to their Nash investments.
Table 2.
Pareto-optimal Nash investments (Nash) and socially efficient investments (SO) with the related payoffs for given network structures in different cost conditions.
| α = 48, β = 16 λ = 2, n = 4 | Investments | Payoffs | ||||||||||
| No cost | Low cost | Intermediate cost | High cost | |||||||||
| c = 0 | c = 10 | c = 30 | c = 50 | |||||||||
| Networks | Nash | SO | Nash | SO | Nash | SO | Nash | SO | Nash | SO | ||
| Empty |  | η = 0 | 3 | 3 | 72 | 72 | 72 | 72 | 72 | 72 | 72 | 72 |
| 2 dyads |  | η = 1 | 4 | 4 | 96 | 96 | 86 | 86 | 66 | 66 | 46 | 46 |
| 2-star |  | ηi = 0 | 3 | 3 | 72 | 72 | 72 | 72 | 72 | 72 | 72 | 72 |
| ηi = 1 | 4 | 4 | 96 | 104 | 86 | 94 | 66 | 76 | 46 | 54 | ||
| ηi = 2 | 4 | 5 | 128 | 120 | 108 | 100 | 68 | 60 | 28 | 20 | ||
| Line |  | ηi = 1 | 4 | 4 | 96 | 104 | 86 | 94 | 66 | 74 | 46 | 54 |
| ηi = 2 | 4 | 5 | 128 | 130 | 108 | 120 | 68 | 70 | 28 | 30 | ||
| Triangle |  | ηi = 0 | 3 | 3 | 72 | 72 | 72 | 72 | 72 | 72 | 72 | 72 |
| ηi = 2 | 4 | 6 | 128 | 144 | 108 | 124 | 68 | 84 | 28 | 44 | ||
| 3-star |  | ηi = 1 | 4 | 5 | 104 | 112 | 94 | 102 | 74 | 82 | 54 | 62 |
| ηi = 3 | 5 | 7 | 160 | 144 | 130 | 114 | 70 | 54 | 10 | -6 | ||
| Square |  | η = 2 | 4 | 6 | 128 | 144 | 108 | 124 | 68 | 84 | 28 | 44 |
| Stem |  | ηi = 1 | 4 | 5 | 104 | 110 | 94 | 100 | 74 | 80 | 54 | 60 |
| ηi = 2 | 4 | 6 | 144 | 156 | 124 | 136 | 84 | 96 | 44 | 56 | ||
| ηi = 3 | 5 | 7 | 160 | 182 | 130 | 152 | 70 | 92 | 10 | 32 | ||
| D-Box |  | ηi = 2 | 4 | 8 | 144 | 160 | 124 | 140 | 84 | 100 | 44 | 60 |
| ηi = 3 | 5 | 9 | 170 | 234 | 140 | 204 | 80 | 144 | 20 | 84 | ||
| Complete |  | η = 3 | 5 | 12 | 190 | 288 | 160 | 258 | 100 | 198 | 40 | 138 |
To hypothesize which networks can be expected to emerge, we extend the concept of “pairwise equilibrium” for our combination of investments and linking decision [25,26].
Definition. A strategy profile s* = (x*, h*) for the game and payoffs defined above is a pairwise equilibrium constituting a pairwise equilibrium network g if and only if
- (i)
- s* is a Nash equilibrium and
- (ii)
- Πi(, g+ij) > Πi(x*, g) implies Πj(, g+ij) < Πj(x*, g) for all i, j ϵ N where are the Nash investments for the network g+ij.
This definition limits the equilibria by excluding rather trivial coordination problems in linking decisions that are also easily solved in our experimental set-up. Thus, we only consider equilibria in which no pair of actors wants to add a link (because at least one actor receives lower payoffs in the network with the link than in the network without the link). All pairwise equilibrium configurations are indicated with bold figures in Table 2. These are the complete network for the low cost condition and the empty network for the high cost condition. For the intermediate cost condition, both the empty and the complete network are pairwise equilibria. All other configurations do not constitute equilibria as can be inferred from Table 2. Note that c = 0 is not one of the experimental conditions, but only provided as a reference. The results in Table 2 lead to the following three hypotheses:
Hypothesis 2. In the low cost condition (c = 10), actors are more likely to coordinate on the complete network than on any other network.
Hypothesis 3. In the intermediate cost condition (c = 30), actors are more likely to coordinate on the empty network or on the complete network than on any other network.
Hypothesis 4. In the high cost condition (c = 50), actors are more likely to coordinate on the empty network than on any other network.
The most difficult case to address is the intermediate cost condition. Because the subjects in the experiment start in the empty network, it is not to be taken for granted that they reach the complete network with Nash investments, because there are many situations in between in which they are worse off than in the empty network. As mentioned in the description of the computerized game, while “virtual” earnings are updated instantly on the screen, the actual payoffs are not calculated in continuous time but only at the end of the round. This means that subjects can display a great deal of costless trial-and-error in changing investments and links. Therefore, in our design, subjects are strictly speaking not worse off in intermediate networks as only the end result counts. However, since subjects do not know when a round would end, there is the threat of ending up in an intermediate network configuration in which a subject are worse off than in the empty network. We surmise that this threat of being worse off was enough to create a real coordination problem. Indeed, observing the behavior in our experiment shows that subjects are rather sensitive to the changes in their earnings (even though they are virtual) and that it was not necessarily easy to coordinate actions. If subjects plan ahead enough steps they might realize the benefits of creating the full network, but if they only do one or a few steps of thinking, they remain stuck in the empty network. However, even if subjects realize that the full network is advantageous, they still have to form beliefs about whether the other subjects do so as well. A subject who is fully aware of the benefits of the full network might not try and create the full network if he believes that the other subjects are not aware of the benefits of the full network. In other words, subjects with limited strategic sophistication will frustrate the coordination of the full network. We thus expect that if a group consists of strategically more sophisticated actors, this group is more likely to solve the coordination problem in the intermediate cost condition. In addition, actors can gain strategic sophistication over time through several learning mechanisms [28], which would make solving the coordination problem more likely [29]. In our experiment, subjects play the intermediate cost condition for multiple rounds. Subjects are likely to gain strategic sophistication as they play more rounds, which should also facilitate reaching the complete network. Moreover, half of the subjects play the intermediate cost condition after they played the low cost condition (low-to-high ordering) and the other half after they played the high cost condition (high-to-low ordering). Subjects are more likely to gain insight into the benefits of collaborating in the complete network in the low cost condition than in the high cost condition, because the complete network will emerge more often in the low cost condition. This insight might be subsequently used in the intermediate cost condition. Finally, actors with lower strategic sophistication themselves can learn from, and imitate those, who understand the situation better [29]. We compare our experimental condition in which subjects can observe the investments of others with the condition in which subjects cannot see these investments. When actors can see how much others invest, it is easier to learn from each other than when actors do not have this information. Moreover, actors can attract others to link to them by increasing their investments. Thus, coordination is more likely if subjects can observe others’ investments. The arguments above lead to the following extensions of Hypothesis 3.
Hypothesis 3a. In the intermediate cost condition, the complete network will be reached more often relative to the empty network, when the group consists of strategically more sophisticated actors.
Hypothesis 3b. In the intermediate cost condition, the complete network will be reached more often relative to the empty network, the more rounds are played.
Hypothesis 3c. In the intermediate cost condition, the complete network will be reached more often relative to the empty network, in the low-to-high ordering, as compared to the high-to-low ordering.
Hypothesis 3d. In the intermediate cost condition, the complete network will be reached more often relative to the empty network, when actors have information about the investments of others than when they do not have this information.
Linked actors face a public good type of problem, where their Nash investments can be seen as “defecting” and investing more can be interpreted as contributing to the “network good.” The maximal investment that makes sense is where the social optimum is reached. In a one-shot situation, defecting is the dominant strategy. However, subjects in the experiment play a game in which they have some time to indicate their intentions for a specific investment and observe the intentions of others. Because the experimental round ends at an unknown point in time, this resembles a repeated game setting with an unknown end. Subjects can show their intentions to cooperate by investing more than the Nash investments and if they observe that others reciprocate and invest more as well, they can continue to increase until they reach the social optimum. If partners start to decrease their investments, the focal actor can reduce own investments again or can even sever the link with an uncooperative other. Therefore, our experimental setting clearly provides opportunities for conditional cooperation even though the intentions are not actually paid. We conjecture that if one would analyze the continuous time game as a dynamic game, the socially optimal investments can also be part of an equilibrium strategy. One probably needs the assumption that actors can instantaneously react on decisions of others, which is however doubtful in the experimental setting. The mechanism described above is only likely to work if subjects can observe the investments of the others. Therefore, we expect that cooperative investments above the Nash investments are more likely if subjects are in the experimental condition in which they have information about investments of other subjects. Note that we still consider Nash investments as the baseline prediction (see Hypothesis 1), but because the experiment provides opportunities for further cooperation as well, we investigate these potential deviations of the Nash investments in more detail.
Still, for similar reasons as formulated for the coordination part of the game, we expect that not all subjects are equally able to establish cooperation based on conditional cooperation. It is not automatic for subjects to realize that jointly investing more than the Nash investments can lead to better outcomes for all. Therefore, subjects really had to anticipate themselves what the consequences of their own actions would be in combination with those of the others. It takes quite some thinking to answer questions such as: “In the complete network with everybody choosing Nash investments, might it be beneficial for two, three, or four actors, if each of them increases their investment by one point?” Since being aware of such potential is a prerequisite for establishing cooperation, we expect that strategically sophisticated actors are more likely to cooperate. In addition, if actors gain experience they might learn to establish higher payoffs by cooperating because they understand the interaction situation better. This leads to the two last hypotheses.
Hypothesis 5. The level of cooperation will be higher when subjects have information about the investments of others than when they do not have this information.
Hypothesis 6. The level of cooperation will be higher when the group consists of strategically more sophisticated actors.
Hypothesis 7. The level of cooperation will be higher the more rounds are played.
4. Experimental Design
4.1. Data Collection
In total 12 experimental sessions were conducted in December 2008 at the ELSE laboratory of Utrecht University. A total of 1420 subjects from a self-selected database were invited to participate in a study called “Investing in networks” using the Online Recruitment System for Economic Experiments (ORSEE) [30]. Subjects were told that earnings would be around €16, but that exact earnings depended on their own and others’ decisions. A total of 212 subjects participated in the experiment. During one session there was a network break down. The 12 subjects participating in this session were not able to finish playing all rounds and could not fill in the questionnaire at the end. Nevertheless, the rounds that they did play will be used in the analyses if possible. The other sessions consisted either of 16 subjects (in five sessions) or 20 subjects (in six sessions). The majority of subjects were students at Utrecht University from a wide range of disciplines and nationalities, although non‑students also participated. The age of the 200 subjects who completed the experiment was between 17 and 39 years old (with a mean age of 21.7), of which 68% were female and 77% were Dutch.
4.2. Procedure
Upon entering the laboratory subjects were randomly assigned to a cubicle. After a short oral introduction (mentioning practicalities) the subjects received printed instructions in the language of their choice (English or Dutch). These instructions explained that subjects could ask questions at any time and that 150 points in the experiment equaled a €1 payment. The instructions explained how the game and how the choices of subjects in the game influenced their earnings (the English version of the instructions is available in the electronic supplementary information). After reading the instructions, subjects chose on their computer screen to continue in English or in Dutch, which triggered the start of the actual game. Although this hardly occurred, subjects could direct questions to the experiment leader if they did not understand something at any time.
After playing the network games, there was an additional task—a “Beauty Contest” [31]—in which subjects were asked to enter a number between 0 and 100. The subjects were explained that the person entering the number closest to half of the average of all numbers entered would win this contest and receive an additional € 5. The Beauty Contest is a game typically used to measure subjects’ strategic sophistication [32]. Finally, subjects were asked to complete a standard questionnaire covering background information after which they received their monetary earnings. This whole procedure lasted around 1.75 hours and earnings resulting from playing all rounds of the game ranged from € 11.50 to € 20, with mean earnings being € 17.19 (this excludes the additional earnings of the Beauty Contest winner). The 12 subjects that did not complete the experiment were paid the expected average of € 16 each.
5. Descriptive Results
Table 3 shows the number of times that a group of subjects established a particular network at the moment that a round was finished in the different conditions of the experiment. We see that groups mostly created either the empty or the complete network, and not so much of the other possible structures in between. We may conclude that subjects are most likely to coordinate on the complete network in the low cost condition (Hypothesis 2), on the empty or the complete network in the intermediate cost condition (Hypothesis 3), and on the empty network in the high cost condition (Hypothesis 4). Although these patterns are so clear‑cut that there is little added value in additional significance tests, we confirm them below in a statistical analysis.
| c = 10 | c = 30 | c = 50 | All link costs | ||||||||||||||||||||||||
| Network | Info | No info | Total | Info | No info | Total | Info | No info | Total | Info | No info | Total | |||||||||||||||
| Empty | | 0 | 0 | 0 | 46 | 49 | 95 | 195 | 192 | 387 | 241 | 241 | 482 | ||||||||||||||
| Dyad |  | 0 | 0 | 0 | 9 | 12 | 21 | 10 | 13 | 23 | 19 | 25 | 44 | ||||||||||||||
| 2 dyads | | 0 | 0 | 0 | 0 | 0 | 0 | 0 | 1 | 1 | 0 | 1 | 1 | ||||||||||||||
| 2-star | | 0 | 0 | 0 | 4 | 5 | 9 | 1 | 1 | 2 | 5 | 6 | 11 | ||||||||||||||
| Line | | 0 | 0 | 0 | 0 | 1 | 1 | 0 | 1 | 1 | 0 | 2 | 2 | ||||||||||||||
| Triangle | | 1 | 0 | 1 | 5 | 7 | 12 | 1 | 3 | 4 | 7 | 10 | 17 | ||||||||||||||
| 3-star | | 0 | 0 | 0 | 1 | 0 | 1 | 0 | 0 | 0 | 1 | 0 | 1 | ||||||||||||||
| Square | | 0 | 0 | 0 | 0 | 0 | 0 | 0 | 0 | 0 | 0 | 0 | 0 | ||||||||||||||
| Stem | | 4 | 3 | 7 | 8 | 4 | 12 | 0 | 0 | 0 | 12 | 7 | 19 | ||||||||||||||
| D-Box | | 8 | 5 | 13 | 21 | 16 | 37 | 0 | 0 | 0 | 29 | 21 | 50 | ||||||||||||||
| Complete | | 199 | 192 | 391 | 118 | 115 | 233 | 5 | 1 | 6 | 322 | 308 | 630 | ||||||||||||||
| Total | 212 | 200 | 412 | 212 | 209 | 421 | 212 | 212 | 424 | 636 | 621 | 1,257 | |||||||||||||||
Table 4 contains information about the observed investment profiles of the groups given the network they created. Since other networks than the empty and the complete network are observed so rarely, we decided to collapse them into one category “Other.” We distinguish between groups where subjects implement Nash investments (Nash), groups where subjects cooperate (Coop), and a rest category for all other investment profiles (Rest).
It is rather stringent to require that all four subjects in a group invest exactly according to the Nash investments in order to classify the group as Nash. It is not unreasonable to allow for the possibility that subjects intend to invest according to the Nash investments but make a small mistake (for example, because they are caught out by the time limit). With this in mind we also qualify a group as Nash if at most one subject in the group deviates at most one point from the Nash investment level.
We define cooperation to take place when at least two subjects who are linked invest more than the Nash investments and both benefit from investing more. We believe it is central to cooperation that both subjects become better off because they invest more than the Nash investments. Therefore, we exclude those cases where two linked subjects invest more than the Nash investments, but they are not both better off (e.g., because at least one of them invests too much or they are linked to a third actor who exploits them). Also, we exclude cases where the increase in payoffs of both subjects is not due to their own increase in investment, but because they are linked to a third actor with an extremely high investment level. Such a third actor “sponsors” the pair of subjects by sacrificing own payoffs. To exclude such cases, we require that the sum of the payoffs of the two cooperating subjects and all their neighbors must be at least as high as would be the case if all those subjects chose Nash investments.
| c = 10 | c = 30 | c = 50 | All link costs | |||||||||||||||||||
| Network | Invest. | Info | No Info | Total | Info | No Info | Total | Info | No info | Total | Info | No Info | Total | |||||||||
| Empty | Nash | 0 | 0 | 0 | 43 | 46 | 89 | 191 | 185 | 376 | 234 | 231 | 465 | |||||||||
| Coop | - | - | - | - | - | - | - | - | - | - | - | - | ||||||||||
| Rest | 0 | 0 | 0 | 3 | 3 | 6 | 4 | 7 | 11 | 7 | 10 | 17 | ||||||||||
| Total | 0 | 0 | 0 | 46 | 49 | 95 | 195 | 192 | 387 | 241 | 241 | 482 | ||||||||||
| Other | Nash | 3 | 2 | 5 | 26 | 33 | 59 | 5 | 8 | 13 | 34 | 43 | 77 | |||||||||
| Coop | 2 | 0 | 2 | 12 | 1 | 13 | 1 | 0 | 1 | 15 | 1 | 16 | ||||||||||
| Rest | 8 | 6 | 14 | 10 | 11 | 21 | 6 | 11 | 17 | 24 | 28 | 52 | ||||||||||
| Total | 13 | 8 | 21 | 48 | 45 | 93 | 12 | 19 | 31 | 73 | 72 | 145 | ||||||||||
| Complete | Nash | 136 | 149 | 285 | 81 | 89 | 170 | 0 | 0 | 0 | 217 | 238 | 455 | |||||||||
| Coop | 33 | 8 | 41 | 22 | 11 | 33 | 5 | 0 | 5 | 60 | 19 | 79 | ||||||||||
| Rest | 30 | 35 | 65 | 15 | 15 | 30 | 0 | 1 | 1 | 45 | 51 | 96 | ||||||||||
| Total | 199 | 192 | 391 | 118 | 115 | 233 | 5 | 1 | 6 | 322 | 308 | 630 | ||||||||||
| Total | Nash | 139 | 151 | 290 | 150 | 168 | 318 | 196 | 193 | 389 | 485 | 512 | 997 | |||||||||
| Coop | 35 | 8 | 43 | 34 | 12 | 46 | 6 | 0 | 6 | 75 | 20 | 95 | ||||||||||
| Rest | 38 | 41 | 79 | 28 | 29 | 57 | 10 | 19 | 29 | 76 | 89 | 165 | ||||||||||
| Total | 212 | 200 | 412 | 212 | 209 | 421 | 212 | 212 | 424 | 636 | 621 | 1,257 | ||||||||||
Table 4 shows that, in line with Hypothesis 1, groups invested extremely often Nash: in 997 or 79% of the 1,257 cases; especially in the empty network many groups invested Nash (465 of 482, 96%), followed by the complete network (455 of 630, 72%), and the other networks (77 of 145, 53%). Later we test whether these differences are a reason to reject the expectation that it should not matter which network is created for Nash investments to be chosen. Using the stricter definition for the Nash investments in which all four subjects should choose exactly the Nash investments, still 786 of the 997 networks would have been classified as Nash. We performed our analyses also using this strict definition. This does not lead to qualitatively different conclusions.
Cooperation takes place only on a moderate scale: only 95 times out of 1,257 cases (8%). We see these cases as attempts to reach the socially optimal investment levels. The exact socially efficient network configuration (the complete network where everybody invests 12 as indicated in Table 1) was realized by just one group. Cooperation occurs by far most in the complete network where the possible gains of cooperation are also largest (79 times versus 16 in other networks). Conditional on the network that was created, cooperation succeeds almost equally often in the complete network (13%) and in the other networks (11%). Cooperation is not possible by design in the empty network and some other networks as explained above. Groups created a network in which cooperation is possible 718 times. The 95 successful cases imply that groups were able to materialize this potential 13% of the time. In line with Hypothesis 5, cooperation was realized more often in the information condition (75 times) than in the no information condition (20 times). Below we analyze in more detail which factors promoted cooperation.
6. Analyses
6.1. Analysis Strategy
We test our hypotheses using a conditional logit model. This model is appropriate when dealing with a dependent variable with nominal outcome categories and resembles McFadden’s discrete choice model [33,34]. In our case, the outcomes that a group of subjects can realize at the end of a round are, for example, “the empty network where everybody invests Nash,” or “the complete network where cooperation takes place”. The coefficients in the analysis should be interpreted almost the same as coefficients in a logistic regression analysis with the only difference that they need to be evaluated relative to the reference category. If we, for example, find a positive effect of the variable Nash, this implies that the Nash investments are more likely to result at the end of the round than the outcome used as the reference category, which in this case might be any other investment profile. The network structure is another example of a characteristic of the outcomes. The coefficient of an interaction such as Nash × Complete represents how the likelihood that a Nash investment profile is established differs between the complete network and the network belonging to the reference category. Note that the outcome characteristics become independent variables in the respective analyses in the sense that, e.g., whether an outcome contains Nash investments as a characteristic might make this outcome more likely to occur. Group characteristics, such as the link cost condition, how many rounds the subjects in a group have played, or how strategically sophisticated the group is, are also independent variables, but their main effects are not identified. The reason is that for a particular group in a given condition these variables do not vary and, thus cannot determine which outcome this group, in this condition, reaches. However, we can test interaction effects of outcome characteristics with conditions and group characteristics to determine whether specific outcomes are more or less likely in specific conditions or for specific groups. As an example, the interaction Nash × Round indicates how the likelihood that a group establishes a Nash investment profile changes with the number of the Round this group is in. A positive effect indicates that Nash investment profiles are more likely in later rounds. If these interactions are included, the reference category becomes also more specific. The main effect of Nash if the interaction with Round is included represents the likelihood of a Nash investment profile in a round zero relative to the likelihood of another investment profile in round zero.
Letting all subjects play in all conditions has important advantages. First, it provides the possibility to study effects of experience on actors’ behavior. Second, it makes within-subject comparisons of behavior in different conditions possible. Third, it reduces the number of subjects needed for comparing different conditions rather than a purely between-subjects design. This last point is especially important for studying groups and networks of subjects because a between-subjects design would really require an infeasible amount of subjects. One disadvantage of our design is that we need to use more sophisticated statistical techniques, but the current availability of these techniques in standard statistical packages reduces this problem.
The standard conditional logit model assumes that observations for each group are independent, which is not the case in our data. Groups are not independent because the same subjects are involved in multiple groups. Because each group has four members, this creates a complicated non-hierarchical nesting structure of group-level observations. Within the conditional logit model, it is possible to control for this non-hierarchical structure by using robust standard errors adapted for multi-way clustering [35].
In principle, our outcome set could consist of all strategy profiles (i.e., all possible networks multiplied by all possible investment profiles). However, we collapse many of these different outcomes into one category as we did in the description of the experimental results. First, we test Hypotheses 1 through 4 using a set of six outcomes: (empty network with Nash investment profile; empty network with another investment profile; complete network with Nash investment profile; complete network with another investment profile; another network with Nash investment profile; another network with another investment profile). Second, we test Hypotheses 5 through 7 using three outcome categories: (Nash investment profile, cooperative investment profile, another investment profile). The first set is tailored to test hypotheses mostly concerned with the network structure of the outcomes, and the second set to test hypotheses focusing on investments, in particular cooperation.
As a measure of strategic sophistication of subjects, we looked at how well subjects performed in the Beauty Contest [31,32]. The subjects were ranked according to how close they got to the winning number, with the winner ranked 1, the second closest ranked 2, and so forth, which implies that strategic sophistication includes how well a subject is able to anticipate decisions of others. This score was divided by the total number of contestants. This gives a score of between 0 and 1. We subtracted this score from 1 to ensure that higher scores mean more strategic sophistication. The average score of the four group members was taken to measure the strategic sophistication of a group as a whole, which is represented by the variable “Sophistication” in the tables below. The value of this variable ranged from .088 to .828 with a mean of .473. To construct interactions with Sophistication we centered the variable at its mean, such that the reference category if interactions with Sophistication are included represents groups with a mean level of Sophistication. We coded “the number of rounds played” to start at 0 rather than 1, so that the first round formed the reference category. In the analyses in Table 6 below we count the number of paid rounds played so far in the intermediate cost condition, while in Table 7 we use the number of paid rounds played so far in the whole experiment.
6.2. Results
As predicted in Hypothesis 1, groups are more likely to choose Nash investments than all other possible investment levels as the positive and significant coefficient for Nash investments in Model 0 of Table 5 shows. In Model 1, the coefficient for Nash indicates whether Nash in the empty network is a more likely outcome than other investments in the empty network. The positive and significant effect indicates that indeed Nash investments are more likely for the empty network than other investments. The interaction effect Nash × Complete indicates the extent to which the likelihood that the Nash investment profile occurs differs between the empty and the complete network. We anticipated that the type of network created would not be related to whether a group invests Nash or something else. However, as the coefficient of Nash × Complete in Model 1 in Table 5 shows, the likelihood of a Nash investment profile is significantly lower in the complete network than in the empty network. Also in other networks, Nash investments are less likely than in the empty network. In turn, the Nash investments are less likely in other networks than in the complete network as follows from an additional test for the difference between these two coefficients (b = –3.185 – (–2.353) = –.831, S.E. = .189, p < .001, Wald test). In the empty network, subjects can optimize their investment level independent of what the others do. Therefore, it is understandable that subjects succeed more often in setting their optimal investment level in the empty network than in all other networks, where subjects have to coordinate their actions with those of the others. Moreover, in the complete network, and many of the other networks, there exists the possibility to cooperate: subjects may thus intentionally try to coordinate their actions away from the Nash investments.
In Model 2, we test whether the occurrence of a specific network and Nash investments differs per cost condition. These interactions of the different network outcomes with the cost condition uphold our earlier confirmation of Hypotheses 2 through 4, based on the descriptive results that the higher the link costs the less often a group creates the complete network compared to the empty network. The positive coefficient Complete × costs = 10 indicates that the complete network occurs more often in the low cost condition than in the intermediate cost condition, while the negative coefficient of Complete × costs = 50 shows that the complete network is less likely in the high cost condition than in the intermediate cost condition. We also see that there are no compelling reasons to believe that Nash investments occur more often in the low cost condition (Nash × costs = 10 is not significant) or the high cost condition (Nash × costs = 50 is not significant) than in the intermediate cost condition.
Table 5.
Conditional logit model for the likelihood of Nash investments and different networks with robust standard errors corrected for multiple group memberships.
| Model 0a | Model 1b | Model 2c | ||||||||||||||||||||||||||||||
| Coeff. | S.E. | p | Coeff. | S.E. | p | Coeff. | S.E. | p | ||||||||||||||||||||||||
| Nash investment | 1.344 | .117 | .000 | 3.309 | .311 | .000 | 3.785 | .516 | .000 | |||||||||||||||||||||||
| Complete network | 2.332 | .338 | .000 | 3.357 | .666 | .000 | ||||||||||||||||||||||||||
| Other network | 1.386 | .298 | .000 | 2.951 | .564 | .000 | ||||||||||||||||||||||||||
| Nash × Complete | –2.353 | .343 | .000 | –2.738 | .545 | .000 | ||||||||||||||||||||||||||
| Nash × Other | –3.185 | .375 | .000 | –3.519 | .533 | .000 | ||||||||||||||||||||||||||
| Complete × costs = 10 | 18.525 | .693 | .000 | |||||||||||||||||||||||||||||
| Other × costs = 10 | 16.495 | .738 | .000 | |||||||||||||||||||||||||||||
| Complete × costs = 50 | –5.228 | .592 | .000 | |||||||||||||||||||||||||||||
| Other × costs = 50 | –2.772 | .400 | .000 | |||||||||||||||||||||||||||||
| Nash × costs = 10 | –.137 | .141 | .332 | |||||||||||||||||||||||||||||
| Nash × costs = 50 | –.567 | .496 | .253 | |||||||||||||||||||||||||||||
| Number of groups | 1,257 | 1,257 | ||||||||||||||||||||||||||||||
| Log Likelihood | –1,756 | –1,189 | ||||||||||||||||||||||||||||||
a Reference category is non-Nash investmentsb Reference category is non-Nash investments in the empty networkc Reference category is non-Nash investments in the empty network for intermediate link costs = 30
Table 6 presents the models used to test the explanations as to why some groups solve the coordination problem in the intermediate cost condition (i.e., create the complete network) and others do not (i.e., create the empty network). Table 6 shows that the complete network is significantly more often created than the empty network in the intermediate cost condition (Complete in Model 3). If we add the strategic sophistication of groups, the number of rounds played in the intermediate cost condition, the ordering of cost conditions, and whether information about others’ investments and payoffs was available, we see that we can refine this conclusion. In line with Hypothesis 3a, the more strategically sophisticated groups are, the better able they are to reach the complete network (Complete × Sophistication in Model 4); although this effect is only significant at the 10% level for a two-sided test. Groups create the complete network more often when they have played more rounds (Complete × Round). This supports the idea that as subjects gain experience with the coordination problem, they are better able to solve it (Hypothesis 3b). However, groups are not significantly more likely to create the complete network if they start in the low cost condition as opposed to the high cost condition (Complete × Low/High). This finding contradicts our expectation that if subjects start in the low cost condition, they have easier opportunities to learn that they can profit from coordinating on the complete network (Hypothesis 3c). Finally, we do not find evidence for Hypothesis 3d that having information about others’ investments increases the ability of groups to solve the coordination problem (Complete × Info).
Table 6.
Conditional logit model for the likelihood of reaching a network structure in the intermediate cost condition (c = 30) with robust standard errors corrected for multiple group memberships.
| Model 3a | Model 4b | |||||||
| Coeff. | S.E. | p | Coeff. | S.E. | p | |||
| Complete network | .879 | .285 | .002 | –.464 | .627 | .459 | ||
| Other network | –.114 | .243 | .639 | –.544 | .388 | .162 | ||
| Complete × Sophistication (0–1) | 2.236 | 1.298 | .085 | |||||
| Other × Sophistication (0–1) | 2.191 | 1.480 | .139 | |||||
| Complete × Round (0–7) | .301 | .098 | .002 | |||||
| Other × Round (0–7) | .057 | .082 | .483 | |||||
| Complete × Low/High | .678 | .634 | .284 | |||||
| Other × Low/High | .510 | .503 | .311 | |||||
| Complete × Information | .051 | .395 | .897 | |||||
| Other × Information | .109 | .224 | .625 | |||||
| Number of groups | 400 | 400 | ||||||
| Log Likelihood | –673 | –649 | ||||||
a Reference category is the empty networkb Reference category is the empty network for groups with Sophistication at its mean value in the first round, who start with the high cost condition and are in the no information condition.
In Table 7, the results are presented to test the hypotheses related to the emergence of cooperation (Hypotheses 5 through 7). Table 7 shows that cooperative investments are less often observed than Nash investments in all cost conditions (see Model 5). For the low cost condition and the intermediate cost condition, the level of cooperation is comparable (Cooperation × costs = 10), but it is much lower in the high cost condition (Cooperation × costs = 50), which we also saw in the descriptives in Table 4. Additionally, we see that all other investment profiles also occur less often than the Nash investments (Rest, Rest × costs = 10, Rest × costs = 50).
We find support for Hypothesis 5 that cooperation is more easily achieved when subjects have information about what the others in their group invest than when subjects cannot directly monitor others’ investing behavior (Cooperation × Information in Model 6). Although the effect of strategic sophistication is in the expected direction, we do not find that strategic sophistication helps to reach cooperation (the coefficient of Cooperation × Sophistication is not significant). As subjects play more rounds, they more often succeed to cooperate, as predicted by Hypothesis 7 (Cooperation × Round).
Table 7.
Conditional logit model for the likelihood of an investment profile with robust standard errors corrected for multiple group memberships.
| Model 5a | Model 6b | |||||||
| Coeff. | S.E. | p | Coeff. | S.E. | p | |||
| Cooperation | –1.904 | .222 | .000 | –3.620 | .586 | .000 | ||
| Rest | –1.740 | .170 | .000 | –1.321 | .223 | .000 | ||
| Cooperation × costs = 10 | .027 | .196 | .892 | –.003 | .221 | .990 | ||
| Rest × costs = 10 | .433 | .192 | .024 | .421 | .184 | .022 | ||
| Cooperation × costs = 50 | –2.221 | .641 | .001 | –2.309 | .621 | .000 | ||
| Rest × costs = 50 | –1.041 | .366 | .004 | –1.038 | .363 | .004 | ||
| Cooperation × Information | 1.389 | .299 | .000 | |||||
| Rest × Information | –.086 | .205 | .675 | |||||
| Cooperation × Sophistication (0–1) | 1.853 | 1.316 | .159 | |||||
| Rest × Sophistication (0–1) | .147 | .887 | .868 | |||||
| Cooperation × Round (0–23) | .064 | .029 | .028 | |||||
| Rest × Round (0–23) | –.035 | .020 | .072 | |||||
| Number of groups | 1,200 | 1,200 | ||||||
| Log Likelihood | –730 | –697 | ||||||
a Reference category is Nash investment profile at link costs = 30b Reference category is Nash investment profile at link costs = 30 for groups with Sophistication at its mean value in the first round and in the no information condition
7. Conclusion and Discussion
The puzzle as to why and how people form and sever relations, why they sometimes reach a successful collaboration and why they sometimes fail, has occupied many thinkers since Hobbes [7]. In this paper, we looked at a small piece of this puzzle by studying the coordination and cooperation problems that hinder actors in successfully creating collaborative relations to jointly produce—what we have labeled—a network good with complementarities. As opposed to everybody investing individually, all actors benefit by forming links and adjusting investment levels upwards because a network good with complementarities has the characteristic that investments become more beneficial when an investor is linked to others who also invest. However, coordination problems may restrain a group of actors from successfully creating the structure of collaborative relations, while cooperation problems may lead to underinvestment, both resulting in a suboptimal production of the good. We extended a model by Ballester et al. [4] with the option to create and sever links in order to analyze which networks and investment levels groups of actors are likely to choose depending on the level of the link costs and the information availability about others’ investments. We tested the predictions using a computerized laboratory experiment.
Regarding the emerging networks, we found—in support of our expectations based on a pairwise equilibrium concept—that subjects either created the empty or the complete network (and rarely any structure in between). Also as expected, the higher the link costs the more often the empty network and the less often the complete network was created. Since there are hardly any coordination problems to be solved if link costs are low, groups almost always created the complete network. In the intermediate cost condition, groups sometimes solved the coordination problems and reached the complete network, and sometimes they did not which resulted in the empty network. Because in the high cost condition, the complete network only becomes more profitable than the empty network when the cooperation problems are solved in conjunction with the coordination problems, this proved to be too difficult for almost all groups. This therefore resulted mostly in empty networks with all subjects investing individually in the high cost condition.
In order to solve the coordination problem, actors need to look ahead far enough and correctly anticipate the actions of the others in their group. Indeed, we found that groups solved the coordination problem more frequently the more rounds they played. Experience apparently helps to discover how to reach a better equilibrium. However, we only found weak support that strategically more sophisticated groups of subjects solved the coordination problem more often and we did not find that strategic sophistication fostered cooperation. Maybe measuring sophistication by letting subjects play the Beauty Contest game only once does not provide an accurate measurement. Subjects might accidentally choose the right number so the measurement provides no evidence that subjects change their behavior when they receive information about the behavior of others. One should let subjects play the game more often to obtain information on such adaptive thinking. Coordination does not seem to be facilitated if subjects can see how much others invest. This finding can be explained by realizing that subjects can immediately observe when they create a link whether their own earnings increase, even if they do not know how much the other subjects invest. Apparently, not having the information on others’ investments does not deter creating links.
Regarding investments, we found, in accordance with predictions of Ballester et al. [4], that groups of subjects mostly—almost 80% of the time—chose Nash investments given the network they created. This implies that a subject’s Bonacich centrality is a good predictor for how much this subject invests in our experiment. It also implies suboptimal production of the network good. If all subjects would collaborate and invest more than the Nash investments, everybody could be better off especially in the complete network. In our experiment, subjects had great trouble in solving this cooperation problem. However, not solving the cooperation problem is less severe under some conditions. If subjects had information about how much the others in their group invested, cooperation was more often successful. This is understandable because observing others’ investments facilitates conditional cooperation. There may also be another mechanism at work: some actors may simply not realize that they are underinvesting because they do not recognize the possibility to earn more collectively. These actors can learn from, and imitate, those who are aware of the possibilities of cooperation, but of course only if information about others’ investments is available to them. This last view was supported by our findings that cooperation was more often successful when subjects in a group had played the game for more rounds.
We additionally found that the level of cooperation was much higher in the low and intermediate cost condition than in the high cost condition. We can explain this as follows: For successful cooperation, subjects do not only have to increase investments together, they also have to create a structure in which cooperation is possible. The potential benefits of cooperation are highest in the complete network. In the low and intermediate cost condition, the complete network is already more profitable than the empty network when everybody chooses Nash investments. Therefore, it is safe for subjects to first create the complete network and then apply Nash investments. From there on they can try to increase investments together. In the high cost condition, the complete network cannot perform this role of being a “stepping stone,” because subjects are better off investing alone if everybody chooses Nash investments. Therefore, in the high cost condition, some subjects already break off the links before cooperation can start to develop. Of course cooperation could also have been facilitated by subjects with non-selfish preferences. Because cooperative behavior was not so common in the experiment, and including non-standard utility assumptions in the theory would have made the theory much more complex, we refrained from further elaborating that line of reasoning.
What do the findings mean, for example, for companies that want to start R&D collaborations? The good news is that, as long as the costs of starting R&D relations are not too high, it seems that the companies sooner or later are likely to realize their common interest and create an R&D platform. The bad news is that it may be very difficult to reach the full potential of an established collaboration because of free-rider problems. If the companies truly want an innovative product, they would be wise to design their collaboration in such a way that it is transparent how many resources each devotes to the joint venture.
Of course, one should be careful to draw too extensive implications from the findings of this small and abstract laboratory study. First, companies would be able to communicate with each other about the details of collaboration, while the subjects in our experiment could not. Since it seems that the failure to solve the coordination and cooperation problems is partly due to lack of insight by some of the subjects, communication between subjects could spread insight quicker through the population. It would be interesting to see whether the possibility to send each other text messages could increase the level of network good production in the experiment. Second, the benefits of collaboration increase rapidly with each new collaborative partner in our model. Therefore, the complete network is extremely beneficial and often the predicted and observed outcome. However, this does not mean that we expect that all companies in any particular industry are better off if they all work together. On the contrary, we expect that decreasing marginal returns related to the number of collaborative partners puts a limit on the optimal number of partners; this is an especially relevant factor to be taken into account when networks become larger. Future research on real-world networks might shed more light on whether the mechanisms that we discovered in this paper work in larger networks or networks with more communication possibilities as well.
Acknowledgements
We thank Jeroen Weesie, Ineke Maas, participants in the SaSR program at Utrecht University, and two anonymous reviewers for their useful comments and suggestions. This article is part of the Utrecht University High Potential-Program of Vincent Buskens and Stephanie Rosenkranz “Dynamics of Cooperation, Networks, and Institutions.”
References
- Olson, M. The Logic of Collective Action; Harvard University Press: Cambridge, MA, USA, 1971. [Google Scholar]
- Taylor, M. The Possibility of Cooperation; Cambridge University Press: Cambridge, MA, USA, 1987. [Google Scholar]
- Bramoullé, Y.; Kranton, R. Public goods in networks. J. Econ. Theory 2007, 135, 478–494. [Google Scholar]
- Ballester, C.; Calvó-Armengol, A.; Zenou, Y. Who’s who in networks? Wanted: The key player. Econometrica 2006, 74, 1403–1417. [Google Scholar]
- Hardin, R. Collective Action; Johns Hopkins University Press: Baltimore, MD, USA, 1982. [Google Scholar]
- Heckathorn, D.D. Dynamics and dilemmas of collective action. Am. Sociol. Rev. 1996, 61, 250–277. [Google Scholar]
- Coleman, J.S. Foundations of Social Theory; Belknap Press of Harvard University Press: Cambridge, MA, USA, 1990. [Google Scholar]
- Raub, W.; Weesie, J. Reputation and efficiency in social interactions: An example of network effects. Am. J. Sociol. 1990, 96, 626–654. [Google Scholar]
- Gould, R.V. Collective action and network structure. Am. Sociol. Rev. 1993, 58, 182–196. [Google Scholar]
- Marwell, G.; Oliver, P. The Critical Mass in Collective Action: A Micro-Social Theory; Cambridge University Press: New York, NY, USA, 1993. [Google Scholar]
- Flache, A. The Double Edge of Networks; Thesis Publishers: Amsterdam, The Netherlands, 1996. [Google Scholar]
- Chwe, M.S. Structure and strategy in collective action. Am. J. Sociol. 1999, 105, 128–156. [Google Scholar]
- Jackson, M.O.; Watts, A. On the formation of interaction networks in social coordination games. Games Econ. Behav. 2002, 41, 265–291. [Google Scholar]
- Eguíluz, V.M.; Zimmerman, M.G.; Cela-Conde, C.J.; San Miguel, M. Cooperation and the emergence of role differentiation in the dynamics of social networks. Am. J. Sociol. 2005, 110, 977–1008. [Google Scholar]
- Goyal, S.; Vega-Redondo, F. Network formation and social coordination. Games Econ. Behav. 2005, 50, 178–207. [Google Scholar]
- Ule, A. Exclusion and cooperation in networks. Ph.D Thesis, Tinbergen Institute, Rotterdam, The Netherlands, 2005. [Google Scholar]
- Berninghaus, S.K.; Vogt, B. Network formation in symmetric 2 × 2 games. Homo Oeconomicus 2006, 23, 421–466. [Google Scholar]
- Takács, K.; Janky, B. Smiling contributions: Social control in a public goods game with network decline. Physica A 2007, 378, 76–82. [Google Scholar]
- Buskens, V.; Corten, R.; Weesie, J. Consent or conflict: Coevolution of coordination and networks. J. Peace Res. 2008, 45, 205–222. [Google Scholar]
- Corten, R.; Buskens, V. Co-evolution of conventions and networks: An experimental study. Soc. Networks 2010, 32, 4–15. [Google Scholar]
- Galeotti, A.; Goyal, S. The law of the few. Am. Econ. Rev. 2010. (Forthcoming). [Google Scholar]
- Fischbacher, U. z-Tree: Zurich toolbox for ready-made economic experiments. Exp. Econ. 2007, 10, 171–178. [Google Scholar]
- Berninghaus, S.K.; Ehrhart, K.-M.; Ott, M. Myopically Forward-Looking Agents in a Network Formation Game: Theory and Experimental Evidence; SFB 504 Discussion Paper Series No. 08–02; 2008; University of Mannheim: Mannheim, Germany. [Google Scholar]
- Berninghaus, S.K.; Ehrhart, K.-M.; Ott, M. A network experiment in continuous time: The influence of link costs. Exp. Econ. 2006, 9, 237–251. [Google Scholar]
- Calvo-Armengol, A. Job contact networks. J. Econ. Theory 2004, 115, 191–206. [Google Scholar]
- Goyal, S.; Joshi, S. Unequal connections. Int. J. Game Theory 2006, 34, 319–349. [Google Scholar]
- Bonacich, P. Power and centrality: A family of measures. Am. J. Sociol. 1987, 92, 1170–1182. [Google Scholar]
- Selten, R. Evolution, learning, and economic behavior. Games Econ. Behav. 1991, 3, 3–24. [Google Scholar]
- Camerer, C.F.; Ho, T.-H.; Chong, J.-K. Sophisticated experience-weighted attraction learning and strategic teaching in repeated games. J. Econ. Theory 2002, 104, 137–188. [Google Scholar]
- Greiner, B. The Online Recruitment System ORSEE 2.0: A Guide for the Organization of Experiments in Economics. Working Paper Series in Economics 10; University of Cologne: Cologne, Germany, 2004. [Google Scholar]
- Nagel, R. A review of beauty contest games. In Games and Human Behavior: Essays in Honor of Amnon Rapoport; Budescu, D., Erev, I., Zwick, R., Eds.; Erlbaum: Hillsdale, NJ, USA, 1999; pp. 391–410. [Google Scholar]
- Camerer, C.F.; Ho, T.-H.; Chong, J.-K. A cognitive hierarchy model of games. Q. J. Econ. 2004, 119, 861–898. [Google Scholar]
- McFadden, D. Conditional logit analysis of qualitative choice behavior. In Frontiers in Econometrics; Zarembka, P., Ed.; Academic Press: New York, NY, USA, 1973; pp. 105–142. [Google Scholar]
- Scott Long, J. Regression Models for Categorical and Limited Dependent Variables; Sage Publications: Thousand Oaks, CA, USA, 1997. [Google Scholar]
- Cameron, A.C.; Gelbach, J.B.; Miller, D.L. Robust Inference with Multi-Way Clustering; Working paper; University of California: Davis, CA, USA.
© 2010 by the authors; licensee MDPI, Basel, Switzerland. This article is an open access article distributed under the terms and conditions of the Creative Commons Attribution license (http://creativecommons.org/licenses/by/3.0/).
Share and Cite
MDPI and ACS Style
Knigge, A.; Buskens, V. Coordination and Cooperation Problems in Network Good Production. Games 2010, 1, 357-380. https://doi.org/10.3390/g1040357
AMA Style
Knigge A, Buskens V. Coordination and Cooperation Problems in Network Good Production. Games. 2010; 1(4):357-380. https://doi.org/10.3390/g1040357
Chicago/Turabian StyleKnigge, Antonie, and Vincent Buskens. 2010. "Coordination and Cooperation Problems in Network Good Production" Games 1, no. 4: 357-380. https://doi.org/10.3390/g1040357