Theory of Mind and General Intelligence in Dictator and Ultimatum Games

1
School of Life Sciences Weihenstephan, Technische Universität München, Alte Akademie 12, 85354 Freising, Germany
2
Department of Economics, 1601 University Avenue, Morgantown, WV 26506, USA
3
RAND Corporation, 4570 Fifth Ave #600, Pittsburgh, PA 15213, USA
*
Author to whom correspondence should be addressed.
Games 2018, 9(2), 16; https://doi.org/10.3390/g9020016
Submission received: 5 March 2018
/
Revised: 27 March 2018
/
Accepted: 28 March 2018
/
Published: 30 March 2018
(This article belongs to the Special Issue Dictator Games)
Abstract
:Decreasing social sensitivity (i.e., the ability of a person to perceive, understand, and respect the feelings and viewpoints of others), has been shown to facilitate selfish behavior. This is not only true for exogenous changes in social sensitivity, but also for social sensitivity influenced by someone’s social cognition. In this analysis, we examined one measure of social cognition, namely a person’s Theory of Mind (ToM), to examine differences in decision-making in standard non-strategic and strategic environments (dictator and ultimatum games). We found that participants with higher ToM gave a greater share in the non-strategic environment. In the ultimatum game, however, ToM showed no correlation with the offers of the ultimators. Instead, we found that general intelligence scores—measured by the Wonderlic test—shared a negative, albeit weak, correlation with the amount offered in the ultimatum game. Thus, we find that lower social cognition is an important explanatory variable for selfish behavior in a non-strategic environment, while general intelligence shares some correlation in a strategic environment. Similar to the change in social sensitivity created by a specific game design, social sensitivity influenced by individual personality traits can influence behavior in non-strategic environments.
1. Introduction
Prosocial behavior can be observed in environments where no direct financial or social benefit exists. Despite not immediately benefitting the individual, prosocial and altruistic behavior can strengthen one’s group and yield long run payoffs through the increased security offered by the group [1]. It is astonishing then that humans will also show prosocial and altruistic behavior towards unrelated individuals [2]. Investigations into this type of behavior have shown that it is possible to manipulate individuals into more (or less) cooperative behavior by reducing the opportunities to free-ride [3,4,5,6] or changing the rules of the experiment [7]. Modifications to the experimental environment change the actual or perceived probability of different outcomes for the individual. For instance, introducing a punishment, in which players can punish defectors, has been shown to increase cooperative behavior, even if the punishment is costly to the punisher [8]. Economic models have explained some of this behavior by considering fairness, reciprocity and punishment in a choice framework [9]. According to Fehr and Schmidt’s [9] model, cooperative behavior can dominate if some part of the population cares enough for equitable outcomes that they would punish selfish behavior even if it is costly to them.
While a theory about fairness, competition, and cooperation has been developed by Fehr and Schmidt [9], other research has shown that behavior is influenced by aspects of the experiment that do not impact the likelihood of an individual’s punishment or reward from being altruistic or selfish. For instance, the degree of anonymity of their counter-player [10] or subtle clues, such as displaying eyespots [11], have been shown to influence the amount given in behavioral games. Other studies have shown that identification of game partners [12], having participants from the same social group [13], and explicitly informing participants that the experimenter would know the amount given [14], increase the amount of cooperation, prosocial behavior and altruism. Alternatively, Dana et al. [15] found that participants behaved self-interestedly when they were offered some “moral wiggle room”, effectively permitting them to reduce their social sensitivity. In another paper, Dana et al. [16] showed that participants would even accept a reduction in their payoff if it guaranteed that the counter-player never knew that s/he participated in a dictator game. There have also been studies that have shown how certain manipulations have little impact on altruistic behavior. Grossman and Van der Weele [17] manipulated the cognitive and affective system of participants in a charity giving experiment. They found no effect of this manipulation at the aggregate level and inconsistent effects when analyzing female and male participants separately.
The common pattern in these studies is that the smaller the social distance between individuals (as described above), the more likely individuals are to behave in a prosocial way. In this paper, we will refer to this relationship as social sensitivity, that is, the ability of a person to perceive, understand, and respect the feelings and viewpoints of others [18]. Social sensitivity is lowest in an anonymous environment, where the partners of the experiment are not known (or even aware of each other) and the experimenter cannot know what actions each participant has or has not taken. Regardless of the amount of change in social sensitivity created by the design of an experiment, studies have shown that there is variance in giving in the dictator game. Engel [19] conducted a meta-review of the dictator game and found that only six out of 616 treatments resulted in, on average, $0 being given by the dictator. He also found that identification of the dictator and the partner could increase generosity, but 20% of dictators would still share nothing. We posit that the choice of how much to give might not be influenced entirely by the design of the experiment, but could also be influenced by personality traits of the individual dictator.
Personality traits and their relationship to economic preferences have been investigated by economists and personality psychologists to identify determinants of heterogeneity in behavior. Becker et al. [20] analyzed the connection between economic preferences, such as risk, time and social preferences, to measures of personality, such as the Big Five and locus of control. They only found low degrees of association between the preferences and the personality measures. They then applied a regression of these variables on life outcomes and showed that the two concepts worked well together in explaining heterogeneity in behavior and labor market success, health status and life satisfaction [20]. Further studies have investigated Big Five measurements on cooperation in economics games [21,22,23,24], risk preferences [25,26], and on social preferences [27]. Most of these studies find that one or more of the measures of the Big Five relate to the different preferences, however the results are not always consistent. This calls for further research into the relationship between personality traits and economic behavior.
In this research we examine social sensitivity, as measured by the Mind in the Eyes (MiE) test [28,29], to determine how MiE explains giving behavior in the dictator game (DG). Having a higher MiE score means that an individual has a greater ability to consider the emotional state of another person, explaining why we posit that the MiE score and giving in the DG will share a positive relationship. We compare the results of the DG to the more strategic ultimatum game (UG) to determine how behavior differs in a strategic versus non-strategic environment, finding that MiE score is a poor predictor for decision-making in a strategic environment. Instead, Wonderlic score, a measure of general intelligence, shares some correlation with behavior in the UG. This could be interpreted as more intelligent individuals giving a high enough amount to be accepted by the partner, but low enough to maximize their own profit. It shows that the cognitive ability of more intelligent individuals helps them find the amount that leads to the best outcome for the ultimator.
In the next section, we discuss the details of how the experiment was conducted. In the third section we present our results and we finish the article with a discussion of our results in the concluding section.
2. Experimental Section
In this section, we discuss the details of the recruitment of the participants, the survey, the experiments, and the descriptive statistics.
2.1. Survey
We recruited 140 students from three different colleges in the northeast of the United States via each university’s respective experimental economics online recruitment systems. Students represented a variety of undergraduate and graduate majors, which were grouped into engineering, science, management, and social sciences.
All students were required to complete an online survey at least one week prior to the laboratory experiment to ensure that the survey had minimal impact on participant behavior during the laboratory portion of the experiment. The survey included the Big Five test [30,31], REI-40 [32], Wonderlic score [33], Ellsberg paradox, and Mind in the Eyes (MiE) test [28,29]. The Big Five test measures factors such as Openness to Experiences (Intellect or Culture), Conscientiousness, Extraversion, Agreeableness, and Neuroticism (Emotional Stability). The REI-40 tests for rational ability, rational engagement, experiential ability, and experiential engagement. The experimental instructions for the online survey are given in Appendix B.
The MiE test is part of Theory of Mind, which has been applied in economic experiments, most notably by Kimborough et al. [34]. They found that participants with a higher Theory of Mind were better at learning another player’s preferences in a two-stage game. The MiE test specifically has been commonly used to examine differences in the ability to comprehend another person’s emotional state in adults [29].
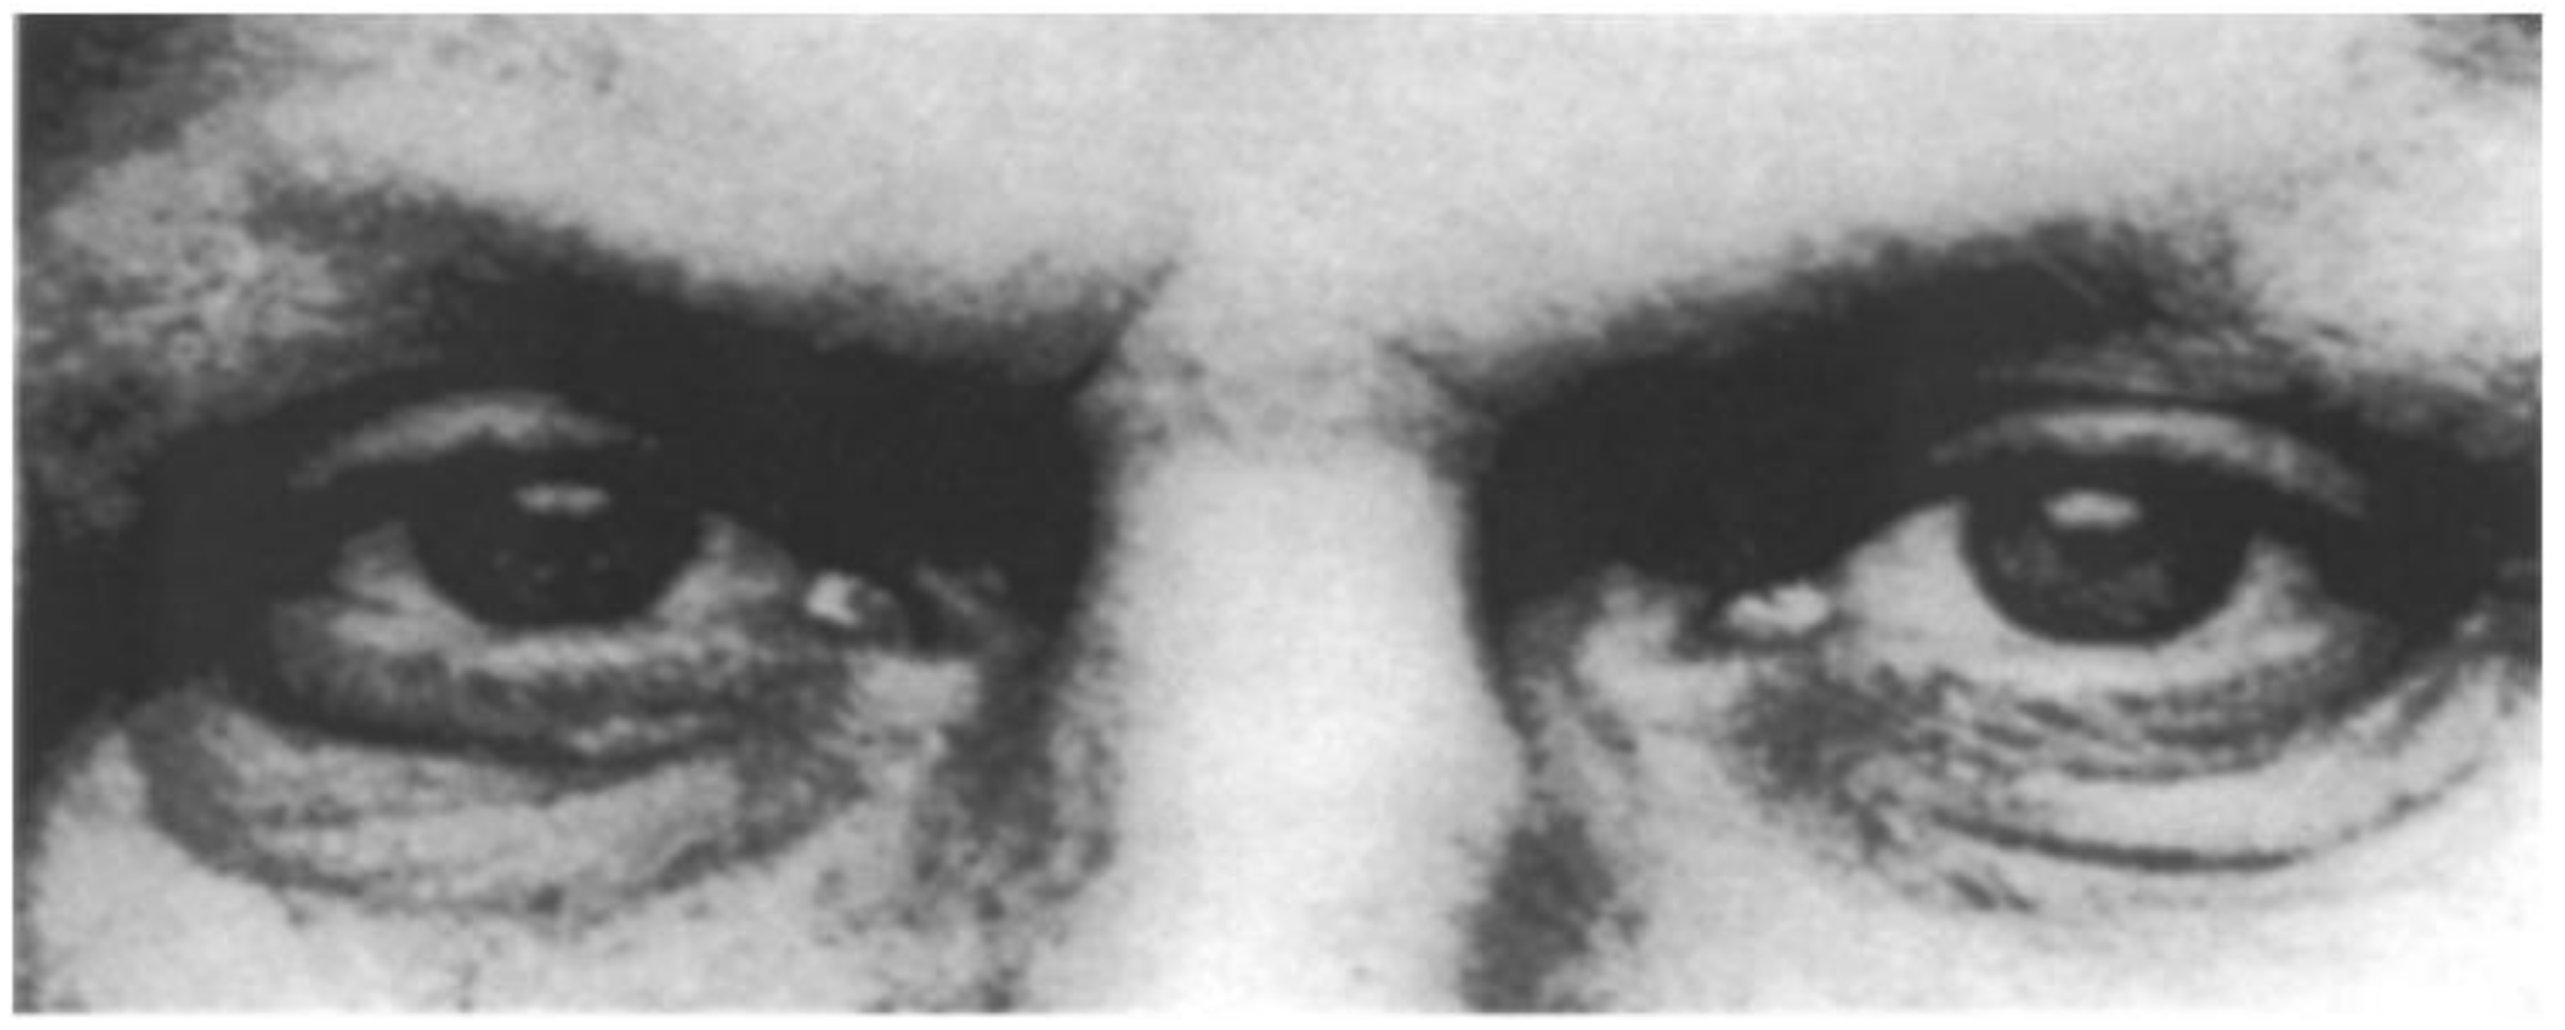
We utilized this tool to examine differences in the emotional assessment ability of our participants. In the MiE test, each participant is shown “photographs of the eye-region of the face of different actors and actresses, and is asked to choose which of two words best describes what the person in the photograph is thinking or feeling” [29]. Figure 1 and Figure 2 show examples of this test.
Participants then choose an adjective from a list of 4 emotions that they believe best describes the emotion being experienced by the actor—e.g., Serious (correct), Ashamed, Bewildered, Alarmed for Example 1, and Impatient, Aghast, Irritated or Reflective (correct) for Example 2. For the general population, Baron-Cohen et al. [29] found a mean of 18.8 (SD = 2.5) out of 25 correct answers for males and 21.8 (SD = 1.8) for females. The test employed in this study included a total of 36 pictures with an average of 27.62 (SD = 3.75) and 27.00 (SD = 3.20) correct answers for females and males, respectively. While our sample did not exhibit the differences in performance by gender observed in Baron-Cohen et al. [29], our participants had similar levels of accuracy, on average.
2.2. Experiments
Participants that successfully completed the survey were invited to participate in the laboratory portion of the experiment. At the beginning of each session participants were seated at private workstations. Computer screens were separated by walls on each side so that participants were not able to see one another’s screen or discuss behavior. Participants were then read an introductory text explaining the general outline of the experiment. In short, participants were informed that they would be participating in two economic games in which they can earn money.
Participants were asked about demographic data, including age, gender, major, and college-years. Each participant then played two economic games—the dictator and ultimatum games—in different order. Each of these games started with a $10 endowment in each period. Participants were randomly assigned to play as a dictator/ultimator or as a receiver. Each participant played both games and hence some participants would end up being the receiver in both games, while others would be the receiver either once or not at all. The experimental instructions of the laboratory experiment and examples of the screens seen by the participants are given in Appendix C.
At the end of the experiment, participants individually left the room and proceeded to a separate room where they flipped a coin to determine which game would be used to determine their payoff. The payoff from the DG or UG was added to a show-up fee of $5 and an additional $10 for completing the online survey, to determine the final payment for participation.
2.3. Descriptive Statistics
Of the 140 participants in the experiment, 55 were female and 85 were male. The gender ratio stayed approximately the same for the subsamples of dictators and ultimators, with 60% males and 65.7% males, respectively. Participants were between 19 and 33 years old, with an average age of 21.5 years. Participants were evenly distributed among fields of study (48 in engineering, 39 in social sciences, 41 in sciences, and 12 in management). The low number of management students is representative of the percentage of management students across the three universities. MiE scores and Wonderlics score were not significantly different for the entire participant sample versus the dictator/ultimator samples alone, as shown in Table 1.
Across the 515 treatments in Engel [19], dictators, on average, gave 28.35% of their endowment to the receiver, but averages within sessions reached as high as 40%. Dictator giving in our experiment averaged 3.40 out of 10 tokens, consistent with the giving behavior in Engel [19].
Ultimator offers were, on average, higher (mean = 3.89) than dictator giving. Oosterbeck et al. [35] conducted a meta-study on the ultimatum game from 37 papers and found that, on average, ultimators offered 40% of their total endowment, which is consistent with our ultimator offers. Finally, the acceptance rate of about 83% is similar to Oosterbeek et al. [35], who found an acceptance rate of 84%.
3. Results
We now turn our attention to empirically determining the impact of economic behavior, social sensitivity and cognitive ability on giving behavior in both the dictator and ultimatum games. We start our analysis with a discussion of the dictator game and then proceed to discuss behavior in the ultimatum game.
3.1. The Dictator Game
We found that dictator giving and MiE scores shared a positive relationship. Table 2 shows that dictators giving very low amounts ($0 and $1) also had MiE scores that are approximately three points (12%) lower than dictators giving $5 or more. Wonderlic scores did not show an obvious linear relationship with the giving behavior of the dictators. Table 2 shows dictator giving and corresponding MiE and Wonderlic scores.
It is likely that other aspects of individual decision-making (e.g., risk aversion, ambiguity aversion, gender, etc.) could be influencing behavior in these economic games. To account for these influences, we conducted an ordered logit regression analysis to determine how MiE score and other covariates influenced giving behavior in the DG. We started with a simple model, including only gender, age, and a measure of risk aversion—the Holt and Laury lottery1 [37]—as covariates. In Model 2 we included order effects (rotation), since we assumed that the order of play could be influencing decisions. For example, Kessler and Meier [38] failed to replicate results from a study on the impact of cognitive load manipulation on charitable giving and posited that cognitive load manipulation is sensitive to session order. In our study, the two games were very similar and dictators who played the UG first could have been offered a higher amount, thereby influencing the reference point for their DG giving. We also included control variables for the university where the participant was enrolled to control for any influence of the different laboratory environments or pedagogy. In Model 3, we included Wonderlic scores to control for participants’ cognitive ability. We also included a variable for the field of study of the participant to control for potential differences in analytical capacity. Finally, in Model 4 we included a variable for the participants’ ambiguity aversion, which was based on a choice experiment using the Ellsberg paradox [39]2. The additional control variables in the models had little influence on the statistical significance and magnitude of the MiE score’s coefficient, which further shows the robustness of our results3.
The results for four regression models are summarized in Table 3.
We found that MiE scores stayed statistically significant throughout all four models. Thus, we found support for the idea that higher emotional intelligence induced higher offers in a non-strategic environment. Looking at the predictive margins for the MiE scores in Figure 3, we found that the probability of a dictator offering zero went from more than 30% for MiE scores below 20, to less than 10% for MiE scores higher than 28.
The gender variable had a negative sign, indicating that male dictators gave less than female dictators; however, the coefficient did not show any statistical significance. The coefficient for the variable of age and the risk averse test also were not statistically significant. Participants’ Wonderlic scores showed no statistically significant relationship with giving in the DG.
In Model 2 the variable “rotation” was added. Rotation is an indicator variable, which took on the value of one when the dictator game was played after the UG, showing that our experiment did have statistically significant order effects. Specifically, the later the dictator game was played, the more likely dictators were to give higher amounts to the receiver.4
Finally, we added control variables for each university and for the field of study of the dictator. The inclusion of these additional controls increased the magnitude of the effect of MiE scores on giving behavior, continuing to remain significant. The low Pseudo R² value is in line with the results found by Engel [19], who found that in most single regression studies of the dictator game more than 90% of the variance remained unexplained. The AIC (Akaike’s Information Criteria) showed that Model 3 had the best overall fit, while the value of the BIC (Bayesian Information Criteria) suggests that the other models did not provide a strong improvement compared to Model 3. Hence, adding Wonderlic scores and control variables for field of study provided some improvement to the model. The possible correlations of many other variables with field of study make an interpretation of this result difficult.
3.2. The Ultimatum Game
Out of the 70 ultimators, only nine offered an amount lower than USD 3, of which six were rejected. Alternatively, 18 and 29 ultimators offered USD 4 and USD 5, respectively, all of which were accepted. When comparing the different offer amounts to MiE scores, no statistically significant differences were found. MiE scores stayed around 26 to 27 correct answers, as shown in Table 4. However, there was larger variance in the MiE scores of those offering USD 4 or 5.
The average Wonderlic score for all ultimators was 35, with a standard deviation of 4.73. The values for the Wonderlic test of ultimators offering different amounts showed a bell-curve relationship. Ultimators offering at the lower end scored around the average Wonderlic score of about 35 to 36 points, while ultimators offering two or three US dollars had a score of 38 to 39, on average. These ultimators had the highest score, while score steadily decreased for ultimators offering four or more US dollars. Table 4, below, summarizes the outcome of the ultimatum game.
Again, we conducted an ordered logit regression analysis to control for potentially confounding effects in our analysis. While the Wonderlic score variable seemed to have a non-linear relationship with the amount offered by the ultimators, there were too few observations for ultimators giving USD 0–2 to conduct a statistical test for a non-linear relationship between UG offers and Wonderlic scores. For ultimatum offers of $3 or more, the relationship between offers and Wonderlic scores was negative and statistically significant. Similar to the DG analysis we began with Model 1, where we include only Wonderlic scores, gender, age, and a risk aversion measure as control variables. In Model 2, we included the rotation variable and university to control for the different laboratory environments. We included MiE scores in Model 3 to test whether it was significant in the analysis of the UG, as it was in the DG. Finally, we included an indicator for ambiguity aversion in Model 4.
The results for each regression model are summarized in Table 5 below.
In the first two models, the coefficient for the Wonderlic score variable was statistically significant, while the precision of the coefficient decreased as we included our full set of controls (Model 3 and Model 4). However, both the AIC and BIC measures indicated that models 1 and 2 were the best fit for the data. The negative sign of the coefficient of Wonderlic scores, suggests that participants who were more intelligent would offer less in order to maximize their own profit, while still having their offer accepted. Brañas-Garza et al. [40] found that response time was larger in a strategic environment and that larger response times were associated with less generous offers. One explanation could be that more intelligent participants took their time to elicit the best possible outcome for themselves and concluded that less generous offers might be sufficiently high enough to be accepted.
Measures of social distance did not appear to explain behavior in more strategic environments and neither did measures of cognitive ability. When we included further variables, like a measure of ambiguity aversion—the Ellsberg Paradox variable—the negative relationship between intelligence and UG offers became insignificant. This suggests that the predictive capability of Wonderlic scores for behavior in the UG is not as strong as MiE scores in the DG. Importantly, other measures did not display a statistically significant relationship with UG offers, including MiE scores.
4. Conclusions
Previous research has shown that changes in social sensitivity affects giving in dictator games. Increasing social sensitivity through a reduction in social distance between the dictator and the receiving partner leads the dictator to give a greater share of the endowment. This social distance can be manipulated by the design of the experiment, for example, by telling the dictator the last name of the receiving partner.
As noted in Engel [19], significant variation in DG offers remain unexplained. We believe that social sensitivity, as measured by Theory of Mind, is an important explanatory variable that has been omitted from previous analyses. It has been shown to explain an individual’s ability to comprehend the mental state of another person and seems to be an important predictor of DG and UG, though it has not been included in previous analyses to our knowledge. Therefore, our study provided a first step towards exploring the influence of personality traits differences in varied environments. We confirmed the positive effect of social sensitivity in a non-strategic environment, but not in a strategic environment. In fact, in strategic environments we found that measures of general intelligence better, although weakly, explained behavior. We found that the change in environment from the (non-strategic) dictator game to the (strategic) ultimatum game resulted in a significant change in the process of decision-making. This result leads us to conclude that the relationship between economic and psychological determinants of decision-making in standard economic frameworks merits further attention.
It is important to note that the channel through which empathy is driving decision-making cannot be specifically identified in this work. Future work could utilize the design and similar subjects to those in Shamay-Tsoory and Aharon-Peretz [41], in an attempt to determine whether empathy is being generated from a basic emotional contagion system or a more advanced cognitive perspective-taking system (see also Wai and Tiliopoulos [42]). In utilizing a framework that enables the researcher to disentangle cognitive from emotional empathy, the relationship between DG offers and the type of empathy could be better understood.
Acknowledgments
The authors would like to thank Rustam Romaniuc for useful comments on an earlier draft and the three anonymous reviewers for their quick feedback and valuable comments during the review process.
Author Contributions
All authors conceived, designed and performed the experiments; H.L. analyzed the data; G.D. and M.B. contributed to the interpretation and discussion of the data analysis and results; and H.L. wrote the paper.
Conflicts of Interest
The authors declare no conflict of interest. The sponsors had no role in the design of the study; in the collection, analyses, or interpretation of data; in the writing of the manuscript, or in the decision to publish the results.
Appendix A. Additional Models

Table A1.
Additional models: Big Five and REI-40 in DG and UG.
| Variables | DG—Model 5 | DG—Model 6 | UG—Model 5 | UG—Model 6 |
|---|---|---|---|---|
| MiE score | 0.235 ** | 0.224 ** | ||
| (0.088) | (0.075) | |||
| Wonderlic score | −0.178 * | −0.154 * | ||
| (0.072) | (0.067) | |||
| Gender | −0.233 | −0.661 | 0.268 | 0.186 |
| (0.555) | (0.498) | (0.551) | (0.605) | |
| Age | 0.129 | 0.133 | 0.138 | 0.188 |
| (0.142) | (0.165) | (0.142) | (0.143) | |
| Risk averse | 0.377 | 0.812 | 0.606 | 0.477 |
| (0.628) | (0.532) | (0.573) | (0.540) | |
| Rotation | 0.483 * | 0.294 | −0.298 | −0.164 |
| (0.243) | (0.249) | (0.226) | (0.262) | |
| Big Five—Extraversion | −0.144 | −0.017 | ||
| (0.600) | (0.356) | |||
| Big Five—Agreeableness | 0.321 | −0.408 | ||
| (0.552) | (0.478) | |||
| Big Five—Consciousness | −0.110 | −0.691 | ||
| (0.435) | (0.561) | |||
| Big Five—Neuroticism | −0.488 | 0.163 | ||
| (0.554) | (0.435) | |||
| Big Five—Openness | 0.781 | 0.562 | ||
| (0.612) | (0.447) | |||
| REI—40—Rational Ability | 0.343 | −0.379 | ||
| (0.547) | (0.435) | |||
| REI—40—Rational Engagement | 0.604 | 0.693 | ||
| (0.518) | (0.426) | |||
| REI—40—Experiential Ability | −0.543 | 0.162 | ||
| (0.728) | (0.602) | |||
| REI—40—Experiential Engagement | −0.284 | 0.126 | ||
| (0.817) | (0.556) | |||
| Control variables | None | None | None | None |
| Pseudo R² | 0.089 | 0.099 | 0.097 | 0.095 |
| BIC | 290.5 | 286.0 | 254.2 | 252.3 |
| AIC | 252.5 | 250.0 | 218.4 | 218.6 |
| N | 70 | 70 | 70 | 70 |
| Wald-Chi² | 23.58 ** | 21.99 ** | 21.83 * | 24.74 ** |
N = 70, ° p < 0.10, * p < 0.05, ** p < 0.01, robust standard errors in parentheses. All four models were ordered logit models with robust standard errors. OLS estimates show the same pattern and can be obtained upon request from the authors.
Appendix B. Experimental Instructions—Online Survey
Introduction Screen
Welcome to this experiment.
The experiment consists of a survey, which you are taking now, and an actual laboratory game. A few weeks after you have finished the survey, you will be invited to play economic games. For taking the survey we reward you with $10, which you receive in cash when coming to the lab to play the economic games. For the participation in the economic games we reward you with an additional $5. The average payout for playing the economic games is $10, depending on your and others’ performance in the games. Hence, in total the average payout for participating in this experiment is $25, but can be up to $30. You will only be invited to the laboratory games, if you finish this survey.
The survey consists of eight parts and will take you approximately 40 min.
Please answer the questions as truthfully as you can, as the success of our research depends heavily on the results of this survey.
Introduction—Mind in the Eyes test
The first part of the survey will investigate your ability to read emotion from the eyes. You will be shown a pair of eyes with four emotion labels to pick from. Please choose the one of the four choices you think best corresponds to the emotion that the eyes are showing.
There is one practice item followed by 36 test items.
Introduction—Ellsberg paradox
In this part of the study you will be asked to choose among different alternatives. Please move on to the next page.
1st Choice screen—Ellsberg paradox
Suppose that an urn contains 300 balls of three possible colors: red, green, and blue. You know the urn contains exactly 100 red balls, but are given no information on how many green or blue balls are among the remaining 200 balls.
You win if you guess which color will be drawn. Do you prefer to bet on
○ RED
○ GREEN
2nd Choice screen—Ellsberg paradox
Now suppose that you win if you guess that either of two colors will be drawn. Do you prefer to bet that green or blue will be drawn or that red or blue will be drawn?
○ RED or BLUE
○ GREEN or BLUE
Introduction—Wonderlic Test
This test contains 50 questions that increase in difficulty. It contains various types of questions that must be completed without the aid of a calculator or other problem-solving device.
Screen-shot Example—Wonderlic Test

Introduction—Holt and Laury Lottery
Now imagine the following game. You can choose between two options: Option A and Option B.
Option A will either give you a payout of $6.00 or $4.80.
Option B will either give you a payout of $11.55 or $0.30.
Which payout you receive is determined by a die with 10 sides with equal probability for each side. Each outcome, 1, 2, 3, 4, 5, 6, 7, 8, 9, 10, is equally likely.
For example: If you choose Option A in the first row, you will have a 1 in 10 chance of earning $6.00 and a 9 in 10 chance of earning $4.80. Similarly, Option B offers a 1 in 10 chance of earning $11.55 and a 9 in 10 chance of earning $0.30.
Screen shot—Holt and Laury Lottery

Introduction—Big Five Inventory and REI-40
In this last part of the study you will be asked to answer a few questions about yourself. Remember that no personal information will be linked to your answers. Please answer as truthfully as you can.
Screen-shot Example—Big Five Inventory

Screen-shot Example—REI-40

End-screen—Online Survey
You are now done with the survey. You will be invited to a laboratory experiment soon, which we will conduct in 2 to 3 weeks.
Thank you for your participation!
Appendix C. Experimental Instructions—Laboratory Experiment
Introduction Screen—Demographic Survey

1st Screen—Dictator Game—Sender

1st Screen—Dictator Game—Receiver

2nd Screen—Dictator Game—Sender

2nd Screen—Dictator Game—Receiver

1st Screen—Ultimatum Game—Sender

1st Screen—Ultimatum Game—Receiver

2nd Screen—Ultimatum Game—Sender

2nd Screen—Ultimatum Game—Receiver

3rd Screen—Ultimatum Game—Sender

3rd Screen—Ultimatum Game—Receiver

References
- Gintis, H.; Bowles, S.; Boyd, R.; Fehr, E. Explaining altruistic behavior in humans. Evol. Hum. Behav. 2003, 24, 153–172. [Google Scholar] [CrossRef]
- Camerer, C.F. Behavioral Game Theory: Experiments in Strategic Interaction; Princeton University Press: Princeton, NJ, USA, 2011; ISBN 978-1-4008-4088-5. [Google Scholar]
- Leimar, O.; Hammerstein, P. Evolution of cooperation through indirect reciprocity. Proc. R. Soc. Lond. B Biol. Sci. 2001, 268, 745–753. [Google Scholar] [CrossRef] [PubMed]
- Nowak, M.A.; Sigmund, K. The Dynamics of Indirect Reciprocity. J. Theor. Biol. 1998, 194, 561–574. [Google Scholar] [CrossRef] [PubMed]
- Panchanathan, K.; Boyd, R. A tale of two defectors: The importance of standing for evolution of indirect reciprocity. J. Theor. Biol. 2003, 224, 115–126. [Google Scholar] [CrossRef]
- Panchanathan, K.; Boyd, R. Indirect reciprocity can stabilize cooperation without the second-order free rider problem. Nature 2004, 432, 499–502. [Google Scholar] [CrossRef] [PubMed]
- Bolton, G.E.; Katok, E.; Zwick, R. Dictator game giving: Rules of fairness versus acts of kindness. Int. J. Game Theory 1998, 27, 269–299. [Google Scholar] [CrossRef]
- Fehr, E.; Fischbacher, U. Third-party punishment and social norms. Evol. Hum. Behav. 2004, 25, 63–87. [Google Scholar] [CrossRef] [Green Version]
- Fehr, E.; Schmidt, K.M. A Theory of Fairness, Competition, and Cooperation. Q. J. Econ. 1999, 114, 817–868. [Google Scholar] [CrossRef]
- Charness, G.; Gneezy, U. What’s in a name? Anonymity and social distance in dictator and ultimatum games. J. Econ. Behav. Organ. 2008, 68, 29–35. [Google Scholar] [CrossRef]
- Haley, K.J.; Fessler, D.M.T. Nobody’s watching? Subtle cues affect generosity in an anonymous economic game. Evol. Hum. Behav. 2005, 26, 245–256. [Google Scholar] [CrossRef]
- Bohnet, I.; Frey, B.S. The sound of silence in prisoner’s dilemma and dictator games. J. Econ. Behav. Organ. 1999, 38, 43–57. [Google Scholar] [CrossRef]
- Solow, J.L.; Kirkwood, N. Group identity and gender in public goods experiments. J. Econ. Behav. Organ. 2002, 48, 403–412. [Google Scholar] [CrossRef]
- Hoffman, E.; McCabe, K.; Smith, V.L. Social Distance and Other-Regarding Behavior in Dictator Games. Am. Econ. Rev. 1996, 86, 653–660. [Google Scholar]
- Dana, J.; Weber, R.A.; Kuang, J.X. Exploiting moral wiggle room: Experiments demonstrating an illusory preference for fairness. Econ. Theory 2007, 33, 67–80. [Google Scholar] [CrossRef]
- Dana, J.; Cain, D.M.; Dawes, R.M. What you don’t know won’t hurt me: Costly (but quiet) exit in dictator games. Organ. Behav. Hum. Decis. Processes 2006, 100, 193–201. [Google Scholar] [CrossRef]
- Grossman, Z.; Van der Weele, J.J. Dual-Process Reasoning in Charitable Giving: Learning from Non-Results. Games 2017, 8, 36. [Google Scholar] [CrossRef]
- Rothenberg, B.B. Children’s Social Sensitivity and the Relationship to Interpersonal Competence, Intrapersonal Comfort, and Intellectual Level. Dev. Psychol. 1970, 2, 335–350. [Google Scholar] [CrossRef]
- Engel, C. Dictator games: A meta study. Exp. Econ. 2011, 14, 583–610. [Google Scholar] [CrossRef]
- Becker, A.; Deckers, T.; Dohmen, T.; Falk, A.; Kosse, F. The Relationship Between Economic Preferences and Psychological Personality Measures. Annu. Rev. Econ. 2012, 4, 453–478. [Google Scholar] [CrossRef]
- Perugini, M.; Tan, J.H.; Zizzo, D.J. Which is the more predictable gender? Public good contribution and personality. Econ. Issues 2010, 15, 83–110. [Google Scholar] [CrossRef]
- Kurzban, R.; Houser, D. Individual differences in cooperation in a circular public goods game. Eur. J. Personal. 2001, 15. [Google Scholar] [CrossRef]
- Lu, L.; Argyle, M. Happiness and cooperation. Personal. Individ. Differ. 1991, 12, 1019–1030. [Google Scholar] [CrossRef]
- Hirsh, J.B.; Peterson, J.B. Extraversion, neuroticism, and the prisoner’s dilemma. Personal. Individ. Differ. 2009, 46, 254–256. [Google Scholar] [CrossRef]
- Dohmen, T.; Falk, A.; Huffman, D.; Sunde, U. Are Risk Aversion and Impatience Related to Cognitive Ability? Am. Econ. Rev. 2010, 100, 1238–1260. [Google Scholar] [CrossRef]
- Borghans, L.; Heckman, J.J.; Golsteyn, B.H.H.; Meijers, H. Gender Differences in Risk Aversion and Ambiguity Aversion. J. Eur. Econ. Assoc. 2009, 7, 649–658. [Google Scholar] [CrossRef]
- Dohmen, T.; Falk, A.; Huffman, D.; Sunde, U. Representative Trust and Reciprocity: Prevalence and Determinants. Econ. Inq. 2008, 46, 84–90. [Google Scholar] [CrossRef]
- Baron-Cohen, S.; Jolliffe, T.; Mortimore, C.; Robertson, M. Another advanced test of theory of mind: Evidence from very high functioning adults with autism or Asperger syndrome. J. Child Psychol. Psychiatry 1997, 38, 813–822. [Google Scholar] [CrossRef] [PubMed]
- Baron-Cohen, S.; Wheelwright, S.; Hill, J.; Raste, Y.; Plumb, I. The “Reading the Mind in the Eyes” Test Revised Version: A Study with Normal Adults, and Adults with Asperger Syndrome or High-functioning Autism. J. Child Psychol. Psychiatry 2001, 42, 241–251. [Google Scholar] [CrossRef] [PubMed]
- John, O.P.; Donahue, E.M.; Kentle, R.L. The Big Five Inventory—Versions 4a and 54; University of California, Berkeley, Institute of Personality and Social Research: Berkeley, CA, USA, 1991. [Google Scholar]
- John, O.P.; Naumann, L.P.; Soto, C.J. Paradigm shift to the integrative big five trait taxonomy. In Handbook of Personality: Theory and Research; The Guilford Press: New York, NY, USA, 2008; pp. 114–158. ISBN 978-1-59385-836-0. [Google Scholar]
- Pacini, R.; Epstein, S. The relation of rational and experiential information processing styles to personality, basic beliefs, and the ratio-bias phenomenon. J. Pers. Soc. Psychol. 1999, 76, 972–987. [Google Scholar] [CrossRef] [PubMed]
- Wonderlic, E.F. Wonderlic Personnel Test and Scholastic Level Exam: User’s Manual; Wonderlic and Associates: Northfield, IL, USA, 1992. [Google Scholar]
- Kimbrough, E.O.; Robalino, N.; Robson, A.J. The Evolution of “Theory of Mind”: Theory and Experiments; Social Science Research Network: Rochester, NY, USA, 2014. [Google Scholar]
- Oosterbeek, H.; Sloof, R.; Kuilen, G. Van de Cultural Differences in Ultimatum Game Experiments: Evidence from a Meta-Analysis. Exp. Econ. 2004, 7, 171–188. [Google Scholar] [CrossRef]
- Anderson, L.R.; Mellor, J.M. Predicting health behaviors with an experimental measure of risk preference. J. Health Econ. 2008, 27, 1260–1274. [Google Scholar] [CrossRef] [PubMed]
- Holt, C.A.; Laury, S.K. Risk aversion and incentive effects. Am. Econ. Rev. 2002, 92, 1644–1655. [Google Scholar] [CrossRef]
- Kessler, J.B.; Meier, S. Learning from (failed) replications: Cognitive load manipulations and charitable giving. J. Econ. Behav. Organ. 2014, 102, 10–13. [Google Scholar] [CrossRef]
- Ellsberg, D. Risk, Ambiguity, and the Savage Axioms. Q. J. Econ. 1961, 75, 643–669. [Google Scholar] [CrossRef]
- Brañas-Garza, P.; Meloso, D.; Miller, L. Strategic risk and response time across games. Int. J. Game Theory 2017, 46, 511–523. [Google Scholar] [CrossRef]
- Shamay-Tsoory, S.G.; Aharon-Peretz, J.; Perry, D. Two systems for empathy: A double dissociation between emotional and cognitive empathy in inferior frontal gyrus versus ventromedial prefrontal lesions. Brain 2009, 132, 617–627. [Google Scholar] [CrossRef] [PubMed]
- Wai, M.; Tiliopoulos, N. The affective and cognitive empathic nature of the dark triad of personality. Personal. Individ. Differ. 2012, 52, 794–799. [Google Scholar] [CrossRef]
| 1 | For the risk aversion parameter, we followed the set-up and pay-off structure of Anderson and Mellor [36]. Calculation of the risk aversion parameter followed Holt and Laury’s procedure of calculating the interval of the coefficient of relative risk aversion (CRRA). We then took the mean of the interval and classified participants into risk averse if the mean was above 0 and risk loving if the mean was below 0. |
| 2 | Participants played the one-urn Ellsberg paradox, where they were asked about their choice in two situations. The first situation was:
The second situation was:
If participants chose (A) and then (B), they were classified as ambiguity averse, and as “else” for all other choice combinations. Out of the 140 participants, 81 were classified as ambiguity averse, while 59 were classified as “else”. |
| 3 | Interactions between MiE scores and Wonderlic scores, as well as non-linear MiE and Wonderlic scores were examined, but showed no statistical significance. |
| 4 | Separate regressions for rotation showed a slightly smaller coefficient of the MiE score variable when the DG was played after the UG (0.18 compared to 0.22). The difference between the coefficients was not statistically significant, hence further interpretation would only be speculation. |
Figure 1.
Mind in the Eyes Test: Example 1 (Figure 1 in [29]).
Figure 1.
Mind in the Eyes Test: Example 1 (Figure 1 in [29]).

Figure 2.
Mind in the Eyes Test: Example 2 (Figure 2 in [29]).
Figure 2.
Mind in the Eyes Test: Example 2 (Figure 2 in [29]).

Figure 3.
Predictive probability that dictator offer = 0 with MiE scores in the dictator game (Ordered Logit Model 1).
Figure 3.
Predictive probability that dictator offer = 0 with MiE scores in the dictator game (Ordered Logit Model 1).

Table 1.
Descriptive statistics (Mean and SD).
| Variable | Median/Mean | SD |
|---|---|---|
| Age | ||
| 22/21.54 | 2.07 |
| 22/21.47 | 1.96 |
| 22/21.57 | 2.00 |
| Gender (male = 1) | ||
| 1/0.607 | 0.49 |
| 1/0.600 | 0.49 |
| 1/0.657 | 0.48 |
| Risk averse (1 = Yes, 0 = No) | ||
| 1/0.779 | 0.42 |
| 1/0.800 | 0.40 |
| 1/0.771 | 0.42 |
| MiE score | ||
| 27/27.24 | 3.43 |
| 27.5/27.49 | 3.34 |
| 27/26.99 | 3.11 |
| Wonderlic score | ||
| 36/35.29 | 4.67 |
| 36/35.27 | 5.15 |
| 35/35.00 | 4.73 |
| Dictator giving | 4/3.40 | 2.03 |
| Ultimators’ Offer (83% accepted) | 4/3.89 | 1.35 |
Table 2.
Dictators’ giving and MiE Scores.
| Dictators’ Giving Amount | USD 0 | USD 1 | USD 2 | USD 3 | USD 4 | USD 5 | USD > 5 |
|---|---|---|---|---|---|---|---|
| Number of Dictators | 8 | 9 | 3 | 12 | 11 | 25 | 2 |
| MiE score | |||||||
| 25.25 | 25.44 | 29.33 | 26.58 | 28.91 | 28.36 | 29.5 |
| (4.59) | (4.36) | (4.04) | (2.68) | (2.51) | (2.40) | (3.54) |
| 17/29 | 18/34 | 25/33 | 22/30 | 26/33 | 23/32 | 27/32 |
| Wonderlic score | |||||||
| 38.38 | 32.56 | 36.67 | 36.17 | 33.64 | 35.68 | 31.5 |
| 3.85 | 7.00 | 5.51 | 4.30 | 5.68 | 4.51 | 6.36 |
| 33/45 | 19/42 | 31/42 | 29/43 | 25/42 | 27/43 | 27/36 |
Table 3.
Dictator game regression models (Ordered Logit Model).
| Variables | Model 1 | Model 2 | Model 3 | Model 4 |
|---|---|---|---|---|
| MiE score | 0.207 ** | 0.198 * | 0.243 * | 0.243 * |
| (0.071) | (0.087) | (0.102) | (0.105) | |
| Gender | −0.599 | −0.492 | −0.699 | −0.698 |
| (0.423) | (0.431) | (0.531) | (0.545) | |
| Age | 0.139 | 0.077 | 0.062 | 0.063 |
| (0.116) | (0.154) | (0.180) | (0.197) | |
| Risk averse | 0.517 | 0.631 | 0.500 | 0.502 |
| (0.505) | (0.525) | |||
| Rotation | 0.477 * | 0.566 * | 0.563 * | |
| (0.231) | (0.241) | (0.284) | ||
| Wonderlic score | −0.047 | −0.046 | ||
| (0.056) | (0.055) | |||
| Ellsberg paradox | −0.024 | |||
| (0.643) | ||||
| Control variables | University | University, field of study | University, field of study | |
| Pseudo R² | 0.0591 | 0.1091 | 0.1642 | 0.1642 |
| BIC | 274.5 | 275.1 | 278.8 | 283.0 |
| AIC | 249.7 | 243.6 | 238.3 | 240.3 |
| N | 70 | 70 | 70 | 70 |
| Wald-chi² | 11.03 * | 23.79 ** | 49.06 *** | 49.22 *** |
N = 70, * p < 0.05, ** p < 0.01, *** p < 0.001, robust standard errors in parentheses. All four models were ordered logit models with robust standard errors. More control variables were added in each model to control for order effects (rotation), laboratory environment (university), and the cognitive ability of the participant (Wonderlic score). OLS estimates show the same pattern and can be obtained, upon request, from the authors.
Table 4.
Ultimator’s offer, Wonderlic scores, and MiE scores.
| Ultimators’ Offer Amount | USD 0 | USD 1 | USD 2 | USD 3 | USD 4 | USD 5 | USD > 5 |
|---|---|---|---|---|---|---|---|
| Amount of ultimators | 2 | 4 | 3 | 13 | 18 | 29 | 1 |
| Acceptance rate | 0% | 50% | 33.3% | 53.85% | 100% | 100% | 100% |
| Final amount received | $0 | $4.5 | $2.67 | $3.77 | $6 | $5 | $4 |
| Wonderlic score | |||||||
| Mean | 35.5 | 36.25 | 39.33 | 37.92 | 35.39 | 32.79 | 35 |
| SD | (6.36) | (5.62) | (4.73) | (3.61) | (3.90) | (4.75) | (.) |
| Min/Max | 31/40 | 29/42 | 34/43 | 32/45 | 27/43 | 19/40 | 35/35 |
| MiE score | |||||||
| 28.5 | 27.25 | 27.67 | 26.77 | 27.00 | 26.76 | 30 |
| 2.12 | 2.75 | 1.53 | 2.49 | 3.99 | 3.14 | . |
| 27/30 | 24/30 | 26/29 | 22/32 | 19/32 | 18/33 | 30/30 |
Table 5.
Ultimatum game regression models (Ordered Logit Model).
| Variables | Model 1 | Model 2 | Model 3 | Model 4 |
|---|---|---|---|---|
| Wonderlic score | −0.167 ** | −0.131 * | −0.115 ° | −0.103 |
| (0.057) | (0.064) | (0.068) | (0.075) | |
| Gender | 0.166 | 0.554 | 0.348 | 0.354 |
| (0.498) | (0.622) | (0.655) | (0.662) | |
| Age | 0.140 | 0.070 | 0.066 | 0.071 |
| (0.157) | (0.105) | (0.105) | (0.106) | |
| Risk averse | 0.539 | 0.371 | 0.354 | 0.374 |
| (0.522) | (0.563) | (0.577) | (0.581) | |
| Rotation | −0.050 | −0.071 | −0.049 | |
| (0.238) | (0.257) | (0.262) | ||
| MiE score | −0.059 | −0.068 | ||
| (0.066) | (0.068) | |||
| Ellsberg paradox | −0.405 | |||
| (0.599) | ||||
| Control variables | University | University, field of study | University, field of study | |
| Pseudo R² | 0.0724 | 0.129 | 0.143 | 0.146 |
| BIC | 235.7 | 236.7 | 250.7 | 254.4 |
| AIC | 213.2 | 207.5 | 212.5 | 213.9 |
| N | 70 | 70 | 70 | 70 |
| Wald-Chi² | 16.48 ** | 27.59 *** | 30.22 ** | 30.82 ** |
N = 70, ° p < 0.10, * p < 0.05, ** p < 0.01, *** p < 0.001, robust standard errors in parentheses. All four models were ordered logit models with robust standard errors. More control variables were added in each model to control for order effects (rotation), the laboratory environment (University), and the social cognition of the participant (MiE score). Lowest values of the BIC and AIC are highlighted in bold. OLS estimates show the same pattern and can be obtained upon request from the authors.
© 2018 by the authors. Licensee MDPI, Basel, Switzerland. This article is an open access article distributed under the terms and conditions of the Creative Commons Attribution (CC BY) license (http://creativecommons.org/licenses/by/4.0/).
Share and Cite
MDPI and ACS Style
Lang, H.; DeAngelo, G.; Bongard, M. Theory of Mind and General Intelligence in Dictator and Ultimatum Games. Games 2018, 9, 16. https://doi.org/10.3390/g9020016
AMA Style
Lang H, DeAngelo G, Bongard M. Theory of Mind and General Intelligence in Dictator and Ultimatum Games. Games. 2018; 9(2):16. https://doi.org/10.3390/g9020016
Chicago/Turabian StyleLang, Hannes, Gregory DeAngelo, and Michelle Bongard. 2018. "Theory of Mind and General Intelligence in Dictator and Ultimatum Games" Games 9, no. 2: 16. https://doi.org/10.3390/g9020016
Note that from the first issue of 2016, this journal uses article numbers instead of page numbers. See further details here.