Fractionated Follow-Up Chemotherapy Delays the Onset of Resistance in Bone Metastatic Prostate Cancer
by
 ,
,
Pranav I. Warman
1,2 ,
,
Artem Kaznatcheev
3,4,
Arturo Araujo
2,
Conor C. Lynch
5 and
David Basanta
2,* 1
Department of Cumputer Science, Duke University, Durham, NC 27708, USA
2
Integrated Mathematical Oncology, H. Lee Moffitt Cancer Center and Research Institute, Tampa, FL 33612, USA
3
Department of Computer Science, University of Oxford, Oxford OX1 3QD, UK
4
Department of Translational Hematology & Oncology Research, Cleveland Clinic, Cleveland, OH 44195, USA
5
Department of Tumor Biology, H. Lee Moffitt Cancer Center and Research Institute, Tampa, FL 33612, USA
*
Author to whom correspondence should be addressed.
Games 2018, 9(2), 19; https://doi.org/10.3390/g9020019
Submission received: 28 February 2018
/
Revised: 11 April 2018
/
Accepted: 18 April 2018
/
Published: 23 April 2018
(This article belongs to the Special Issue Game Theory and Cancer)
Abstract
:Prostate cancer to bone metastases are almost always lethal. This results from the ability of metastatic prostate cancer cells to co-opt bone remodeling, leading to what is known as the vicious cycle. Understanding how tumor cells can disrupt bone homeostasis through their interactions with the stroma and how metastatic tumors respond to treatment is key to the development of new treatments for what remains an incurable disease. Here we describe an evolutionary game theoretical model of both the homeostatic bone remodeling and its co-option by prostate cancer metastases. This model extends past the evolutionary aspects typically considered in game theoretical models by also including ecological factors such as the physical microenvironment of the bone. Our model recapitulates the current paradigm of the “vicious cycle” driving tumor growth and sheds light on the interactions of heterogeneous tumor cells with the bone microenvironment and treatment response. Our results show that resistant populations naturally become dominant in the metastases under conventional cytotoxic treatment and that novel schedules could be used to better control the tumor and the associated bone disease compared to the current standard of care. Specifically, we introduce fractionated follow up therapy—chemotherapy where dosage is administered initially in one solid block followed by alternating smaller doses and holidays—and argue that it is better than either a continuous application or a periodic one. Furthermore, we also show that different regimens of chemotherapy can lead to different amounts of pathological bone that are known to correlate with poor quality of life for bone metastatic prostate cancer patients.
1. Introduction
Prostate cancer (PCa) is the second most common type of cancer in men, with over 160,000 men diagnosed during 2017 in the US alone, of which over 26,000 succumb [1]. The majority of patients that die of the disease do so because of distant metastases—90% of which are to the bone. For this reason, a better understanding of tumor–bone interactions is key if we are to improve how bone metastatic prostate cancer patients are treated.
Improvements in our understanding of the molecular mechanisms involved in this disease have led to the discovery of new therapeutic targets; however, the disease remains lethal with tumor resistance to treatments emerging in virtually every patient. Thus, understanding the impact of treatments in a complex heterogeneous tumor requires approaches that can incorporate several scales of biological insights. A successful approach needs to recapitulate the emergent process of metastatic prostate cancer establishment and the emergence of resistance to treatment. In the past, we demonstrated how a sophisticated agent-based computational model could help us understand the role of PCa–host interactions, as well as the impact of existing and novel treatments [2,3]. While agent-based models can accurately and quantitatively recapitulate cell dynamics in a specific area of a tumor, capturing the relevant intra-tumor heterogeneity and sensitivity to treatments can be a challenging and time-consuming process [4]. Alternatively, non-spatial population models that capture intra-tumor heterogeneity can be used to represent the entire metastatic burden of the disease and thus could be used as proxies for the patient in optimization algorithms [5]. Furthermore, non-spatial models lend themselves to easier measurement and use [6] and avoids the confusion of population-level intuitions for reductive ground truth [7].
Simple qualitative models can be useful in providing an understanding of how certain interactions shape evolution and resistance in cancer. Previously, Ryser et al. used a simple ordinary differential equation (ODE) model to understand bone remodeling [8,9] and to illustrate how tumor cell interactions with bone remodeling cells can shape cancer progression [10]. Evolutionary game theory (EGT) is a particularly powerful, yet simple and qualitative, approach to focusing on the role of interactions in cancer. It originated in looking at the effects of heterogeneity [11,12], and we have used it to look at a wide number of dynamics in cancer such as go-vs-grow [13,14], the Warburg effect [15], tumor–stroma interactions [16], and interactions of multiple public goods [17]. In the process, we have built EGT models for many cancers, including prostate cancer [15,16]—as have several other groups. Dingli et al. [18] focused on a type of bone cancer, multiple myeloma, using an EGT approach that incorporated both tumor cells as well as bone stromal cells. More recently, West et al. [19] studied the impact of novel treatments like adaptive therapies in the context of bone metastatic prostate cancer but without including the cellular species that characterize the bone ecosystem.
In this work, we aim to model not only cancerous growth in the bone but also capture key aspects of normal bone homeostasis and its co-option. We built an EGT model where PCa cells can co-opt cells from the bone modeling unit (BMU). In brief, every part of the bone is remodeled every 3–5 years. The BMU is an area of trabecular bone that is remodeled via osteoclasts (OCs) and osteoblasts (OBs). Although other cell types are involved, including mesenchymal stem cells, macrophages, and myeloid-derived cells, both OCs and OBs are the key cell types involved in the resorption and deposition of bone tissue, respectively. The process of remodeling is orchestrated through signaling molecules such as receptor activator of nuclear factor kappa-B ligand (RANKL), which is generated by osteoblasts and promotes osteoclast differentiation and survival, and TGF-, which is released when bone tissue is removed by OCs. These cellular species make the bone a very dynamic organ [20]. Furthermore, studies have shown that metastatic cancer cells can co-opt this process for their own benefit [21]. For this reason, OCs and OBs constitute the key cellular strategies of any mathematical model of bone remodeling. In our model, these two cell populations will be described as the bone stroma.
Capturing the regulation and dis-regulation of bone homeostasis allows us to better understand the selection that drives metastatic cancer evolutionary dynamics and the impact of treatments on the bone microenvironment—a topic of clinical significance. Furthermore, our approach also incorporates ecological aspects by modeling the role of the bone in regulating the fitness of the different cell types [22]. Our results suggest that we could optimize the combination of on and off periods of treatment to limit tumor growth and control bone growth.
2. Model
The interactions between OCs and OBs orchestrate bone (B) remodeling and homeostasis. As such, bone volume is determined by the balance between the density of OBs () and the density of OCs () on the existing bone, where OBs increase the bone volume and OCs decrease the bone volume according to the following discrete time dynamics:
where OBs and OCs are in the range such that . The values of B are dimensionless and can be understood as a lack of bone if , bone homesostasis if , and excessive bone if . The constant K determines time-scales.
Note that the above dynamics are physical and not evolutionary. The dynamics of densities for OBs, OCs, and the sensitive and resistant parts of the tumor (, ), however, are ecological and given by logistic growth:
where and is the total density (thus is the amount of remaining space in the niche), is the selection strength, is the death rate, and represents the fitness functions.
- The fitness function for OBs is given bywhere the first summand of corresponds to the benefit conferred to OBs by OCs. This benefit can be attributed to the secretion of TGF- by OCs that recruits OBs to the remodeling site. This is dependent on the proportion of OC among healthy cells () and the dearth of bone with respect to its standard equilibrium . In the second summand, is the benefit that an OB receives from interacting with any PCa cell due to their natural secretion of TGF-.
- The fitness function for OCs is given bywhich captures the benefit conferred to OCs by OBs that can be attributed to the secretion of RANKL as a result of bone resorption. This is dependent on the proportion of OBs among healthy cells () and the overabundance of bone with respect to its standard equilibrium . Since both and are functions of the proportions of OCs and OBs, we could rewrite the equations for and as a replicator dynamic model (for a similar model, see Kaznatcheev [23]).
- Finally, the fitness functions for chemotherapy-sensitive and -resistant tumors arewhere is the benefit a PCa cell receives from interacting with OCs. The OC-led resorption of the bone allows the neighboring PCa cells to access nutrients and growth factors previously embedded in the bone; is the benefit that a PCa cell receives from interacting with other PCa cells derived from the secretion of TGF-. The cost of resistance to treatment is r, and the efficacy of the treatment is s. Resistance to chemotherapy is common and results from the treatment providing strong selection for PCa cells that can avoid its cyto-toxicity. This resistance often comes through the upregulation of drug exporter pumps on the surface of PCa cells [24,25,26]. Producing and maintaining these pumps is energetically costly to the PCa cells but allows those that have a sufficient number of them to deal with cytotoxic drugs.
Chemotherapy
For all the fitness functions above, chemotherapy is implemented by the introduction of a cost s, which corresponds to the strength of the chemotherapy regiment. Chemotherapy is widely used in treating hormone-sensitive and -insensitive metastatic prostate cancer [27]. As chemotherapy options like docetaxel become more widely used, so does the importance of understanding how to better administer them in order to minimize the possibility that resistant phenotypes emerge. As a simple caricature, the variable s can be described microdynamically: when a cell tries to undergo mitosis, it will be killed with probability s. This means that, at s = 0.5, there will be no growth in the affected population, since half the time that a cell tries to divide, it succeeds and becomes two cells and half the time it dies and becomes zero cells. For , the growth rate is slowed; for , the growth rate flips its sign, i.e., the growth rate becomes a “shrink” rate. This is implemented in all fitness functions (except for chemo-resistant ) by multiplying the fitness function by . Note that chemotherapy only impacts the bone via interfering with the cells that control bone perturbation, i.e., OBs and OCs.
3. Results
We will illustrate our results with simulations of particular parameter settings as follows: a death rate of , a selection strength of , a bone adjustment rate of , and tumor–environment ecological interactions of , , and . Due to the qualitative nature of this model, the dimensionless parameters were chosen to recapitulate dynamics that are accepted throughout the literature instead of to correspond with experimental measurements. The sensitivity of these parameters was investigated informally, and confirmed our belief that these parameters are not the only values in the space that can generate these results.
With the model described, we can recapitulate bone homeostasis when there are no PCa cells. Initial densities of the different population are as follows: , , , and . The plots shown in Figure 1 show how the bone is initially resorbed, and then deposited as OCs and OBs work to restore the balance of bone to homeostatic levels after a simulated microfracture.
3.1. Tumor Introduction
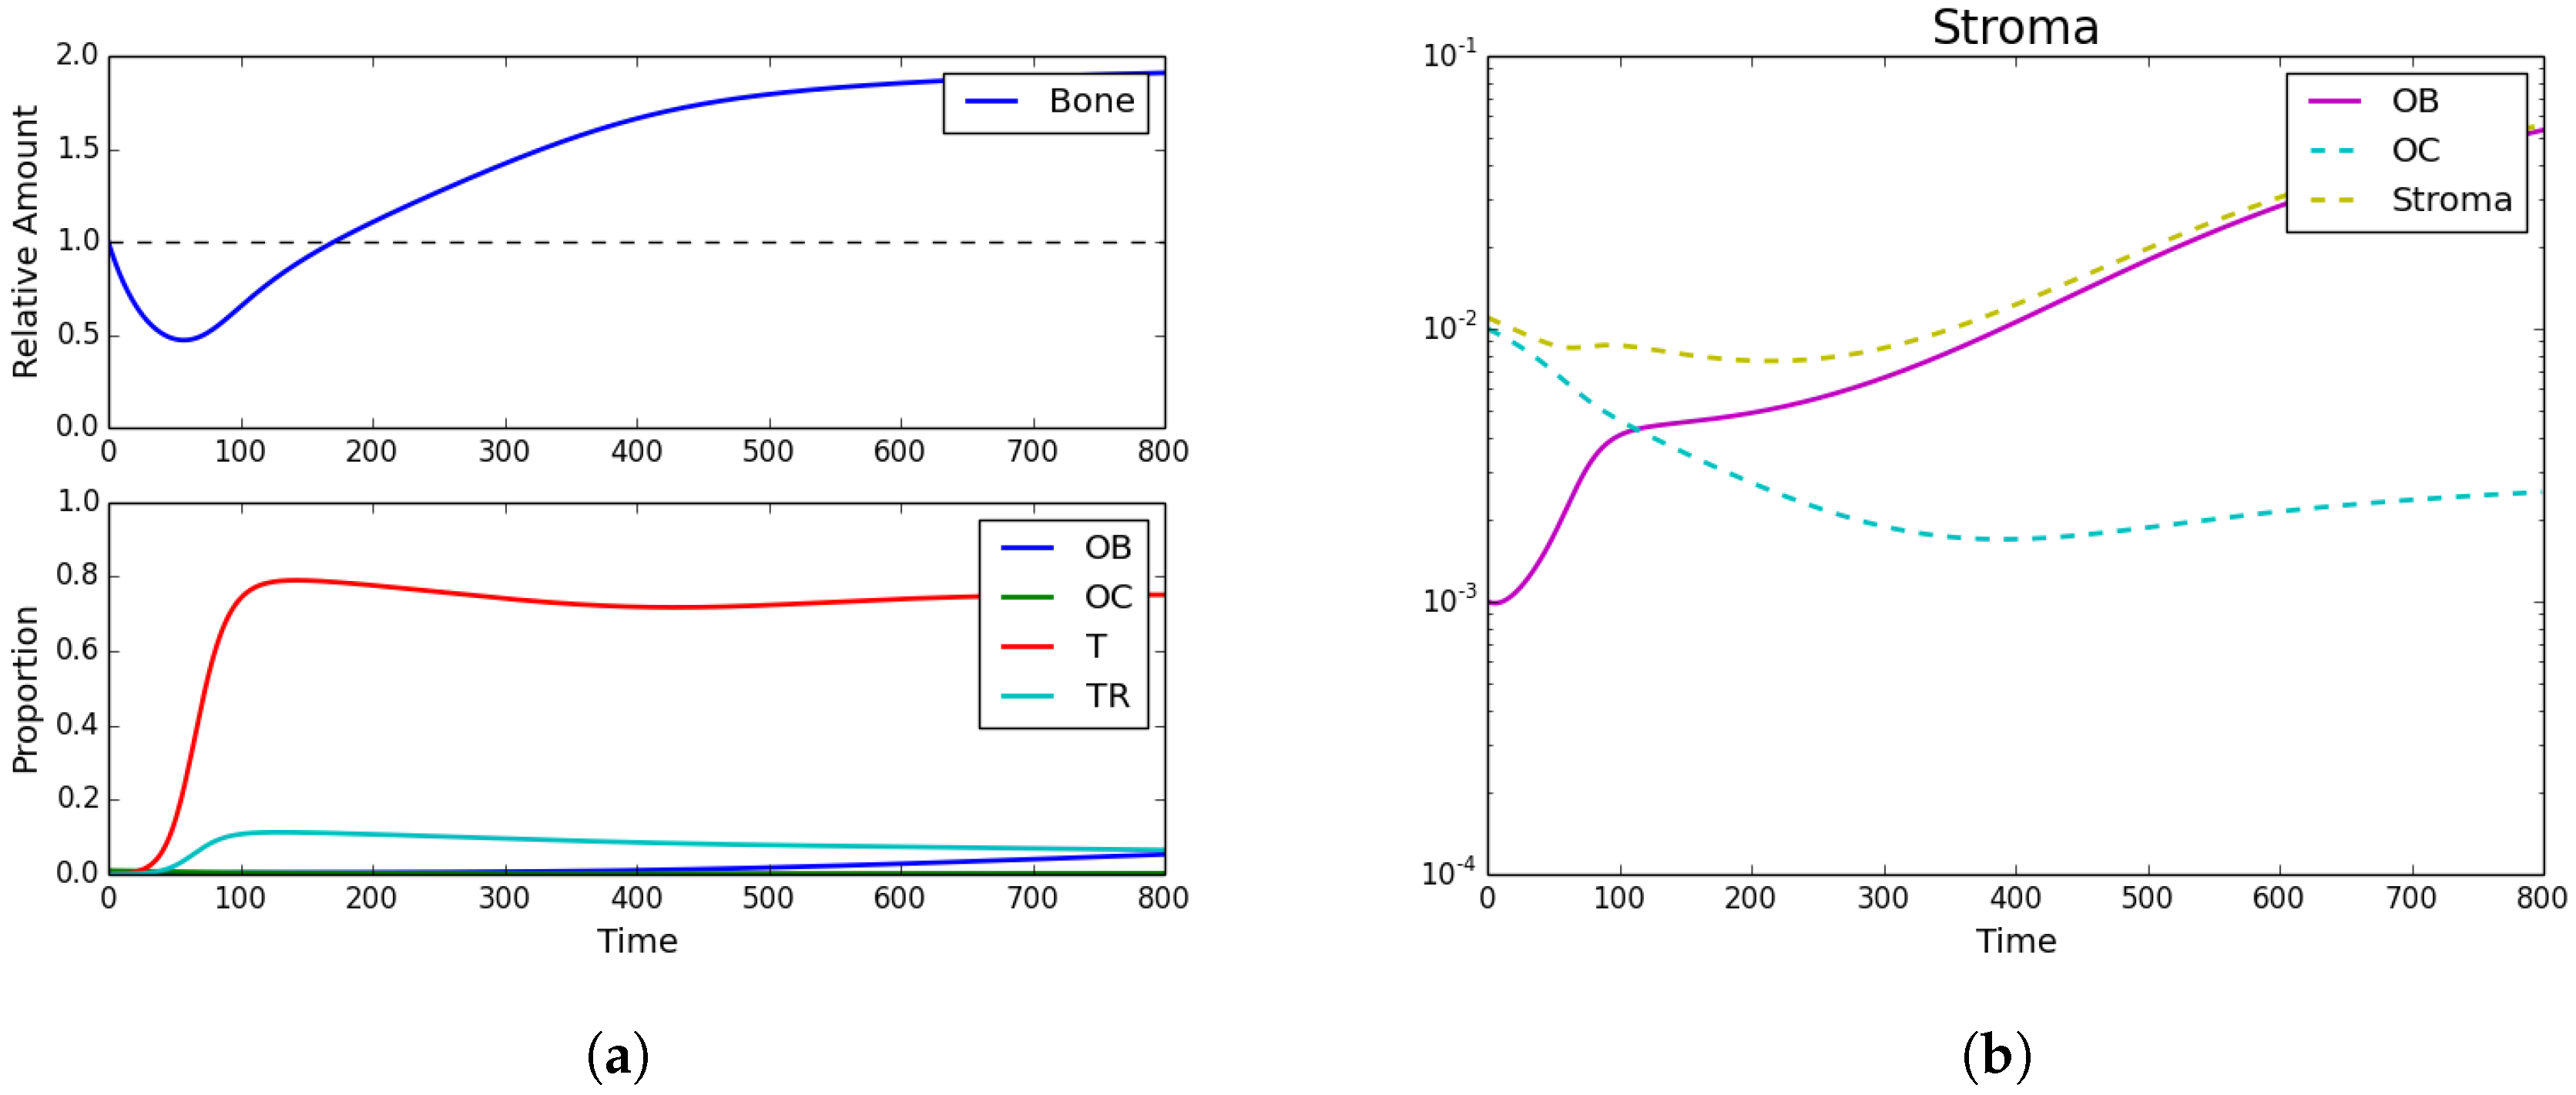
We now assume that a metastatic PCa cell has extravasated into an area of the bone that will undergo remodeling. In this case, we assume that the initial conditions are , , , , and . In this case, the results can be seen in Figure 2, which shows how the growth of the PCa population leads to an increase of pathological bone and a dominance of the PCa cells over the OBs and the OCs.
3.2. Standard Chemotherapy
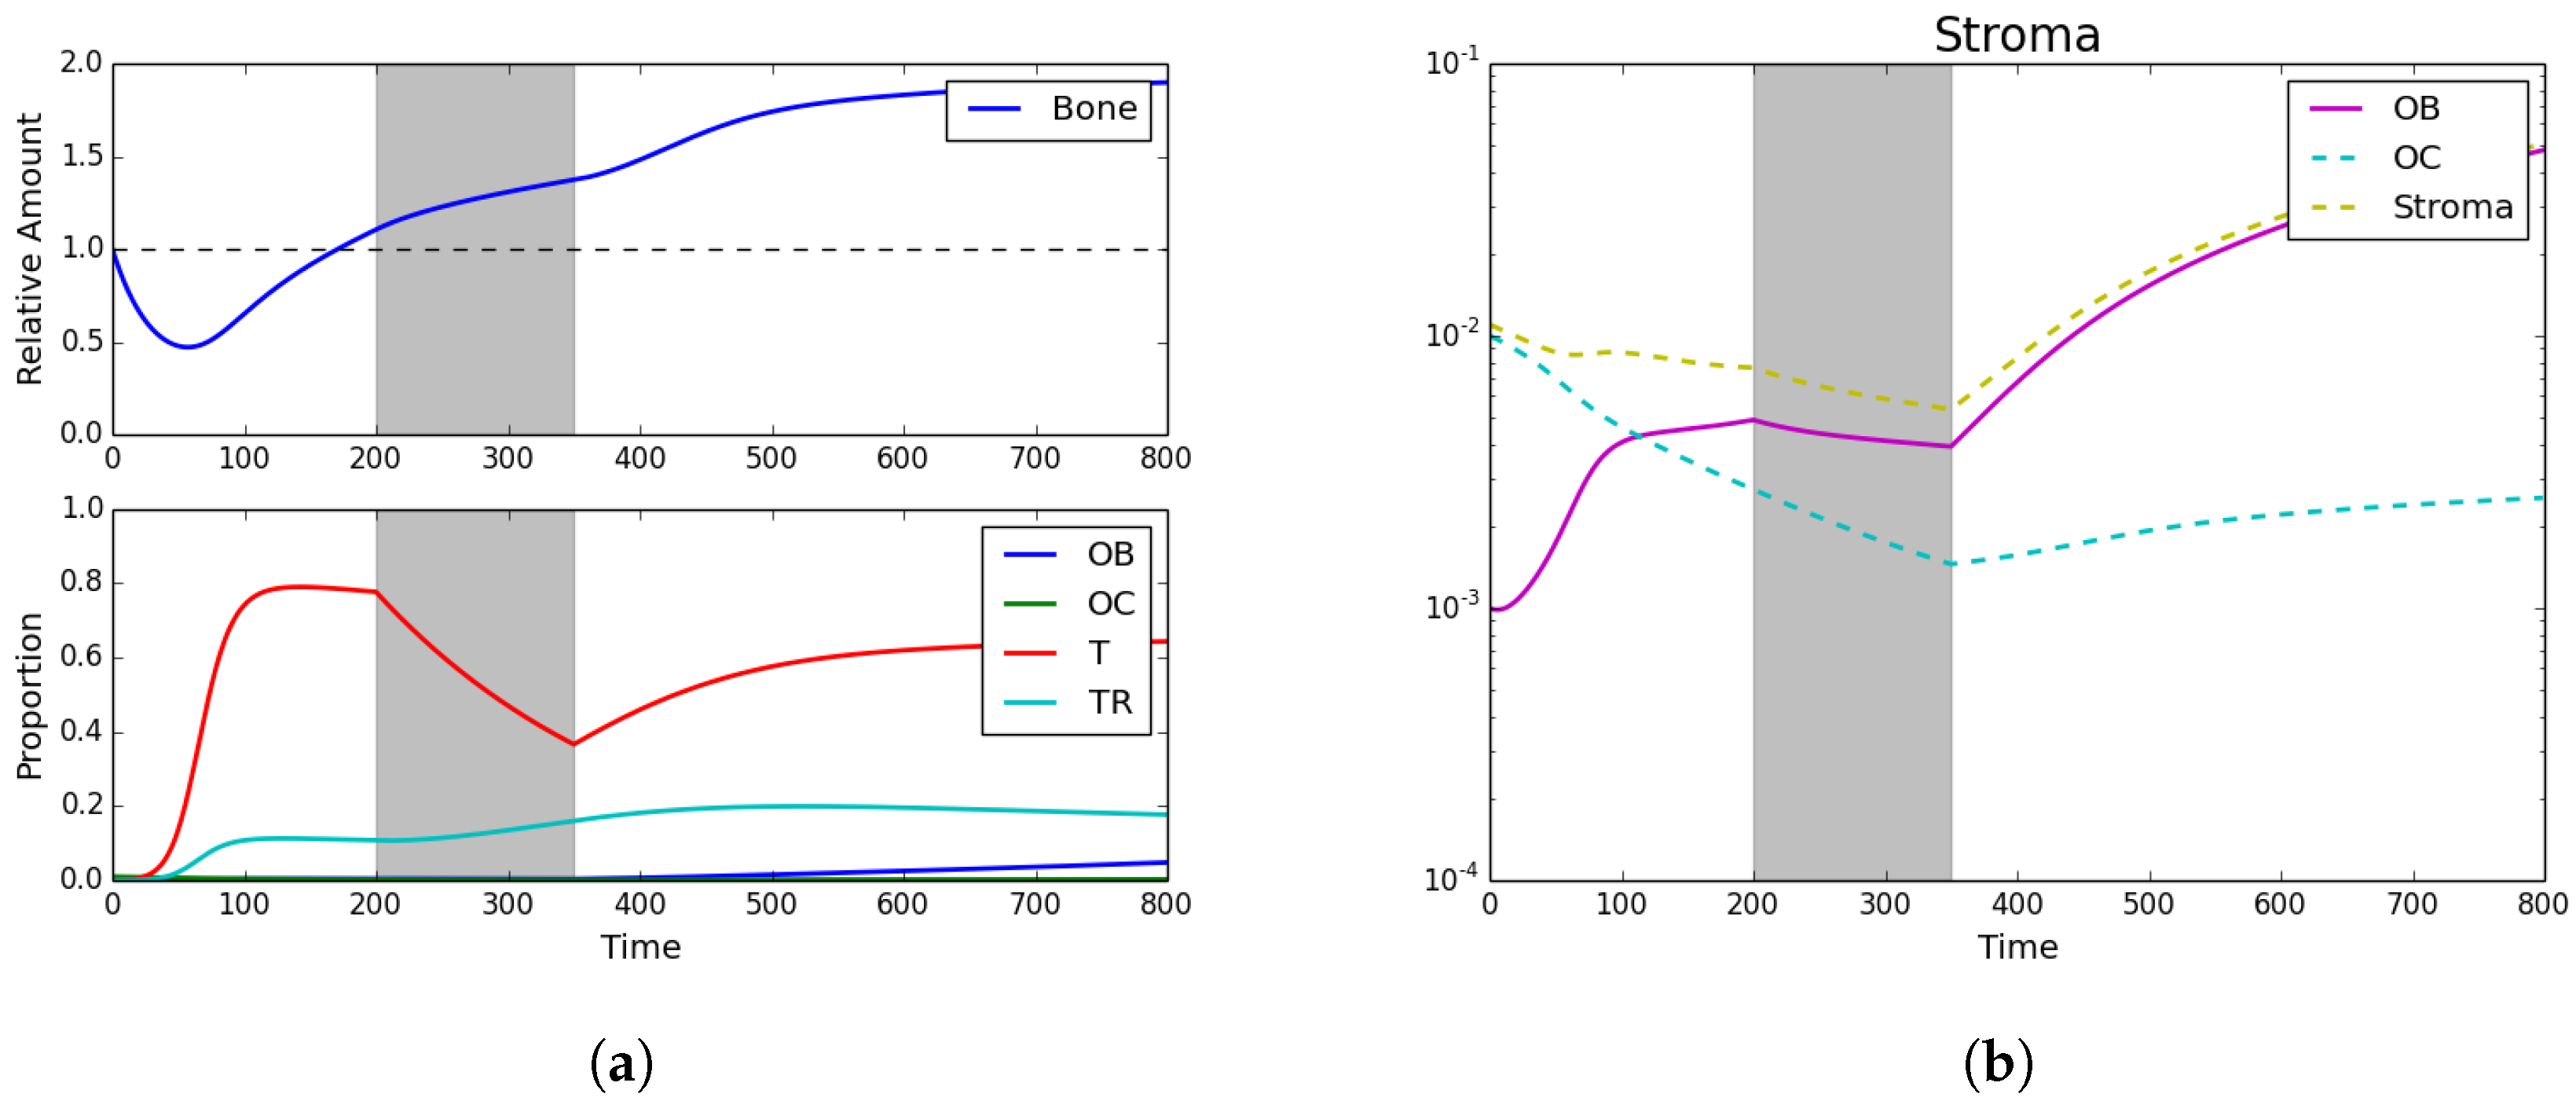
Trying to asses the impact of chemotherapy, we assumed the following initial conditions: , , , , and . Additionally, a simple chemotherapy regiment of is initiated from timesteps 200–350. The results can be seen in Figure 3 and show that, while bone continues to grow even under treatment, the tumor population takes a sharp decline highlighting the impact of chemotherapy.
3.3. Fractionated Treatment
To understand the effect of varying treatment regimens, the model was used to simulate a wide number of combinations of treatment and treatment holidays. Each regiment is characterized by dividing the treatment into periods, each period representing the same amount of time. Each slot can have a value of either (1) to signify that treatment is being applied or (0) to indicate that it is not. Thus, assuming a treatment with n different treatment periods, we can consider different treatment regimens based on combinations of treatments and breaks.
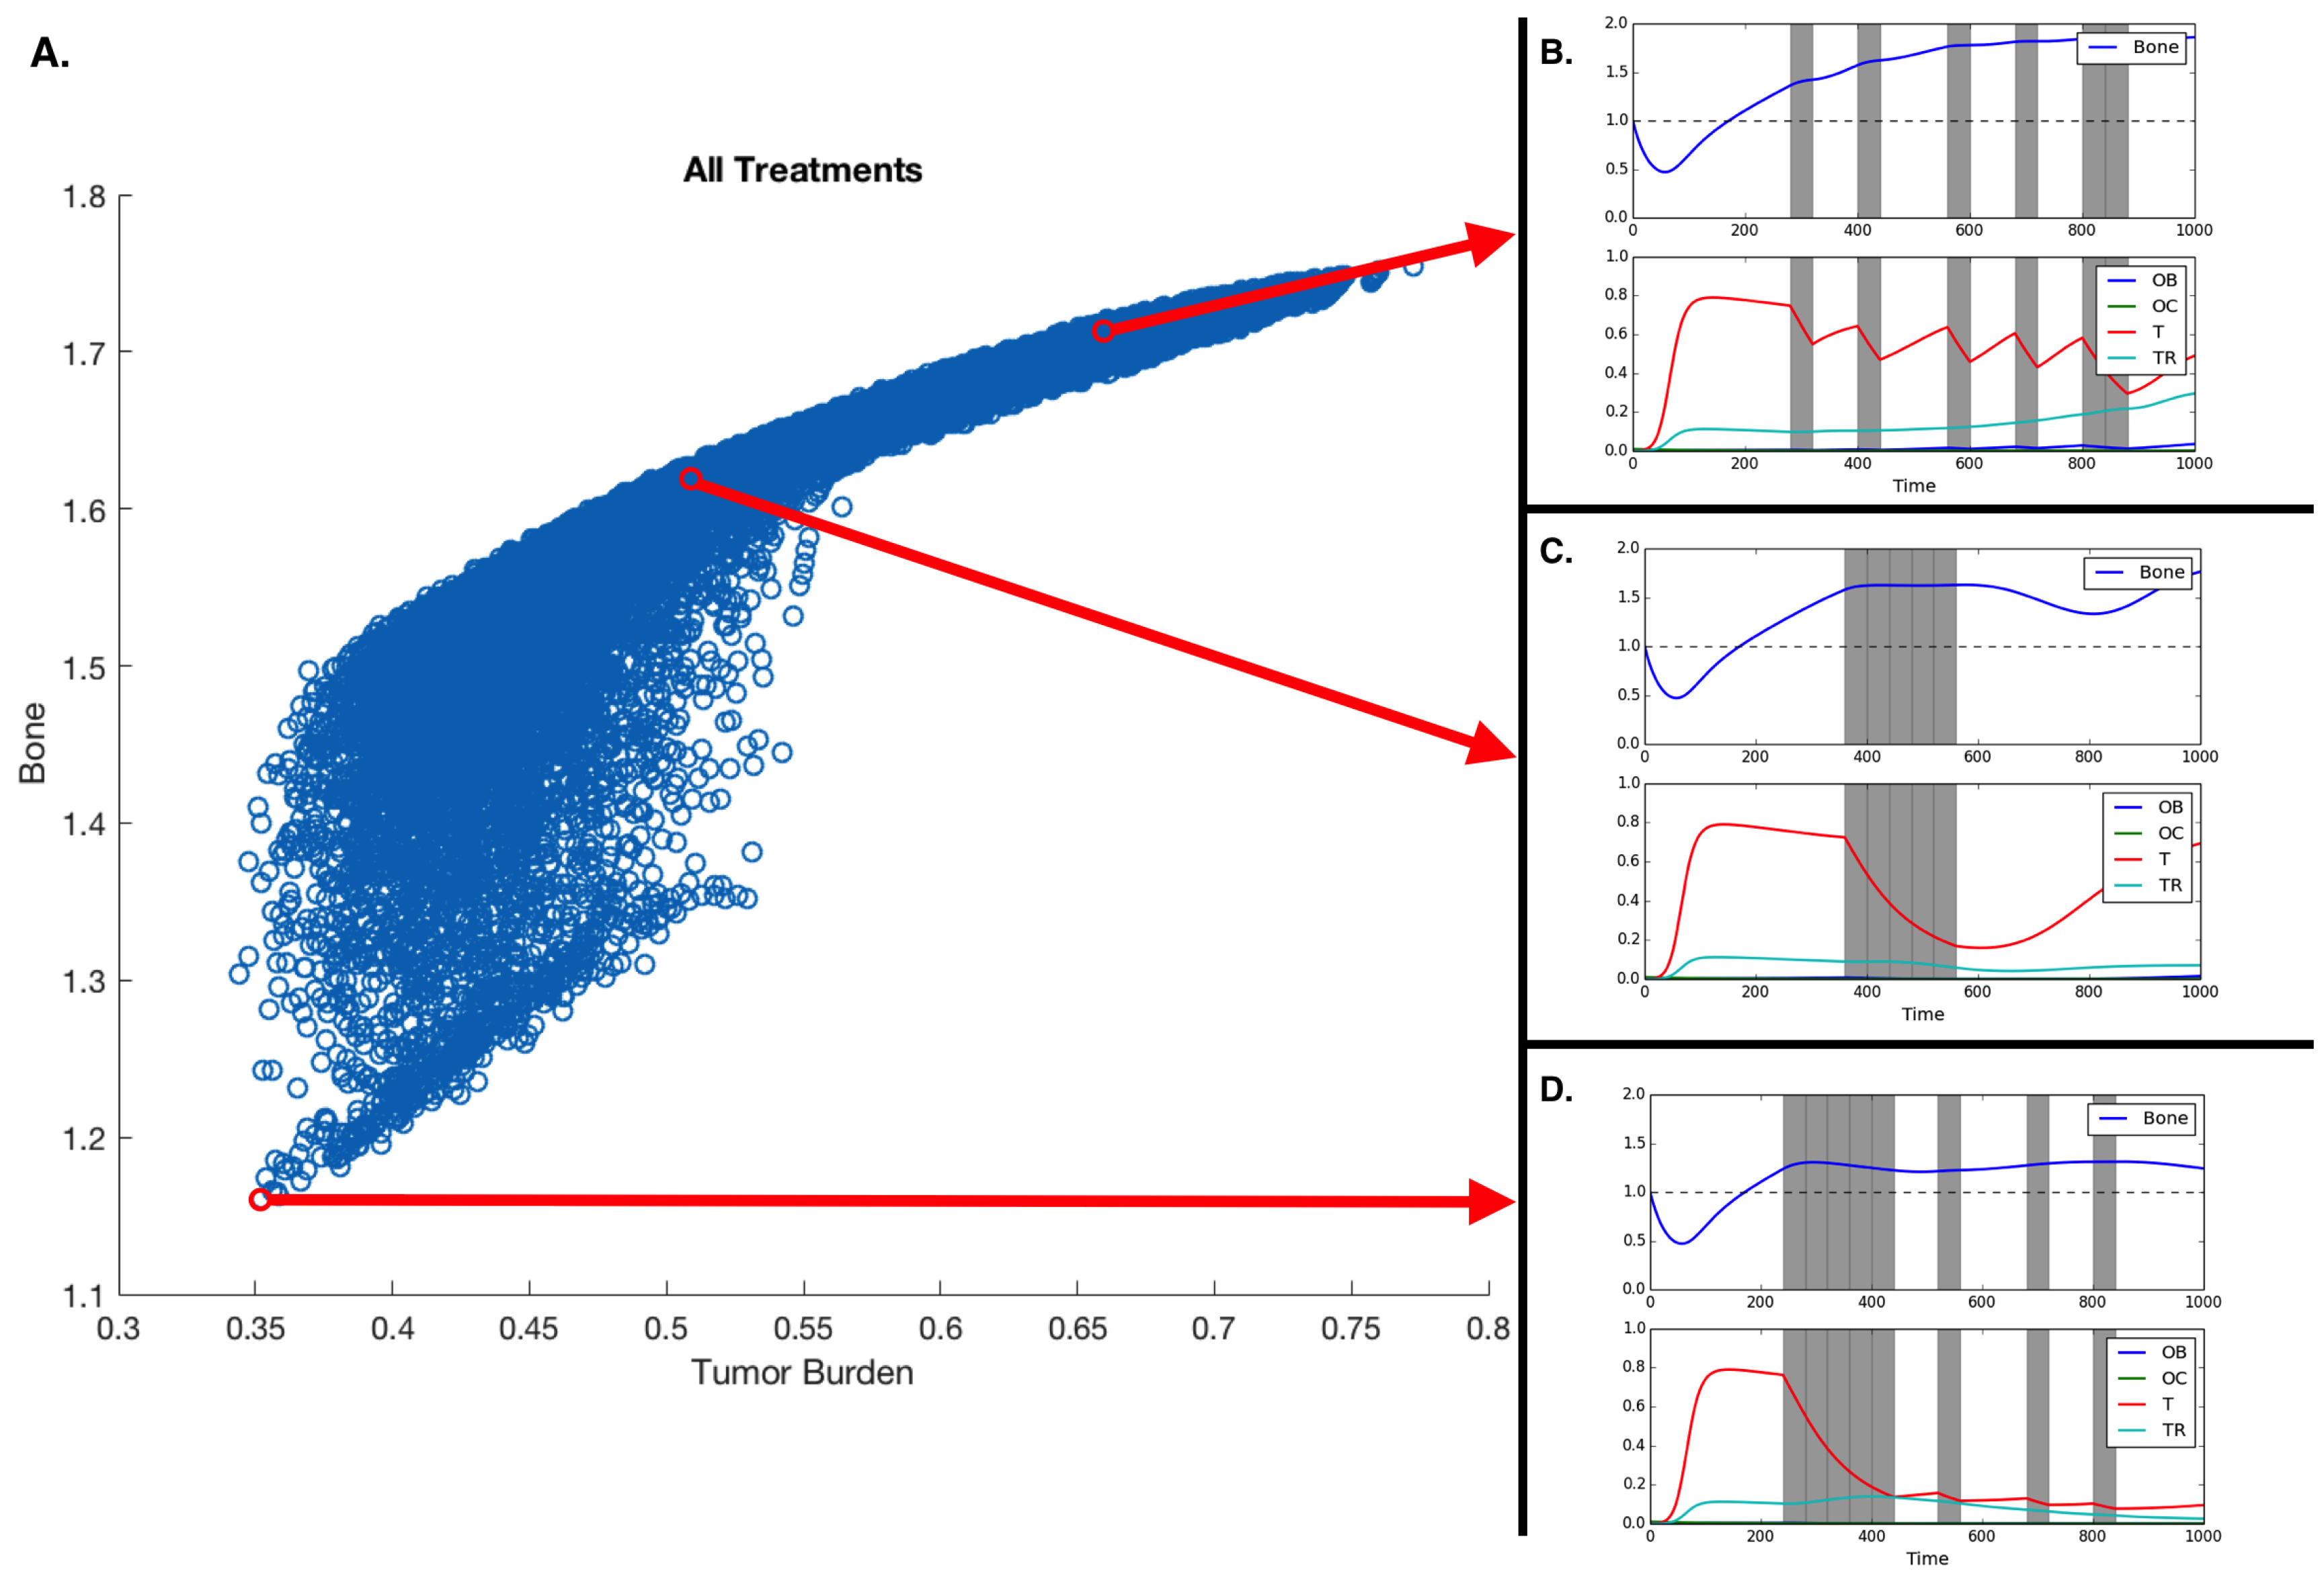
The full treatment space also contains regimens that produce favorable results at the cost of eradicating the stromal population—which would be presumably cytotoxic to the patient. Thus, we removed all treatments that reduced the stromal population below a threshold. This approach allows us to contrast continuous and a spectrum of fractionated regimens. From the space of 16 windows, where each window is 40 timesteps, Table 1 lists the top 5 treatment schedules that yielded the best results in terms of average bone size, as well as the treatment’s average tumor burden. Table 1 also lists two other treatment regimens: (1) a continuous treatment regiment and (2) a periodic treatment regiment for comparison. Although the model is qualitative and these results therefore might not translate into differences in bone and burden that are equivalent to the measurements it provides, we expect that the qualitative differences between treatment schedules would apply in vivo.
Moreover, Figure 4 shows all the potential treatments plotted with respect to average bone size and average tumor burden with three representative treatments shown to the side: a periodic treatment, a continuous treatment, and a fractionated treatment.
4. Discussion
Intra-tumor heterogeneity is increasingly recognized as the key driver of evolution in cancer. This heterogeneity also explains the emergence of resistance to both standard-of-care and targeted treatments. We presented an EGT model that captures this heterogeneity and the role of dynamic homeostasis of bone remodeling orchestrating the interactions between bone-producing cells (OBs) and bone-resorbing cells (OCs). This homeostasis can be disrupted by tumor cells, whose growth, in turn, can be prevented by the application of cytotoxic drugs such as docetaxel. Our results recapitulate not only the “vicious cycle” of the disruption and co-option of homeostatic mechanisms but also the pathological bone formation that characterizes bone metastatic prostate cancer [28]. Knowing that certain tumor phenotypes can be relatively immune to the effects of chemotherapy, our model also captures the emergence of therapy-resistant tumors.
The conventional clinical application of chemotherapy in most cancers involves the use of the drug until either the tumor enters remission, resistance renders further application of the drug ineffective, or the patient can no longer tolerate it. This approach is called maximum tolerable dosage (MTD) and has been recently contrasted with alternative approaches where the aim is to transform the disease into one that could be managed as a chronic condition. In support of this, intermittent docetaxel has been proven to be useful in metastatic prostate cancer [29,30].
Our results show that the efficacy of the treatment depends on the heterogeneity of the tumor. MTD works best if the metastases are homogeneous. Assuming heterogeneity with regard to chemotherapy resistance, a realistic scenario in metastatic prostate cancer, our model allows us to explore how different treatment durations and intervals between drug application impact tumor heterogeneity, fitness, and bone mass (see Figure 4). Unsurprisingly, the model shows that alternative treatment strategies are likely to yield better results if the metastasis contains both susceptible and resistant phenotypes.
Novel therapies where conventional drugs are used while taking into account the tumor’s evolutionary dynamics have been proposed and mathematically explored by Orlando et al. [31] under the constraint that the microenvironment of the tumor plays a reduced role and that tumor populations do not interact with each other. Our results extend beyond these constraints and show that neither conventional nor fractionated strategies are always the best solution. While our systematic search has not shown optimal treatments resembling the evolutionarily enlightened therapies proposed by Zhang et al. [22], there is some evidence that they could work in the context of metastatic prostate cancer. Our main result supports a variant: the application of fractionated therapies where full dosage is first applied for a period of time, followed by an alternation between on and off cycles.
While this finding will not have an immediate impact on how fractionated treatments are delivered, it shows that the model captures the basic biological principles of bone metastatic prostate cancer, allowing us to explore treatment strategies in a meaningful way. Models, like the one we have presented here, can be used to better understand evolutionarily enlightened treatments. EGT is a well known mathematical tool in which to frame evolutionary questions, and our EGT model allows us to include the microenvironmental selection as well as cell–cell interactions in the game dynamics. We are aware that, by its own nature, mathematical models constitute a simplification of the reality being modeled. For example, our model does not take into consideration the spatial interplay that is known to impact EGT dynamics of cancer [14,32] and has been recently shown to play a key role in the efficacy of some innovative applications of conventional treatments in cancer [33]. We expect that our results could be quantitatively different, as we assume different costs of resistance, treatment impact, or spatial structure. However, the principle of a period of continuous application followed by periods of on and off cycles is expected to hold when the parameters change to reflect different tumors and treatment efficacies.
We measured the impact of these different treatment schemes by looking at their effect on the two tumor populations; however, in bone metastatic prostate cancer, there are other metrics that need to be considered: total dosage and microenvironmental impact. As shown in Figure 2, tumor growth leads to an increase in bone, growth that can, in some cases, be curtailed by chemotherapy (see Figure 3). Figure 4 shows that the scheduling of chemotherapy can have a substantial impact on the amount of pathological bone formed, a consideration that is clinically important yet rarely included in mathematical models of bone metastases. The examples offer the interesting possibility that a sustained application of chemotherapy followed by treatment holidays and subsequent applications of fractionated therapy could lead to control not only of tumor growth but also of bone growth (Figure 4D; although, see Kaznatcheev [34] for a perspective on the limits of tumor burden control in models like ours).
While the total dosage is slightly different, the purely continuous and the (approximately) periodic treatments shown in Figure 4A,B demonstrate bone increases over time.
Our EGT model, by combining tumor, stroma, and bone microenvironment, constitutes a platform in which various standard-of-care treatment strategies for metastatic prostate cancer patients that can minimize dosage and bone disease—including, but are not limited to, bisphosphonates, anti-RANKL, and hormonal therapies—can be investigated. We have investigated some of those treatment options before [2] using agent-based approaches. However, the combination of agent-based and EGT approaches to tackle questions regarding the evolutionary dynamics of bone metastatic prostate cancer and of resistance to standard-of-care treatments presents several benefits. This includes confidence in the results obtained by any single model (assuming consistency between the two models) as well as the ability to understand and describe both local and systemic disease dynamics.
Acknowledgments
We would like to acknowledge Heiko Enderling from Moffitt’s Integrated Mathematical Oncology department for the organization of the HIP-IMO program that led to this work. A.A., C.C.L., and D.B. were partly funded by an NCI U01 (NCI) U01CA202958-01 and a Moffitt Team Science Award. A.A. was partly funded by a Department of Defense Prostate Cancer Research Program (W81XWH-15-1-0184) fellowship.
Author Contributions
P.W., A.K., C.L. and D.B. conceived and designed the experiments. P.W., A.K. and D.B. performed the experiments. P.W., D.B., A.A. and A.K. analyzed the data. P.W., A.K., C.L., A.A. and D.B. wrote the paper.
Conflicts of Interest
The authors declare no conflict of interest.
References
- National Cancer Institute. Cancer Stat Facts: Prostate Cancer. Available online: https://seer.cancer.gov/statfacts/html/prost.html (accessed on 1 August 2017).
- Araujo, A.; Cook, L.M.; Lynch, C.C.; Basanta, D. An integrated computational model of the bone microenvironment in bone-metastatic prostate cancer. Cancer Res. 2014, 74, 2391–2401. [Google Scholar] [CrossRef] [PubMed]
- Cook, L.M.; Araujo, A.; Pow-Sang, J.M.; Budzevich, M.M.; Basanta, D.; Lynch, C.C. Predictive computational modeling to define effective treatment strategies for bone metastatic prostate cancer. Sci. Rep. 2016, 6, 29384. [Google Scholar] [CrossRef] [PubMed]
- Heppner, G.H. Tumor Heterogeneity. Cancer Res. 1984, 44, 2259–2265. [Google Scholar] [PubMed]
- Gallaher, J.; Cook, L.M.; Gupta, S.; Araujo, A.; Dhillon, J.; Park, J.Y.; Scott, J.G.; Pow-Sang, J.; Basanta, D.; Lynch, C.C. Improving treatment strategies for patients with metastatic castrate resistant prostate cancer through personalized computational modeling. Clin. Exp. Metastasis 2014, 31, 991–999. [Google Scholar] [CrossRef] [PubMed]
- Kaznatcheev, A. Two conceptions of evolutionary games: Reductive vs effective. BioRxiv 2017, 231993. [Google Scholar] [CrossRef]
- Kaznatcheev, A. Effective games and the confusion over spatial structure. Proc. Natl. Acad. Sci. USA 2018, 115, 201719031. [Google Scholar] [CrossRef] [PubMed]
- Ryser, M.D.; Nigam, N.; Komarova, S.V. Mathematical Modeling of Spatio-Temporal Dynamics of a Single Bone Multicellular Unit. J. Bone Min. Res. 2009, 24, 860–870. [Google Scholar] [CrossRef] [PubMed]
- Ryser, M.D.; Qu, Y.; Komarova, S.V. Osteoprotegerin in Bone Metastases: Mathematical Solution to the Puzzle. PLoS Comput. Biol. 2012, 8, e1002703. [Google Scholar] [CrossRef] [PubMed]
- Buenzli, P.R.; Pivonka, P.; Gardiner, B.S. Modelling the anabolic response of bone using a cell population model. J. Theor. Biol. 2012, 307, 42–52. [Google Scholar] [CrossRef] [PubMed]
- Tomlinson, I.P.M.; Bodmer, W.F. Modelling the consequences of interactions between tumour cells. Br. J. Cancer 1997, 75, 157–160. [Google Scholar] [CrossRef] [PubMed]
- Tomlinson, I.P. Game-theory models of interactions between tumour cells. Eur. J. Cancer 1997, 33, 1495–1500. [Google Scholar] [CrossRef]
- Basanta, D.; Hatzikirou, H.; Deutsch, A. Studying the emergence of invasiveness in tumours using game theory. Eur. Phys. J. B 2008, 63, 393–397. [Google Scholar] [CrossRef]
- Kaznatcheev, A.; Scott, J.G.; Basanta, D. Edge effects in game-theoretic dynamics of spatially structured tumours. J. R. Soc. Interface 2015, 12, 20150154. [Google Scholar] [CrossRef] [PubMed]
- Basanta, D.; Simon, M.; Hatzikirou, H.; Deutsch, A. Evolutionary game theory elucidates the role of glycolysis in glioma progression and invasion. Cell Prolif. 2008, 41, 980–987. [Google Scholar] [CrossRef] [PubMed]
- Basanta, D.; Scott, J.G.; Fishman, M.N.; Ayala, G.; Hayward, S.W.; Anderson, A.R.A. Investigating prostate cancer tumour-stroma interactions: clinical and biological insights from an evolutionary game. Br. J. Cancer 2012, 106, 174–181. [Google Scholar] [CrossRef] [PubMed] [Green Version]
- Kaznatcheev, A.; Vander Velde, R.; Scott, J.G.; Basanta, D. Cancer treatment scheduling and dynamic heterogeneity in social dilemmas of tumour acidity and vasculature. Br. J. Cancer 2017, 116, 785–792. [Google Scholar] [CrossRef] [PubMed]
- Dingli, D.; Chalub, F.A.C.C.; Santos, F.C.; van Segbroeck, S.; Pacheco, J.M. Cancer phenotype as the outcome of an evolutionary game between normal and malignant cells. Br. J. Cancer 2009, 101, 1130–1136. [Google Scholar] [CrossRef] [PubMed]
- West, J.; Ma, Y.; Newton, P.K. Capitalizing on competition: An evolutionary model of competitive release in metastatic castration resistant prostate cancer treatment. BioRxiv 2018. [Google Scholar] [CrossRef]
- Bilezikian, J.P.; Raisz, L.G.; Martin, T.J. Principles of Bone Biology, 3rd ed.; Academic Press/Elsevier: San Diego, CA, USA, 2008. [Google Scholar]
- Cook, L.M.; Shay, G.; Araujo, A.; Lynch, C.C. Integrating new discoveries into the “vicious cycle” paradigm of prostate to bone metastases. Cancer Metastasis Rev. 2014, 33, 511–525. [Google Scholar] [CrossRef] [PubMed]
- Zhang, J.; Cunningham, J.J.; Brown, J.S.; Gatenby, R.A. Integrating evolutionary dynamics into treatment of metastatic castrate-resistant prostate cancer. Nat. Commun. 2017, 8, 1816. [Google Scholar] [CrossRef] [PubMed]
- Kaznatcheev, A. Evolutionary Dynamics of Cancer in the Bone. Theory, Evolution, and Games Group, 2015. Available online: https://egtheory.wordpress.com/2015/12/06/bone-cancer/ (accessed on 6 December 2015).
- O’Neill, A.J.; Prencipe, M.; Dowling, C.; Fan, Y.; Mulrane, L.; Gallagher, W.M.; O’Connor, D.; O’Connor, R.; Devery, A.; Corcoran, C.; et al. Characterisation and manipulation of docetaxel resistant prostate cancer cell lines. Mol. Cancer 2011, 10, 126. [Google Scholar]
- Hwang, C. Overcoming docetaxel resistance in prostate cancer: a perspective review. Ther. Adv. Med. Oncol. 2012, 4, 329–340. [Google Scholar] [CrossRef] [PubMed]
- Corcoran, C.; Rani, S.; O’Brien, K.; O’Neill, A.; Prencipe, M.; Sheikh, R.; Webb, G.; McDermott, R.; Watson, W.; Crown, J.; et al. Docetaxel-resistance in prostate cancer: Evaluating associated phenotypic changes and potential for resistance transfer via exosomes. PLoS ONE 2012, 7, e50999. [Google Scholar] [CrossRef] [PubMed]
- Henríquez, I.; Rodríguez-Antolín, A.; Cassinello, J.; Gonzalez San Segundo, C.; Unda, M.; Gallardo, E.; López-Torrecilla, J.; Juarez, A.; Arranz, J. Consensus statement on definition, diagnosis, and management of high-risk prostate cancer patients on behalf of the spanish groups of uro-oncology societies uroncor, guo, and sogug. Clin. Transl. Oncol. 2018, 20, 392–401. [Google Scholar] [CrossRef] [PubMed]
- Keller, E.T.; Brown, J. Prostate cancer bone metastases promote both osteolytic and osteoblastic activity. J. Cell Biochem. 2004, 91, 718–729. [Google Scholar] [CrossRef] [PubMed]
- Beer, T.M.; Garzotto, M.; Henner, W.D.; Eilers, K.M.; Wersinger, E.M. Multiple cycles of intermittent chemotherapy in metastatic androgen-independent prostate cancer. Br. J. Cancer 2004, 91, 1425. [Google Scholar] [CrossRef] [PubMed]
- Mountzios, I.; Bournakis, E.; Efstathiou, E.; Varkaris, A.; Wen, S.; Chrisofos, M.; Deliveliotis, C.; Alamanis, C.; Anastasiou, I.; Constantinides, C.; et al. Intermittent docetaxel chemotherapy in patients with castrate-resistant prostate cancer. Urology 2011, 77, 682–687. [Google Scholar] [CrossRef] [PubMed]
- Orlando, P.A.; Gatenby, R.A.; Brown, J.S. Cancer treatment as a game: integrating evolutionary game theory into the optimal control of chemotherapy. Phys. Biol. 2012, 9, 065007. [Google Scholar] [CrossRef] [PubMed]
- Nanda, M.; Durrett, R. Spatial evolutionary games with weak selection. Proc. Natl. Acad. Sci. USA 2017, 114, 6046–6051. [Google Scholar] [CrossRef] [PubMed]
- Bacevic, K.; Noble, R.; Soffar, A.; Ammar, O.W.; Boszonyik, B.; Prieto, S.; Vincent, C.; Hochberg, M.E.; Krasinska, L.; Fisher, D. Spatial competition constrains resistance to targeted cancer therapy. Nat. Commun. 2017, 8, 1995. [Google Scholar] [CrossRef] [PubMed]
- Kaznatcheev, A. Drug Holidays and Losing Resistance with Replicator Dynamics. Theory, Evolution, and Games Group, 2016. Available online: https://egtheory.wordpress.com/2016/09/02/drug-holidays/ (accessed on 2 September 2016).
Figure 1.
Tumor Introduction. (a) Bone size and strategy density; (b) stroma.Homeostatic populations were observed by setting , , , and . Subfigure (a) shows the model’s recapitulation of the classic bone fluctuation characteristic of bone remodeling units and no distinct strategies leftover. Furthermore, subfigure (b) shows the decrease in stroma after the bone remodeling event. Note the log-scale for the bottom subplot.

Figure 2.
Tumor introduction. (a) Bone size and strategy density; (b) stroma. Strategy phenotypes in the bottom of (a) were observed to be dominated by the tumor phenotype. Subfigure (b) and the top of (a) showed the characteristic PCa takeover of the bone remodeling complex and the resultant vicious cycle causing dramatic bone growth.

Figure 3.
Standard chemotherapy. (a) Bone size and strategy density; (b) stroma. Here we see the impact of standard chemotherapy regimens that decrease the PCa-susceptible population and increase the PCa-resistant population. Assuming initial densities of the different population as follows: , , , and .

Figure 4.
Treatment and treatment holiday combinations. Better treatments are those that reduce tumor burden and extra pathological bone. (A) All potential treatments over 16 40-timestep periods, plotted with respect to average tumor burden and average bone size. (B,C,D) Treatment regiments showing an example of a fractionated treatment (B), continuous block treatment (C), and a fractionated follow-up regiment (D). Assuming initial densities of the different population as follows: , , , and .


Table 1.
The top five treatments as well as an example of continuous and periodic treatments. In the 1st column, each 0 represents a treatment holiday and each 1 represents the application of chemotherapy. The bone size and tumor burden are dimensionless and rounded to three decimal places. Given the qualitative nature of the model, the goal of this table is to show that different treatment schedules impact bone size and tumor burden differently, but the quantitative differences between treatments might not be conserved in reality.
| Treatment Schedule | Bone Size | Average Tumor Burden |
|---|---|---|
| 0000000000000000 | 1.754 | 0.773 |
| 1111100100010010 | 1.160 | 0.352 |
| 1111010101000001 | 1.163 | 0.358 |
| 1111010100100100 | 1.165 | 0.358 |
| 1111011000010010 | 1.166 | 0.356 |
| 1110110101000100 | 1.172 | 0.366 |
| 0001111100000000 | 1.615 | 0.512 |
| 0100100010010011 | 1.709 | 0.666 |
© 2018 by the authors. Licensee MDPI, Basel, Switzerland. This article is an open access article distributed under the terms and conditions of the Creative Commons Attribution (CC BY) license (http://creativecommons.org/licenses/by/4.0/).
Share and Cite
MDPI and ACS Style
Warman, P.I.; Kaznatcheev, A.; Araujo, A.; Lynch, C.C.; Basanta, D. Fractionated Follow-Up Chemotherapy Delays the Onset of Resistance in Bone Metastatic Prostate Cancer. Games 2018, 9, 19. https://doi.org/10.3390/g9020019
AMA Style
Warman PI, Kaznatcheev A, Araujo A, Lynch CC, Basanta D. Fractionated Follow-Up Chemotherapy Delays the Onset of Resistance in Bone Metastatic Prostate Cancer. Games. 2018; 9(2):19. https://doi.org/10.3390/g9020019
Chicago/Turabian StyleWarman, Pranav I., Artem Kaznatcheev, Arturo Araujo, Conor C. Lynch, and David Basanta. 2018. "Fractionated Follow-Up Chemotherapy Delays the Onset of Resistance in Bone Metastatic Prostate Cancer" Games 9, no. 2: 19. https://doi.org/10.3390/g9020019
Note that from the first issue of 2016, this journal uses article numbers instead of page numbers. See further details here.