Nano-Scale Au Supported on Carbon Materials for the Low Temperature Water Gas Shift (WGS) Reaction

 , and
, and
Abstract
: Au-based catalysts supported on carbon materials with different structures such as graphite (G) and fishbone type carbon nanofibers (CNF-F) were prepared using two different methods (impregnation and gold-sol) to be tested in the water gas shift (WGS) reaction. Atomic absorption spectrometry, transmission electron microscopy (TEM), temperature-programmed oxidation (TPO), X-ray diffraction (XRD), Raman spectroscopy, elemental analyses (CNH), N2 adsorption-desorption analysis, temperature-programmed reduction (TPR) and temperature-programmed decomposition were employed to characterize both the supports and catalysts. Both the crystalline nature of the carbon supports and the method of gold incorporation had a strong influence on the way in which Au particles were deposited on the carbon surface. The higher crystallinity and the smaller and well dispersed Au particle size were, the higher activity of the catalysts in the WGS reaction was noted. Finally, catalytic activity showed an important dependence on the reaction temperature and steam-to-CO molar ratio.1. Introduction
Different chemical reactions such as steam reforming (SRM) or autothermal reforming (ATR) of fuels (i.e., natural gas, gasoline, diesel, etc.) produces a H2-rich fuel gas (reformate) containing 5–20 vol% CO depending on the steam-to-carbon and air-to-fuel ratios in the feed. These reformates must be further processed to reduce the CO concentration because of the poisoning effect of CO in, for example, polymer electrolyte fuel cell (PEFC) applications. The Water Gas Shift (WGS) reaction (CO + H2O ↔ CO2 + H2; ΔH = −41.1 kJ/mol) is used in most fuel processing schemes to convert CO into CO2.
There are four general types of water gas shift catalysts: promoted iron oxide catalysts for high temperatures (623–723 K), copper-zinc oxide catalysts for low temperatures (463–523 K), cobalt and molybdenum sulfides catalysts (sulfur-tolerant), and modified copper-zinc ones for medium temperatures (548–623 K) [1]. In addition, precious metal-based catalysts (mainly platinum and gold) have been also considered for removing CO in streams used for fuel cell applications [1–9]. Among them, Pt, Rh, Ru, Au, and Pd deposited on partially reducible oxides (ceria [10–12], zirconia [13,14], titania [15], iron oxides [16], and mixed oxides such as ceria–zirconia) have been the most investigated. Specifically, gold-supported catalysts with remarkably high activity for the low temperature WGS reaction have been reported in the literature [17,18].
In a previous work, the effect of both operating conditions and catalyst pretreatment on the high pressure WGS reaction was investigated. A bench scale set-up, using a sulfur-resistant commercial catalyst and an industrial coal-derived feeding (from IGCC-ELCOGAS plant, Puertollano, Spain) were considered [19]. In addition, a mechanistic kinetic model based on the direct oxidation of CO predicted the CO2 formation within the range of experimental conditions [20].
Carbon materials have shown to be better catalytic supports than oxides [21–23], due to their specific properties, such as resistance to acid and basic environments, the possibility to control its porosity and surface chemistry, and the capacity for easily recovering metals by burning the supports [24,25]. Activated carbon (AC) and graphite (G) have been widely employed as catalyst supports in a wide range of reactions [26–28]. Carbon nanostructures such as carbon nanofibers (CNF) are characterized by high aspect ratio bodies with enhanced mechanical strength and surface areas in the range 10–200 m2 g−1 [24,29]. They present a large amount of edges in the lattice and basal regions, providing increased metal-support interactions [29] and lower mass transfer constraints associated with their mesoporous character [30]. CNF are usually classified into three types depending on how the graphene sheets line up with respect to the fiber axis: in platelet type (CNF-P), the graphene sheets are lined up perpendicular to the fiber axis; in ribbon type (CNF-R), graphene sheets are parallel to the axis; and, finally, in fishbone type (CNF-F), the graphene sheets are inclined with respect to the fiber axis. Accordingly, CNF have been employed in a number of hydrogenation [31], oxidation [32–34], Fischer-Tropsch [33] or ammonia synthesis [34] reactions.
The aim of this work was to study the catalytic activity for the WGS reaction of gold-supported catalysts, where the active metal was incorporated to carbon materials with different structural order: high crystalline graphite (G) and partially ordered fishbone carbon nanofibers (CNF-F). The gold incorporation to these supports was conducted by both impregnation and gold-sol (immobilization) methods. A deep characterization was carried out in order to correlate the physical-chemical characteristics of the prepared catalysts with their catalytic performances.
2. Results and Discussion
2.1. Support Characterization
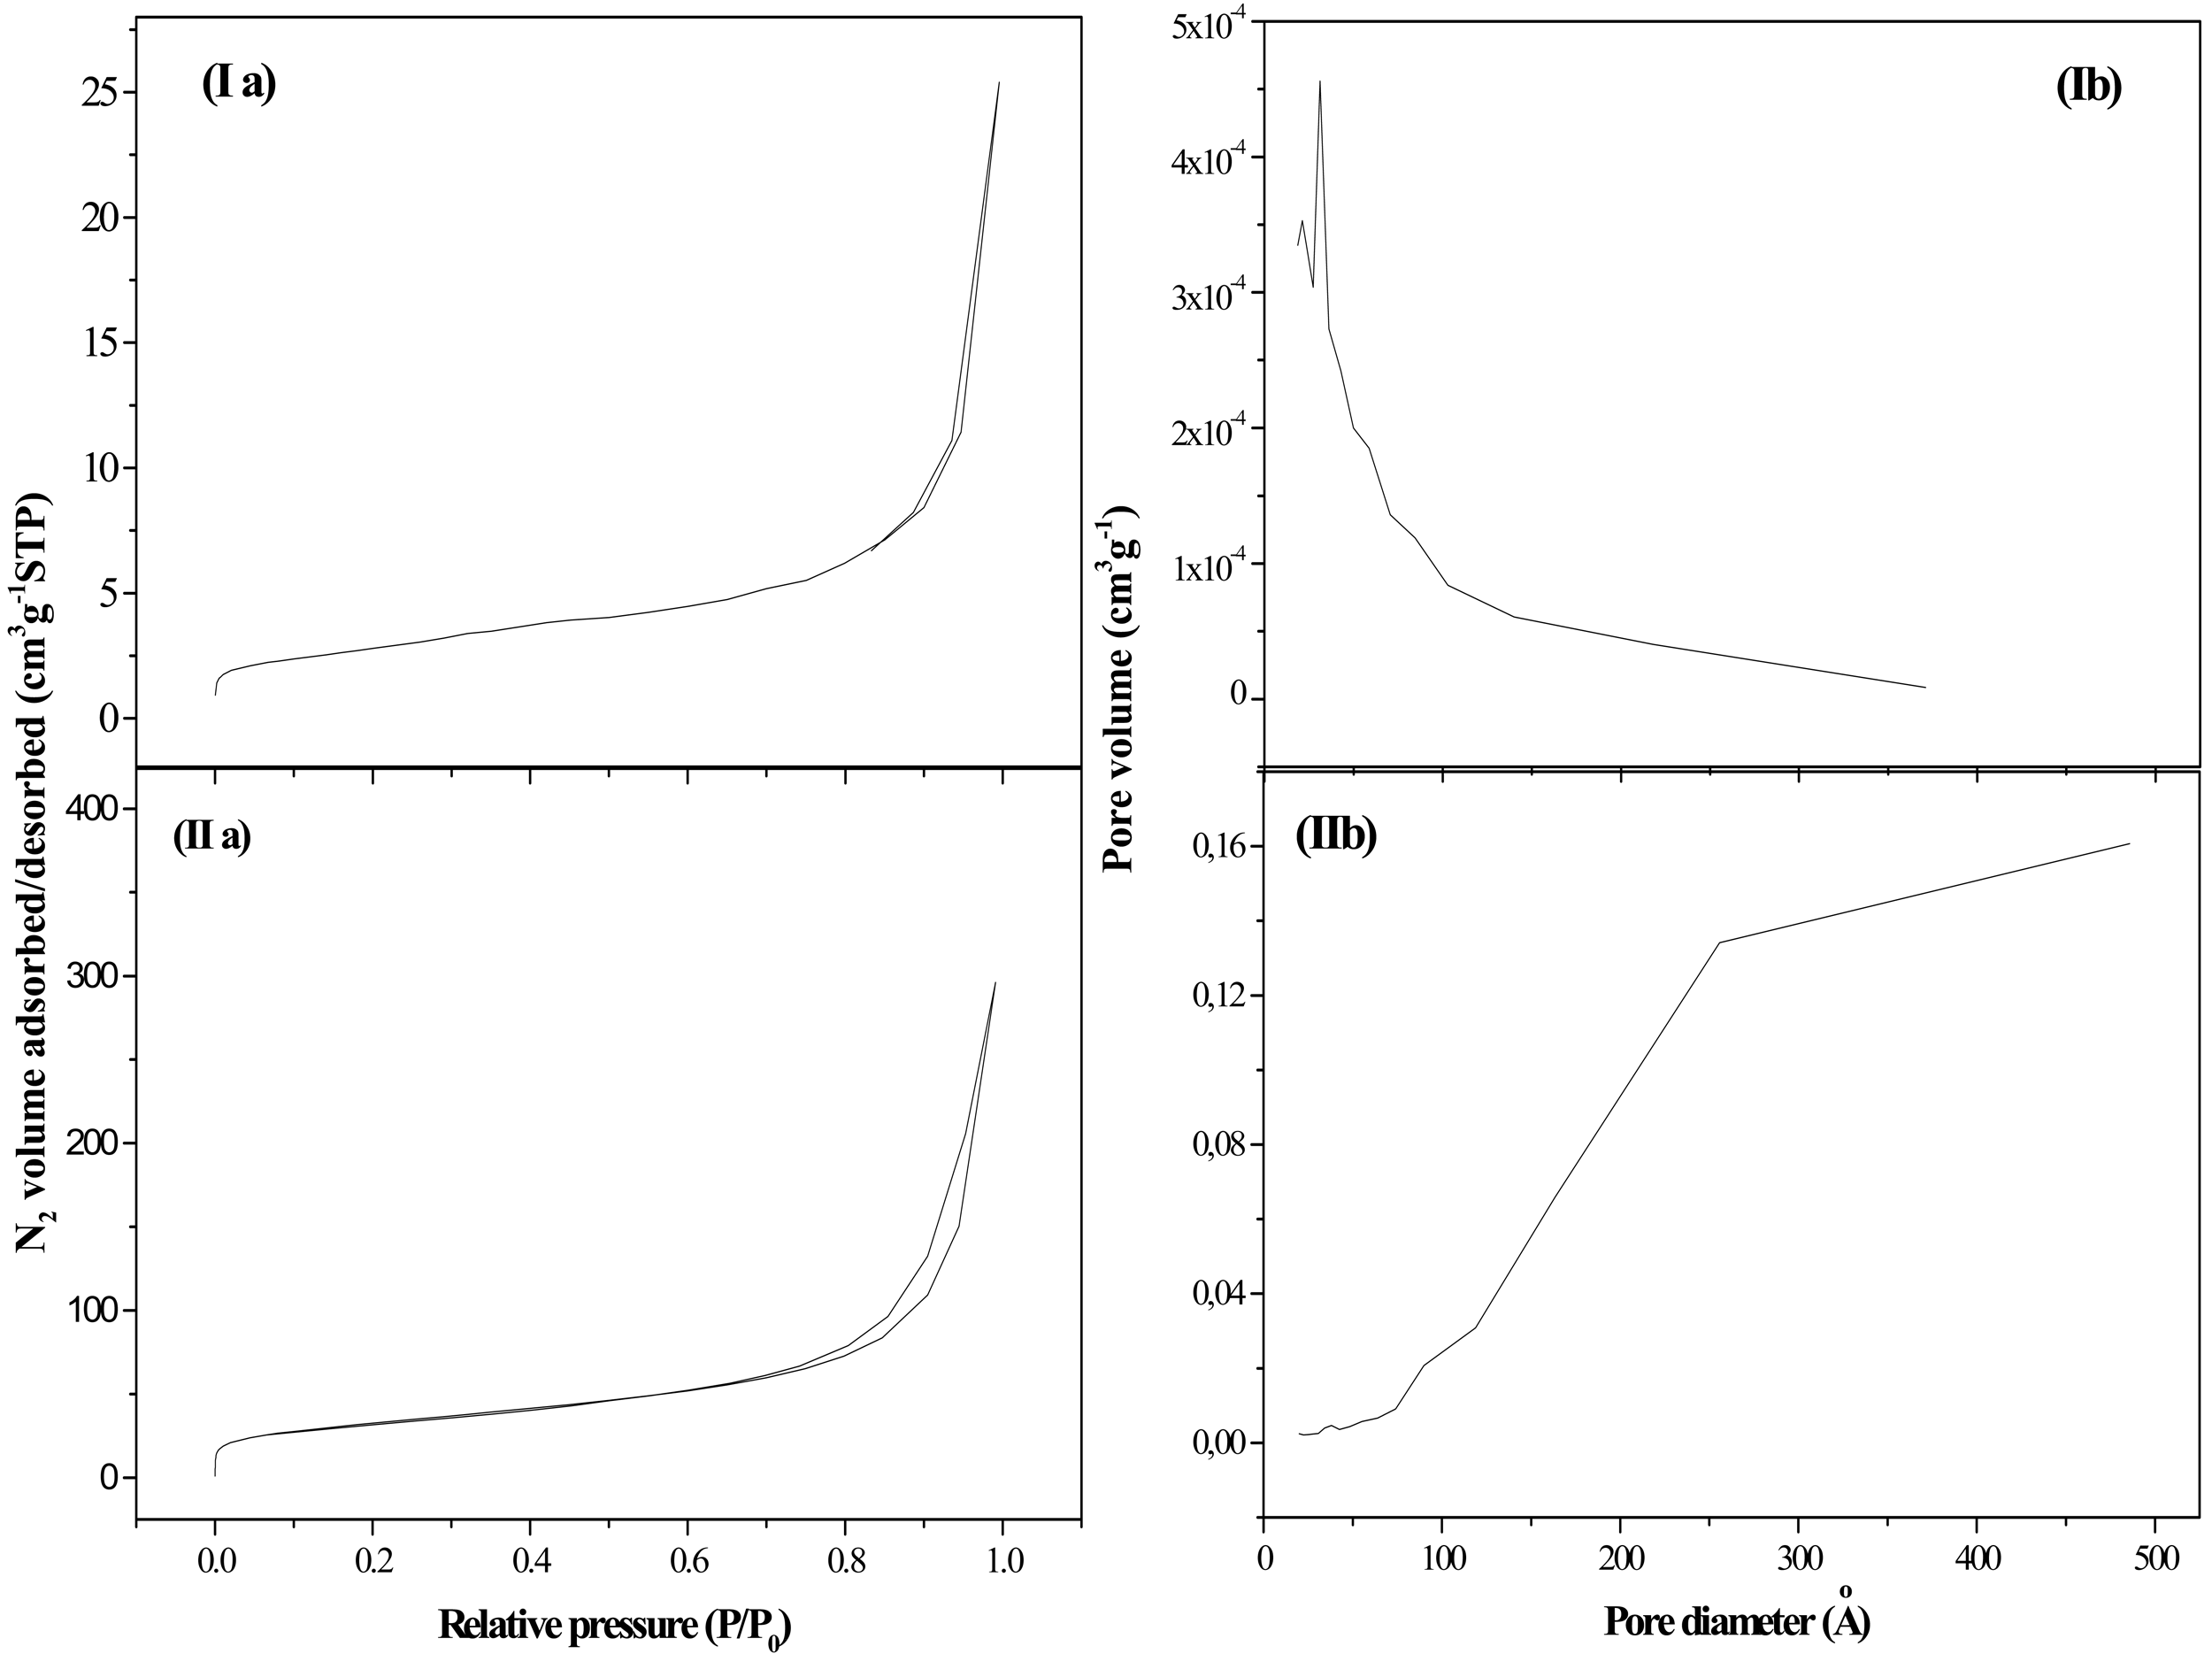
N2 adsorption-desorption isotherms and pore size distributions are presented in Figure 1. The associated textural parameters are listed in Table 1. Graphite (G) was characterized by a low surface area and a limited porosity, showing a type IV adsorption/desorption isotherm (Figure 1(Ia)) with a very small volume of adsorbed N2, which agrees with the low porosity of this material [35]. The pore size distribution showed a narrow peak centered at 33 Å (Figure 1(Ib)). Fishbone type CNF, mesoporous in nature, had a BET surface area and pore volume in the range commonly accepted for these materials (10–300 m2 g−1) [34]. The profiles of the N2 adsorption/desorption isotherms corresponding to these materials (Figure 1(IIa)) can be also assigned to type IV, where the predominant pore size was 256 Å (Figure 1(IIb)) [36].
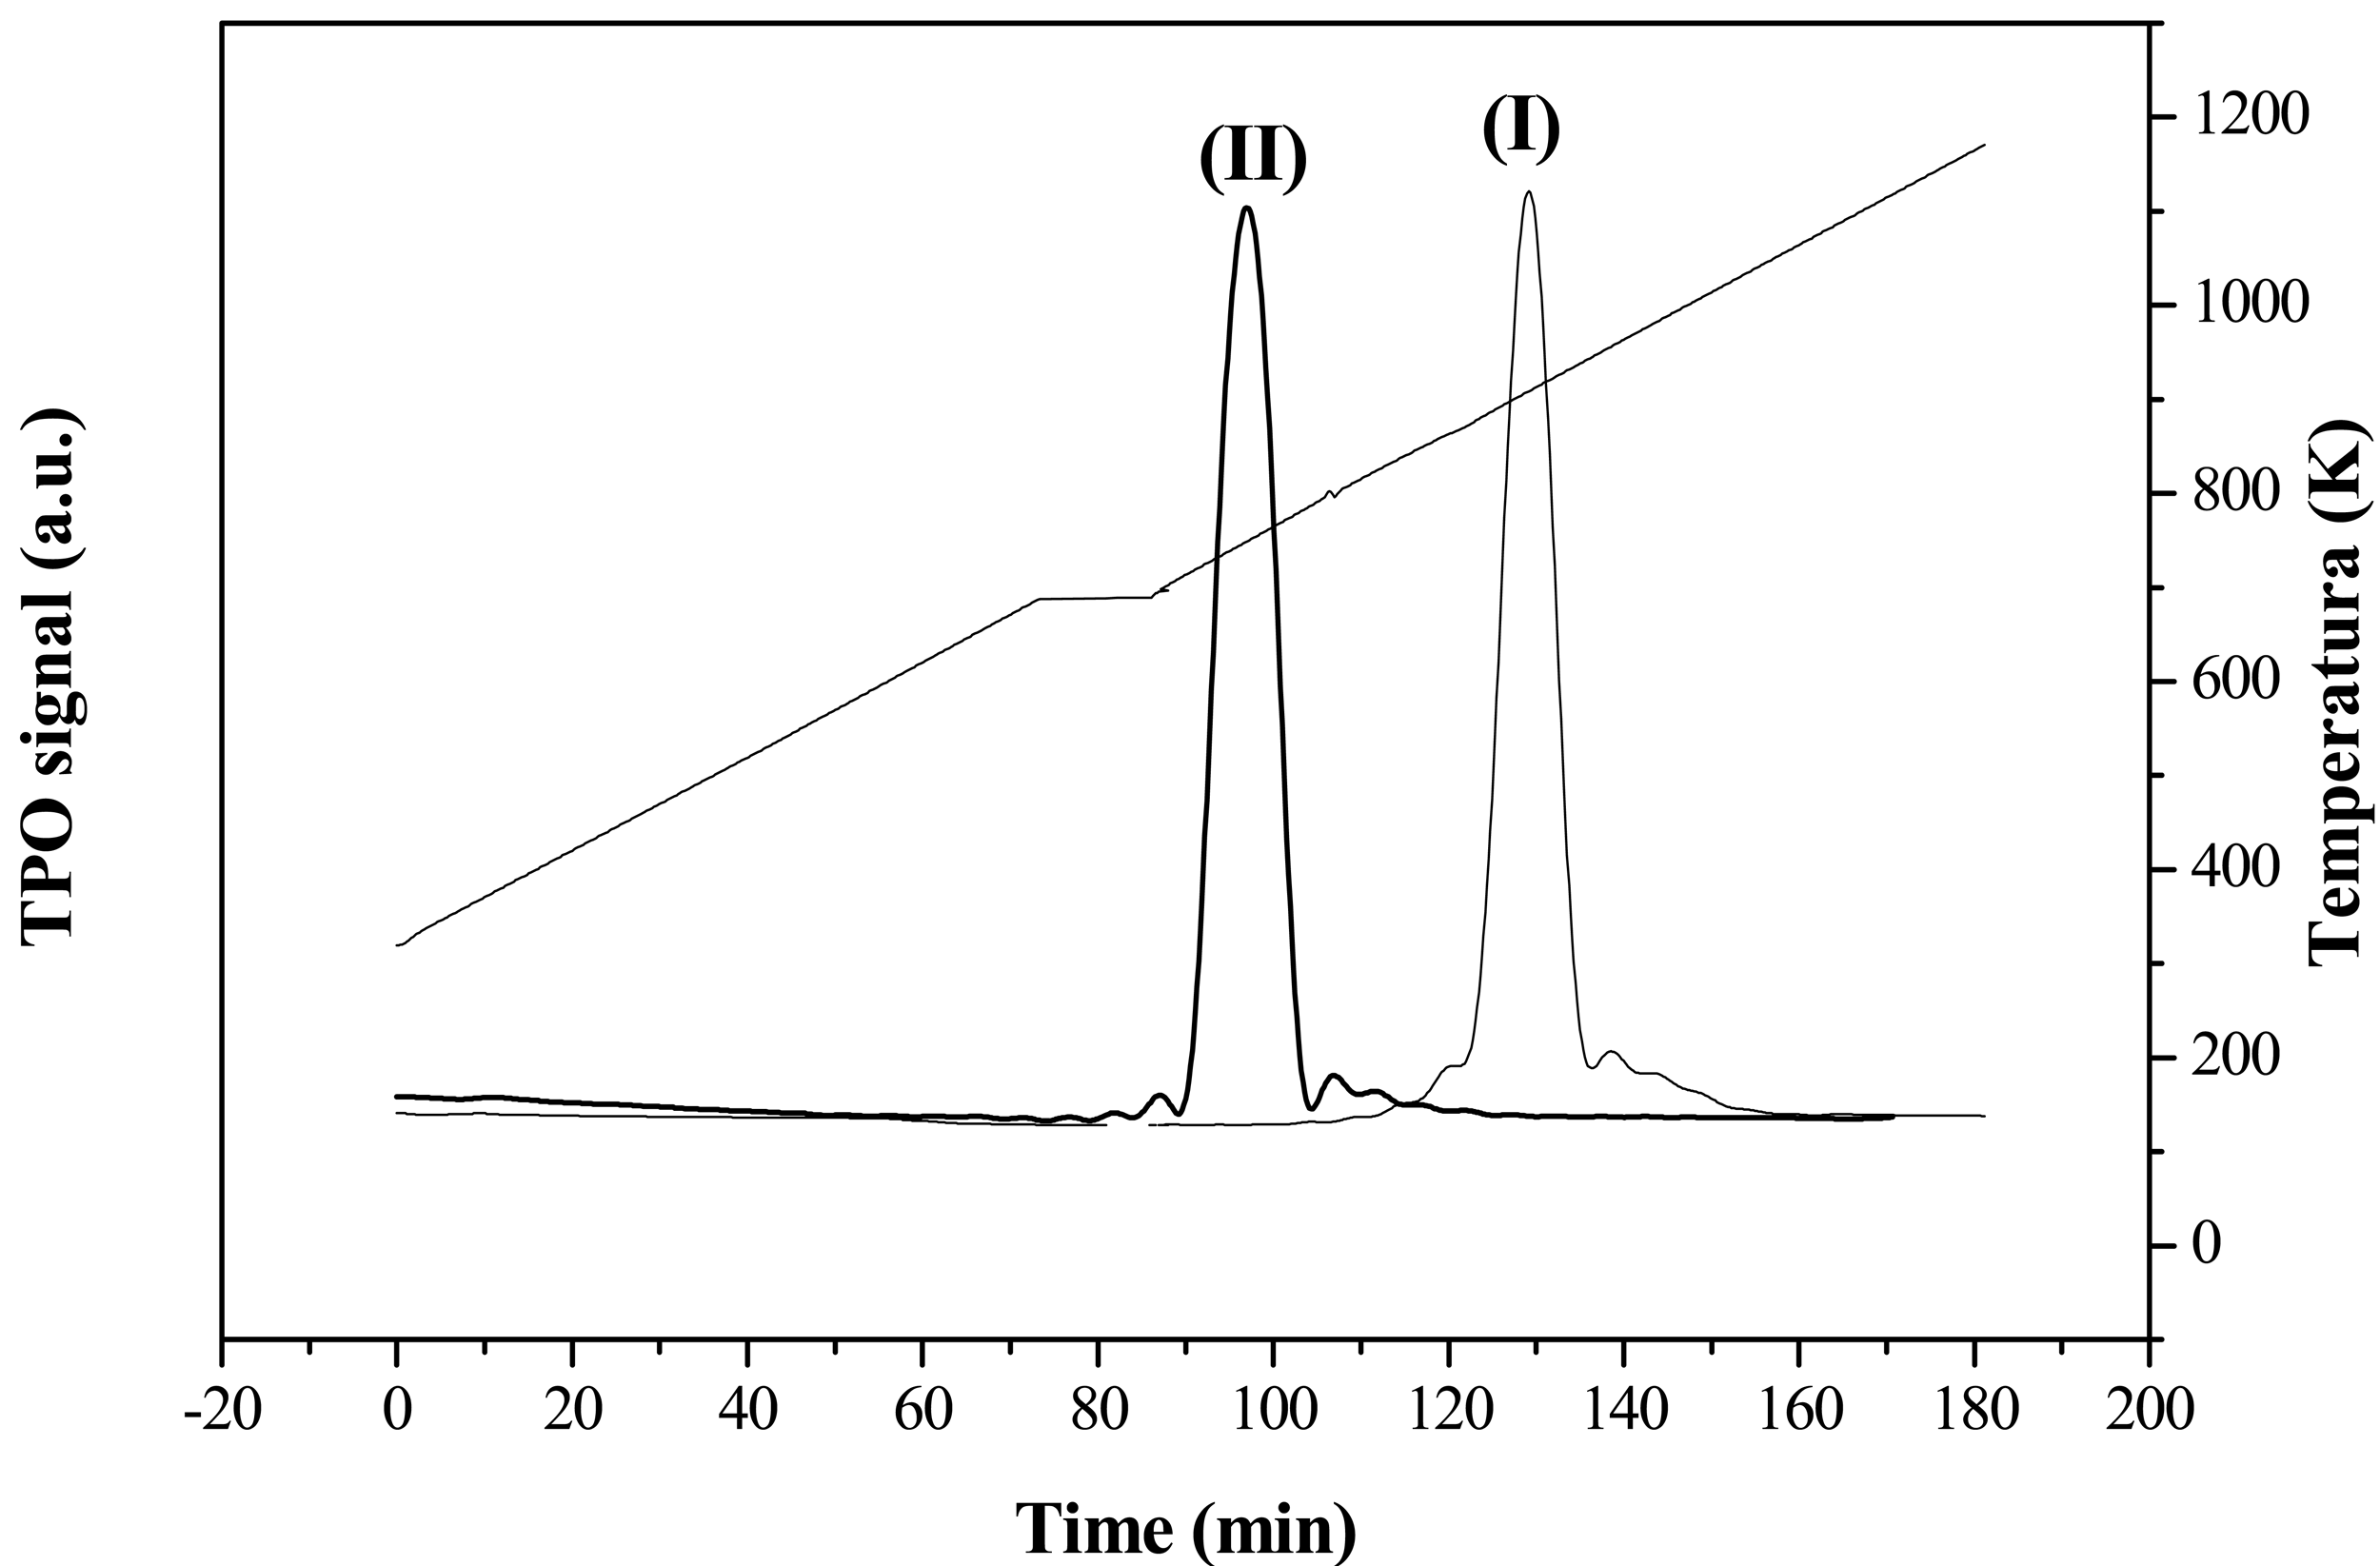
The carbon structural order was measured by means of temperature-programmed oxidation (TPO) analysis. It is well established that the more structured a carbon material is, the higher the temperature is required for gasification during TPO [37]. Figure 2 and Table 1 show the TPO profiles and the gasification temperatures of the two carbonaceous supports. CNF were oxidized at a lower temperature than G since the former had higher surface area, more defects, and exposed edge planes, and surface C-H/O-H groups, which all together make them much more easily attacked by O2 [38]. The graphitic character of the supports was also evaluated by XRD. Interlayer spacing (d002), average crystalline parameter (Lc) and average number of planes of graphite crystals (npg), shown in Table 1, were completely in agreement with TPO analyses, providing a measure of the structural order of the materials which, increased with both decreasing values of d002 and increasing values of both Lc and npg.
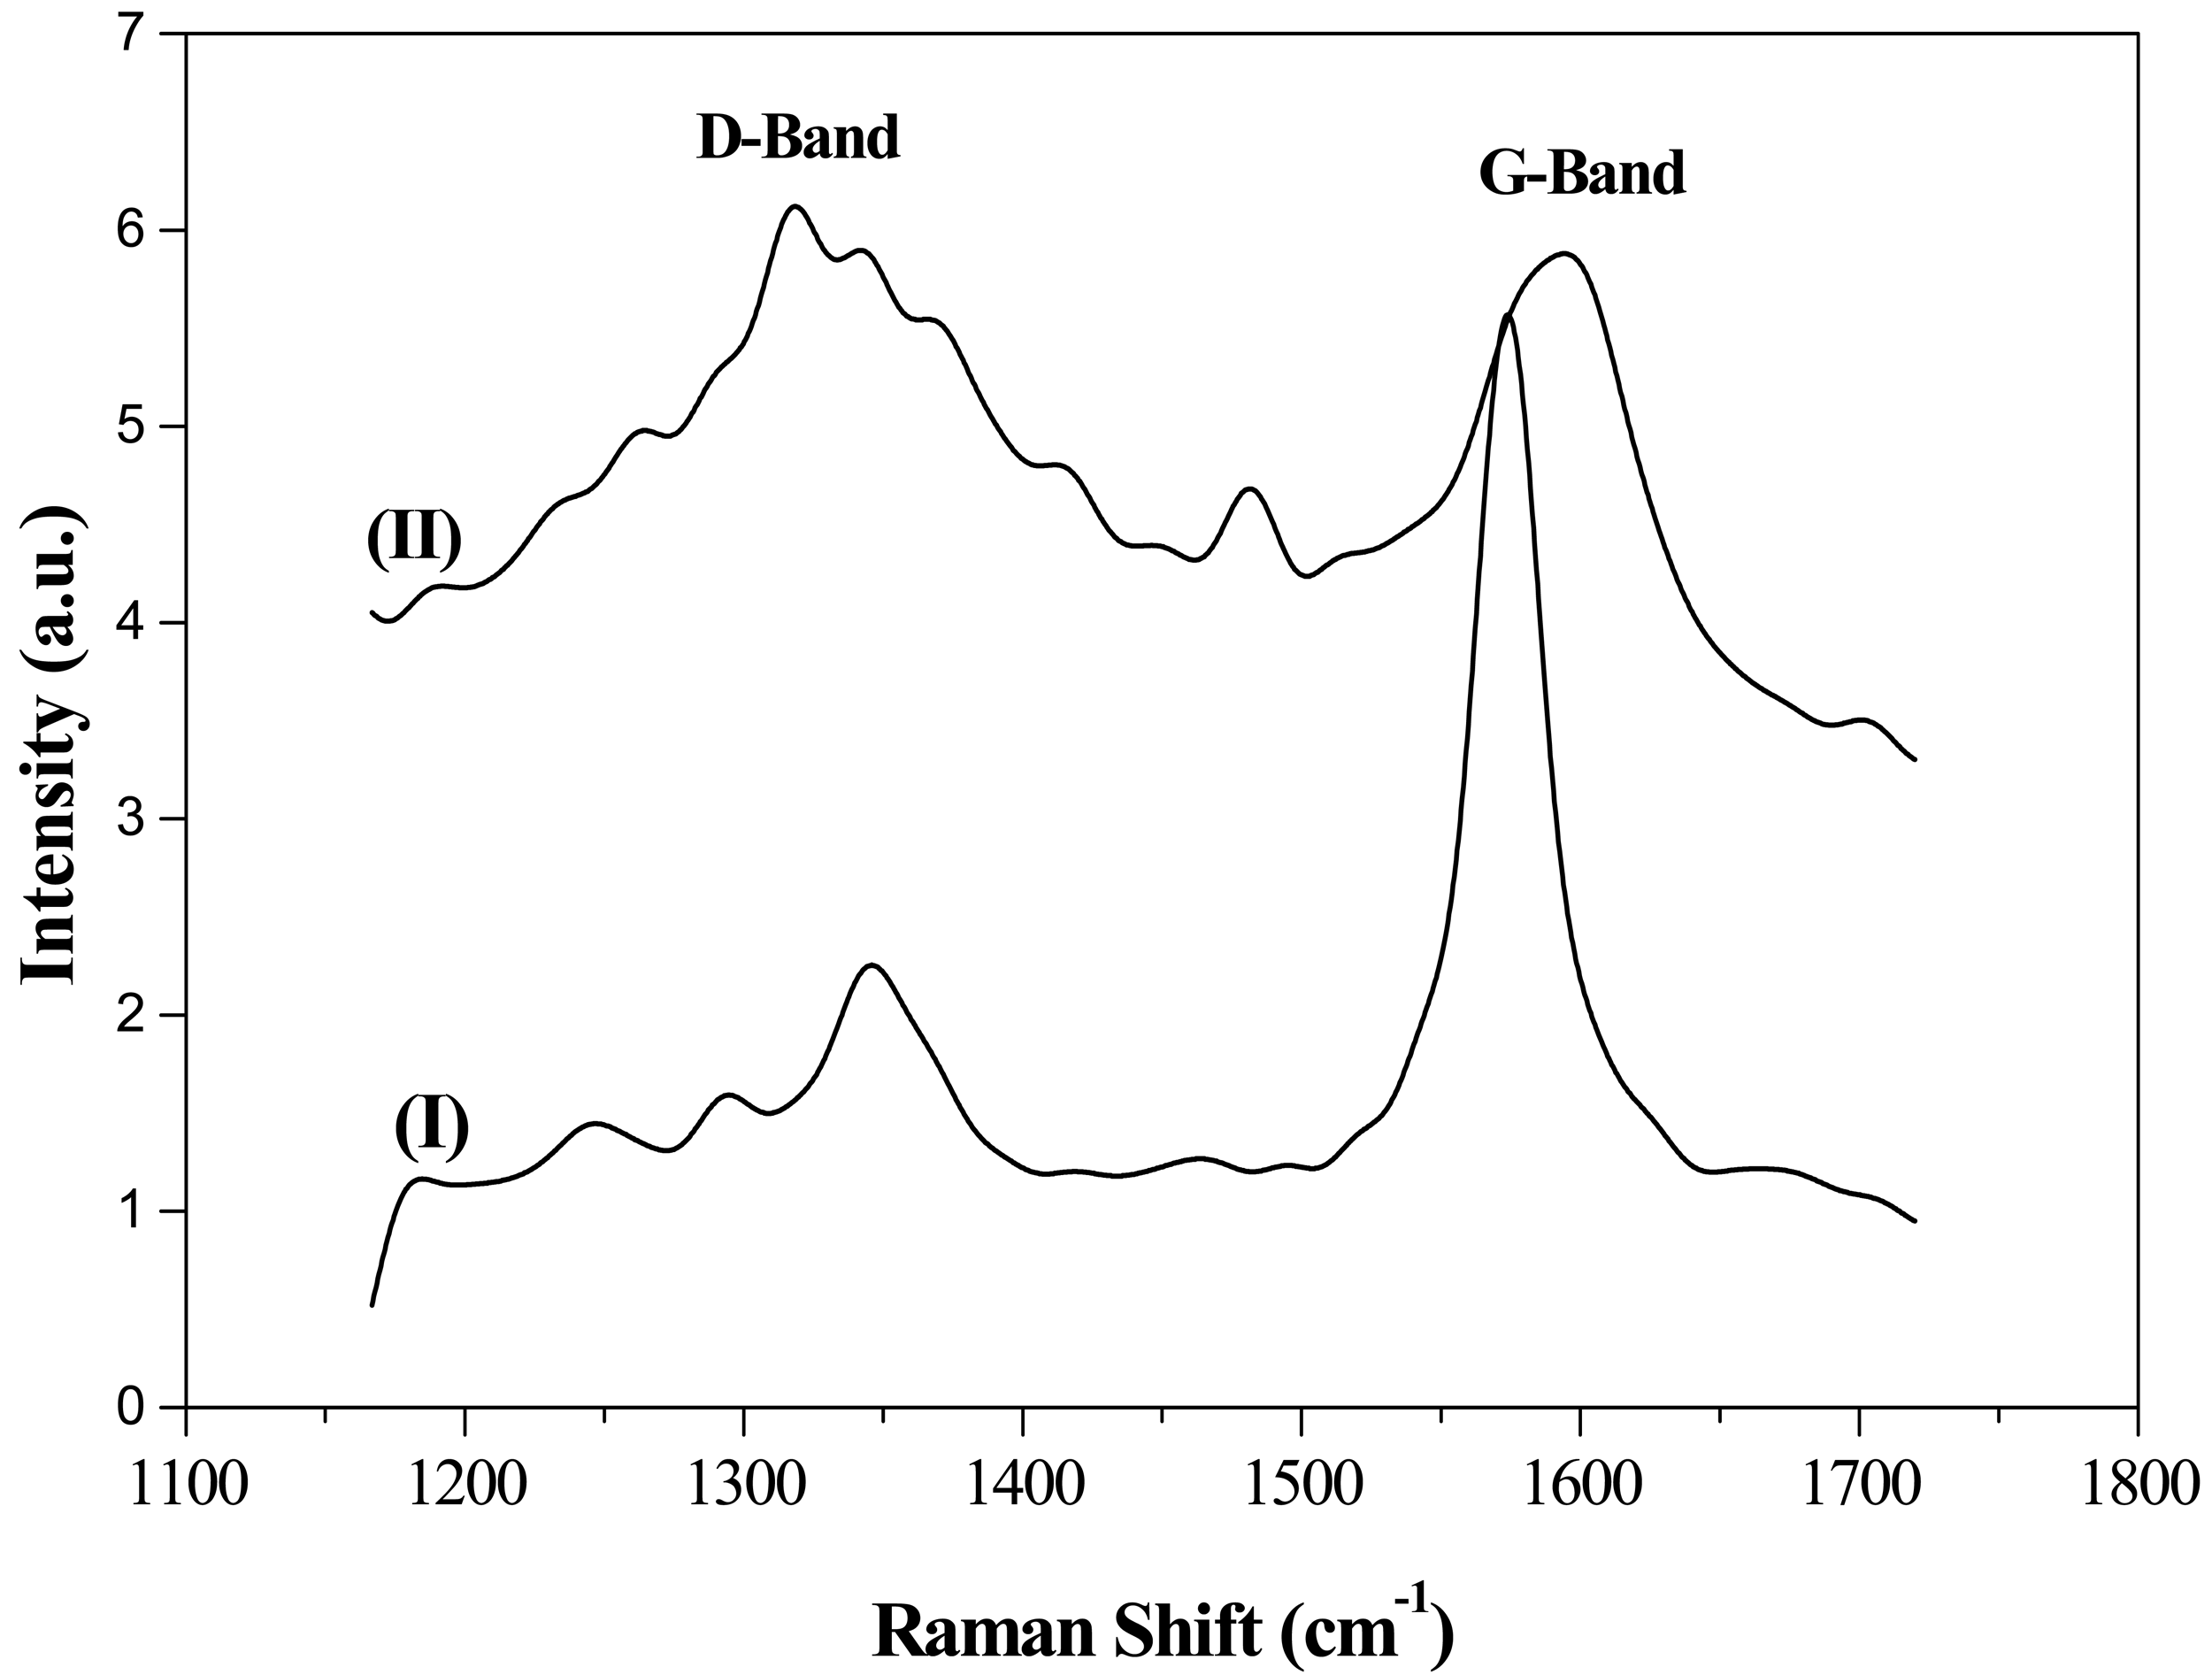
Structural features were further assessed by Raman spectroscopy (Figure 3). Raman spectra of the supports exhibited two peaks, commonly denoted as D- and G-bands, at ca. 1354 and 1600 cm−1, respectively. D-band has been attributed to the presence of defects and/or curvature in the carbon structure, while the G-band is associated with well-ordered structures [31,39]. Therefore, the relative intensities of D- and G-bands (ID/IG) can be used as an index to assess graphitic character. Again, Raman spectroscopy results corroborated those obtained by XRD and TPO. G support, with the highest graphitic character, generated an intense G-band in the Raman spectrum while CNF supports showed a moderate G-band associated with linearly oriented graphite sheets.
2.2. Catalyst Characterization
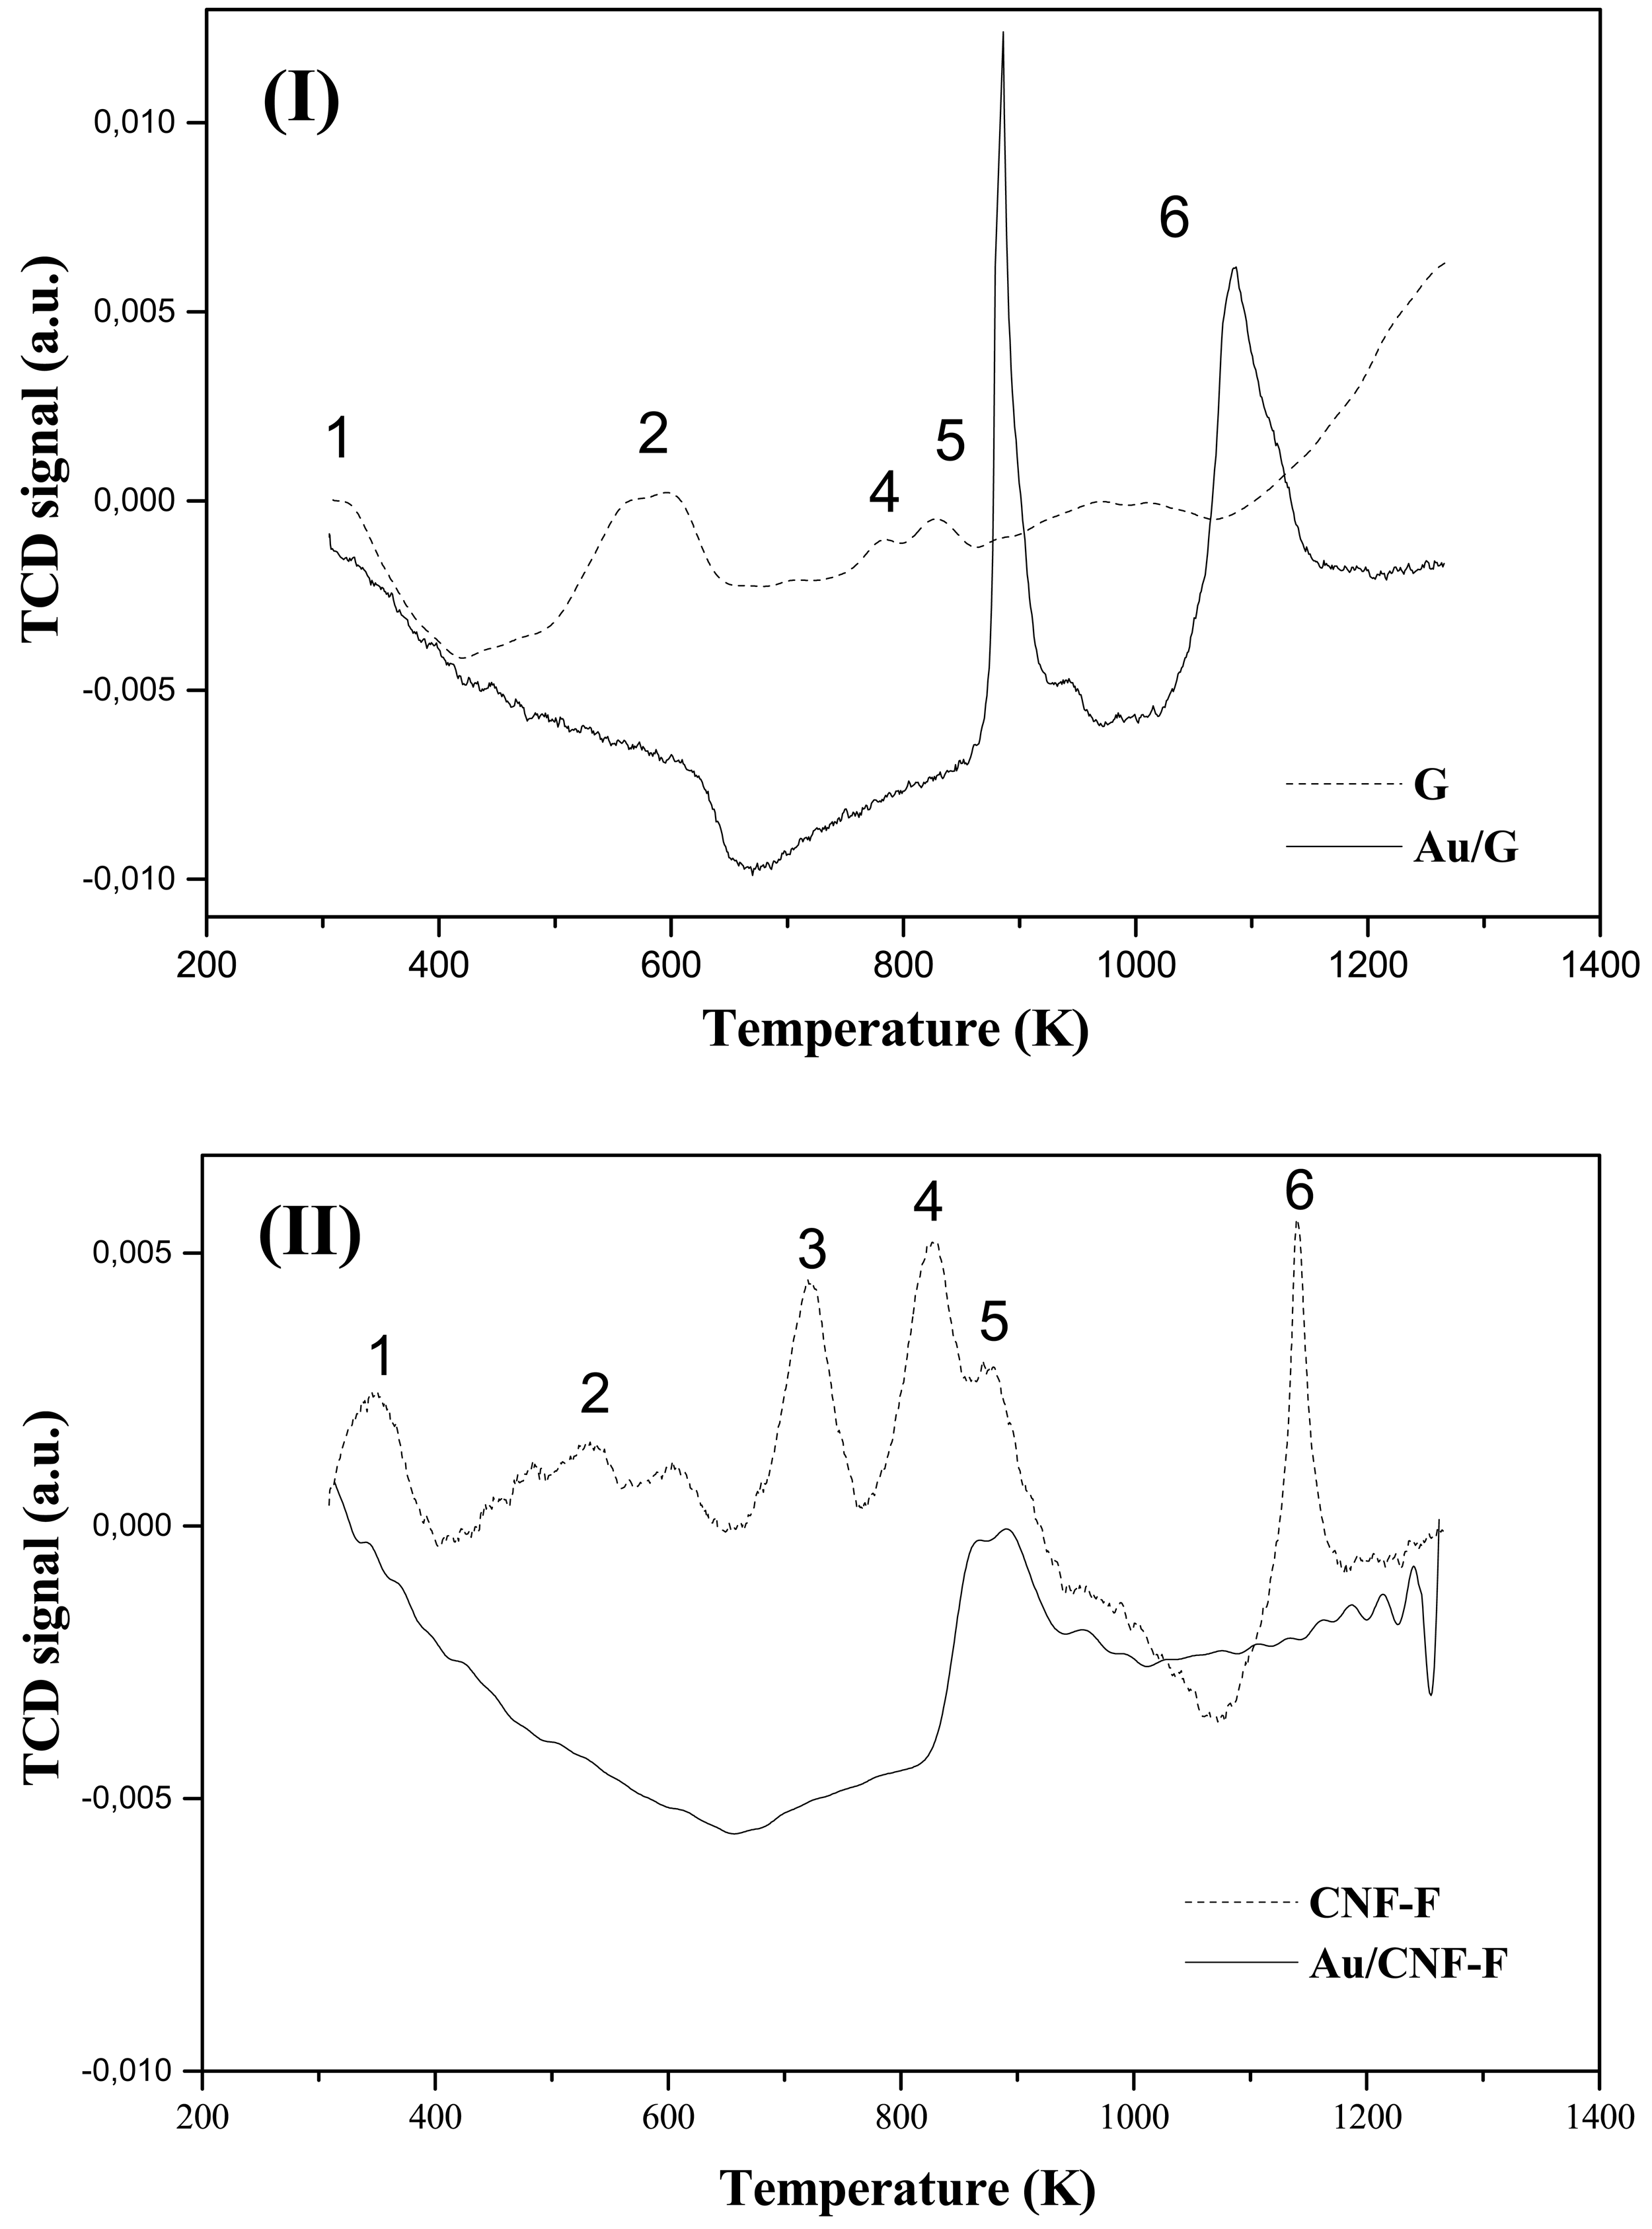
The metal function (Au) was introduced by the impregnation (-IMP) and gold-sol with THPC (Tetrakis(hydroxymethyl)phosphonium chloride) as the surfactant agent (-SGT) methods. Actual metal loading is recorded in Table 2. TPR profiles associated to each catalyst are given in Figure 4, which also includes the response recorded for the corresponding supports. The first hydrogen consumption peak (Tmax ranging from 594 to 656 K), common to all the catalysts and absent in the supports, has been attributed to the reduction of the oxidized-Au form to the metallic one (Au0) [40]. According to the obtained results, 623 K was chosen as the suitable reduction temperature to ensure metal activation without affecting the surface properties of the support [41,42]. On the other hand, theorical H2 consumptions values that is, H2 amount needed to reduce all the Au3+ to Au0 (47.4 and 27.1 μmol gcat−1 for Au/CNF-F-IMP and Au/CNF-F-SGT respectively), were always higher than the corresponding experimental ones (12.6 and 9.1 μmol gcat−1 for Au/CNF-F-IMP and Au/CNF-F-SGT respectively) indicating that, part of the Au was in the metallic form (Au0) before TPR reduction. Tmax associated with this first hydrogen consumption peak are given in Table 2. It was observed that the reduction temperature was slightly higher for catalysts with lower metal loadings; i.e., catalysts prepared by the gold-sol method. The second hydrogen consumption observed in CNF-based catalysts resulted in a broader peak (Tmax ranging from 836 to 894 K) that was attributed to the hydrogen uptake from the support upon decomposition of oxygen surface groups [31,43,44]. Graphite decomposes at very high temperatures (about 1573 K) and, therefore, no response could be observed in the TPR profiles carried out at the maximum temperature of 1273 K. This preliminary assignment was also investigated by temperature-programmed decomposition analyses in He after activation of the Au/C samples at 873 K. It corresponds to the second peak observed in the TPR profile, which also includes the response recorded for both supports. This technique provides qualitative information about the presence of oxygen groups in the carbon structure, as reported elsewhere [45]. The profiles presented in Figure 5 demonstrated that the signal of the support was stronger than that corresponding to the thermal treatment of the catalysts after TPR, due to the decomposition of oxygen surface groups from the support (in He at T ≥ 873 K). Note that the ascribed signal is mainly formed as consequence of the CO and CO2 release resulting from the decomposition of these groups in the form of water, carboxylic, lactone, anhydride, phenol and carbonyl and quinone groups [45].
XRD patterns for the Au-based catalysts are presented in Figure 6. XRD profiles were similar, regardless the method of gold introduction onto the support. Peaks at 2θ ≈ 26° correspond to the (002) graphite plane of carbon (JCPDS-ICDD Card No. 41-1487). Peaks observed at 38°, 44°, 64° and 77° correspond, respectively, to the (111), (200), (220) y (311) planes of metallic gold (JCPDS-ICDD Card No. 01-1172), which was consistent with an exclusive hexagonal geometry of Au0 [46]. These results indicated that after reduction the metallic phase was in the Au0 form.
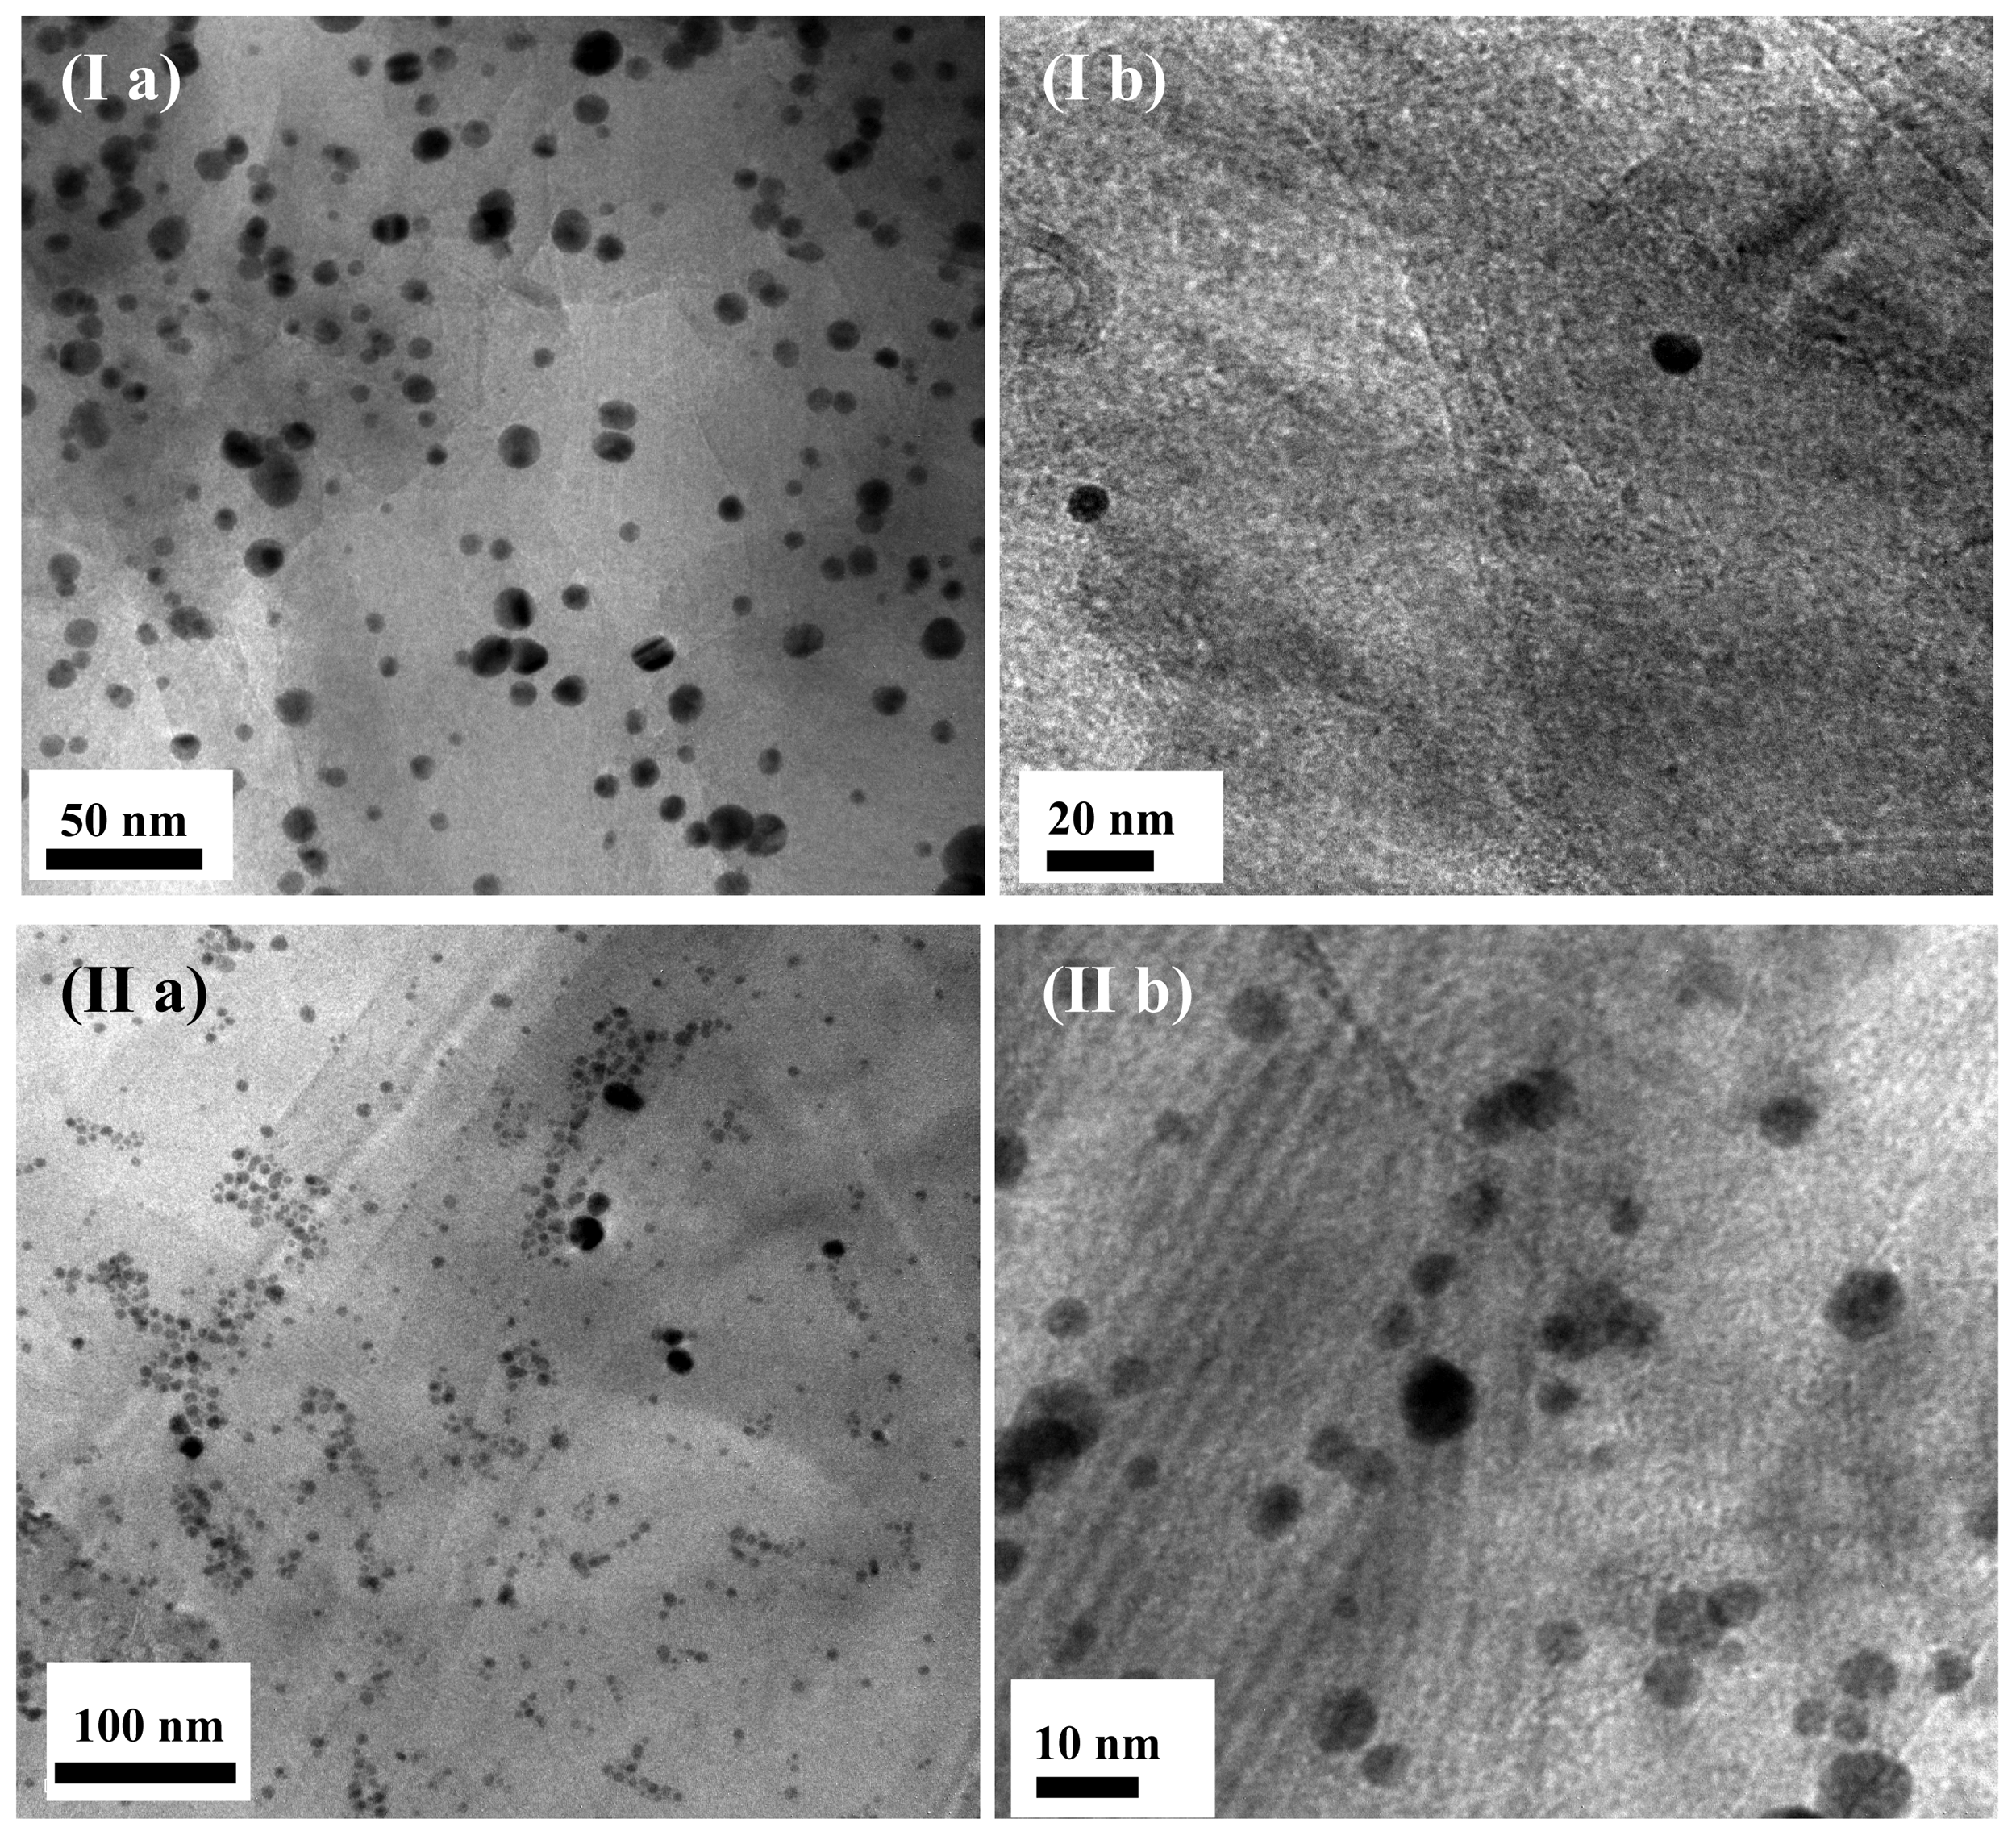
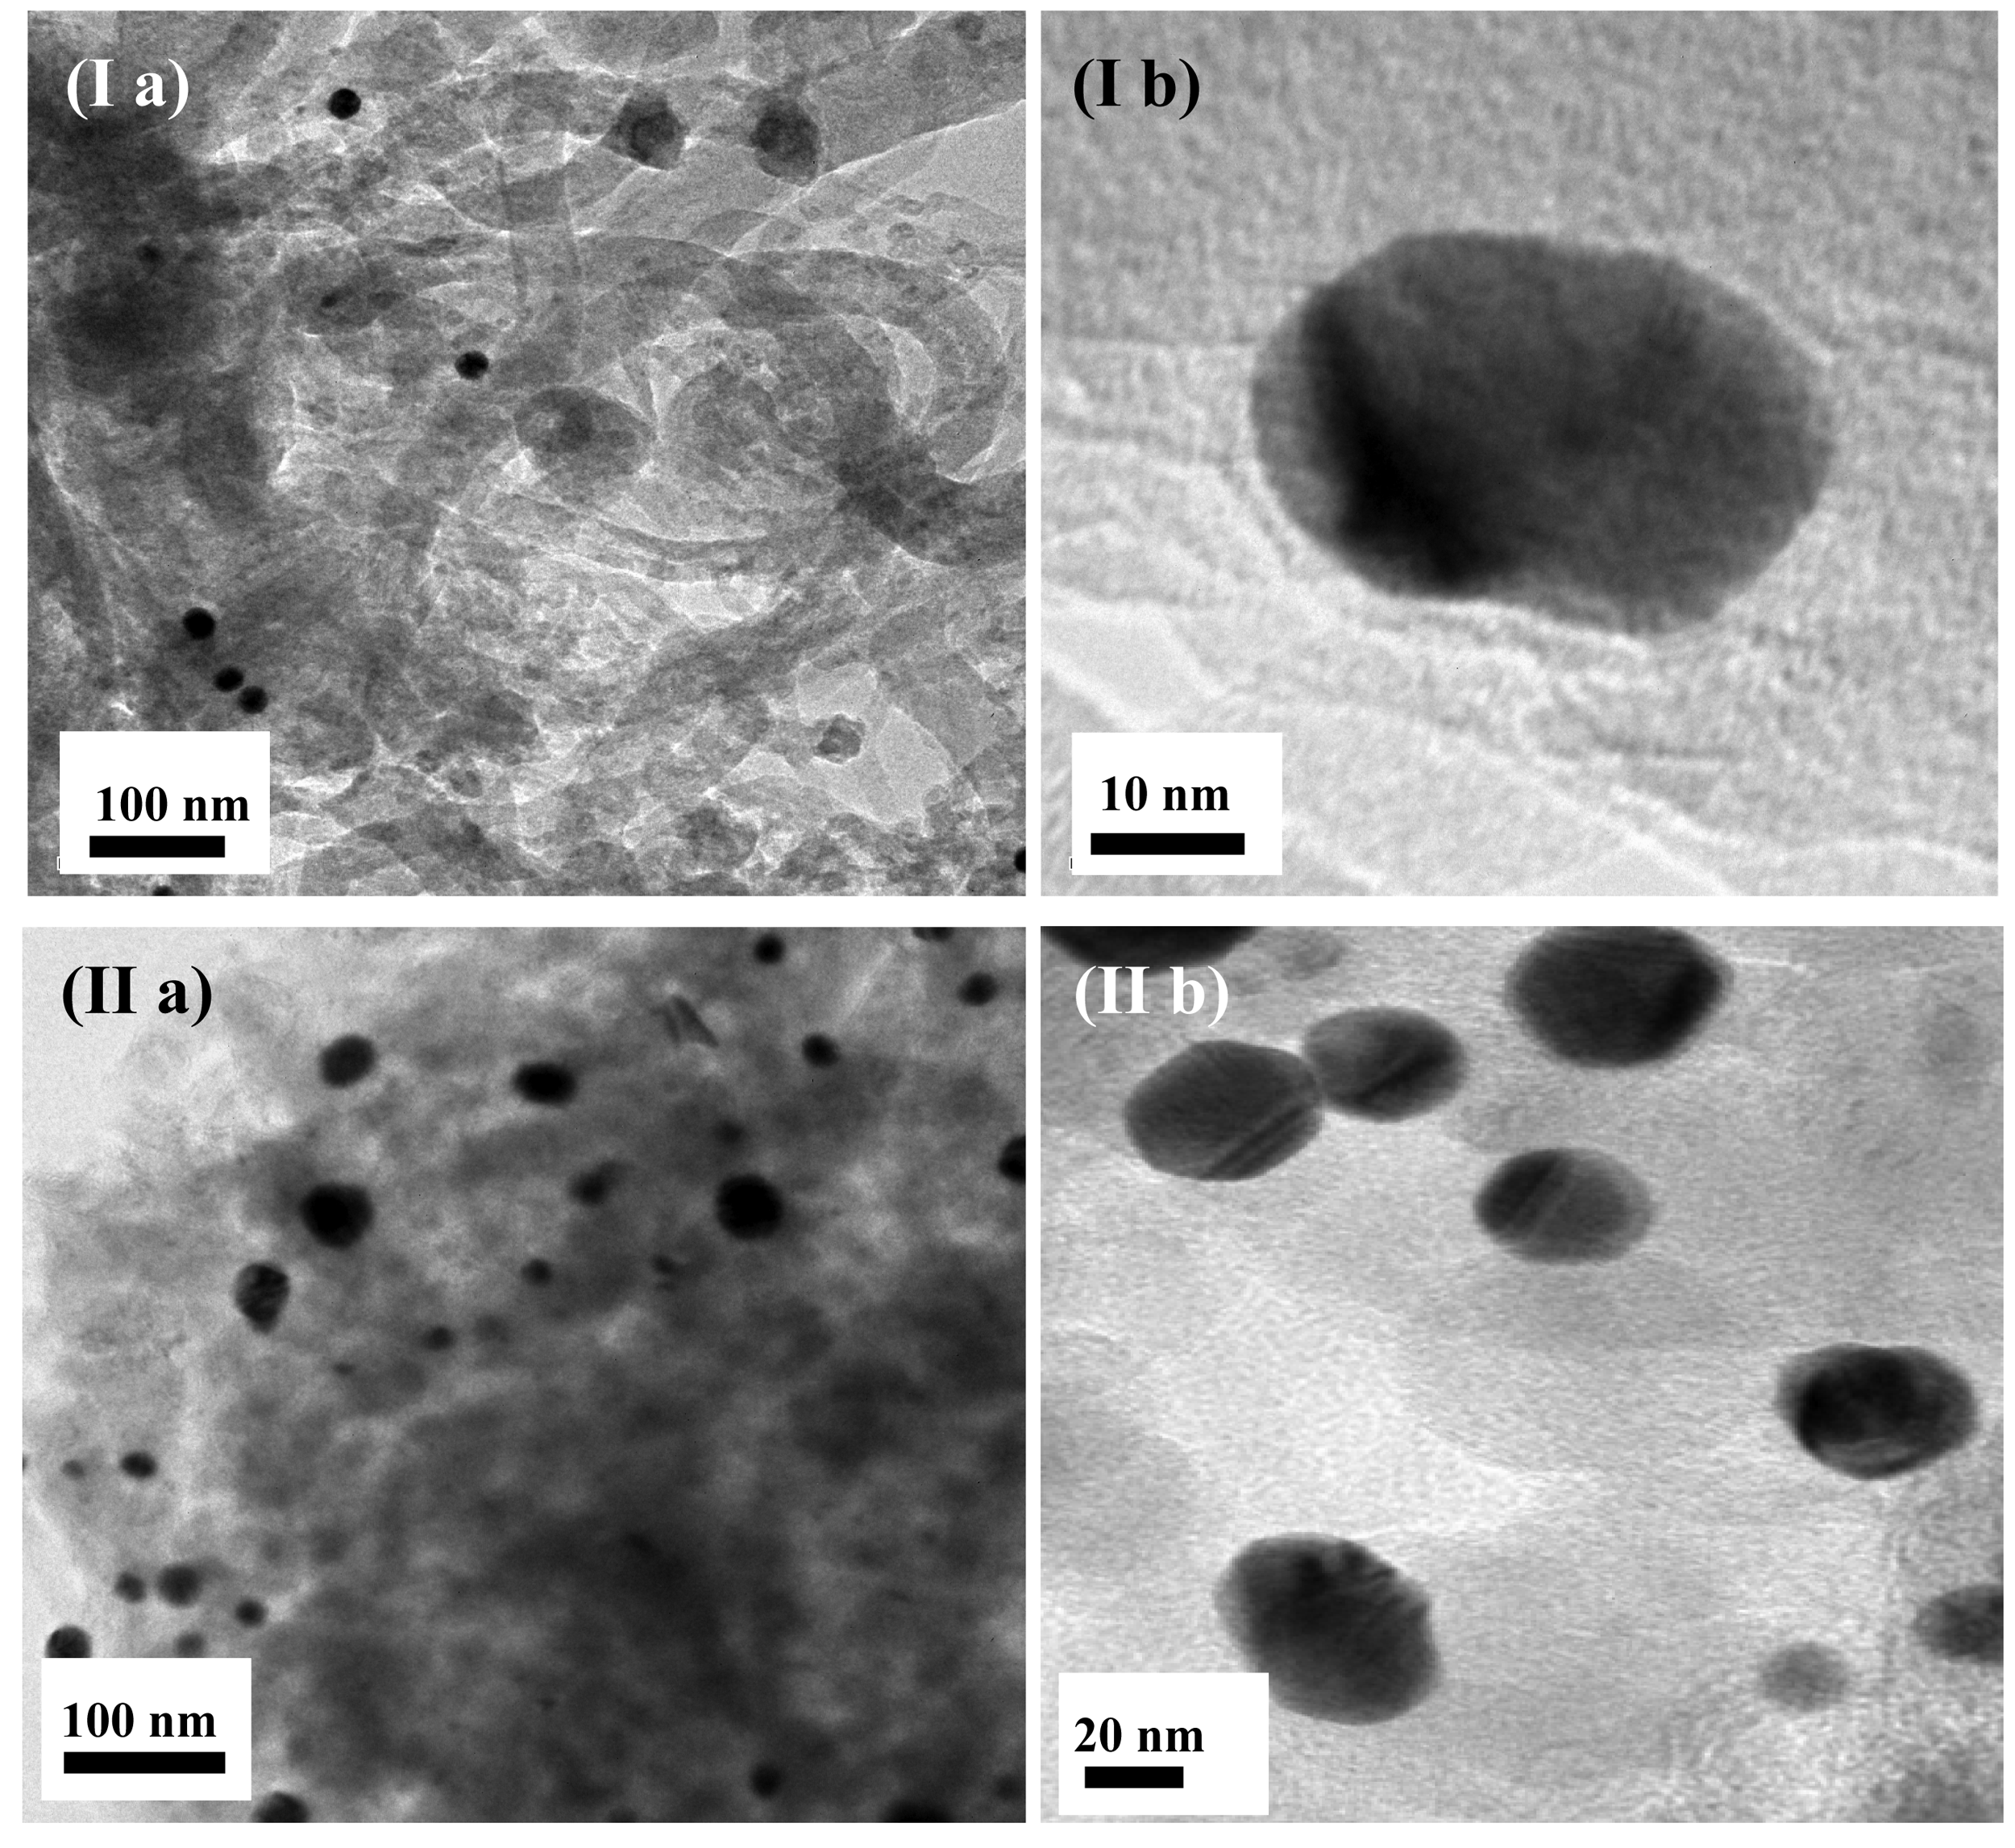
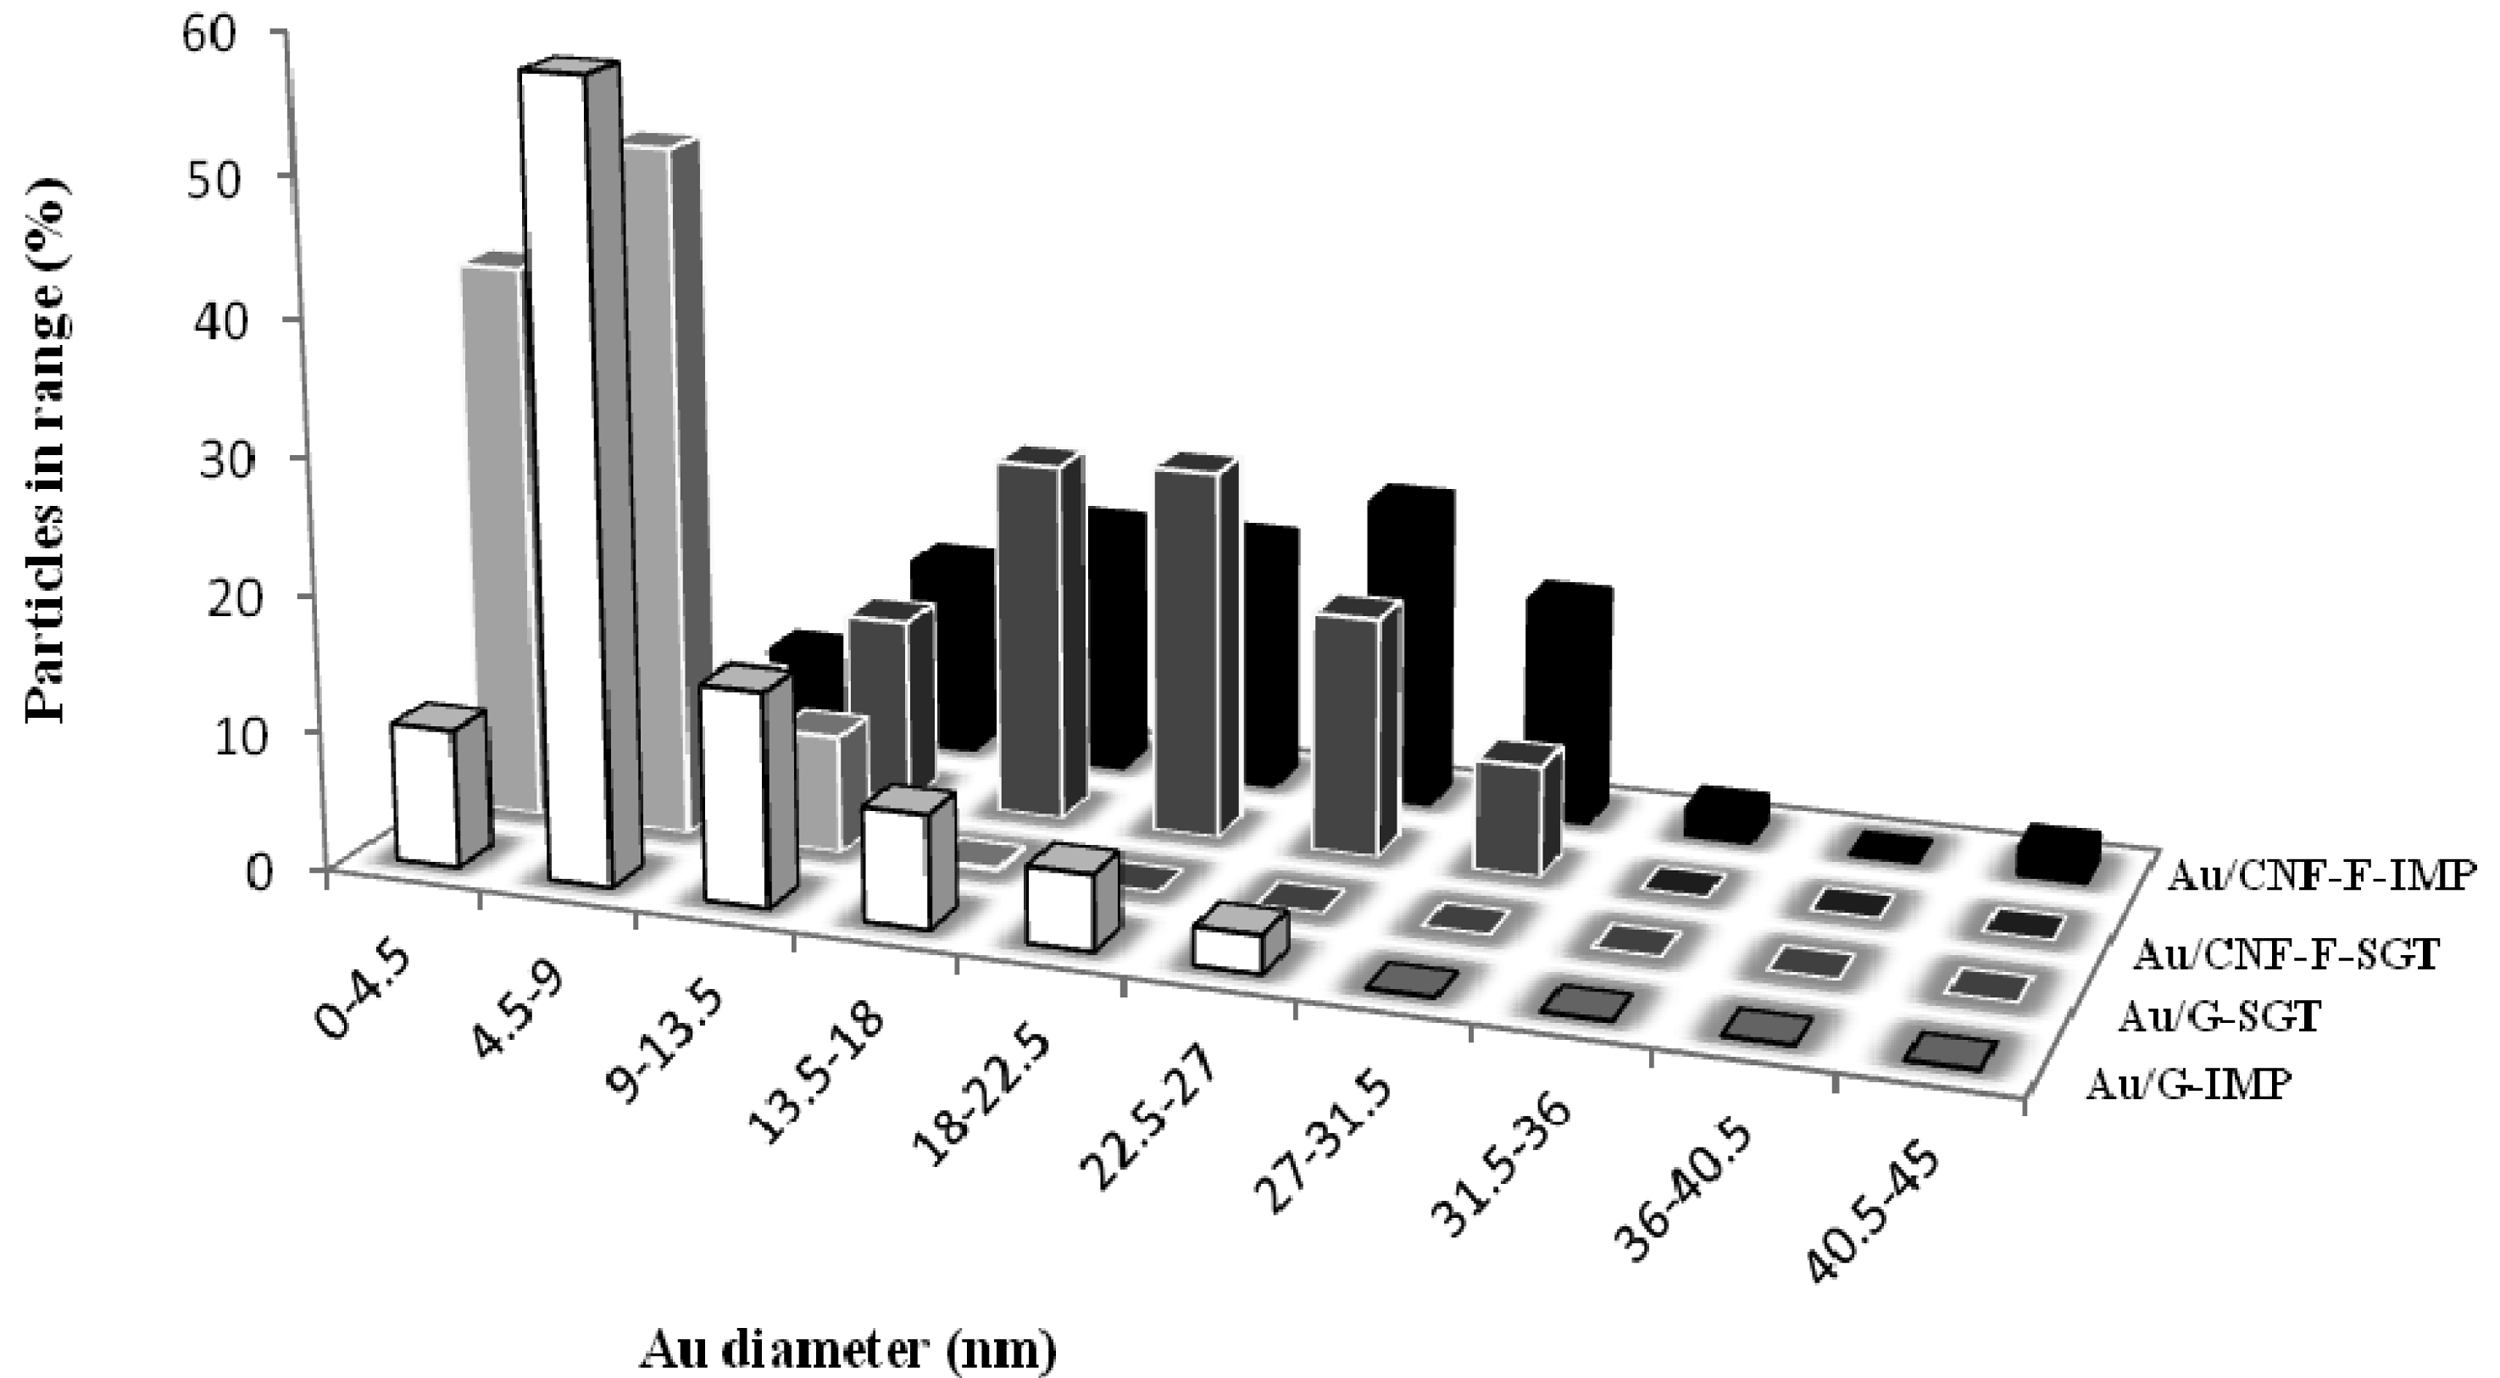
Representative TEM micrographs (Figures 7 and 8) and TEM derived particle size distributions (Figure 9) showed the morphology and size of the reduced Au particles. According to the obtained Au particle size (Table 2), Au particles were probably anchored onto the carbon surface since, they could not penetrate between the carbon layers (d002 values were much lower than the supported Au particle size). This fact is corroborated by the negligible change in the pore diameter, and by the pore blockage that took place after the Au introduction. In all cases, TEM micrographs showed small and dispersed Au particles, being this observation, as expected, more marked when G was used as the support and when catalysts were prepared by the gold-sol method (THPC stabilized the colloid gold solutions [47]). Regardless the metal introduction method used, the Au particle size distribution was considerably narrower when G was used as the catalytic support.
On the order hand, it could be also observed that the presence of structural defects (low crystallinity) played an important role in the Au deposition and, as consequence, in its catalytic activity. Higher crystallinity and, therefore, higher carbon content in the structures (Table 1), resulted in a greater number of graphite edges exposed in an orderly manner (see Lc values, Table 1), ensuring a strong anchoring of small metal particles. Thus, G, with almost no porosity, generated the smallest surface area-weighted average Au diameter due to its high crystalline nature. In this material a great number of ordered edges were exposed, resulting in a greater anchoring of small, thin, faceted and well dispersed Au particles, revealing a strong metal-support interaction [48]. Nevertheless, Au particles supported over fishbone type CNFs were larger and, consequently, worse dispersed.
2.3. Catalytic Tests
2.3.1. Influence of the Au Introduction Method and the Nature of the Support on the Catalytic Activity
Figure 10 shows the catalytic activity in the WGS reaction of the samples here prepared using supports different in nature and two procedures for metal incorporation (impregnation and sol-gold ones). In all cases, catalytic activity was influenced by the reaction temperature. It has been reported by many authors [49–51] that due to the nature of the WGS reaction, temperature is a critical parameter which may limit the efficiency of the reaction in terms of both CO conversion and H2 production. In this sense, an increase of the reaction temperature would produce shift of CO conversion up to the equilibrium limit. Anyway, a minimum temperature is needed to observe catalytic activity. It is important to note that, in all cases, selectivity to H2 was always 100% indicating that, secondary undesired reactions were not present, which is normal at low temperatures.
It can be also observed that the nature of the support strongly influences the catalytic results. Thus, the best catalytic results were obtained using highly crystalline supports, such as G, which could be aforementioned attributed to that G promoted a strong anchoring of small, thin and faceted Au particles. In addition, Au particle size and morphology were closely linked to the preparation method of the supported catalyst. Thus, catalysts where Au was incorporated by the gold-sol method were more active than those prepared by the impregnation one due to the smaller size of the Au particles obtained with the former.
Results are in agreement with other studies reported in literature. Therefore, Au activity in the WGS reaction has been associated to a high Au0 particles dispersion [52] having the cationic gold a negligible contribution in the steady state [53]. According to Janssens et al. [54], the metal-support interaction, which is largely influenced by the support, has a significant influence on the stability of the particles. Hence, a high metal-support interaction probably can retard the sintering of Au nanoparticles.
Summarizing, the highest catalytic activity was achieved by using both high crystalline supports that promote high metal-support interactions (such as G) and Au introduction techniques that lead to a high Au0 dispersions (such as the gold-sol method).
On the basis of the catalytic activity results discussed above, CNF-F-based catalysts and those prepared by the impregnation technique were ruled out for further studies.
2.3.2. Influence of Steam-to-CO Molar Ratio on Catalytic Activity
The catalytic activity of the Au graphite-based catalyst was studied by using feeds with a steam-to-CO molar ratio of 2 and 4. Figure 11 shows the effect of this parameter over the reaction rate in the temperature range between 573 and 633 K. It can be seen that the CO conversion was slightly improved when the highest steam-to-CO molar ratio was considered. At industrial scale, the WGS process usually operates with feeds containing an excess of vapor water (H2O/CO molar ratio equal or higher than two) [55,56]. At these conditions, side and undesired reactions such as methanation [57] or CO disproportionation that deactivates the catalyst by carbon deposition are hindered. Note that, regardless the steam-to-CO molar ratio used, almost 100% of H2 selectivity was achieved in all the temperature range here considered which is consequence of the low CO conversion attained (<10%) at the experimental conditions used in this work. Low CO conversion should be expected at low reaction temperatures and atmospheric pressure. Similar catalytic activity at similar operating conditions has been reported for a CoMo-based commercial catalyst [19].
3. Experimental
3.1. G and CNF/Catalyst Preparation and Characterization
Carbon nanofibers were prepared at atmospheric pressure by the catalytic chemical vapour deposition method (CVD) in a fixed-bed reactor consisting of a horizontal quartz tube (100 cm length × 9 cm i.d.). The synthesis was conducted over a Ni/SiO2 (10% w/w) catalyst at 873 K employing ethylene as the carbon source and hydrogen as the carrier gas (C2H4/H2, 4/1 v/v, 900 cm3 min−1). The growth time was 1 h and the space velocity was 10,000 h−1. The carbon deposit obtained was demineralized using HF (48% v/v) and dried for 12 h at 383 K in air to remove water prior to its characterization. Graphite (supplied by Aldrich) underwent the same treatment with this acid to make their properties comparable. Further details regarding the CNF synthesis are given in a previous work [58].
The gold catalysts were prepared via the gold-sol method with THPC as the surfactant agent (-SGT) [41] and the wet impregnation method (-IMP) [59], using HAuCl4·3H2O (Sigma Aldrich) as the metal precursor salt. In the gold-sold method, the metallic sols were first prepared stirring H2O and NaOH before adding the diluted THPC. After that, the gold aqueous solution was added. The gold-sols were then stirred for 1 h. Aqueous suspensions of the carbon supports were agitated in an ultrasonic bath. Finally, the gold-sols were added into the carbon suspensions and stirred for 1 h for immobilization. In the impregnation method, the sample was placed in a glass vessel and kept under vacuum at room temperature for 2 h in order to remove water and other compounds adsorbed on the carbon material. A known volume of an aqueous metal precursor solution was then poured over the carbon material. Next, the solvent was removed by evaporation under vacuum. The metal content added to the catalyst was controlled by measuring the metal concentration in the impregnating solution.
To finish with the catalyst preparation, the suspension was filtered, washed with deionized water until the filtrate was free of chloride (AgNO3 test), and dried at 383 K for 24 h. All the catalysts were sieved into a batch of 75 μm average diameter and then reduced at 623 K in a flow of H2 for 2 h.
Au metal loading was determined by atomic absorption (AA) spectrophotometry using a SPECTRA 220 FS analyzer. Samples (ca. 0.5 g) were treated in 2 cm3 HCl, 3 cm3 HF and 2 cm3 H2O2 followed by microwave digestion (523 K). Surface area/porosity measurements were conducted using a Micromeritics ASAP 2010 sorptometer apparatus with N2 as the sorbate at 77 K. All the samples were outgassed prior to analysis at 453 K under vacuum (5 × 10⁻³ Torr) for 16 h. The total specific surface areas were determined by the multipoint BET method. Microporosity was evaluated by the t-plot and Horwath-Kawazoe (HK) methods and mesoporosity was evaluated by the Barret-Joyner-Halenda (BJH) method. XRD analyses were conducted with a Philips X'Pert instrument using nickel-filtered Cu Kα radiation. Samples were scanned at a rate of 0.02° step−1 over the range 5–90° (scan time = 2 s step−1). The resulting diffractograms were compared with the JCPDS-ICDD references [60]. Micro-Raman spectra of the supports were recorded with a Renishaw Raman Microscope System RM1000 equipped with a Leica microscope, an electrically refrigerated CCD camera and a diode laser at 514 nm as the excitation source, operating at a power level of 3 mW. Temperature-programmed oxidation (TPO) profiles were obtained using a PerkinElmer TGA7 thermogravimetric analyzer, where samples (ca. 10 mg) were ramped from room temperature to 1273 K (5 K min−1) in a 50 cm3 min−1 O2/He (5% v/v) flow. The carbon content in the solid carbon deposits was determined using a LECO CHNS-932 apparatus. Temperature-programmed reduction (TPR) experiments were conducted in a commercial Micromeritics AutoChem 2950 HP unit with TCD detection. Samples (ca. 0.1 g) were loaded in a U-shaped quartz reactor and ramped from room temperature to 1273 K (5 K min−1) and in a reducing atmosphere (17.5% v/v H2/Ar, 60 cm3 min−1). Prior to the analysis, samples were treated in an Ar atmosphere (50 cm3 min−1) from room temperature to 523 K (10 min) and from 523 to 773 K (20 min).
Temperature-programmed decomposition profiles were recorded using a Micromeritics TPD/TPR 2900 apparatus. The samples were activated in situ under H2 (60 cm3 min−1) at 5 K min−1 to 873 K, cooled to room temperature and then heated (5 K min−1) to 1273 K in a flow of He (100 cm3 min−1). Changes in the outlet gas composition were monitored by a TCD device. Acquisition and further treatment of data was performed with the Micromeritics 2900 commercial software.
Transmission electron microscopy (TEM) analysis was made with a JEOL JEM-4000EX unit (an accelerating voltage of 400 kV). Samples were prepared by ultrasonic dispersion in acetone with a drop of the resultant suspension evaporated onto a holey carbon-supported grid. Mean Au particle size evaluated as the surface-area weighted diameter (d̅s) was computed according to:
3.2. Catalyst Testing
Measurements of the catalytic activity were carried out within a specific tubular quartz reactor. The dimensions of the reactor were 45 cm length and 1 cm of diameter, being the catalyst placed on a fritted quartz located at the end of the reactor. The temperature of the catalyst was measured with a K-type thermocouple (Thermocoax) placed inside the inner quartz tube. The entire reactor was placed in a furnace (Lenton) equipped with a temperature-programmed system. The reaction gases were Praxair certified standards of CO (99.99% purity) and N2 (99.999% purity), which was used as the carrier gas. The gas flows were controlled by a set of calibrated mass flowmeters (Brooks 5850 E and 5850 S). The content of water in the reaction mixture was controlled using the vapor pressure of H2O at the temperature of the saturator. All lines placed downstream from the saturator were heated above 100 °C to prevent condensation. The saturation of the feed stream by water at the working temperature was verified by a blank experiment where the amount of water trapped by a condenser was measured for certain time and compared with the theoretical value. Products gases were analyzed with a micro gas-chromatograph (Varian CP-4900).
Prior to the reaction test, the catalyst was reduced with pure H2 (100 mL/min) at atmospheric pressure and 623 K for 2 h. Catalytic activity was studied in the temperature range of 573–633 K. Gas hourly space velocity (GHSV) was slightly varied in each experiment by adjusting the catalysts weight in order to get always the same Au content in the reactor (2.7 × 10⁻³ g). The total gas flow rate was fixed at 100 NmL/min. Once operating conditions remained constant, steam was added to the preheated feed gas upstream of the reactor. Two different H2O/CO molar ratios (2 and 4) were used. Effluent gas composition was analyzed online at short intervals of time. A reaction time of 1.5 h was allowed for steady state to be achieved. Taking into account that CO could be also converted to CH4 (CO methanation) [14], hydrogen selectivity was calculated using the following equation:
The activity of the different catalysts used in this work will be shown as experimental reaction rates, which allowed to establish a better comparison of their catalytic performance.
Finally, supports were checked to be stable at hydrothermal conditions. Experiments performed at 633 K by flowing 100 NmL/min of a feed stream containing 40% H2O and N2 balance demonstrated that no traces of CO2 or CO was detected in the effluent; i.e., no gasification of any of the supports was observed.
4. Conclusions
The present paper has shown how the crystalline nature of the carbon material used as the catalytic support strongly influenced the way in which the Au metal particles were anchored to the support surface. Thus, high crystalline materials, such as graphite, with a low amount of structural defects, led to small, thin and faceted Au particles strongly anchored to the orderly exposed graphite edges. In addition, the catalyst preparation method also had a strong influence on the way that Au particles were deposited on the different carbonaceous supports. The best method of gold incorporation, in terms of catalytic performance, was the sol-gold one. This way, small and well dispersed Au particles, due to the colloid Au solution stabilization given by the THPC present in solution, were obtained. Finally, it was demonstrated that the two studied parameters (both nature of the carbonaceous support and method of gold incorporation into the support) had a strong influence on the catalytic activity in the WGS reaction. It was also observed that an increase in both the reaction temperature and the steam-to-CO molar ratio, improved the catalytic performance.


| Support | Surface Area (m2 g−1) | Total pore volume (cm3 g−1) | Micropore volume (cm3 g−1) 1 | Micropore area (m2 g−1) 2 | Mesopore area (m2 g−1) | Mean pore diameter (nm) | TTPO(K) 3 | d002 4 (nm) | Lc 4 (nm) | npg 4 | C (%mol) | H (%mol) |
|---|---|---|---|---|---|---|---|---|---|---|---|---|
| G | 10 | 0.04 | 0 | 0 (0) | 10 | 3.3 | 904 | 0.3378 | 321.8 | 95.3 | 99.25 | 0.75 |
| CNF-F | 216 | 0.39 | 0.022 | 25(12) | 165.5 | 25.6 | 744 | 0.3451 | 6.79 | 19.7 | 88.35 | 11.65 |
1Cumulative pore volume obtained using Horvath-Kawazoe method;2Percentage of micropore area with respect to the total surface area;3Temperature at which the maximum of the oxidation temperature peak appears;4d002 is the average interlayer spacing and the npg is the number of grapheme planes in the crystallites (Lc/d002) where Lc is the average crystal domain size along a direction perpendicular to the basal planes in a graphitic-type structure.
| Au/G-IMP | Au/G-SGT | Au/CNF-F-IMP | Au/CNF-F-SGT | |
|---|---|---|---|---|
| Au loading (%w/w) | 0.7 | 0.6 | 1.4 | 0.8 |
| TPR Tmax (K) | - | - | 630 | 645 |
| d̄s (nm) 1 | 12.6 | 7.7 | 25.5 | 22.2 |
| BET surface area (m2 g−1) | 8 | 9.83 | 98 | 118 |
| Total pore volume (cm3 g−1) | 0.017 | 0.019 | 0.030 | 0.032 |
| Micropore volume (cm3 g−1) 2 | 0 | 0 | 0.009 | 0.003 |
| Micropore area (m2/g) 3 | 0 (0) | 0 (0) | 3.3 (3.4) | 9.97 (8.4) |
| Mesopore area (m2/g) | 8 | 9.83 | 94.7 | 108.03 |
| Mean pore diameter (nm) | 3.2 | 2.8 | 25.3 | 25.7 |
1Average diameter of Au particles determined by counting around 200 particles on the TEM images using the equation: where ni is the number of particle of diameter di;2Cumulative pore volumes obtained using Horvath-Kawazoe method;3In brackets: percentage of micropore area with respect to the total surface area.
References
- Trimm, D.L. Review: Minimisation of carbon monoxide in a hydrogen stream for fuel cell application. Appl. Catal. A Gen. 2005, 296, 1–11. [Google Scholar]
- Ruettinger, W.; Ilinich, O.; Farrauto, R.J. A new generation of water gas shift catalysts for fuel cell applications. J. Power Sources 2003, 118, 61–65. [Google Scholar]
- Gorte, R.J.; Zhao, S. Studies of the water-gas-shift reaction with ceria-supported precious metals. Catal. Today 2005, 104, 18–24. [Google Scholar]
- Fu, Q.; Deng, W.; Saltsburg, H.; Flytzani-Stephanopoulos, M. Activity and stability of low-content gold-cerium oxide catalysts for the water-gas shift reaction. Appl. Catal. B Environ. 2005, 56, 57–68. [Google Scholar]
- Tabakova, T.; Idakiev, V.; Tenchev, K.; Boccuzzi, F.; Manzoli, M.; Chiorino, A. Pure hydrogen production on a new gold-thoria catalyst for fuel cell applications. Appl. Catal. B Environ. 2006, 63, 94–103. [Google Scholar]
- Panagiotopoulou, P.; Kondarides, D.I. A comparative study of the water-gas shift activity of Pt catalysts supported on single (MOx) and composite (MOx/Al2O3, MOx/TiO2) metal oxide carriers. Catal. Today 2007, 127, 319–329. [Google Scholar]
- Tabakova, T.; Manzoli, M.; Vindigni, F.; Idakiev, V.; Boccuzzi, F. CO-free hydrogen production for fuel cell applications over Au/CeO2 catalysts: FTIR insight into the role of dopant. J. Phys. Chem. A 2010, 114, 3909–3915. [Google Scholar]
- Kugai, J.; Miller, J.T.; Guo, N.; Song, C. Role of metal components in Pd-Cu bimetallic catalysts supported on CeO2 for the oxygen-enhanced water gas shift. Appl. Catal. B Environ. 2011, 105, 306–316. [Google Scholar]
- Kugai, J.; Miller, J.T.; Guo, N.; Song, C. Oxygen-enhanced water gas shift on ceria-supported Pd-Cu and Pt-Cu bimetallic catalysts. J. Catal. 2011, 277, 46–53. [Google Scholar]
- Luengnaruemitchai, A.; Osuwan, S.; Gulati, E. Comparative studies of low temperature water gas shift reaction over Pt-CeO2; Au-CeO2 and Au-Fe2O3 catalysts. Catal. Commun. 2003, 4, 215–221. [Google Scholar]
- Andreeva, D.; Idakiev, V.; Tabakova, T.; Ilieva, L.; Falaras, P.; Bourlinosand, A.; Travlos, A. Low temperature water gas shift reaction over Au-CeO2 catalysts. Catal. Today 2002, 72, 51–57. [Google Scholar]
- Goguet, A.; Meunier, F.C.; Breen, J.P.; Burch, R.; Petch, M.I.; Ghenciu, A.F. Study of the origin of the deactivation of a Pt/CeO2 catalyst during inverse water gas shift (RWGS) reaction. J. Catal. 2004, 226, 382–392. [Google Scholar]
- Goerke, O.; Pfeifer, P.; Schubert, K. Selective oxidation of CO in microreactors. Appl. Catal. A 2004, 263, 11–18. [Google Scholar]
- Xue, E.; O'Keefe, M.; Ross, J.R.H. Water gas shift conversion using a feed with a low steam to carbon monoxide ratio and containing sulfur. Catal. Today 1996, 30, 107–118. [Google Scholar]
- Boccuzzi, D.F.; Chiorino, A.; Manzoli, M.; Andreeva, A.; Tabakova, T.; Ilievab, L.; Ladakiev, L. Gold, silver and copper catalysts supported on TiO2 for pure hydrocarbon production. Catal. Today 2002, 75, 169–175. [Google Scholar]
- Andreeva, D.; Idakiev, V.; Tabakova, T.; Andreeva, A. Low temperature water gas shift reaction over Au-a-Fe2O3. J. Catal. 1998, 158, 354–355. [Google Scholar]
- Burch, R. Gold catalysts for pure hydrogen production in the water-gas shift reaction: Activity, structure and reaction mechanism. Phys. Chem. Chem. Phys. 2006, 8, 5483–5500. [Google Scholar]
- Tibiletti, D.; Amieiro-Fonseca, A.; Burch, R.; Chen, Y.; Fisher, J.M.; Goguet, A.; Hardacre, C.; Hu, P.; Thompsett, D. DFT and in-situ EXAFS investigation of gold/ceria zirconia low temperature water gas shift catalysts: Identification of the nature of active form of gold. J. Phys. Chem. B 2005, 109, 22553–22559. [Google Scholar]
- De la Osa, A.R.; de Lucas, A.; Valverde, J.L.; Romero, A.; Monteagudo, I.; Sánchez, P. Performance of a sulfur-resistant commercial WGS catalyst employing industrial coal-derived syngas feed. Int. J. Hydrog. Energy 2011, 36, 44–51. [Google Scholar]
- De la Osa, A.R.; de Lucas, A.; Romero, A.; Valverde, J.L.; Sánchez, P. Kinetic models discrimination for the high pressure WGS reaction over a commercial CoMo catalyst. Int. J. Hydrog. Energy 2011, 36, 9673–9684. [Google Scholar]
- Prati, L.; Rossi, M. Gold on carbon as a new catalyst for selective liquid phase oxidation of diols. J. Catal. 1998, 176, 552–560. [Google Scholar]
- Demirel, S.; Kern, P.; Lucas, M.; Claus, P. Oxidation of mono- and polyalcohols with gold: Comparison of carbon and ceria supported catalysts. Catal. Today 2007, 122, 292–300. [Google Scholar]
- Demirel, S.; Lehnert, K.; Lucas, M.; Claus, P. Use of renewables for the production of chemicals: Glycerol oxidation over carbon supported gold catalysts. Appl. Catal. B 2007, 70, 637–643. [Google Scholar]
- Serp, P.; Corrias, M.; Kalck, P. Carbon nanotubes and nanofibers in catalysis. Appl. Catal. A 2003, 253, 337–358. [Google Scholar]
- Rodríguez-Reinoso, F. The role of carbon materials in heterogeneous catalysis. Carbon 1998, 36, 159–175. [Google Scholar]
- Park, C.; Keane, M.A. Catalyst support effects: Gas-phase hydrogenation of phenol over palladium. J. Colloid Interface Sci. 2003, 266, 183–194. [Google Scholar]
- Díaz, E.; Casas, J.A.; Mohedano, A.F.; Calvo, L.; Gilarranz, M.A.; Rodríguez, J.J. Kinetics of 4-chlorophenol hydrodechlorination with alumina and activated carbon-supported Pd and Rh catalysts. Ind. Eng. Chem. Res. 2009, 48, 3351–3358. [Google Scholar]
- Bedia, J.; Rosas, J.M.; Rodríguez-Mirasol, J.; Cordero, T. Pd supported on mesoporous activated carbons with high oxidation resistance as catalysts for toluene oxidation. Appl. Catal. B 2010, 9, 8–18. [Google Scholar]
- De Jong, K.P.; Geus, J.W. Carbon nanofibers: Catalytic synthesis and applications. Catal. Rev. Sci. Eng. 2000, 42, 481–510. [Google Scholar]
- Amorim, C.; Yuan, G.; Patterson, P.M.; Keane, M.A. Catalytic hydrodechlorination over Pd supported on amorphous and structured carbon. J. Catal. 2005, 234, 268–281. [Google Scholar]
- Nieto-Márquez, A.; Gil, S.; Romero, A.; Valverde, J.L.; Gómez-Quero, S.; Keane, M.A. Gas phase hydrogenation of nitrobenzene over acid treated structured and amorphous carbon supported Ni catalysts. Appl. Catal. A 2009, 363, 188–198. [Google Scholar]
- Taboada, C.D.; Batista, J.; Pintar, A.; Levec, J. Preparation, characterization and catalytic properties of carbon nanofiber-supported PT, Pd, Ru monometallic particles in aqueous-phase reactions. Appl. Catal. B 2009, 89, 375–382. [Google Scholar]
- Bezemer, G.L.; Radstake, P.B.; Koot, V.; van Dillen, A.J.; Geus, J.W.; de Jong, K.P. Preparation of Fischer-Tropsch cobalt catalysts supported on carbon nanofibers and silica using homogeneous deposition-precipitation. J. Catal. 2006, 237, 291–302. [Google Scholar]
- Liang, C.; Li, Z.; Qiu, J.; Li, C. Graphitic nanofilaments as novel support of Ru-Ba catalysts for ammonia synthesis. J. Catal. 2002, 211, 278–282. [Google Scholar]
- Amorim, C.; Keane, M.A. Effect of surface acid groups associated with amorphous and structured carbon on the catalytic hydrodechlorination of chlorobenzene. J. Chem. Technol. Biotechnol. 2008, 83, 662–672. [Google Scholar]
- Sing, K.S.W.; Everett, D.H.; Haul, R.A.W.; Moscou, L.; Pierotti, R.A.; Rouquerol, J.; Siemieniewska, T. Reporting physisorption data for gas/solid systems with special reference to the determinarion of surface area and porosity. Pure Appl. Chem. 1985, 57, 603–619. [Google Scholar]
- Park, C.; Keane, M.A. Catalyst support effects in the growth of structured carbon from the decomposition of ethylene over nickel. J. Catal. 2004, 221, 386–399. [Google Scholar]
- Bom, D.; Andrews, R.; Jacques, D.; Anthony, J.; Chen, B.; Meier, M.S.; Selegue, J.P. Thermogravimetric analysis of the oxidation of multiwalled carbon nanotubes: Evidence for the role of defect sites in carbon nanotube chemistry. Nano Lett. 2002, 2, 615–619. [Google Scholar]
- Choi, S.; Park, K.H.; Lee, S.; Koh, K.H. Raman spectra of nano-structured carbon films synthesized using ammonia-containing feed gas. J. Appl. Phys. 2002, 92, 4007:1–4007:5. [Google Scholar]
- Cárdenas-Lizana, F.; Gómez-Quero, S.; Perret, N.; Keane, M.A. Gold catalysis at the gas-solid interface: Role of the support in determining activity and selectivity in the hydrogenation of m-dinitrobenzene. Catal. Sci. Technol. 2011, 1, 652–661. [Google Scholar]
- Demirel-Gülen, S.; Lucas, M.; Claus, P. Liquid phase oxidation of glycerol over carbon supported gold catalysts. Catal. Today 2005, 102, 166–172. [Google Scholar]
- Ketchie, W.C.; Fang, Y.-L.; Wong, M.S.; Murayama, M.; Davis, R.J. Influence of gold particle size on aqueous-phase oxidation of carbon monoxide and glycerol. J. Catal. 2007, 250, 94–101. [Google Scholar]
- Coloma, F.; Sepúlveda-Escribano, A.; Fierro, J.L.G.; Rodríguez-Reinoso, F. Gas phase hydrogenation of crotonaldehyde over Pt/activated carbon catalysts. Influence of the oxygen surface groups on the support. Appl. Catal. A 1997, 150, 165–183. [Google Scholar]
- Aksoylu, A.E.; Freitas, M.M.A.; Pereira, M.F.R.; Figueiredo, J.L. Effects of different activated carbon supports and support modifications on the properties of Pt/AC catalysts. Carbon 2001, 39, 175–185. [Google Scholar]
- Jiménez, V.; Sánchez, P.; Valverde, J.L.; Romero, A. Effect of the nature the carbon precursor on the physic-chemical characteristics of the resulting activated carbon materials. Mater. Chem. Phys. 2010, 124, 223–233. [Google Scholar]
- Wang, F.; Lu, G. The effect of K addition on Au/activated carbon for CO selective oxidation in hydrogen-rich gas. Catal. Lett. 2007, 115, 46–51. [Google Scholar]
- Sobczak, I.; Jagodzinska, K.; Ziolek, M. Glycerol oxidation on gold catalysts supported on group five metal oxides—A comparative study with other metal oxides and carbon based catalysts. Catal. Today 2010, 158, 121–129. [Google Scholar]
- Bessel, C.A.; Laubernds, K.; Rodriguez, N.M.; Baker, R.T.K. Graphite nanofibers as an electrode for fuel cell applications. J. Phys. Chem. B 2001, 105, 1115–1118. [Google Scholar]
- Yu, J.L.; Tian, F.J.; Mckenzie, L.J.; Li, C.Z. Char-supported nano iron catalyst for water-gas-shift reaction: Hydrogen production from coal/biomass gasification. Process safety and environmental protection. Trans. Inst. Chem. Eng. Part B 2006, 84, 125–130. [Google Scholar]
- Djinovic, P.; Batista, J.; Pintar, A. Calcination temperature and CuO loading dependence on CuOCeO2 catalyst activity for water-gas shift reaction. Appl. Catal. A Gen. 2008, 347, 23–33. [Google Scholar]
- Gunawardana, P.V.D.S.; Lee, H.C.; Kim, D.H. Performance of copper-ceria catalysts for water gas shift reaction in medium temperature range. Int. J. Hydrog. Energy 2009, 34, 1336–1341. [Google Scholar]
- Andreeva, D.; Ivanov, I.; Ilieva, L.; Sobczak, J.W.; Avdeev, G.; Tabakova, T. Nanosized gold catalysts supported on ceria and ceria-alumina for water gas shift reaction. Appl. Catal. A Gen. 2007, 333, 153–160. [Google Scholar]
- Karpenko, A.; Leppelt, R.; Plzak, V.; Behm, R.J. Deactivation of a Au-CeO2 catalyst during the low temperature water gas shift reaction and its reactivation: A combined TEM, XRD, XPS, DRIFTS and activity study. J. Catal. 2007, 252, 231–242. [Google Scholar]
- Janssens, T.V.W.; Clausen, B.S.; Hvrolbek, B.; Falsig, H.; Christensen, C.H.; Bligaard, T.; Norskov, J.K. Insights into the reactivity of supported gold nanoparticles: Combining theory and experiments. Top. Catal. 2007, 44, 15–26. [Google Scholar]
- Effendi, A.; Hellgardt, K.; Zhang, Z.G.; Yoshida, T. Optimizing H2 production from model biogas via combined steam reforming and CO shift reactions. Fuel 2005, 84, 869–874. [Google Scholar]
- Zhang, R.; Cummer, K.; Suby, A.; Brown, R.C. Biomass-derived hydrogen from an air-blown gasifier. Fuel Process. Technol. 2005, 86, 861–874. [Google Scholar]
- Ghenciu, A.F. Review of fuel processing catalysts for hydrogen production in PEM fuel cell systems. Curr. Opin. Solid State Mater. Sci. 2002, 6, 389–399. [Google Scholar]
- Jiménez, V.; Nieto-Márquez, A.; Díaz, J.A.; Romero, R.; Sánchez, P.; Valverde, J.L.; Romero, A. Pilot plant study of the influence of the operating conditions in the production of carbon nanofibers. Ind. Eng. Chem. Res. 2009, 48, 8407–8417. [Google Scholar]
- Panagiotopoulou, P.; Kondarides, D.I.; Verykios, X.E. Selective methanation of CO over supported noble metal catalysts: Effects of the nature of the metallic phase on catalytic performance. Appl. Catal. A Gen. 2008, 344, 45–54. [Google Scholar]
- Guerrero-Ruiz, A.; Sepúlveda-Escribano, A.; Rodríguez-Ramos, I. Carbon-supported bimetallic catalysts containing iron. II. Catalytic behaviour in benzene hydrogenation and thiophene hydrodesulphurization. Appl. Catal. A 1992, 81, 101–112. [Google Scholar]
© 2011 by the authors; licensee MDPI, Basel, Switzerland. This article is an open access article distributed under the terms and conditions of the Creative Commons Attribution license (http://creativecommons.org/licenses/by/3.0/).
Share and Cite
Gil, S.; Romero, A.; Lucas, A.d.; Sánchez, P.; Dorado, F.; Osa, A.R.d.l.; García-Vargas, J.M.; Valverde, J.L. Nano-Scale Au Supported on Carbon Materials for the Low Temperature Water Gas Shift (WGS) Reaction. Catalysts 2011, 1, 155-174. https://doi.org/10.3390/catal1010155
Gil S, Romero A, Lucas Ad, Sánchez P, Dorado F, Osa ARdl, García-Vargas JM, Valverde JL. Nano-Scale Au Supported on Carbon Materials for the Low Temperature Water Gas Shift (WGS) Reaction. Catalysts. 2011; 1(1):155-174. https://doi.org/10.3390/catal1010155
Chicago/Turabian StyleGil, Sonia, Amaya Romero, Antonio de Lucas, Paula Sánchez, Fernando Dorado, Ana Raquel de la Osa, Jesús Manuel García-Vargas, and Jose Luis Valverde. 2011. "Nano-Scale Au Supported on Carbon Materials for the Low Temperature Water Gas Shift (WGS) Reaction" Catalysts 1, no. 1: 155-174. https://doi.org/10.3390/catal1010155