Article

Advantages of the Biomimetic Nanostructured Films as an Immobilization Method vs. the Carbon Paste Classical Method

by
Constantin Apetrei
1,*,
Jose Antonio de Saja
2,
Javier Zurro
3 and
Maria Luz Rodríguez-Méndez
4
1
Department of Chemistry, Physics and Environment, Faculty of Sciences and Environment, “Dunărea de Jos” University of Galaţi, 47 Domneasca Street, 800008 Galaţi, Romania
2
Department of Condensed Matter Physics, Faculty of Sciences, University of Valladolid, Prado de la Magdalena s/n, 47011 Valladolid, Spain
3
Infirmary School Palencia, University of Valladolid, 44 Avda. de Madrid, 34004, Palencia, Spain
4
Department of Physical Chemistry and Inorganic Chemistry, Industrial Engineering School, University of Valladolid, Paseo del Cauce 9, 47011 Valladolid, Spain
*
Author to whom correspondence should be addressed.
Catalysts 2012, 2(4), 517-531; https://doi.org/10.3390/catal2040517
Submission received: 27 September 2012 / Revised: 26 October 2012 / Accepted: 1 November 2012 / Published: 9 November 2012
(This article belongs to the Special Issue Biomimetic Catalysts)

Abstract

:
Tyrosinase-based biosensors containing a phthalocyanine as electron mediator have been prepared by two different methods. In the first approach, the enzyme and the electron mediator have been immobilized in carbon paste electrodes. In the second method, they have been introduced in an arachidic acid Langmuir-Blodgett nanostructured film that provides a biomimetic environment. The sensing properties of non-nanostructured and nanostructured biosensors towards catechol, catechin and phenol have been analyzed and compared. The enzyme retains the biocatalytic properties in both matrixes. However, the nanostructured biomimetic films show higher values of maximum reaction rates and lowest apparent Michaelis-Menten constants. In both types of sensors, the sensitivity follows the decreasing order catechol > catechin > phenol. The detection limits observed are in the range of 1.8–5.4 μM for Langmuir-Blodgett biosensors and 8.19–8.57 μM for carbon paste biosensors. In summary, it has been demonstrated that the Langmuir-Blodgett films provide a biomimetic environment and nanostructured biosensors show better performances in terms of kinetic, detection limit and stability.

1. Introduction

Phenolic compounds are widespread in nature. Some of them are considered pollutants when released in the environment due to their toxicity [1,2]. However, phenolic and polyphenolic compounds naturally occur in vegetables, fruits, and processed foods and beverages [3,4,5]. They are of interest as antioxidants in diet because they inhibit or delay the oxidation processes by blocking the initiation of oxidizing chain reactions [6,7]. Moreover, phenolic compounds play an important role in the organoleptic properties of foods and beverages such as wines, olive oils, teas, etc., providing them with a characteristic flavor and color [4,5,8,9].
Several methods have been developed to assess the content of polyphenols in foods and beverages including chromatographic methods [10,11], capillary electrophoresis [12], spectrophotometry [13] and electrochemical methods [14,15].
Polyphenols are electroactive compounds that can be easily oxidized at inert electrodes. This is the basis of amperometric and voltammetric sensors [16,17]. Electrodes chemically modified can be an advantage because the electrocatalytic activity of a variety of modifiers (carbon nanotubes, porphyrins, phthalocyanines, etc.) can reduce the oxidation potential while increasing the intensity of the electrochemical response [18,19,20,21,22].
Biosensors chemically modified with tyrosinase, laccase or peroxidase have the advantage of the specificity enzyme-substrate [23,24,25]. Biosensors based on aptamers and nucleic acids are also developed that are characterized by a high biomolecule-substrate specificity [26]. Numerous amperometric biosensors for the determination of phenolic compounds have been developed using tyrosinase immobilized on different electrode supports. The immobilization methods include carbon paste biosensors [27], conducting polymer modified electrodes [28,29], biosensors based on silica sol–gel composite films [30], Langmuir-Blodgett (LB) thin films [31,32,33], Layer-by-layer (LbL) films [34], and self-assembled monolayers [35].
The LbL and the LB techniques are of special interest for enzyme immobilization because the enzyme can be adsorbed in a biomimetic environment provided by a lipidic bilayer. It has been suggested that this well ordered films mimicking biological membranes could preserve the enzyme structure and hence the enzymatic activity [31,36]. The objective of the present work is to evaluate the advantages of the biomimetic nanostructured films such as in the immobilization method vs. classical methods such as the immobilization in a carbon paste electrode. For this purpose, carbon paste biosensors and LB biosensors based on tyrosinase and lutetium (III) bisphthalocyaninate as electron mediator have been prepared and their capability to detect phenolic compounds (catechol, catechin and phenol) in terms of detection limit, kinetics and stability have been compared.

2. Results and Discussion

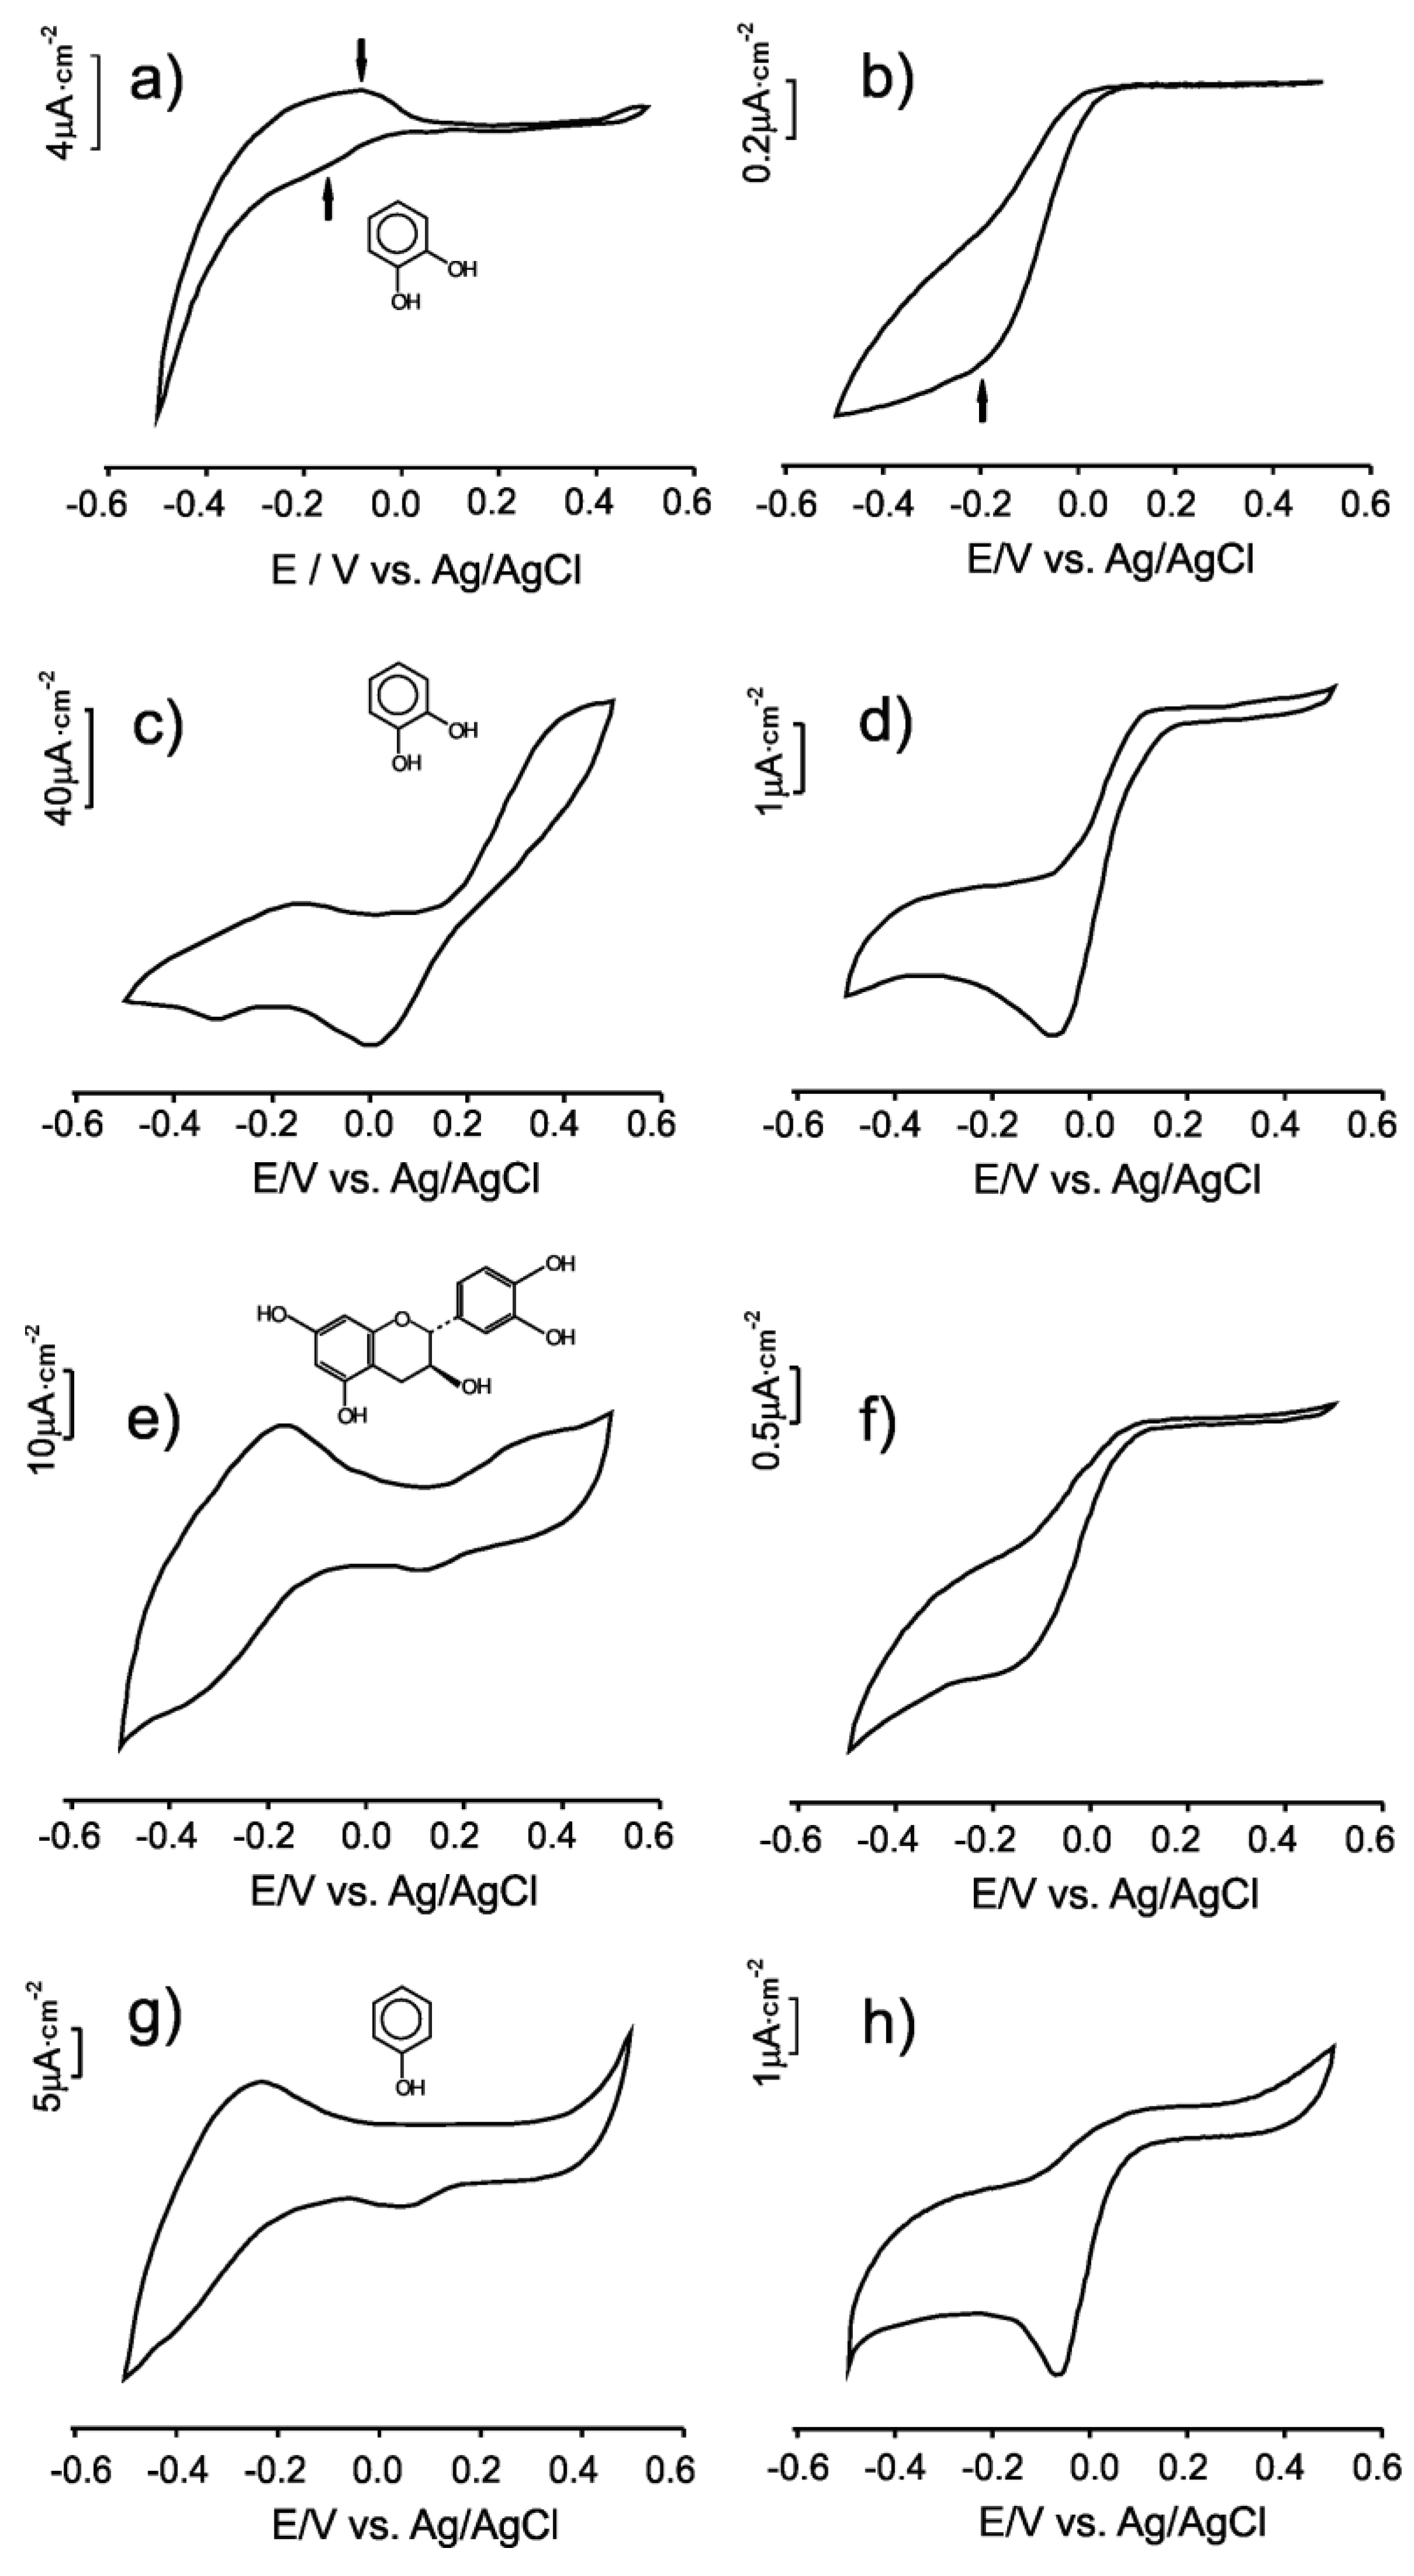
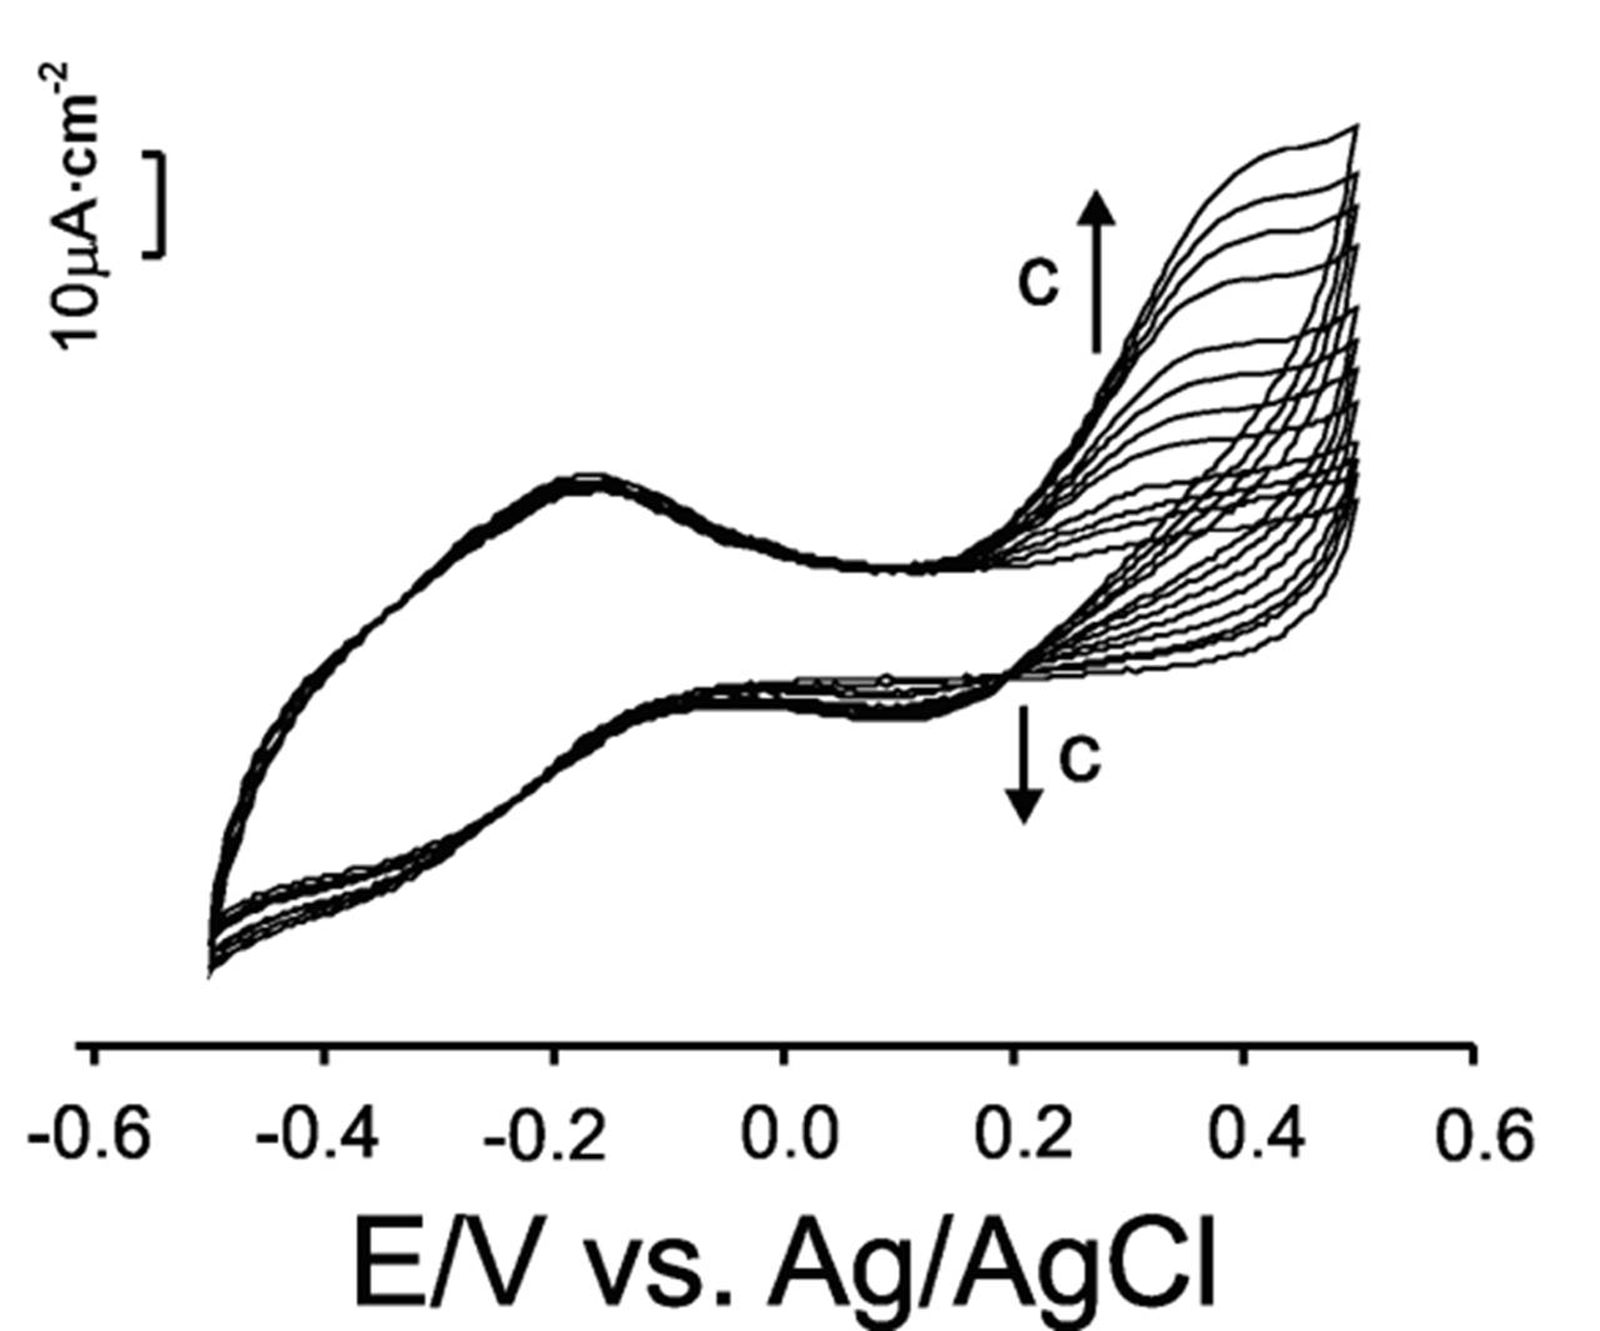
2.1. Electrochemical Response towards Phenols

Tyrosinase is a copper-containing enzyme that converts phenolic compounds to the corresponding quinones in the presence of oxygen [25]. In order to explore the influence of the immobilization matrix in the performance of the biosensors, Langmuir-Blodgett (LB) and carbon paste electrodes (CPE) were constructed and immersed in 4 × 10⁻⁴ M phosphate buffer solutions (0.01 M, pH 7) containing one monophenol (phenol), one diphenol (catechol) or one polyphenol (catechin). The response of the biosensors was registered in the range from −0.5 V to +0.5 V at a scan rate of 0.050 V × s−1.
In previous works, it has been demonstrated that the presence of lutetium bisphthalocyanine (LuPc2) electron mediator improves the sensitivity of the Langmuir-Blodgett biosensors towards phenols [31,32,33]. A similar effect has been observed here for CPE biosensors. This is illustrated in Figure 1 where the electrochemical response of LB (Figure 1a,c) and CPE electrodes (Figure 1b,d) towards catechol with and without electron mediator is shown.
In absence of electron mediator, the enzyme oxidizes the phenol to the quinoid form, whose back electrochemical reduction can be detected at −0.2 V versus Ag/AgCl/KCl 3 M. (Figure 1a,b). In the presence of the lutetium bisphthalocyanine, the intensity of the cathodic peak at −0.2 V increases both in LB and CPE sensors, but in the case of LB films the increase is of almost one order of magnitude. Simultaneously a shift to lower potentials is observed in the presence of LuPc2. The shift is more marked in LB films where it appears at positive potentials (+0.1 V) (Figure 1.a) whereas in CPE electrodes the peak is observed at ca. −0.1 V (Figure 1.b). This result seems to indicate that the biomimetic environment provided by the LB films improves the interaction between the phthalocyanine, the enzyme and the phenol, facilitating the electron transfer and hence the biocatalytic activity.
The presence of LuPc2 is also involved in two other interesting observations. First, a redox pair associated to the reversible one electron reduction of the phthalocyanine ring should be observed at E1/2 of ca. −0.24 V [37,38]. Surprisingly, this peak is clearly seen in biomimetic LB films, but it is almost absent in the CPE electrodes. Secondly, in the presence of the electron mediator, an anodic peak at +0.38 V associated to the electrochemical oxidation (non enzymatically mediated) of catechol is observed in LB film based electrodes. As reported in previous studies, the oxidation peak of catechol (using carbon electrodes) appears at 0.59 V (at pH 3.6) [16]. According to this result, it can be concluded that the presence of LuPc2 facilitates the oxidation of catechol, which occurs at lower potentials than in carbon electrodes, confirming the electrocatalytic effect of the LuPc2. It is important to remark that this anodic peak is clearly observed in LB films but cannot be observed in CPE sensors. Because the electrocatalytic effect of the LuPc2 is not so efficient in CPE electrodes, the non enzymatic oxidation peak appears at higher potentials and cannot be observed in the voltage range studied.
Apart from the differences in positions and relative intensities of the peaks from LB to CPE sensors, it is also remarkable that the intensity of the voltammograms registered using biomimetic electrodes is clearly higher (ca. one order of magnitude) than the intensity measured in non biomimetic electrodes.
The response of the biosensors towards other phenolic compounds including catechin (Figure 1e,f) and phenol (Figure 1g,h) has also been studied. As observed in the figure, tyrosinase is able to use mono, di- and polyhydroxyphenols as substrates, but the affinity depends on the nature of the phenolic species.
Figure 1. Cyclic voltammograms of Langmuir-Blodgett (LB) and carbon paste electrode (CPE) biosensors immersed in 4 × 10⁻⁴ M catechol (in phosphate solution (PBS), pH = 7): (a) Ty-LB, (b) Ty-CPE, (c) Ty/LuPc2-LB and (d) Ty/LuPc2-CPE; Cyclic voltammograms biosensors immersed in 4 × 10⁻⁴ M catechin (in PBS, pH = 7): (e) Ty-LB and (f) Ty-CPE; Cyclic voltammograms biosensors immersed in 4 × 10⁻⁴ M phenol (in PBS, pH = 7): (g) Ty/LuPc2-LB, (h) Ty/LuPc2-CPE. Scan rate was 0.05 V × s−1.
Catalysts 02 00517 g001
The response towards catechin, displays the same general behavior than the response towards catechol, but some particularities are observed. For both phenols, the cyclic voltammograms exhibit (a) a cathodic peak at ca. −0.1 V related to the reduction of the previously oxidized o-quinone, (b) an anodic peak at ca. 0.4 V associated to the electrochemical oxidation of the phenol and (c) the redox pair associated to the phthalocyanine. The affinity of the enzyme towards catechin is lower than the affinity to catechol (a diphenol). For this reason, the intensity of the peaks related to catechin (both anodic electrochemical oxidation of phenol and cathodic reduction of the o-quinone) is lower than that of the phthalocyanine. The main difference is that the intensity of the reduction peak observed when catechin solution was analyzed appear at +0.1 V for LB biosensor and −0.08 V for the CPE biosensor. The electrochemical oxidation of catechin appears only in the case of LB biosensor (at +0.3 V) and cannot be clearly observed in the CPE.
In previous studies, it has been established that the oxidation peak of catechin appears at 0.455 V (at pH 3) and the formal potential increases by 0.066 V per pH unit [16]. Taking into account these preceding data, it can be concluded that the presence of LuPc2 facilitates the oxidation of catechin, which occurs at lower potentials than in carbon electrodes; in addition, the electron mediator increases drastically the intensity of the signals of both the enzymatic and the electrochemical process with respect to the signals obtained in absence of the electron mediator thus demonstrating an electrocatalytic effect of the system.
Finally, the LB biosensor immersed in phenol solution shows a reduction peak at +0.01 V. In the case of the CPE biosensor the reduction peak appear at −0.07 V. The presence of the reduction peak indicates that the enzyme shows certain biological activity in both solid substrates. However, the anodic peak corresponding to the oxidation of the phenol is not observed nor in LB or in CPE electrodes.
Therefore, the value of the potential that must be applied to monitor reduction or oxidation of the species at the electrode surface was in −0.08 to +0.1 V range, potential frame that allows to reach a minimum of possible electrochemical interferences.

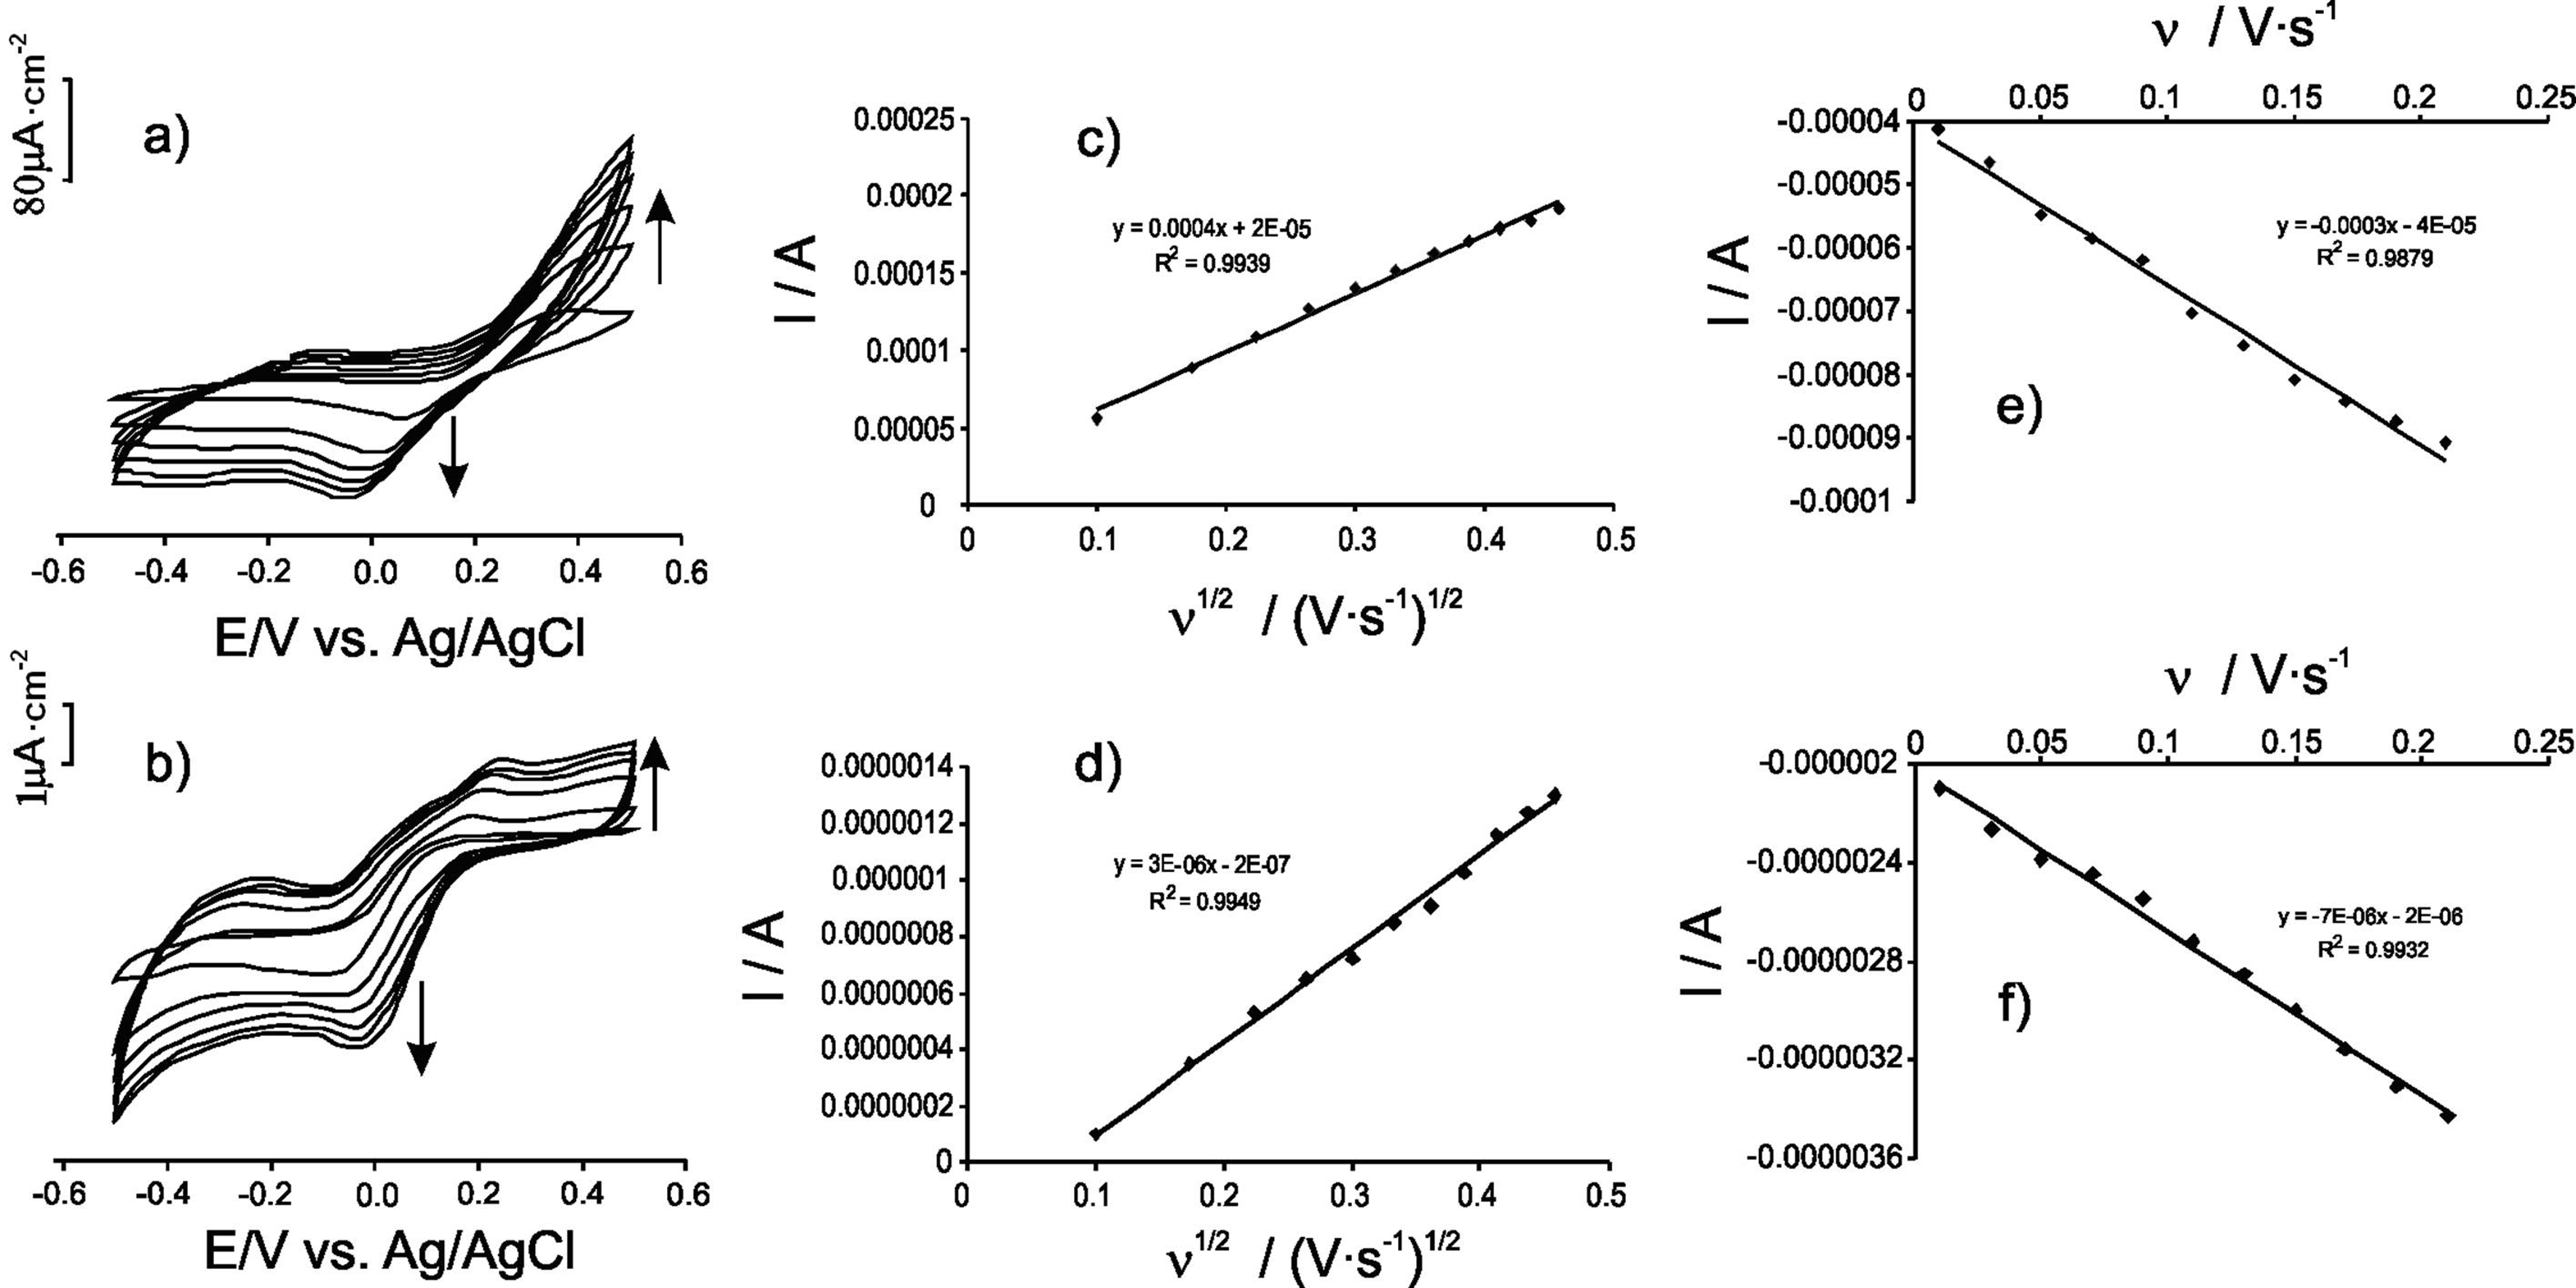
2.2. Influence of Scan Rate in Biosensors Response

Influence of scan rate in biosensors response was carried out by registering the cyclic voltammograms of the biosensors at different sweep rates, from 0.01 to 0.21 V × s−1. The effect of the scan rate is illustrated in Figure 2 for catechol (Not all CVs are shown).
In both classes of electrodes, the intensity of the cathodic peak (at ca. −0.1 V) resulting from the reduction of the o-quinone enzymatically formed, were proportional to the sweep rate, according to the Laviron equation (Equation 1) (Figure 2c,d):
Ic = n2F2 νAΓ/4 RT
where Ic is the cathodic peak current (Ampere), n is the number of electrons involved in the redox process, F is the Faraday constant (F = 96,485.3365 C/mol), ν is the potential scan rate (V × s−1), A is the electrode area (cm2), Γ is the surface coverage of the redox species (mol × cm−2), R is the ideal gas constant (8.3144621 J × K−1 × mol−1) and T is the temperature (K) [39]. This linear relationship between I and the scan rate indicates that there is no diffusion limitation and that redox processes are controlled by the electron transfer of the adsorbed species at the electrode surface [40,41]. From the slope of the I vs. ν graph the total surface coverage Γ could be calculated. The principal parameters of linear regression equation of the plots Ic vs. ν are presented in Table 1.
Figure 2. (a) Cyclic voltammograms of Ty/LuPc2-LB registered at different scan rates; (b) Cyclic voltammograms of Ty/LuPc2-CPE registered at different scan rates; (c) Plot of Ipa versus ν1/2 for Ty/LuPc2-LB; (d) Plot of Ipa versus ν1/2 for Ty/LuPc2-CPE; (e) Plot of Ipc versus ν1/2 for Ty/LuPc2-LB; (f) Plot of Ipc versus ν1/2 for Ty/LuPc2-CPE. Electrolyte solution was 4 × 10⁻⁴ M catechol (in PBS 0.01M, pH = 7).
Catalysts 02 00517 g002
Table 1. Quantitative data obtained from influence of scan rate in biosensors response studies applied to the cathodic peak at 0.1V.
Phenolic compoundTy/LuPc2-LB
m/A·s·V−1R2Γ/mol·cm−2
Catechol−3 ×·10-40.98797.98·× 10−11
Catechin−7·× 10-50.99871.86·× 10−11
Phenol−4·× 10-50.97881.12·× 10−11
Ty/LuPc2-CPE
m/A·s·V−1R2Γ/mol·cm−2
Catechol−7·× 10−60.99322.64·× 10−12
Catechin−9·× 10−70.98683.39·× 10−12
Phenol−7·×10−70.97982.75·× 10−12
m- is the slope of the plots Ic vs. v.
As observed in the Table, the Ty/LuPc2-LB biosensors showed higher surface coverage values (Γ) than CPEs, indicating that the number of active sites is superior in the nanostructured LB thin films than in the carbon-based matrix sensors. From this data it can be deduced that nanostructured sensors show an improvement of the enzymatic activity which is related to the higher surface area provided by the nanostructured environment and to the preservation of the enzymatic activity in the biomimetic environment.
The influence of the scan rate in the intensity of the peaks was also studied using the peak related to the electrochemical oxidation of catechol and catechin (anodic peak at ca. 0.4 V) (this peak was absent in phenol). In the case of the LB films, the intensity of this peak increased linearly with the square root of the sweep rate (Figure 2c,d) indicating a diffusion controlled processes in accordance with the Randles-Sevcik equation (Equation 2) [37]:
Ipa = 2.687 × 10⁵n3/2ν 1/2D1/2AC
where Ipa is the anodic peak current (Ampere), n is the number of electrons involved in the redox process, ν is the potential scan rate (V × s−1), D is the diffusion coefficient (cm2 × s−1), A is the electrode surface area (cm2), and C is the concentration (mM). From the slope of Ia vs. v1/2 plot, the diffusion coefficient D could be calculated (Table 2).
Table 2. Quantitative data obtained from influence of scan rate in biosensors response studies applied to the anodic peak at 0.4 V.
Phenolic compoundTy/LuPc2-LB
m/A·s1/2·V−1/2R2D/cm2·s−1
Catechol4·× 10−40.99391.73·× 10−6
Catechin9·× 10−50.99328.76·× 10−8
Phenol---
Ty/LuPc2-CPE
m/A·s1/2·V−1/2R2D/cm2·s−1
Catechol3·× 10−60.99491.95 ×·10−8
Catechin7·× 10−70.98481.06·× 10−9
Phenol---
m- is the slope of the plots Ia vs. v1/2.
In the case of CPEs, and in voltammograms registered at low scan rates, the anodic peak at 0.4 V was very weak. Nevertheless, when increasing the scan rate, the intensity of the peak increased progressively and the peak could be clearly observed at high scan rates. The intensity of the anodic peak shown by CPE sensors was also linearly dependent with the square root of the scan rate following the Randles-Sevcik equation, where the diffusion of species (from the bulk to the electrode surface and inside the sensitive layer) is controlling the process.
From the results displayed in Table 2, it is evidenced that the Ty/LuPc2-LB sensors showed diffusion coefficients two orders of magnitude higher than CPE sensors pointing that the electrochemical processes are faster in the case of nanostructured thin film.

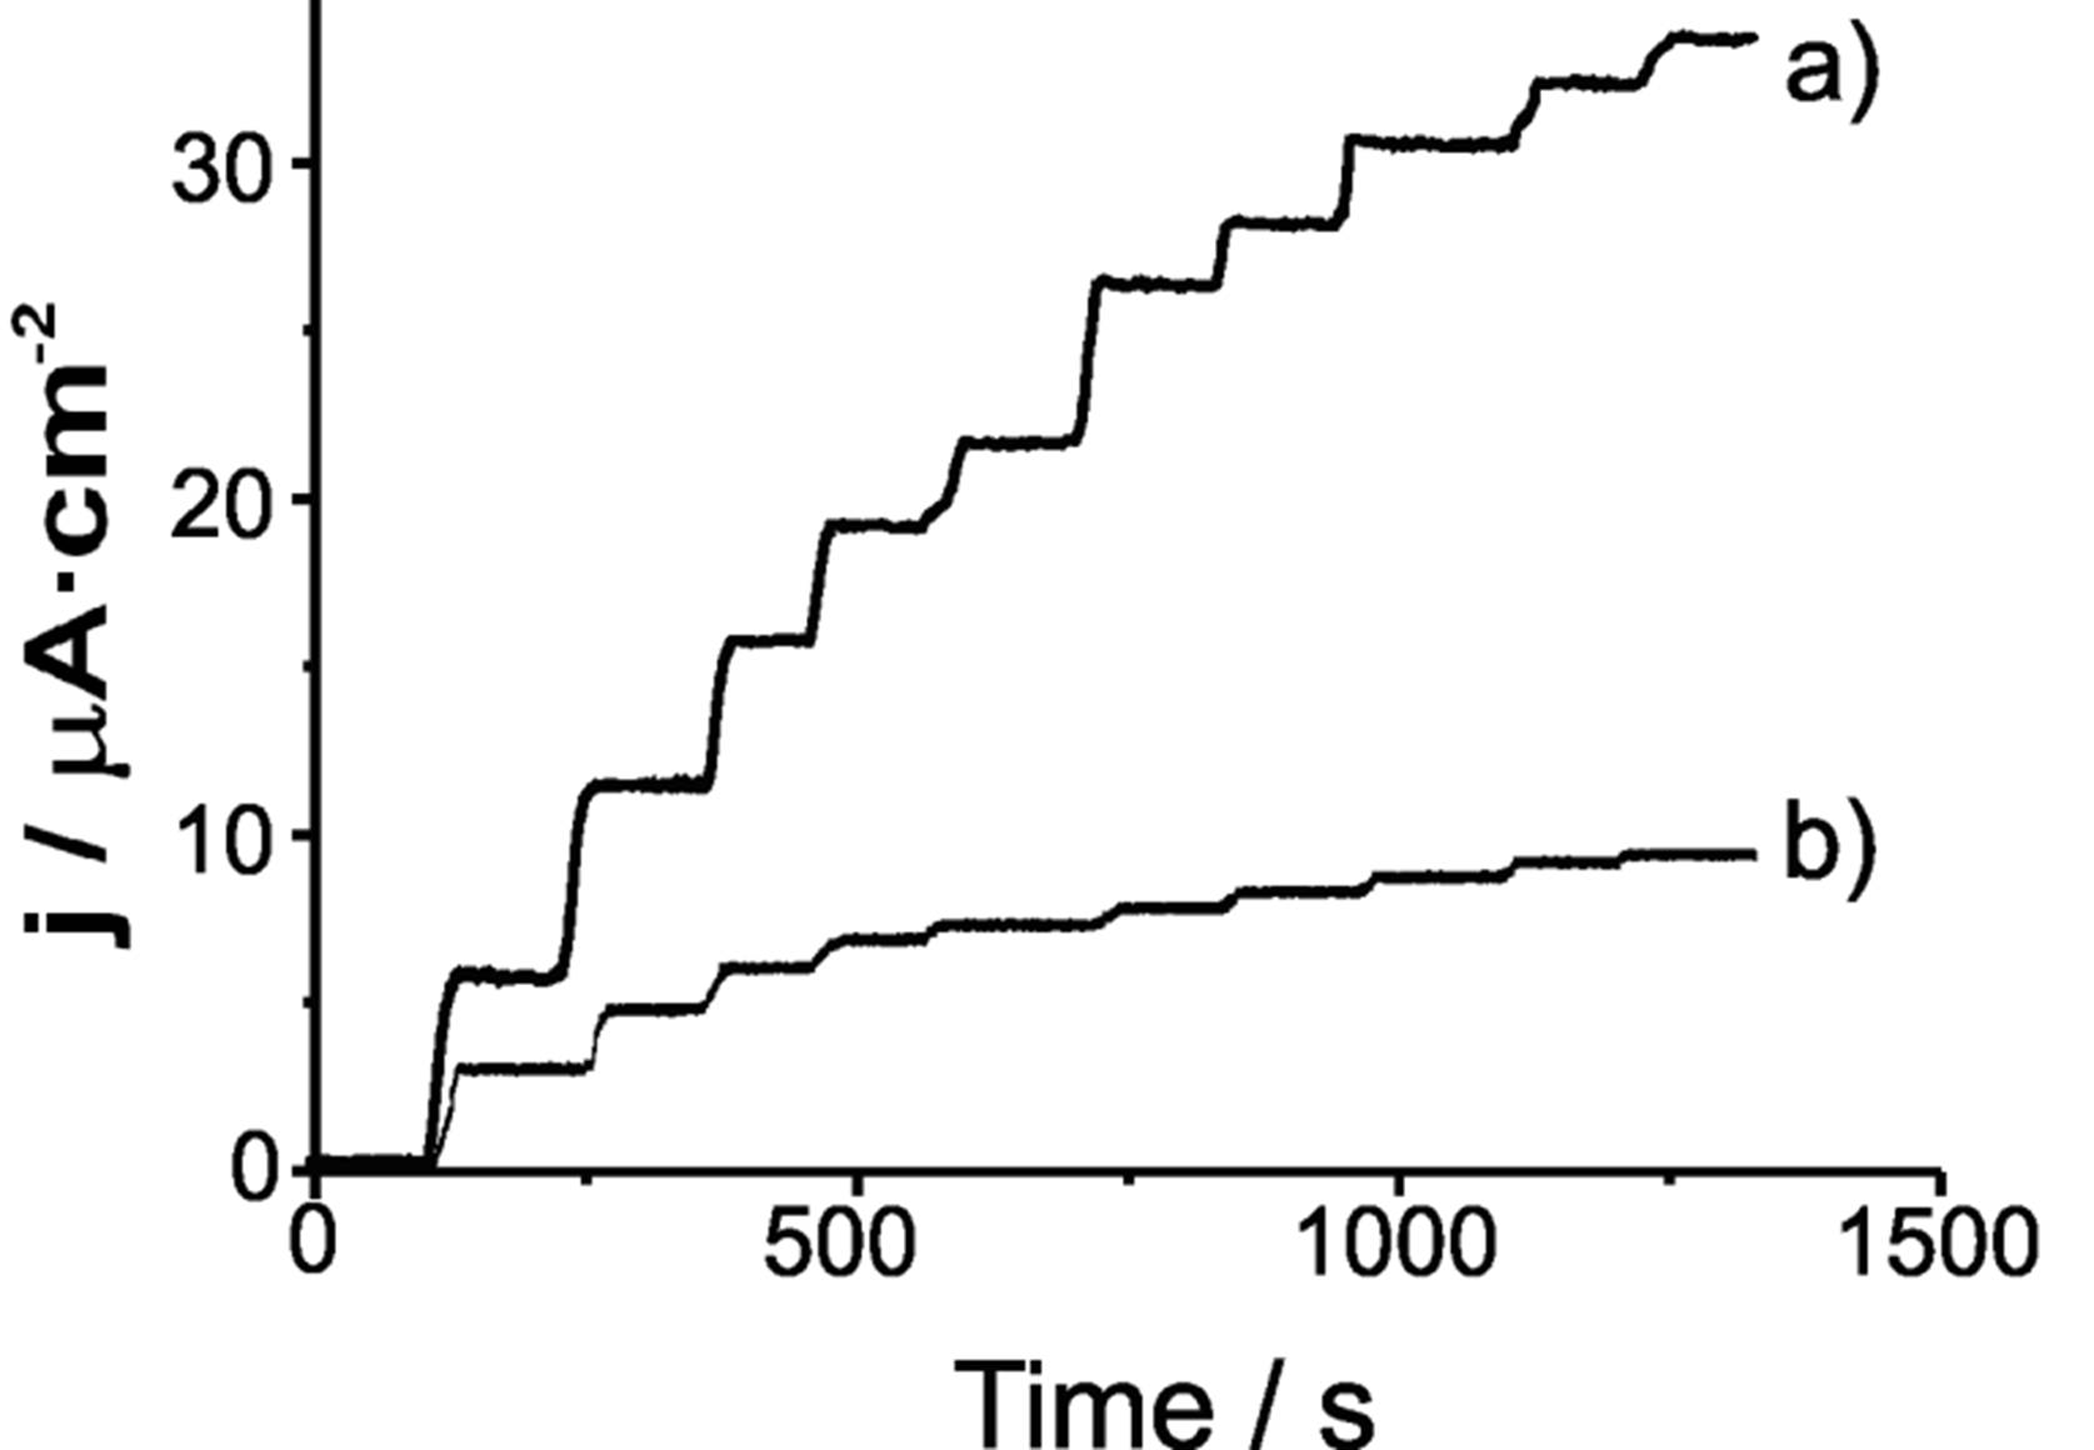
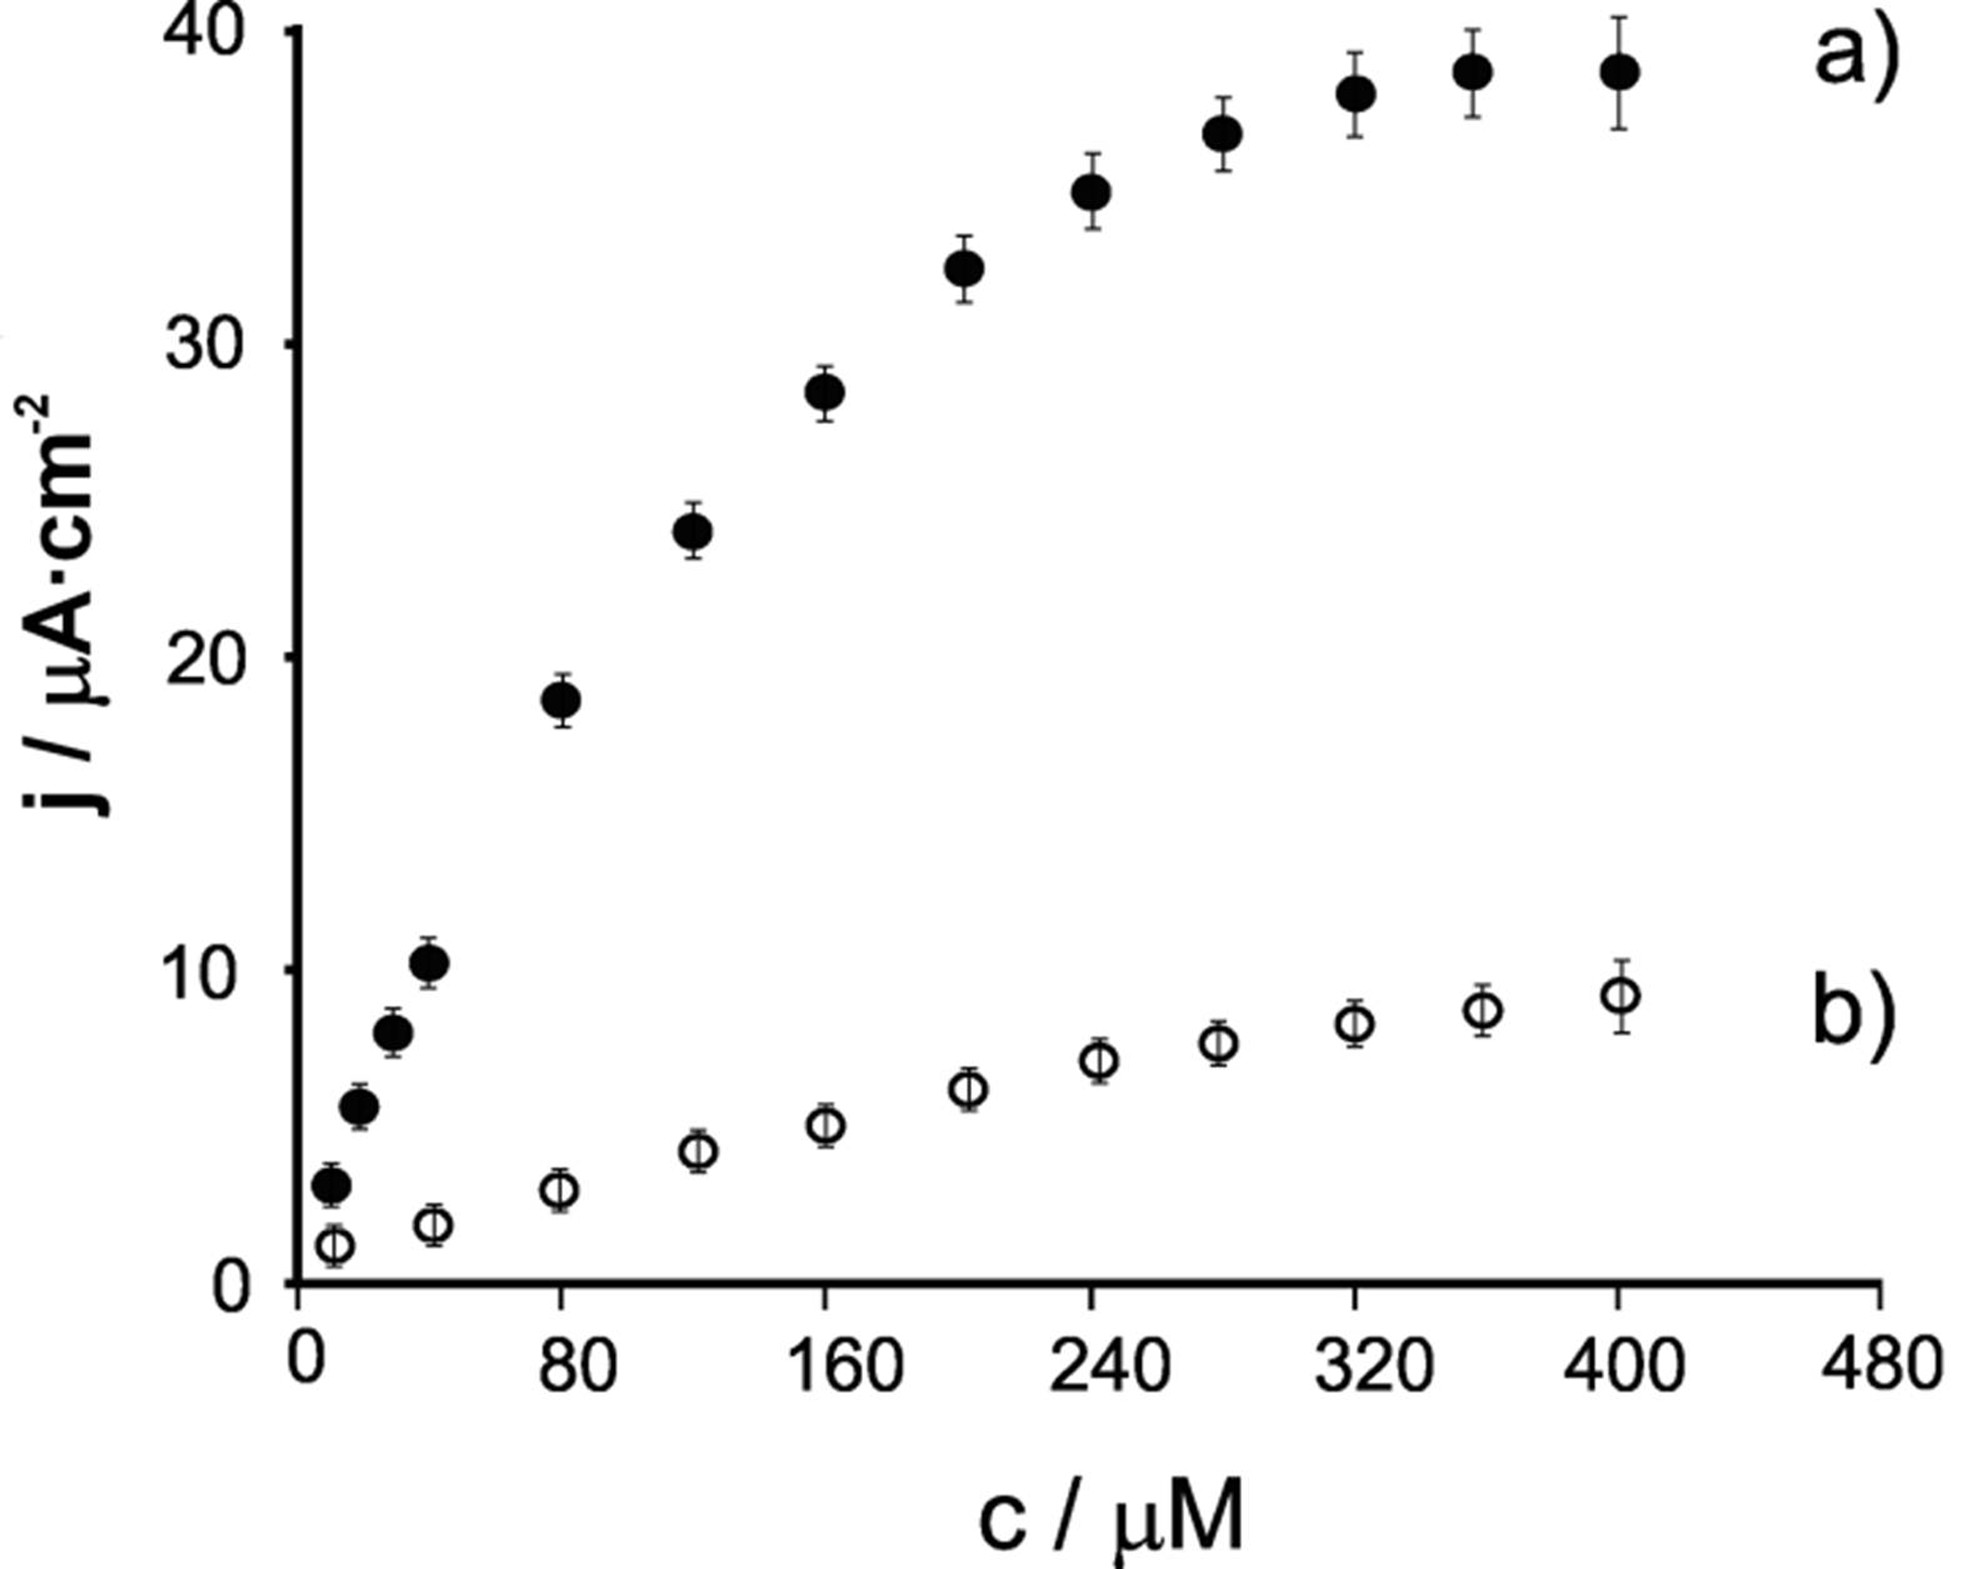
2.3. Effect of the Concentration. Detection Limit

The response to increasing amounts of the phenolic compounds was studied using cyclic voltammetry and amperometry. The effect of the concentration in the Voltammetric responses is illustrated in Figure 3 for an LB sensor immersed in catechin (from 10 μM to 40 mM) at a scan rate of 0.05 V × s−1. As observed in the figure, the intensity of both the enzymatic and the electrochemical peaks increased with the concentration of the phenolic compound (not all CVs were shown).
Figure 3. Cyclic voltammograms of a Ty/LuPc2-LB electrode immersed in catechin solutions (from 10μM to 40mM). Scan rate 0.05 V × s−1.
Catalysts 02 00517 g003
Figure 4 shows the amperometric signals for the Ty/LuPc2-CPE biosensor at −0.07 V (Figure 4a) and for the Ty/LuPc2-LB biosensor at +0.01 V (Figure 4b) upon the addition of successive aliquots of phenol to the 0.01 M PBS (pH 7.0), under constant stirring. Well-definite reduction currents proportional to the concentration of phenol were observed, which result from the electrochemical reduction of o-quinone enzymatically formed at the biosensor surface.
Figure 4. Amperometric response of (a) Ty/LuPc2-LB and (b) Ty/LuPc2-CPE electrodes to phenol in 0.01 M PBS solution (pH = 7) with concentration increments of 20μM.
Catalysts 02 00517 g004
The Ty/LuPc2-LB biosensor reached 95% of steady-state current in less than 4 s. The response rate was much slower in the case of the Ty/LuPc2-CPE biosensor that reached the steady state in 10 s. The faster response observed in the nanostructured films could be attributed to the favorable enzymatic environment provided by the fatty acid layer.
Figure 5 shows the correlation between the response current of the biosensors and the concentration of phenol in PBS (pH 7.0) at +0.01 V for Ty/LuPc2-LB biosensor and −0.07 V for Ty/LuPc2-CPE biosensor.
Figure 5. Calibration curve between the reduction current and the concentration of phenol in 0.01 M PBS solution (pH 7.0) of a) Ty/LuPc2-LB biosensor and b) Ty/LuPc2-CPE biosensor.
Catalysts 02 00517 g005
The response current of the LB nanostructured biosensor is linear with the phenol concentration in the range from 10 to 120 μM, indicating that the catalytic reaction of Ty is a first-order reaction. Concentrations higher than 120 μM cause a lost of the linearity: the current increases slowly, and the enzyme reaction shows a change from first to zero-order. The corresponding detection limits were calculated according to the 3sb/m criterion, where m is the slope of the calibration graph, and sb is estimated as the standard deviation (n = 7) of the amperometric signals obtained for the lowest concentration of the calibration plot. The detection limit calculated for the LB biosensor was 5.4 μM. Using the same method, the detection limit calculated for the CPE biosensor was 8.57 μM.
Similar results were obtained for catechol and catechin. In all cases the detection limit was lower for the nanostructured biomimetic LB sensor and the lowest detection limit was obtained for catechol.
From the calibration data, the Hill coefficient (h) was calculated by representing the log[I/(ImaxI)] vs. log [S] (the logarithm of substrate concentration). A Hill coefficient of 1.09 ± 0.03 (R2 = 0.952) was obtained for the reduction process of o-quinone formed from the enzymatic reaction on the electrode surface for Ty/LuPc2-LB biosensor. In the case of Ty/LuPc2-CPE biosensor a Hill coefficient of 0.94 ± 0.03 was calculated.
Both types of sensors showed an h parameter close to unity demonstrating that the kinetics of the enzymatic reaction fitted into a Michaelis–Menten type. The value slightly higher than 1 obtained for the LB biosensor (h = 1.09 ± 0.03) indicates a positive cooperative effect between the occupied active sites. A negative cooperative effect between the occupied active sites takes place in the case of Ty/LuPc2-CPE biosensor (h = 0.94 ± 0.03).
The apparent Michaelis–Menten constant ( Catalysts 02 00517 i001) was calculated for the immobilized Ty by using the linearization of Lineweaver-Burk expressed by Equation 3.
1/I = 1/Imax + Catalysts 02 00517 i001/(Imax × [S])
where I is the cathodic current, Imax is the steady-state current, Catalysts 02 00517 i001 is the apparent Michaelis-Menten constant and [S] is the concentration of substrate.
The maximum current response and apparent Michaelis–Menten constant were calculated from the intercept and slope respectively [42]. The values obtained for both biosensors immersed in phenolic compounds solutions are presented in Table 3.
Table 3. Characteristic parameters of the biosensors exposed to phenolic compounds.
Phenolic compound Ty/LuPc2-LB
h LD/μMImax/μAKM/μM
Catechol 1.03 ± 0.031.8045.6524.56
Catechin 1.04 ± 0.035.2438.5370.34
Phenol 1.09 ± 0.035.4039.1181.52
Ty/LuPc2-CPE
h LD/μMImax/μAKM/μM
Catechol 0.96 ± 0.038.1911.6192.42
Catechin 0.91 ± 0.038.248.54200.65
Phenol 0.94 ± 0.038.579.31241.93
The small value of Michaelis–Menten constant found in the biomimetic LB sensor indicates that the affinity between the tyrosinase and the substrate is stronger in LB than in CPE sensors. In turn, the superior Imax found in LB sensors is a reflection of the higher sensitivity of the nanostructured biosensor.
The results confirm that the affinity of the tyrosinase towards the catechol (a diphenol) is better than towards other types of phenols such as catechin or towards a monophenol (the phenol) that showed the highest Catalysts 02 00517 i001 and lowest Imax.

2.4. Sensor Stability and Storage Conditions

The stability of the biosensors was studied at room temperature as well as in cooled conditions (at 4 °C). The stability of the enzyme inside of the solid matrices (LB and CPE) was monitored during one month by measuring the changes in the intensity of the cathodic peak when the electrodes were immersed in 50 μM catechol. In both types of electrodes, a very slow decrease in the response current was observed. When stored at 4 °C, biosensors based on LB films maintained the 85% of their initial enzymatic activity for 1 month, whereas in CPE an 80% of their activity was maintained after one month. This result could be explained by taking into account the improved compatibility of the enzyme with the lipidic biomimetic environment provided by the LB film. These long-term stabilities of LB and CPE biosensors are better than those reported in literature (<15 days) [43].
Lifetime data indicate that both the LB and CPE biosensors can be cycled up to 50 times. The decrease in signal intensity expressed as percentage of decay was lower than 4% over 50 continuous scan cycles in the case of LB biosensor and 6% in the case of CPE biosensor.
The reproducibility of the biosensor signals was investigated at a catechol concentration of 2.0 × 10⁻⁴ M. In the case of LB biosensor, the observed mean steady-state current was 32.52 μA with a relative standard deviation (S.D.) of 2.6% for seven determinations. In the case of the CPE biosensor, the mean steady-state current was 5.44 μA with a relative standard deviation (S.D.) of 4.3% for seven determinations.

3. Experimental Section

3.1. Reagents and Solutions

All reagents were of high purity and used without further purification (Sigma–Aldrich). All solutions were prepared with deionised water (18.3 MΩ × cm resistivity, Milli-Q, Millipore). Mushroom tyrosinase (from mushroom EC 232-653-4), with a noted activity of 5370 U/mg of solid (product T3824-250KU), was purchased from Sigma Chemical Co. (USA). A 67 μg × μL−1 solution of tyrosinase in buffer phosphate 0.01 M (pH = 7) was used for the enzyme immobilization. The buffer phosphate solution (PBS) 0.01 M (pH 7) was prepared from potassium monobasic and dibasic phosphate salts. The lutetium (III) bisphthalocyaninate (LuPc2) was synthesized and purified in their neutral radical state following earlier published method [44].

3.2. Carbon Paste (CPE) based Biosensor

Carbon paste electrodes containing tyrosinase and LuPc2 (Ty/LuPc2-CPE) were prepared as previously reported by mixing graphite powder (Ultracarbon®, Ultra F purity), lutetium bisphthalocyanine (15%, w/w) and Nujol (Fluka) as the binder of the composite mixture [45]. Pastes were packed into the body of a 1mL PVC (polyvinyl chloride) syringe and compressed. A metallic copper wire was used as an electrical contact. The enzyme, tyrosinase (Ty), was immobilized on the carbon paste surface by a dip coating technique.. For this purpose, 10 μL of 0.01 M phosphate buffer (pH 7.0) containing 67 μg × μL−1 of the enzyme, was dip coated onto the surface of the carbon paste electrode.

3.3. Langmuir-Blodgett (LB) based Biosensor

LB thin films were prepared in a KSV 5000 System 3 Langmuir–Blodgett trough equipped with a Wilhelmy plate to evaluate the surface pressure. LB films containing tyrosinase, LuPc2 and arachidic acid (Ty/LuPc2-LB) were prepared by spreading a chloroform solution (10−5 M) of arachidic acid and LuPc2 onto a water subphase (NaCl 0.1M, phosphate buffer 0.01 M of pH 7 in ultrapure water–Millipore MilliQ; 20 °C). After the evaporation of the solvent, 20 μL of a 67 μg × μL−1 solution of tyrosinase in 0.01 M phosphate buffer (pH 7) was injected drop by drop underneath the air/water interface. The floating film was compressed using a symmetrical two barrier compression system. At a surface pressure of 30 mN × m−1, 30 monolayers were deposited onto an ITO (indium tin oxide) glass. The substrate speed used was 2 mm × min−1. LB thin films were prepared by Y-type deposition with a transfer ratio close to 1. The biosensor was rinsed using phosphate buffer solution and stored at 4 °C.

3.4. Electrochemical Measurements

Electrochemical experiments were performed using a three electrode system. The potentiostat used was an EG & G PARC, Model 2273 potentiostat/galvanostat (Princeton Applied Research Corp.). All measurements were carried out in 0.01 M phosphate buffer adjusted to pH 7.0. Temperature control at 25 °C was achieved using a circulating bath (Neslab).

4. Conclusions

It has been established that the performance of tyrosinase biosensors can be improved by immobilizing the enzyme in a biomimetic environment using the Langmuir-Blodgett technique. The biomimetic environment provided by a bilayer of arachidic acid helps to preserve the enzymatic functionality, while increasing the number of active sites with respect to tyrosinase-based carbon paste biosensors. These advantages lead to significant improvement of the affinity, response sensitivity, detection limit and stability of Ty/LuPc2-LB to catechol, catechin and phenol in pH 7.0 phosphate buffer solutions.

Acknowledgment

The authors are grateful to the Spanish Ministry of Science-CICYT (Grant AGL2009-12660/ALI) for the financial support.

Conflict of Interest

The authors declare no conflict of interest.

References

  1. Haarstad, K.; Bavor, H.; Maehlum, T. Organic and metallic pollutants in water treatment and natural wetlands: a review. Water Sci. Technol. 2012, 65, 76–99. [Google Scholar]
  2. Hill, M.K. Understanding Environmental Pollution; Cambridge University Press: Cambridge, UK, 2004. [Google Scholar]
  3. Kalpna, R.; Mital, K.; Sumitra, C. Vegetable and fruit peels as a novel source of antioxidants. J. Med. Plants Res. 2011, 5, 63–71. [Google Scholar]
  4. Apetrei, I.M.; Rodríguez-Méndez, M.L.; Apetrei, C.; Nevares, I.; del Alamo, M.; de Saja, J.A. Monitoring of evolution during red wine aging in oak barrels and alternative method by means of an electronic panel test. Food Res. Int. 2012, 45, 244–249. [Google Scholar] [CrossRef]
  5. Baruah, J.B. Chemistry of Phenolic Compounds: State of the Art; Nova Publishers: New York, NY, USA, 2011. [Google Scholar]
  6. Smirnoff, N. Antioxidants and Reactive Oxygen Species in Plants; Blackwell Publishing Ltd.: Oxford, UK, 2007. [Google Scholar]
  7. Shahidi, F. Natural Antioxidants: Chemistry,Health Effects,and Applications; The American Oil Chemists Society: Urbana, IL, USA, 1997. [Google Scholar]
  8. Di Majo, D.; la Guardia, M.; Giammanco, S.; la Neve, L.; Giammanco, M. The antioxidant capacity of red wine in relationship with its polyphenolic constituents. Food Chem. 2008, 111, 45–49. [Google Scholar] [CrossRef]
  9. Anesini, C.; Ferraro, G.E.; Filip, R. Total polyphenol content and antioxidant capacity of commercially available tea (Camellia sinensis) in Argentina. J. Agric. Food Chem. 2008, 56, 9225–9229. [Google Scholar] [CrossRef]
  10. Ballesteros, O.; Zafra, A.; Navalon, A.; Vilchez, J.L. Sensitive gas chromatographic-mass spectrometric method for the determination of phthalate esters, alkylphenols, bisphenol A and their chlorinated derivatives in wastewater sample. J. Chromatogr. A 2006, 1121, 154–162. [Google Scholar] [CrossRef]
  11. Naczk, M.; Shahidi, F. Extraction and analysis of phenolics in food. J. Chromatogr. A 2004, 1054, 95–111. [Google Scholar]
  12. Kronholm, J.; Revilla-Ruiz, P.; Porras, S.P.; Hartonen, K.; Carabias-Martinez, R.; Riekkola, M.L. Comparison of gas chromatography-mass spectrometry and capillary electrophoresis in analysis of phenolic compounds extracted from solid matrices with pressurized hot water. J. Chromatogr. A 2004, 1022, 9–16. [Google Scholar] [CrossRef]
  13. Rama, M.J.R.; Medina, A.R.; Diaz, A.M. A simple and straightforward procedure for monitoring phenol compounds in waters by using UV solid phase transduction integrated in a continuous flow system. Microchim. Acta 2003, 141, 143–148. [Google Scholar] [CrossRef]
  14. Rodríguez-Méndez, M.L.; Apetrei, C.; de Saja, J.A. Evaluation of the polyphenolic content of extra virgin olive oils using an array of voltammetric sensors. Electrochim. Acta 2008, 53, 5867–5872. [Google Scholar] [CrossRef]
  15. Markhotkina, O.; Kilmartin, P.A. The use of cyclic voltammetry for wine analysis: Determination of polyphenols and free surfur dioxide. Anal. Chim. Acta 2010, 668, 155–165. [Google Scholar] [CrossRef]
  16. Kilmartin, P.A.; Zou, H.; Waterhouse, A.L. A cyclic voltammetry method suitable for characterizing antioxidant properties of wine and wine phenolics. J. Agric. Food Chem. 2001, 49, 1957–1965. [Google Scholar] [CrossRef]
  17. Ferreira, M.; Varela, H.; Torresi, R.M.; Tremiliosi-Filho, G. Electrode passivation caused by polymerization of different phenolic compounds. Electrochim. Acta 2006, 52, 434–442. [Google Scholar] [CrossRef]
  18. Ziyatdinova, G.; Gainetdinova, A.; Morozov, M.; Budnikov, H.; Grazhulene, S.; Red'kin, A. A Voltammetric detection of synthetic water-soluble phenolic antioxidants using carbon nanotube based electrodes. J. Solid State Electrochem. 2012, 16, 127–134. [Google Scholar] [CrossRef]
  19. Liu, X.Q.; Feng, H.Q.; Liu, X.H.; Wong, D.K.Y. Electrocatalytic detection of phenolic estrogenic compounds at NiTPPS vertical bar carbon nanotube composite electrodes. Anal. Chim. Acta 2011, 689, 212–218. [Google Scholar] [CrossRef]
  20. Zagal, J.H.; Griveau, S.; Silva, J.F.; Nyokong, T.; Bedioui, F. Metallophthalocyanine-based molecular materials as catalysts for electrochemical reactions. Coord. Chem. Rev 2010, 254, 2755–2791. [Google Scholar]
  21. Matemadombo, F.; Apetrei, C.; Nyokong, T.; Rodríguez-Méndez, M.L.; de Saja, J.A. Comparison of carbon screen printed and disk electrodes in the detection of antioxidants using CoPc derivatives. Sens. Actuators B 2012, 166-167, 457–466. [Google Scholar] [CrossRef]
  22. Rodríguez-Méndez, M.L.; Gay, M.; Apetrei, C.; de Saja, J.A. Biogenic amines and fish freshness assessment using a multisensor system based on voltammetric electrodes. Comparison between CPE and screen-printed electrodes. Electrochim. Acta 2009, 54, 7033–7041. [Google Scholar] [CrossRef]
  23. Diaz-Diaz, G.; Blanco-Lopez, M.C.; Lobo-Castanon, M.J.; Miranda-Ordieres, A.J.; Tunon-Blanco, P. Chloroperoxidase modified electrode for amperometric determination of 2,4,6-trichlorophenol. Electroanalysis 2009, 21, 1348–1353. [Google Scholar] [CrossRef]
  24. Franzoi, A.C.; Dupont, J.; Spinelli, A.; Vieira, I.C. Biosensor based on laccase and an ionic liquid for determination of rosmarinic acid in plant extracts. Talanta 2009, 77, 1322–1327. [Google Scholar] [CrossRef]
  25. Portaccio, M.; di Martino, S.; Maiuri, P.; Durante, D.; de Luca, P.; Lepore, M.; Bencivenga, U.; Rossi, S.; de Maio, A.; Mita, D.G. Biosensors for phenolic compounds: The catechol as a substrate model. J. Mol. Catal. B 2006, 41, 97–102. [Google Scholar] [CrossRef]
  26. Song, S.; Wang, L.; Li, J.; Zhao, J.; Fan, C. Aptamer-based biosensors. Trends Anal. Chem. 2008, 27, 108–117. [Google Scholar] [CrossRef]
  27. Huang, T.H.; Kuwana, T.; Warsinke, A. Analysis of thiols with tyrosinase-modified carbon paste electrodes based on blocking of substrate recycling. Biosens. Bioelectron. 2002, 17, 1107–1113. [Google Scholar] [CrossRef]
  28. Apetrei, C.; Rodriguez-Mendez, M.L.; de Saja, J.A. Amperometric tyrosinase based biosensor using an electropolymerized phosphate-doped polypyrrole film as an immobilization support. Application for detection of phenolic compounds. Electrochim. Acta 2011, 56, 8919–8925. [Google Scholar] [CrossRef]
  29. Kaneto, K. A new tyrosinase biosensor based on covalent immobilization of enzyme on N-(3-aminopropyl) pyrrole polymer film. Curr. Appl. Phys. 2005, 5, 178–183. [Google Scholar] [CrossRef]
  30. Liu, Z.; Deng, J.; Li, D. A new tyrosinase biosensor based on tailoring the porosity of Al(2)O(3) sol-gel to co-immobilize tyrosinase and the mediator. Anal. Chim. Acta 2000, 407, 87–96. [Google Scholar] [CrossRef]
  31. Apetrei, C.; Alessio, P.; Constantino, C.J.L.; de Saja, J.A.; Rodriguez-Mendez, M.L.; Pavinatto, F.J.; Fernandes, E.G.; Zucolotto, V.; Oliveira, O.N. Biomimetic biosensor based on lipidic layers containing tyrosinase and lutetium bisphthalocyanine for the detection of antioxidants. Biosens. Bioelectron. 2011, 26, 2513–2519. [Google Scholar] [Green Version]
  32. Pavinatto, F.J.; Fernandes, E.G.R.; Alessio, P.; Constantino, C.J.L.; de Saja, J.A.; Zucolotto, V.; Apetrei, C.; Oliveira, O.N., Jr.; Rodriguez-Mendez, M.L. Optimized architecture for Tyrosinase-containing Langmuir-Blodgett films to detect pyrogallol. J. Mater. Chem. 2011, 21, 4995–5003. [Google Scholar]
  33. Cabaj, J.; Sołoducho, J.; Nowakowska-Oleksy, A. Langmuir-Blodgett film based biosensor for estimation of phenol derivatives. Sens. Actuators B 2010, 143, 508–515. [Google Scholar] [CrossRef]
  34. Iost, R.M.; Madurro, J.M.; Brito-Madurro, A.G.; Nantes, I.L.; Caseli, L.; Crespilho, F.N. Strategies of Nano-Manipulation for Application in Electrochemical Biosensors. Int. J. Electrochem. Sci. 2011, 6, 2965–2997. [Google Scholar]
  35. Campuzano, S.; Serra, B.; Pedrero, M.; Villena, J.M.; Pingarron, J.M. Amperometric flow-injection determination of phenolic compounds at self-assembled monolayer-based tyrosinase biosensors. Anal. Chim. Acta 2003, 494, 187–197. [Google Scholar] [CrossRef]
  36. Schmidt, T.F.; Caseli, L.; Viitala, T.; Oliveira, O.N., Jr. Enhanced activity of horseradish peroxidase in Langmuir-Blodgett films of phospholipids. Biochim. Biophys. Acta 2008, 1778, 2291–2297. [Google Scholar] [CrossRef]
  37. Apetrei, C.; Casilli, S.; de Luca, M.; Valli, L.; Jiang, J.; Rodríguez-Méndez, M.L.; de Saja, J.A. Spectroelectrochemical characterisation of Langmuir-Schaefer films of heteroleptic phthalocyanine complexes. Potential applications. Colloids Surf. A 2006, 284-285, 574–582. [Google Scholar]
  38. de Saja, J.A.; Rodríguez-Méndez, M.L. Sensors based on double-decker rare earth phthalocyanines. Adv. Colloid Interf. Sci. 2005, 116, 1–11. [Google Scholar] [CrossRef]
  39. Bard, A.J.; Faulkner, L.R. Electrochemical Methods; John Wiley and Sons: New York, NY, USA, 2001. [Google Scholar]
  40. Albery, W.; Craston, D. Amperometric Enzyme Electrodes: Theory and Experiment. Biosensors: Fundamentals and Applications. In Turner, A., Karube, I., Wilson, G.; Oxford University Press: Oxford, UK, 1987; pp. 180–210. [Google Scholar]
  41. Tembe, S.; Karve, M.; Inamdar, S.; Haram, S.; Melo, J.; D’Souza, S.F. Development of electrochemical biosensor based on tyrosinase immobilized in composite biopolymeric film. Anal. Biochem. 2006, 349, 72–77. [Google Scholar]
  42. Kiralp, S.; Toppare, L. Polyphenol content in selected Turkish wines, an alternative method of detection of phenolics. Process Biochem. 2006, 41, 236–239. [Google Scholar]
  43. Kim, M.A.; Lee, W.Y. Amperometric phenol biosensor based on sol-gel silicate/nafion composite film. Anal. Chim. Acta 2003, 479, 143–150. [Google Scholar]
  44. Linaje, M.; Quintanilla, M.C.; Gonzalez, A.; del Valle, J.L.; Alcaide, G.; Rodriguez-Mendez, M.L. Improvment of the synthesis of Lutetium Bisphthalocyanine using the Taguchi method. Analyst 2000, 125, 341–346. [Google Scholar] [CrossRef]
  45. Ghasemi-Vamankhasti, M.; Rodríguez-Méndez, M.L.; Mohtasebi, S.S.; Apetrei, C.; Lozano, J.; Razavi, S.H.; Ahmadi, H.; de Saja, J.A. Monitoring the aging of beers using a bioelectronic tongue. Food Control 2012, 25, 216–224. [Google Scholar] [CrossRef]

