Article

Response Surface Methodology and Aspen Plus Integration for the Simulation of the Catalytic Steam Reforming of Ethanol

Energy, Materials and Environment Laboratory, Department of Chemical Engineering, Universidad de La Sabana, Campus Universitario Puente del Común, Km. 7 Autopista Norte, Bogotá 250001, Colombia
*
Author to whom correspondence should be addressed.
Catalysts 2017, 7(1), 15; https://doi.org/10.3390/catal7010015
Submission received: 20 November 2016 / Revised: 27 December 2016 / Accepted: 27 December 2016 / Published: 14 January 2017
(This article belongs to the Special Issue Reforming Catalysts)

Abstract

:
The steam reforming of ethanol (SRE) on a bimetallic RhPt/CeO2 catalyst was evaluated by the integration of Response Surface Methodology (RSM) and Aspen Plus (version 9.0, Aspen Tech, Burlington, MA, USA, 2016). First, the effect of the Rh–Pt weight ratio (1:0, 3:1, 1:1, 1:3, and 0:1) on the performance of SRE on RhPt/CeO2 was assessed between 400 to 700 °C with a stoichiometric steam/ethanol molar ratio of 3. RSM enabled modeling of the system and identification of a maximum of 4.2 mol H2/mol EtOH (700 °C) with the Rh0.4Pt0.4/CeO2 catalyst. The mathematical models were integrated into Aspen Plus through Excel in order to simulate a process involving SRE, H2 purification, and electricity production in a fuel cell (FC). An energy sensitivity analysis of the process was performed in Aspen Plus, and the information obtained was used to generate new response surfaces. The response surfaces demonstrated that an increase in H2 production requires more energy consumption in the steam reforming of ethanol. However, increasing H2 production rebounds in more energy production in the fuel cell, which increases the overall efficiency of the system. The minimum H2 yield needed to make the system energetically sustainable was identified as 1.2 mol H2/mol EtOH. According to the results of the integration of RSM models into Aspen Plus, the system using Rh0.4Pt0.4/CeO2 can produce a maximum net energy of 742 kJ/mol H2, of which 40% could be converted into electricity in the FC (297 kJ/mol H2 produced). The remaining energy can be recovered as heat.

Graphical Abstract

1. Introduction

At the Framework Convention on Climate Change (COP21) of the United Nations (UN) held in Paris in 2015, the urgency of global replacement of fossil fuels by renewable energy sources was raised [1]. This has promoted the development of engineering projects related to sustainable fuels. Particularly, the production of electricity in fuel cells (FC) fed with hydrogen (H2) is an interesting energy model: the process does not generate pollution, and it can be implemented in several mobile and stationary applications [2]. Currently, most H2 is produced from non-renewable resources such as natural gas, but biomass has been proposed as a sustainable source for H2 production. Particularly in Colombia, bioethanol, a fuel obtained from biomass, has emerged as a promising resource for H2 production due to the thermodynamic favorability of its reformation [3] and its increased production in recent years through Colombian government promotion [4]. Currently, bioethanol is blended with gasoline (8–10 vol %) in transport applications. However, the use of ethanol/gasoline mixtures in internal combustion engines leads to low volumetric efficiencies (<48%) and generates pollution [5]. Otherwise, the conversion of ethanol to H2 could give added value to bioethanol production and promote new business in Colombia.
H2 production from ethanol may be carried out by steam reforming of ethanol (SRE). This method has the advantage of producing a greater amount of H2 per mole of ethanol [6], and it is more economical compared to other methods, such as partial oxidation, auto-thermal reforming, or oxidative steam reforming [6,7,8]. SRE is an endothermic process (347 kJ/mol) [9] that involves a network of chemical reactions (Table 1, [10,11,12]). Depending on the reaction conditions, the nature of the support, and the active phase, different routes can take place to produce a complex set of products, including H2, carbon monoxide (CO), methane (CH4), carbon dioxide (CO2), ethane (C2H6), ethylene (C2H4), and acetaldehyde (CH3CHO) [13,14].
Base metals, such as Ni [15], Co [16], and Fe [17], and noble metals, such as Pd [18], Rh [18,19], Pt [7,20], and Ir [21], supported on metals oxides to catalyze SRE have been widely studied. The nature of the catalyst and operational conditions directly affect its performance in SRE [15,22]. Ni is a widely studied catalyst due to its low cost [10]. However, Ni promotes the formation of carbonaceous species, and it has low stability [23]. In contrast, noble metals are promising candidates for SRE because of their higher activity and stability with a low formation of coke [24]. Among the noble metals, Rh catalysts showed better performance in terms of conversion of ethanol and H2 production [25], even at low catalyst loadings (<1 wt %) [26]. However, Rh promotes ethanol dehydrogenation with high CO formation (Equations (3) and (6)) [18]. On the contrary, Pt favors CO adsorption on the catalyst surface and affects reducible species on the support, promoting the formation of new active sites in the water gas shift reaction (WGSR) [27,28]. Yet, Pt has a lower capacity to break C–C bonds compared to Rh [29]. Therefore, the development of bimetallic structures that are simultaneously active in the two reactions is desirable [30,31].
In our previous work, a bimetallic 0.6 wt % Rh–0.2 wt % Pt over CeO2 catalyst appeared to have a high activity in SRE and WGSR with a low susceptibility to coke formation [32]. The main drawback of this catalyst is its high cost. Hence, high stability and activity with low metal loadings are required. Furthermore, the noble metals ratio in the catalyst possibly has an effect on the catalytic performance. Idriss et al. [33] reported that the Pd–Rh ratio affects the selectivity and activity of a RhPd/CeO2 catalyst in SRE and that a minimum load of active metals could be required to improve H2 production. Kaila et al. [34] evaluated a bimetallic RhPt/ZrO2 in the autothermal reforming of simulated gasoline, reporting that CH4 reforming was altered by the Rh–Pt ratio due to the formation of different RhxPt1−x alloys in RhPt/ZrO2. Therefore, the Rh–Pt ratio could have an impact on the catalyst performance of RhPt/CeO2 catalysts for SRE, not only on the H2 yield but also on the energy efficiency of the process.
Analysis of catalytic performance and energy efficiency is a decisive step in the implementation of a large-scale process [35]. Innovative methodologies and commercial software are widely used in process assessment. The Response Surface Methodology (RSM) is a powerful tool to evaluate processes because it allows for the determination of the effect of multiple variables on an interest response [36]. This technique is widely used in industrial assessments and research projects. Nevertheless, in some areas of chemistry and chemical engineering, RSM is poorly used. Recently, the use of RSM in catalysis for the evaluation of catalysts and process optimization was reported [37,38]. RSM allows for direct predictions about the performance of a process in a particular region from experimental data. Moreover, this information can be fed to commercial software for further analysis of the process. Aspen Plus is a widely used software for the simulation of H2 production from steam reforming. For instance, Rossetti et al. [39] quantified electrical power, thermal energy output, and overall efficiency of a plant based on SRE. Genyin et al. [40] created a user-defined model built in FORTRAN (version 9.0, Aspen Tech, Burlington, MA, USA, 2016) to simulate a fluidized bed membrane reactor for H2 production. The main limitation of the simulator is that it requires detailed information on the kinetics of the process in order to adequately predict the experimental data. However, the RSM model can be integrated into Aspen Plus to combine both experimental and simulated data as a powerful tool for process assessment and improvement. Nevertheless, there are few works [41,42] which have integrated Aspen Plus and RSM, specifically in separation processes. Thus, no reports of Aspen Plus and RSM integration for the assessment of catalytic sustainable energy models or H2 economy were found.
This study aimed to simulate SRE on a RhPt/CeO2 catalyst, integrating RSM and Aspen Plus to determinate the effect of the Rh–Pt ratio on its further energy performance in FC. For this purpose, the effect of the Rh–Pt ratio in a bimetallic RhPt/CeO2 catalyst on catalytic activity, H2 yield, product distribution, energy requirements, and energy generation were evaluated by RSM and Aspen Plus. The use of response surfaces allowed the selection of a Rh–Pt ratio more suitable for obtaining active and selective materials for SRE. The mathematical models obtained from the RSM were integrated into Aspen Plus in order to simulate the power generation in FC.

2. Results and Discussion

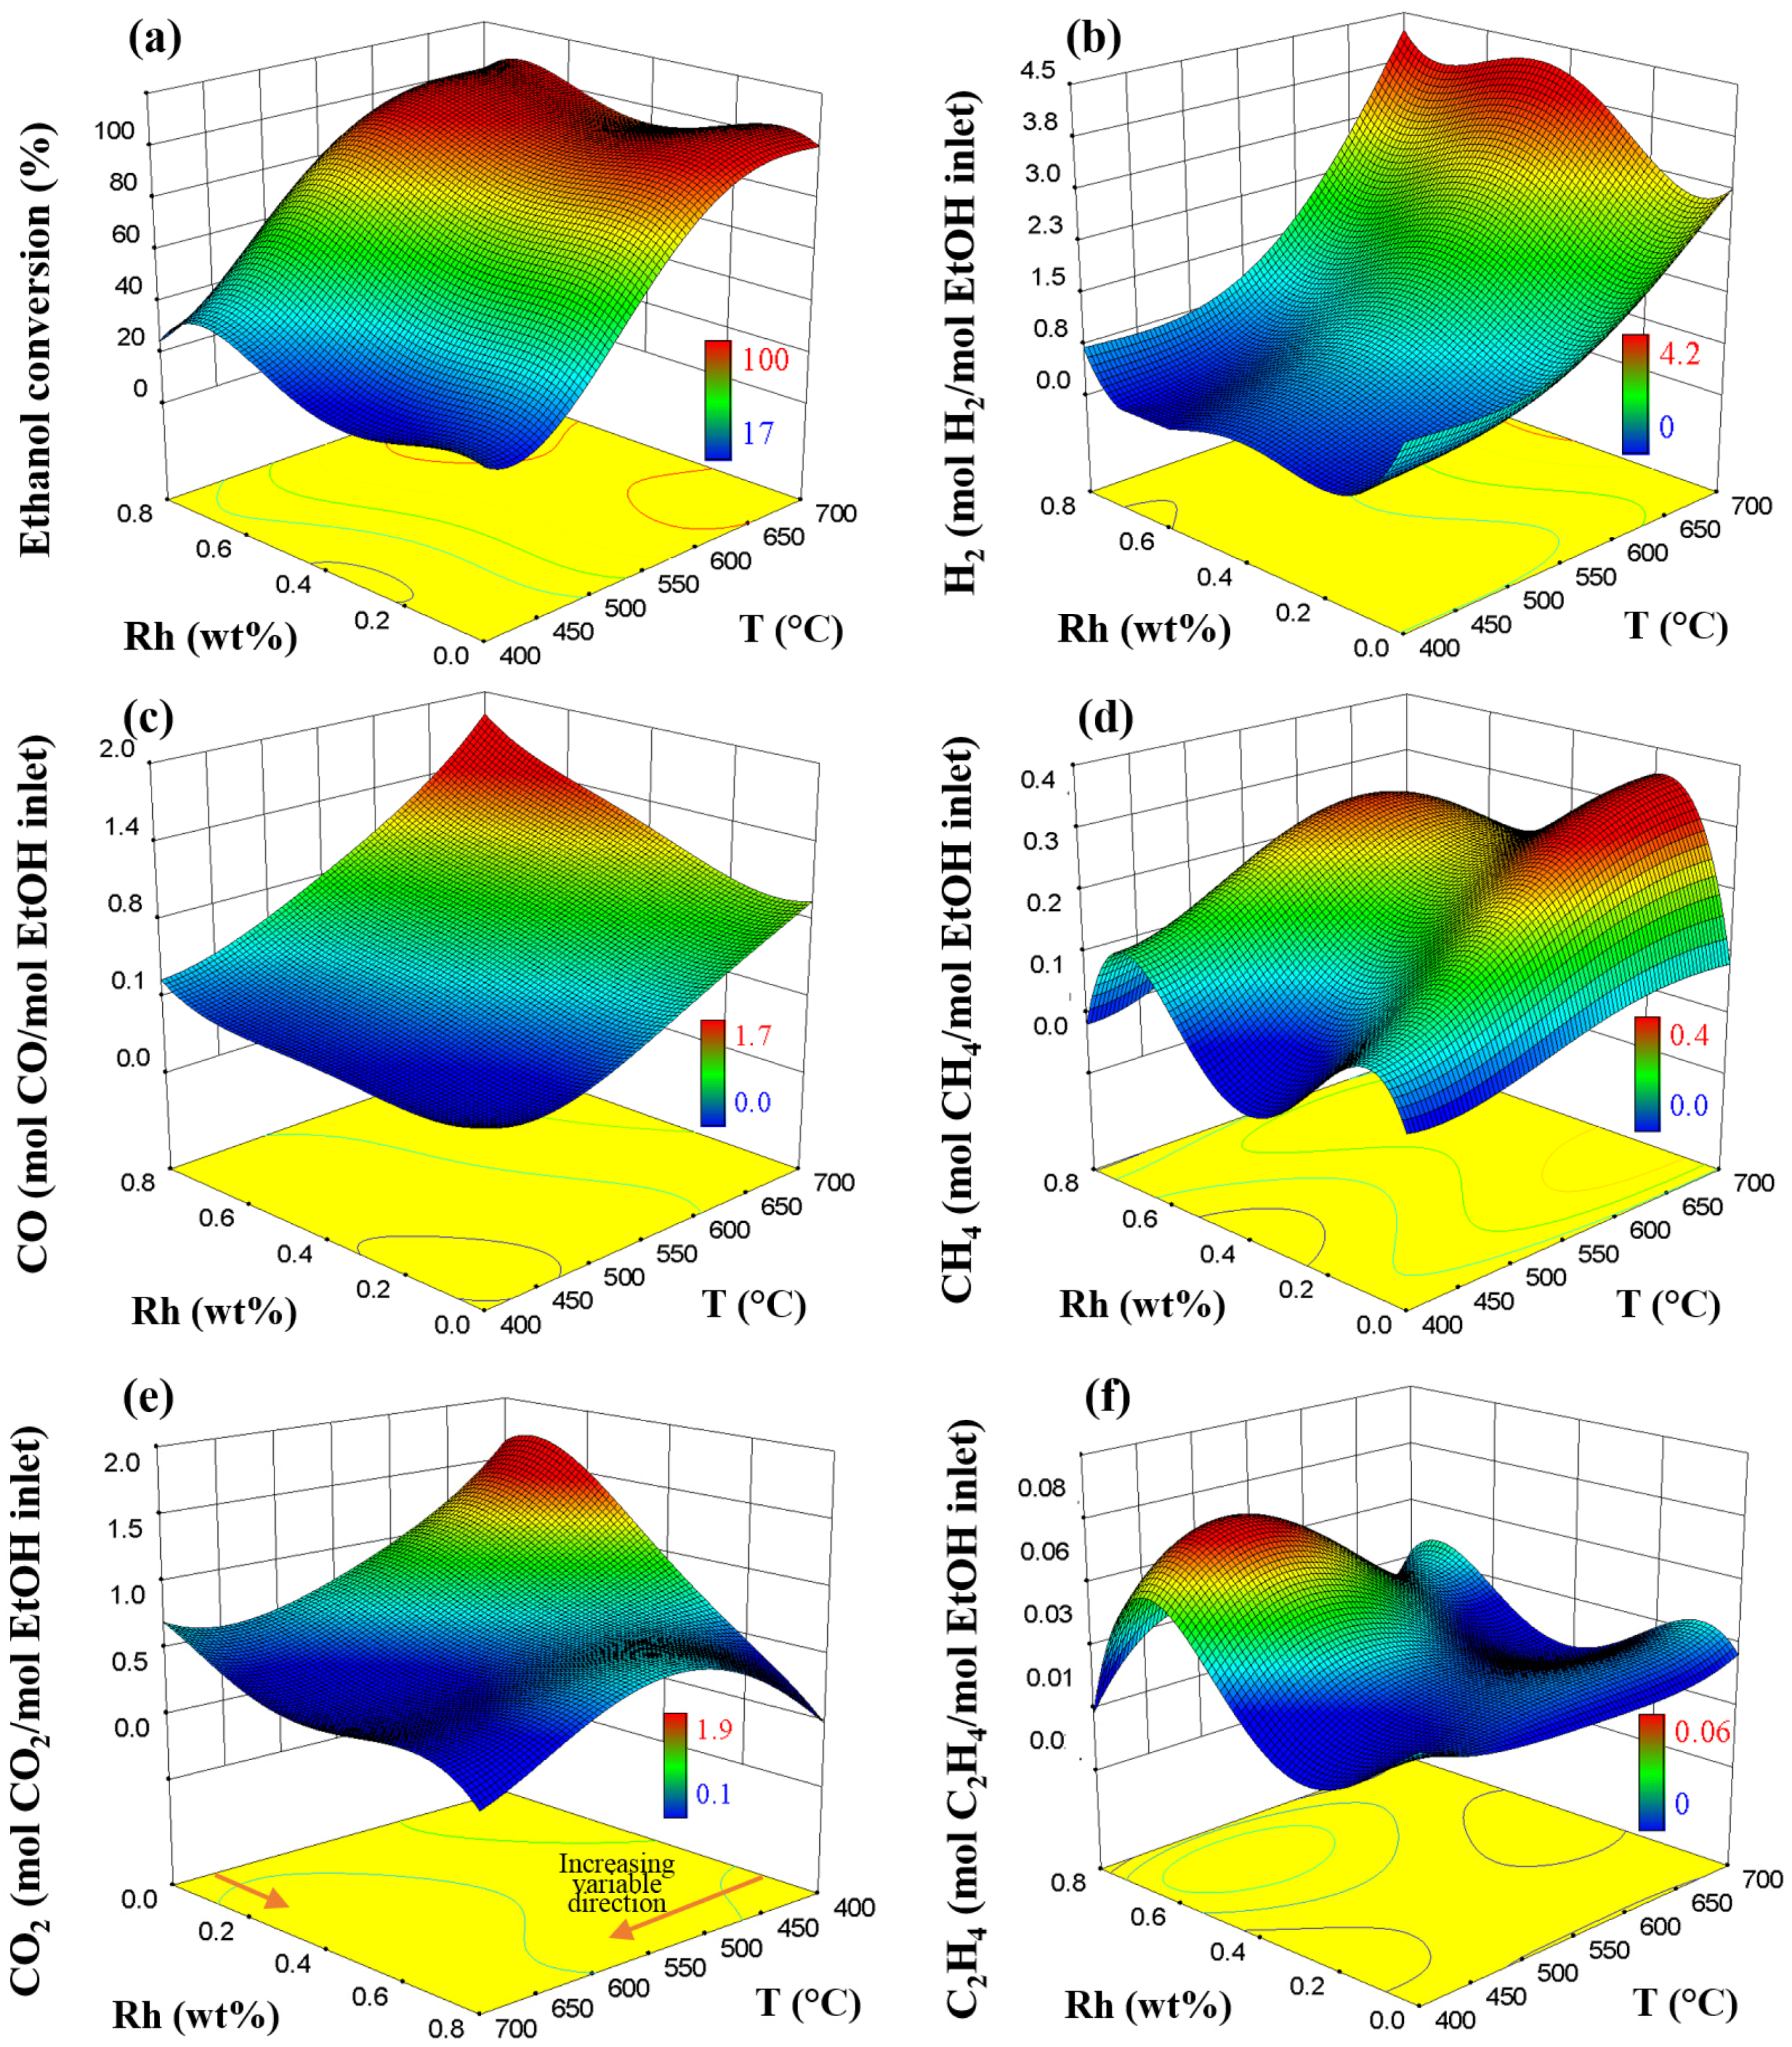
2.1. Effect of the Rh–Pt Ratio on the Catalytic Performance

Table 2 shows the different Rh–Pt ratios evaluated for the RhPt/CeO2 catalyst used in SRE. The experimental data shown as Appendix (Table A1) was used to obtain response surfaces of these catalytic materials from 400 to 700 °C. Response surfaces were plotted in Figure 1. The Rh axis shows the wt % Rh, but the total nominal metal loading (Rh + Pt) was always 0.8 wt % in all catalysts.
SRE is favored by temperature (Figure 1a) due to its endothermic character. This effect is exponential, and complete ethanol conversion is ensured above 600 °C under the current conditions. Some values of the RSM appeared slightly higher than 100% ethanol conversion due to a slight deviation from the actual data by the adjustment of the mathematical model (R2 < 1). The Rh0.7Pt0.1/CeO2 catalyst showed more activity, reaching total ethanol conversion above 560 °C (Figure 1a). Rh has been identified as the most active catalyst for ethanol conversion in SRE due to the lower intrinsic activation barrier of Rh catalysts, which favors the C–C bond dissociation [43]. A significant effect of the Rh–Pt ratio on H2 yield was identified (Figure 1b). A decrease in H2 yield was observed when low Rh loadings were present (0–0.2 wt %). From this point, a maximum of 4.2 mol H2/mol EtOH (700 °C) was obtained with the Rh0.4Pt0.4/CeO2 catalyst, which is 8% and 25% more compared to monometallic Rh/CeO2 and Pt/CeO2, respectively. The presence of Rh in the bimetallic catalyst has been linked to a better ability to break C–C bonds and reform CH4 [18,23] (Equations (3) and (8)), favoring H2 production. Below 520 °C, Pt0.8/CeO2 showed a higher H2 yield. Pt favors CO adsorption on the catalyst surface and affects the reducible species on the support [13], promoting H2 production by WGSR [28,44] (Equation (2)), which is favored at low temperature because it is an exothermic reaction [45]. Rh would also slightly favor WGSR [46]. Hence, H2 production at low temperatures is mainly by WGSR, which seems to be favored on the monometallic samples.
Figure 1c–f show the byproducts’ yield during SRE. The higher the temperature and the Rh loading, the higher the CO production (Figure 1c). WGSR (Equation (2))—responsible for the CO control during the process—is favored at low temperatures (<500 °C) [45]. This reaction may occur through two mechanisms [47]: (i) a reaction between CO and OH species on the catalyst surface, with formate as the intermediate, to produce CO2 (Equations (11) and (12)); and (ii) a direct oxidation with O2 by the Eley–Rideal (E–R) mechanism with surface oxygen as the intermediate (Equation (13)). In both cases, the previous dissociation of water is required (Equation (14)).
OH + CO OCOH
2 OCOH 2 CO 2 + H 2
O + + CO CO 2
H 2 O O + + OH
The oxygen storage capacity (OSC) of the support increases the favorability of the E–R mechanism [48]. Scarabello et al. [46] reported that the O-vacancy in Rh/Ce-ZrO2 promotes the oxidation of CO to CO2 by the reaction in Equation (15) and the dissociation of water, increasing H2 production (Equation (16)). Thus, the high OSC of CeO2 would help to promote the WGSR in RhPt/CeO2 through E–R mechanisms. This model also explains the regeneration of O species in CeO2 by the presence of water in SRE.
2 CeO 2 + CO CO 2 + Ce 2 O 3
Ce 2 O 3 + H 2 O 2 CeO 2 + H 2
The active metal (M) can promote different reaction mechanisms in CO formation [49]. Liu et al. [50] studied CO oxidation over a Pt/CeO2 catalyst. These authors proposed that the formation of a Pt–Ce–O solid solution accelerates the mobility of lattice oxygen and improves the oxidation of CO. Diagne et al. [51] reported that the formation of CO in SRE on Rh/CeO2 followed the sequence: dehydrogenation of ethanol (Equation (3)) → acetaldehyde decomposition (Equation (6)) → CH4 reforming (Equation (8)). In addition, the presence of Rh2O3 and RhO2 species on the catalytic surface was reported. Likewise, Sheng et al. [19] informed that the presence of Rh in RhPt/CeO2 can promote the formation of an oxametallacycle (M2-OCH2CH2), which decomposes to CO and CH4 at high temperatures. Cavallaro [52] reported that Rh-catalysts promoted steam reforming of CH4 (Equation (8)) and ethylene (Equation (10)) at high temperatures. Then, the increase in the content of Rh in RhPt/CeO2 catalysts favors the simultaneous production of CO and H2. The close relationship between the Rh–Pt ratio, H2 yield, and CO production would affect the energy requirements of the electricity production by FC due to the fact that the FC cannot be fed by H2 streams with CO concentrations larger than 10 ppm [53].
On the other hand, CH4 is an undesirable byproduct because it decreases the H2 yield. CH4 production increased between 400 and 600 °C (Figure 1d). The decomposition of ethanol (Equation (5)) and slow CH4 reforming (Equation (8)) could be taking place [26,54]. Above 600 °C, complete conversion of ethanol was ensured (Figure 1a), and a decrease in CH4 production was observed in most of the catalysts (Figure 1d), except for Rh0.2Pt0.6/CeO2. This is consistent with previous reports [46,55]. Also, previous investigations of the reaction mechanism of SRE over M/CeO2 suggested that ethoxy-species and acetaldehyde are involved as intermediates in CH4 formation [56,57]. Subsequently, the conversion of CH4 to C1 species is expected at high temperatures [58]. Also, Rh- and Pt-supported catalysts are known for their ability to reform CH4; this effect is improved by the presence of Cen+ species on the support due to a synergetic contribution among M–Ce to cleave C–C bonds [46,59].
However, the bimetallic catalysts were less effective for reforming CH4 compared to their monometallic counterparts (Figure 1d). Specifically, a greater amount of CH4 formation was observed on Rh0.2Pt0.6/CeO2 at high temperatures. In our previous work, Rh–Pt–Rh2O3 particles were reported as possible active sites in SRE, which favor the catalyst’s high stability [26,32]. However, shortcomings of this catalyst to reform CH4 at high temperatures were detected. Similarly, Kaila et al. [34] evaluated RhPt/ZrO2 catalysts with different Rh–Pt ratios in autothermal reforming of simulated gasoline (steam/carbon = 3, 0.5 wt % total metal loading, 400–900 °C), reporting that the Rh–Pt ratio affected the product distribution due to RhxPt1−x alloy formation. At 700 °C, Rh0.1Pt0.4/ZrO2 presented the lowest concentration of CH4 (0.2 mol %) compared to the other catalysts. In this work, Rh0.4Pt0.4/CeO2 showed the least amount of CH4 among the bimetallic catalysts (Figure 1d), which could explain the higher H2 yield for this catalyst (Figure 1b). As discussed in our previous work [32,37], evidence of Rh–Pt alloy formation was found on the RhPt/CeO2 catalysts. Thus, Rh–Pt alloy formation on RhPt/CeO2 catalysts promotes different product distributions depending on the Rh–Pt ratio.
CO2 is an indicator of the WGSR presence (Equation (2)) in SRE [44,51]. The increased formation of CO2 (Figure 1e) was detected at low temperatures (<560 °C) on the catalysts with higher Pt content (0.2–0.4 wt % Rh), in which conditions the WGSR was favored. This also explains the low CO formation in this zone (Figure 1c), as previously discussed. Diagne et al. [48] proposed that CH4 reforming is followed by WGSR over Rh/CeO2 and Rh/CeO2–ZrO2, avoiding accumulation of CH4 and CO in SRE. Therefore, the equilibrium reaction of CH4 reforming (Equation (8)) would be favored by the presence of steam and the reduction in CO concentration through WGSR (Equation (2)) [60,61]. This could be consistent with the results obtained in this study, in which the formation of CH4 and CO was lower at low temperatures. However, as the temperature rose and the WGSR was disfavored, the concentrations of CO and CH4 increased.
Although ethylene is a known intermediate in SRE, low production of ethylene (Figure 1f) was observed as compared to CH4, which is a more stable intermediate [10]. Zanchet et al. [62] reported that ethylene formation decreases on CeO2 above 250 °C because of the energy barrier limit of ethanol dehydration (Equation (4)) and affects the stability of ethoxy intermediates, favoring dehydrogenation and decomposition reactions. This agrees with the results obtained in this work, in which ethylene production was very limited, decreasing with temperature. The effect of this ethylene production on the formation of carbonaceous species over the catalysts was measured by thermogravimetric analysis (TGA) (Table 2). The bimetallic catalysts (RhxPt0.8−x/CeO2) showed less formation of carbonaceous compounds compared to the monometallic samples (Rh/CeO2 and Pt/CeO2). The Pt content in the bimetallic catalysts increased the rate of weight loss. However, monometallic catalysts (Rh/CeO2 and Pt/CeO2) showed lower production of ethylene compared to bimetallic catalysts. It is accepted that Rh favors C–C dissociation [43] and that bimetallic Rh–noble metal on basic supports contributes to the mitigation of carbon deposition [18,32]. In addition, the presence of higher amounts of CO2 on the bimetallic catalysts could be an indication of ethylene reforming (Equation (10)) [52]. Therefore, low ethylene formation in monometallic catalysts could be due to ethylene polymerization. Ethane and acetaldehyde were not detected for any catalyst, possibly due to the fact that noble metals accelerate the thermal cracking of such light hydrocarbons [23].

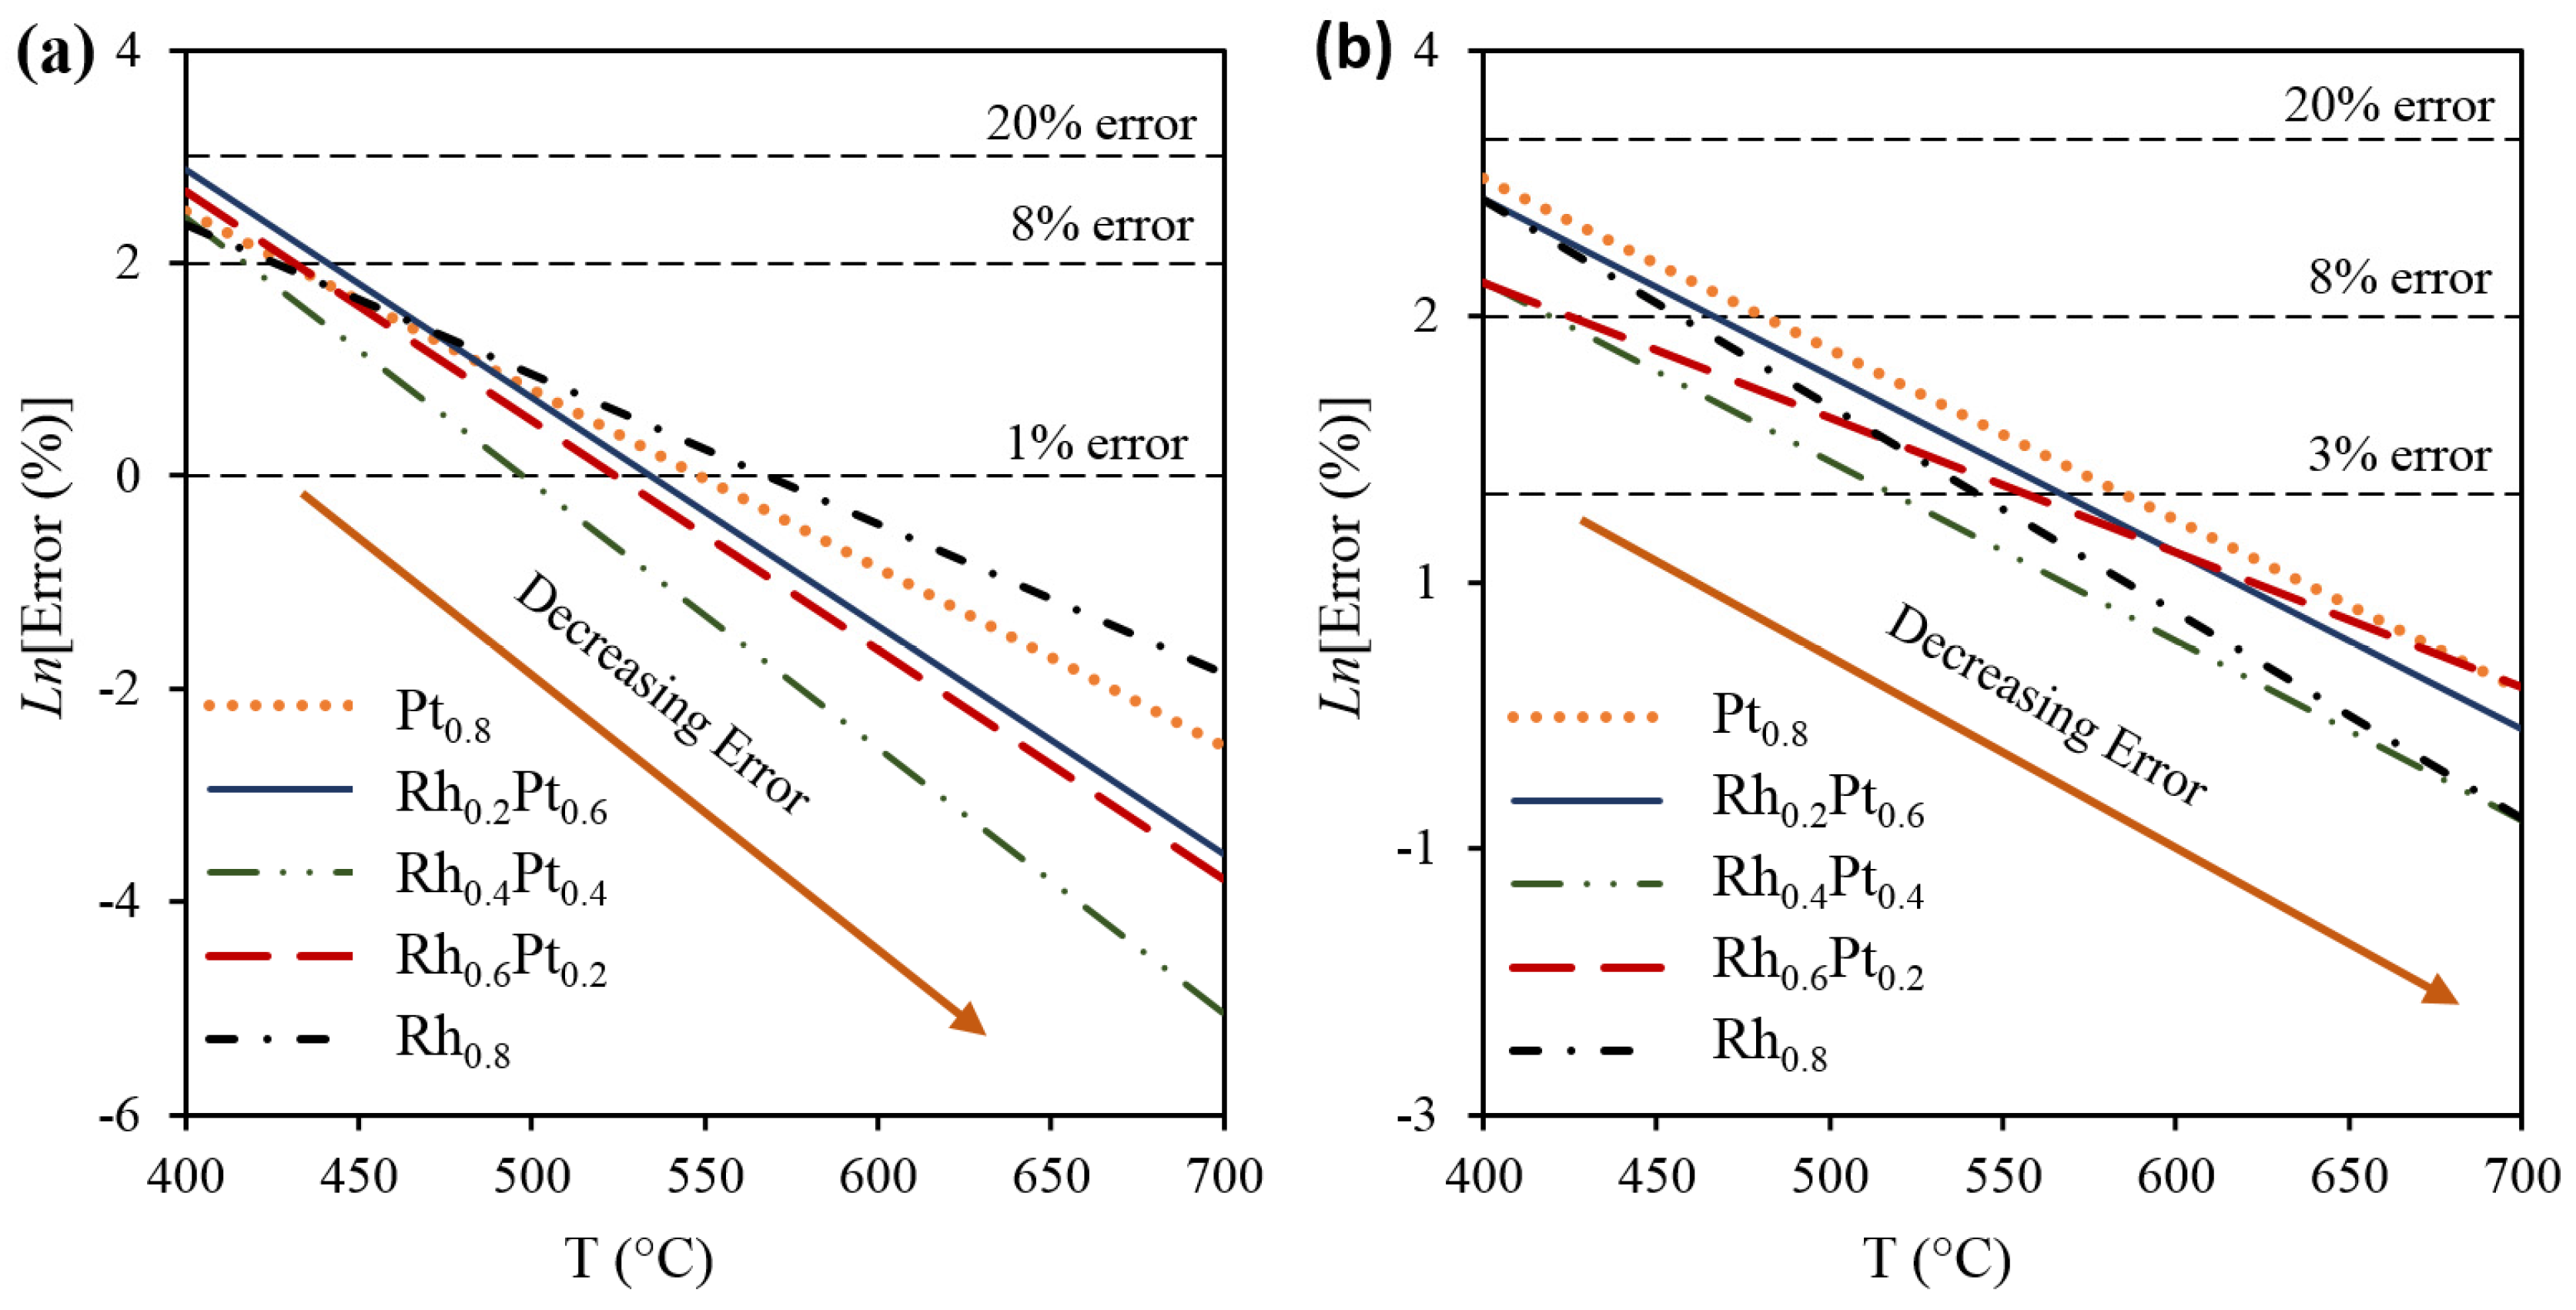
2.2. Models of the SRE from the RSM

The regression analysis and the Analysis of Variance (ANOVA) for the response surfaces are shown in Table 3. The R2 > 0.9, the “Probability F” << 0.5 (significant), and the Lack of Fit >> 3 (nonsignificant) indicate that these models fit well to experimental data [63] and that they can be used to make predictions about the responses. The “Coded Factors” are useful for identifying the relative impact of the factors through comparison of the factor coefficients. Nonsignificant terms in the “Coded Factors” (“Probability F” > 0.1) indicate that this effect has no relevance to the response, and they were not included. Meanwhile, the “Actual Factors” of Table 3 can be used to make predictions about the response for given levels of each factor, replacing them in the quartic model shown in Equation (17). The mathematic model from the “Actual Factors” can be used for simulations in commercial software in order to obtain preliminary energy information about the process. Statistical parameters such as the “Probability F” << 0.5, Lack of Fit >> 3, and “Adequate Precision” > 4 show that the models fit well [63]. Nevertheless, some values deviate slightly from the actual data, such as ethanol conversion above 100%, due to the statistical error and the adjustment of the mathematical model (R2 < 1). All the experimental values employed to obtain the response surfaces were included as Appendix (Table A1).
R e s p o n s e = F 0 + F i × T + F i × C + F i × T × C + F i × T 2 + F i × C 2 + F i × T 2 × C + F i × T × C 2 + F i × T 3 + F i × C 3 + F i × T 2 × C 2 + F i × T 3 × C + F i × T × C 3 + F i × T 4 + F i × C 4
where T = Temperature, C = Rh content, and Fi are “Actual Factors” listed in Table 3.
The RSM analysis may give an indication of the relative effect of each variable on the response (activity or selectivity) [36]. According to the ANOVA (Table 3), RhPt/CeO2 catalysts have a statistically significant effect on ethanol conversion. In addition, combined and individual contributions of both variables, temperature (T) and Rh content (C), were detected during SRE (Table 3). C, T2, C2, T2C, T3, C3, T2C2, T3C, T4, and C4 were significant terms in the ethanol conversion and H2 yield models. Moreover, “Coded Factors” (Table 3) indicated the relative impact of the factors by comparing the factor coefficients [36]. Accordingly, C, C2, C3, and C4 have higher relative impacts among these factors. Thus, although temperature influences SRE, Rh content (and thus Rh–Pt ratio) has a main role in ethanol conversion and the H2 yield.
On the other hand, the ANOVA (Table 3) indicates that those terms related to the Rh content in the catalyst (C, C2, C3, and C4) and some of its interactions with temperature (TC, T2C, T2C2, and TC3) are significant for yield models. The significant effect of the catalyst in SRE is due to the nature of the active site, which promotes different reaction mechanisms, as explained in Section 2.1. Thus, the possible formation of Rh–Pt alloys could explain the change in product distribution during SRE. Combining the mathematical models, Rh0.4Pt0.4/CeO2 was selected as the best catalyst for SRE because of its combination of the highest H2 yield, low ethylene formation, and smaller amount of CH4 compared to the other bimetallic catalysts. However, it is important to determine the Rh–Pt effect on the overall energy integration of the system in order to select the best active metals ratio based on actual engineering application parameters. Therefore, the RSM models were integrated with Aspen Plus for the energy analysis of the Reformer–FC system.

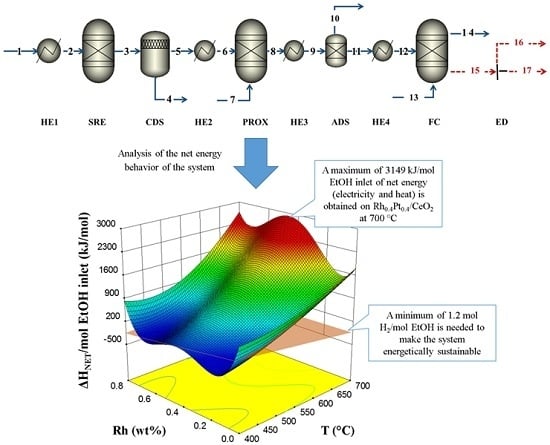
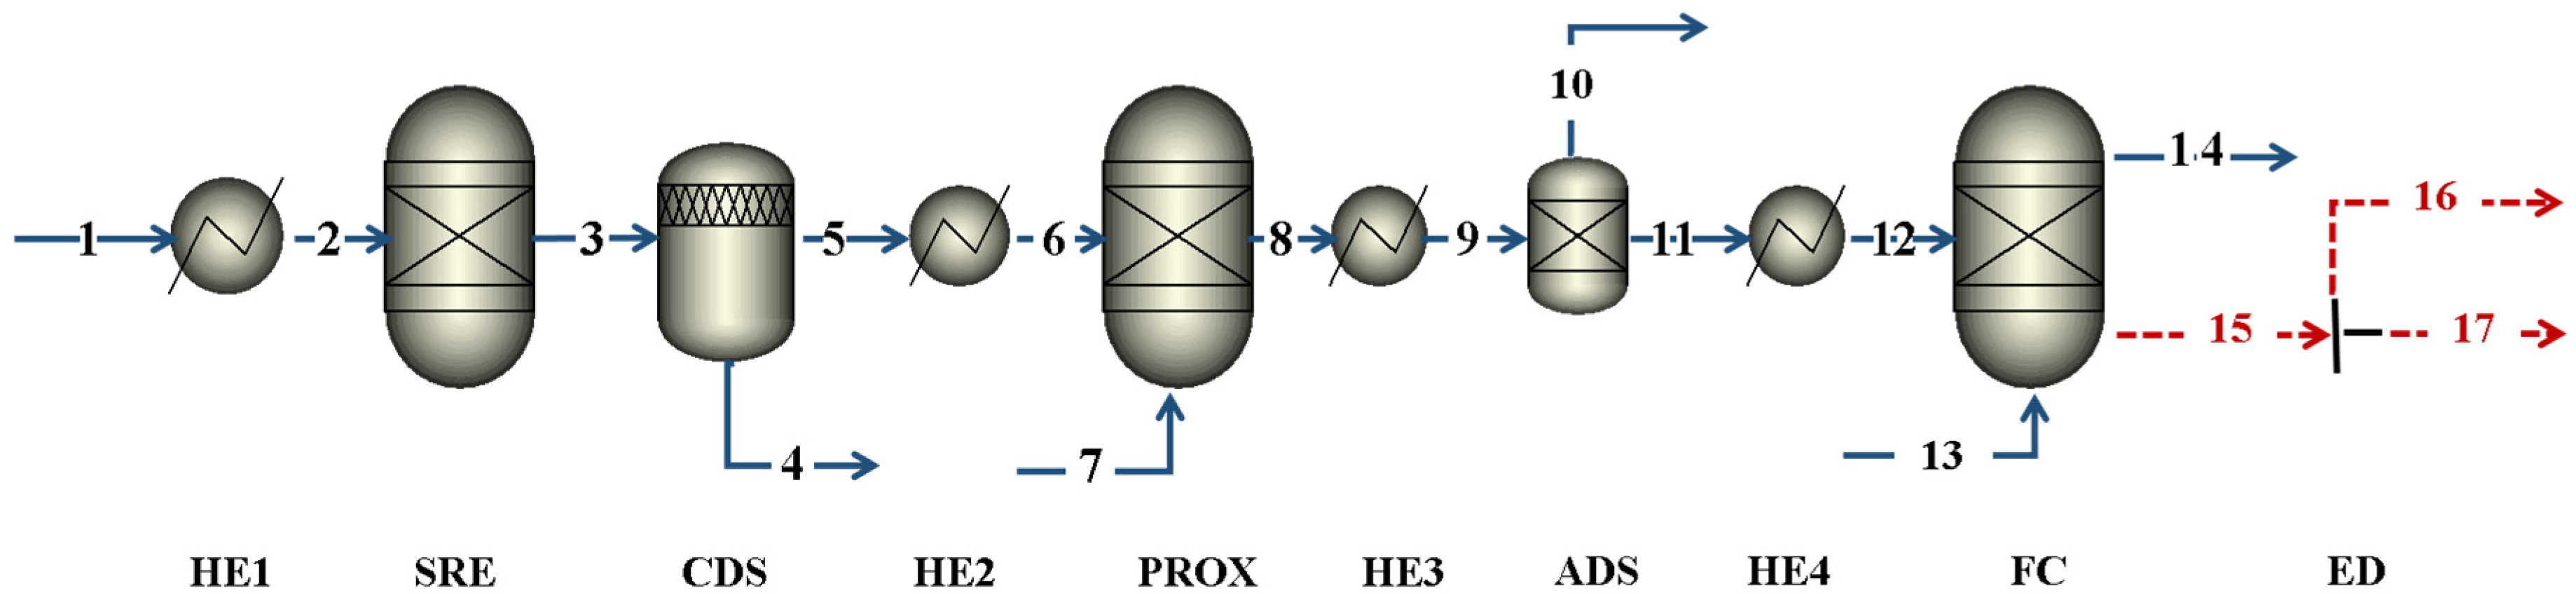
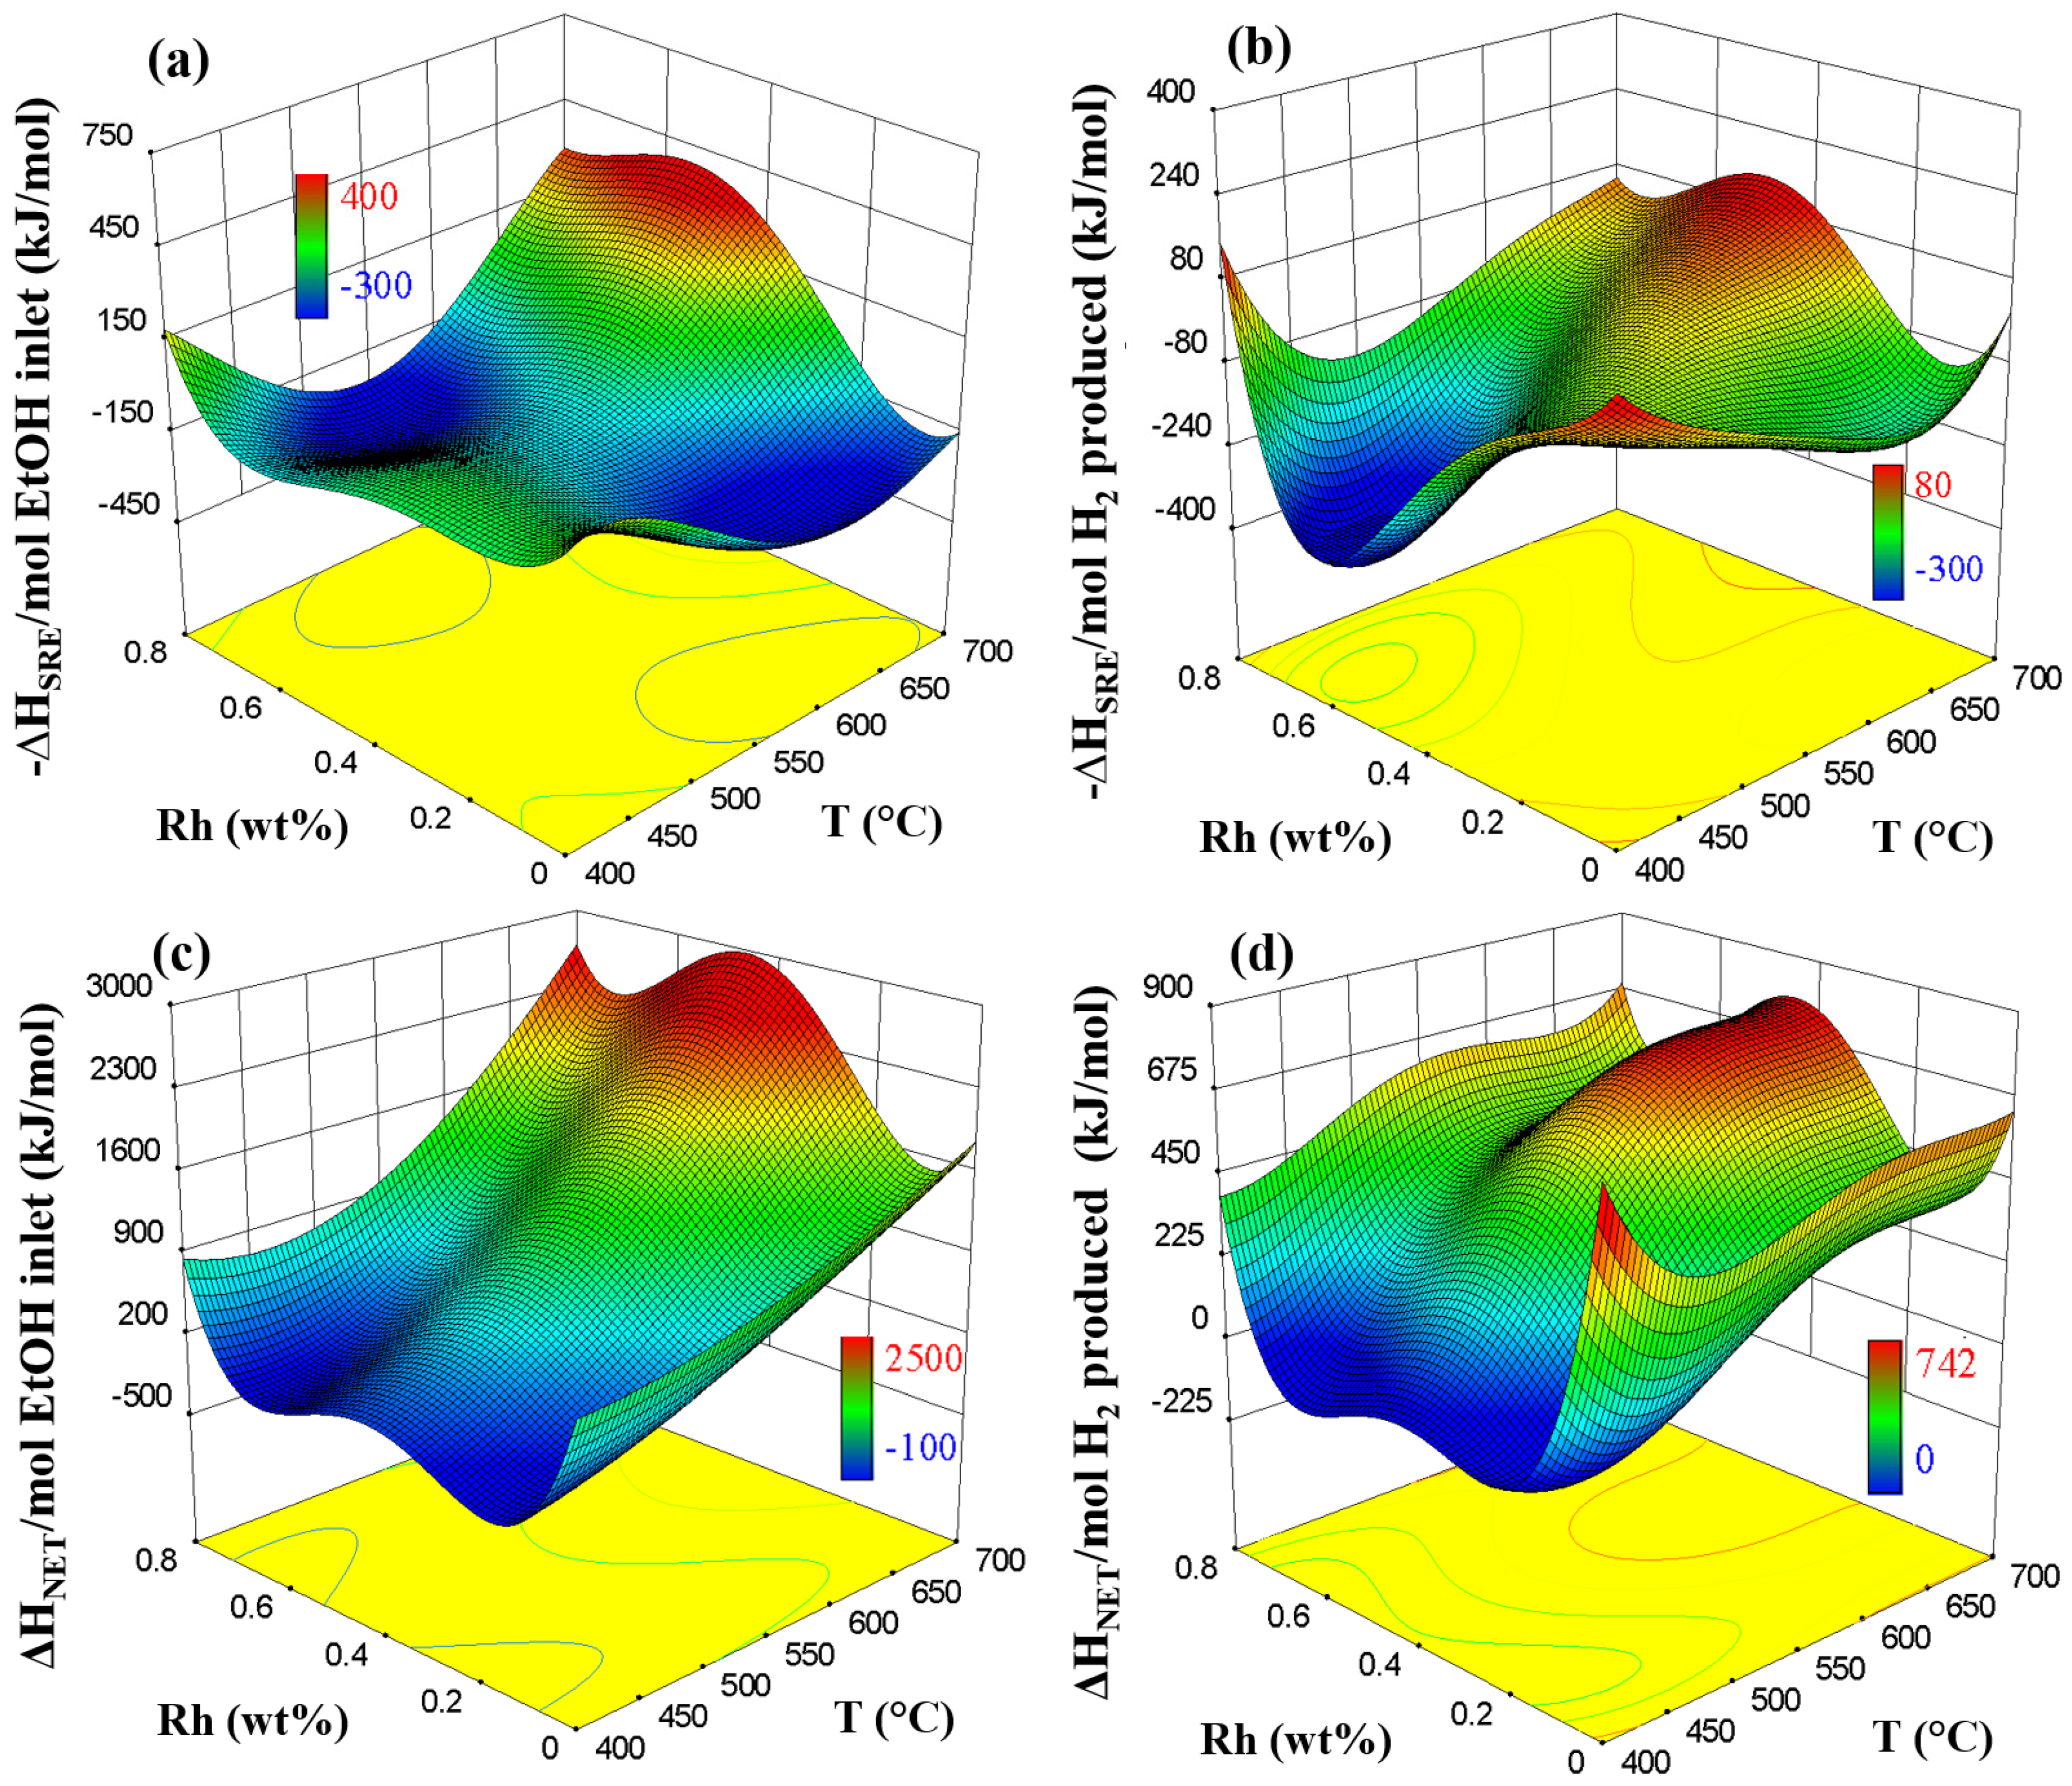
2.3. Energy Analysis from RSM and Aspen Plus Integration

Power generation in FC fed with H2 obtained from SRE is recognized as a promising energy model with high commercial value [64]. However, information about the energy efficiency of the process is still limited. Thus, RSM models were integrated with Aspen Plus to assess the energy production in an FC fed with H2 from ethanol. Figure 2 shows the flowsheet of the simulation used. The process can be divided into three general stages: (i) H2 production by SRE with preheating (HE1) to ensure the reaction temperature; (ii) H2 purification by water condensation (CDS), CO elimination by carbon monoxide preferential oxidation (PROX) with preheating (HE2) to ensure the reaction temperature (150 °C [65]), and CH4 and CO2 adsorption (ADS) with activated carbon and precooling (HE3) to ensure the adsorption temperature (70 °C [66]); and (iii) energy generation in FC with preheating (HE4) to ensure the reaction temperature (150 °C [67]). The energy divisor (ED) indicates that the FC produces both electrical (40%) and heat (60%) energy [68]. CO2 and CH4 adsorption (ADS) with activated carbon was selected among other methods like adsorption with oxides [69,70], because the first ensures simultaneously removal of CO2 and CH4 in post-reforming streams, requires less power consumption, and minimizes H2 losses [66]. ADS was considered as an isothermal and adiabatic process due to the low contents of the adsorbates in the streams, operating at 70 °C, 1 bar, and 100% efficiency, as reported by [66].
Figure 3 shows the error between the experimental data and the simulated data obtained from RSM-Aspen Plus integration for ethanol conversion (Figure 3a) and H2 yield (Figure 3b) during SRE over Rh-Pt/CeO2. Above 450 °C, an adequate prediction of the experimental data can be obtained with the RSM-Aspen Plus integration, with errors < 8% (Ln(Error (%)) = 2). At lower temperatures, the error was higher because the data was normalized assuming 100% carbon balance, which is not accurate at all the conditions. Actual carbon balances measured at each experiment were included Appendix (Table A1), where carbon balances lower than 100% can be ascribed to carbonaceous compounds and other products not quantified by gas chromatography (GC).
In order to validate that the RSM-Aspen Plus integration can still accurately predict the experimental data, independent and random experiments outside the model were performed. Table 4 shows these results and their comparison to the simulated data. Experimental and predicted data are similar even for the catalysts evaluated at low temperature (430 and 470 °C), showing that the information obtained from RSM-Aspen Plus integration closely approximates the experimental results, and thus, it can be used to make predictions, as a preliminary energy analysis of SRE on RhPt/CeO2 catalysts.
Figure 4 shows the energy requirements calculated from the RSM-Aspen Plus integration in the SRE reactor as a function of the active metal content and temperature. Energy consumption per mole of ethanol inlet increased with temperature (Figure 4a). This is expected because ethanol reforming, an endothermic process (347 kJ/mol), is favored at higher temperatures [9]. At temperatures <500 °C, energy requirement decreased, likely due to the presence of an exothermic reaction, such as WGSR (−41.2 kJ/mol) [71]. Llera et al. [54] reported that the activation energy and changes in enthalpy are closely related to intermediate reactions occurring during SRE. Then, the difference in the energy requirements of each catalyst could be an indication that the Rh–Pt ratio favors different reaction mechanisms, as previously discussed in Section 2.1. The energy consumption per mole of H2 produced (Figure 4b) indicates that the bimetallic Rh–Pt catalyst consumed slightly more energy at high temperatures (>500 °C). The Rh0.4Pt0.4 catalyst promotes greater energy consumption at 700 °C. This catalyst also showed a higher H2 yield (Figure 1b) with total ethanol conversion (Figure 1a), little CH4 formation (Figure 1d), and ethylene (Figure 1f) formation. The reforming of ethanol (Equation (1)), CH4 (Equation (8)), and ethylene (Equation (10)) to produce H2 are endothermic reactions [24]. Thus, the increased production of H2 on Rh0.4Pt0.4/CeO2 could be attributed to the fact that this catalyst promotes further endothermic reactions, which require greater energy consumption. Conversely, Rh0.6Pt0.2/CeO2 showed lower energy consumption at temperatures below 500 °C (Figure 4b). At these temperatures, Rh0.6Pt0.2/CeO2 also showed low conversion of ethanol (Figure 1a), limited H2 (Figure 1b) and CO yields (Figure 1c), and higher CH4 (Figure 1d) and ethylene (Figure 1f) yields, which can be an indication that exothermic reactions, such as WGSR (Equation (2)) and reversible reforming, are taking place. Rabenstein et al. [9] reported that greater energy demands are needed to maximize H2 production because the H2 yield is favored by endothermic reactions. Accordingly, the Rh–Pt ratio that favored an increase in H2 production required a slight increase in the energy demand.
The net energy produced in the system was obtained according to Equation (18), where ΔHNET is the net available energy of the system, ΔHFC is the change in enthalpies in the FC, ΔHHE4 is the change in enthalpies in the heating of the stream entering the FC, ΔHPROX is the change in enthalpies during the PROX, ΔHHE2 is the change in enthalpies in the heating of the stream entering the PROX, ΔHCDS is the change in enthalpies in the condenser, ΔHSRE is the change in enthalpies during the SRE, ΔHHE1 is the change in enthalpies during the initial heat exchange, and ΔHHE3 is the change in enthalpies in the cooling of the stream entering the ADS. CH4 and CO2 separator (ADS) was not taken into account in the energy analysis because it was considered as an non-reactant, isothermal, and adiabatic process ΔH = 0, which operates at 70 °C and 1 bar [66]. However, the precooling (HE3) to ensure the operating temperature in ADS was included.
Δ H NET = Δ H FC + Δ H HE 4 + Δ H PROX + Δ H HE 2 + Δ H CDS + Δ H SRE + Δ H HE 1   + Δ H HE 3
The net energy (ΔHNET) production obtained per mol of ethanol inlet is shown in Figure 4c. The process is feasible (ΔHNET > 0) at temperatures > 480 °C, where the H2 yield is ≥ 1.2 mol H2/mol EtOH inlet (Figure 1b). At low temperatures (<500 °C) on bimetallic Rh0.2Pt0.6/CeO2 and Rh0.6Pt0.2/CeO2 catalysts, the energy obtained by feeding the FC with H2 is not enough to compensate for the energy required to heat the feed stream, conduct the SRE, and purify the H2. Rh0.4Pt0.4/CeO2 showed the best energy performance, reaching a minimum at 400 °C (39 kJ/mol EtOH inlet) and a maximum at 700 °C (3149 kJ/mol EtOH inlet) of net energy production. Freni et al. [72] studied a system based on a molten carbonate fuel cell fed directly with a solution of ethanol (S/E = 3), operating at greater than 600 °C. The authors reported that it is possible to obtain up to 1318 kJ/mol EtOH inlet. The major limitation of this system is the generation of byproducts such as CO, which affect the performance of the FC. The results reported in this paper confirm that it is energetically feasible to carry out H2 production and purification in separated steps in order to ensure good quality of the H2 streams that are fed into the FC, but avoiding a low temperature WGSR reactor.
Figure 4d shows the net energy production per mol of H2 obtained in SRE. Pt/CeO2 showed a net energy production of 674 kJ/mol H2 produced at low temperatures (<450 °C) due to the energy requirements to heat the feed stream in the first heat exchanger (HE1, Figure 2) are low (<2700 kJ/mol EtOH) and exothermic reactions are taking place at these temperatures in the SRE reactor (–ΔHSRE < 130 kJ/mol EtOH). Moreover, H2 production on this catalyst was 0.7 mol H2/mol EtOH (Figure 1b), which increased the value of the ΔHNET/mol H2 produced ratio. However, only 491 kJ/mol EtOH inlet was delivered using this Pt/CeO2 catalyst at temperatures <450 °C, which is considerably lower when compared to other catalysts at >550 °C (>812 kJ/mol EtOH inlet, Figure 4c). In this way, energy production must be jointly analyzed by H2 produced and ethanol inlet, to avoid mistaken interpretations.
Therefore, although a higher requirement of energy is needed to produce more H2 (Figure 4b), the overall energy efficiency increases significantly with additional produced H2. Accordingly, it is desirable to produce a high amount of H2 despite the additional energy requirements. At 700 °C, Rh0.4Pt0.4/CeO2 showed a maximum in net energy (742 kJ/mol H2 produced). Until now, only 40% of this energy could be transformed into electricity in FC [68]; this corresponds to 297 kJ/mol H2 produced, which is in line with previous reports. Lopes et al. [64] evaluated a system based on ethanol reforming and a 5 kW proton exchange membrane fuel cell (PEMFC), reporting that the net energy production of the system was around of 286 kJ/mol H2 produced. Sanchez et al. [73] conducted an energy analysis of the production of electricity in FC fed with H2 from the steam reforming of bioethanol, reporting a net energy production of 156 kJ/mol H2 produced. Those calculations included glucose fermentation and bioethanol purification steps.
Consequently, the RhPt/CeO2 catalyst with a Rh–Pt ratio of 1:1 is a promising catalyst for SRE because it promotes higher H2 yields with low formation of undesirable byproducts, such as CH4 and ethylene. Furthermore, it could be energetically sustainable to include this catalyst in a system for energy production in FC fed with H2 obtained from SRE.

3. Materials and Methods

3.1. Catalyst Synthesis

RhPt/CeO2 catalyst samples with different Rh–Pt weight ratios (Table 2) were prepared by the incipient wetness co-impregnation method according to previous reports [32,37]. This method was selected because is effective to load active metals in metal oxide supports and ensure high dispersion [34,74]. A total metal loading of 0.8 wt % was kept in all the catalysts in order to reduce sintering [34]. Cerium nitrate hexahydrate (Ce(NO3)2·6H2O, 99.5%, Alfa Aesar, Haverhill, MA, USA) was calcined at 700 °C in a muffle for 2 h to obtain CeO2, which was used as support. Then, the active metal were co-impregnated by mixing the needed amount of rhodium(III) chloride hydrate (RhCl3·H2O, Sigma Aldrich Chem. Co., St. Louis, MO, USA) and hexachloroplatinum acid hexahydrate (H2PtCl6·6H2O, Aldrich Chem. Co.) solutions in water, and slowly added onto the support. The metal–support mixture was stirred, dried at 105 °C for 24 h, and calcined at 700 °C in muffle for 2 h.

3.2. Catalytic Tests

RhPt/CeO2 catalysts were evaluated in a fixed bed reactor (internal diameter = 12 mm) at atmospheric pressure under kinetic control, according to a previous report [37]. For that, a liquid mixture with a stoichiometric molar ratio of ethanol to water S/E = 3 (0.03 mL/min) was pumped into an evaporator (200 °C, atmospheric pressure) using a Simdos 02 metering pump (KNF Neuberger, Trenton, NJ, USA) and then mixed with N2 carrier gas (300 mL/min). This mixture was fed into the reactor, which was placed in an electric furnace (Applied Test Systems, Butler, PA, USA) with temperature control. RhPt/CeO2 catalysts (100 mg) were diluted with inert quartz particles (80-mesh) until completion of a 300 mg total catalytic bed. To diminish external and internal mass transfer limitations, the plug flow reactor condition was achieved through the elimination of back mixing and channeling by maintaining the ratio of the catalyst bed height and catalyst particle size (L/Dp) at 50 and the ratio of the reactor internal diameter and catalyst particle size (D/Dp) at 60 [3,75]. Before the reaction, the catalysts were reduced in situ in 10% H2/N2 (300 mL/min) at 700 °C for 1 h. Catalytic activity tests were started at 700 °C and the temperature was decreased in 20 °C intervals to 400 °C (continuous sequence, 25 min at each temperature). A gaseous space velocity (GHSV) of 70,600 h−1 with a molar composition inlet of the reformer of ethanol (0.018), water (0.054), and N2 (0.928) was fixed.
Post-reforming stream (N2, H2, CH4, CO, CO2, ethanol, and ethylene) was quantified by gas chromatography using a Clarus 580 equipment (GC, Perkin Elmer, Waltham, MA, USA) equipped with a Carboxen 1010 plot column (30 m, 0.53 mm ID, Restek, Bellefonte, PA, USA) and a Innowax column (30 m, 0.53 mm ID, Perkin Elmer, USA) connected to a thermal conductivity detector (TCD) and flame ionization detector (FID), respectively. The ethanol conversion (XEtOH) and yield for each detected product were calculated according to Equations (19) and (20), where F EtOH , inlet is the initial theoretical mole flow (mol/min) of ethanol at standard conditions, F EtOH , outlet is the mole flow (mol/min) of unreacted ethanol in the product stream detected by GC at time t, and F i is the mole flow (mol/min) of product i (H2, CO, CH4, CO2, C2H4 or C2H6). Carbon balance for each experiment was included as Appendix (Table A1).
X EtOH = F EtOH , inlet F EtOH , outlet F EtOH , inlet
Y i e l d i = F i F EtOH , inlet
All catalysts samples were characterized by thermalgravimetric analysis (TGA) to identify possible carbonaceous residues on the catalyst surface. The TGA analysis was performed in a thermogravimetric analyzer (Mettler Toledo, Columbus, OH, USA). Each sample (30 mg) was degassed with 30 mL/min of N2 flowing at 100 °C for 1 h and heated to 1000 °C in air (5 °C/min, 200 mL/min).

3.3. Statistical Analysis

Experiments completely randomized with five treatments and three replications were conducted. Catalytic performance of RhPt/CeO2 catalysts was evaluated by response surfaces using Design Expert 8 software (version 8.0, Stat-Ease, Inc., Minneapolis, MN, USA, 2009). The adjustment of the response surfaces was validated by the probability (“Probability F”), “Lack of fit” test, “Adequate precision”, and variability with respect to the experimental data (R2). “Probability F” is used to refuse the null hypothesis that all coefficients are 0 and it was computed from “F-value”, which is the mean square model divided into the mean square residual [76]. “Lack of fit” is a statistical test to indicate if the model fits well. “Probability F” and “Lack of fit” can be used as criteria to select adequate model [63] because they are related to the significance of the terms. Similarly, “Adequate precision” is a signal to noise ratio present in the model. R2 values close to 1.0 and “Probability F ” less than 0.5 are expected in a significant model [36]. Also, a minimum of 3 for “Lack of fit” (nonsignificant) and 4 for “Adequate precision” are recommended by Design Expert 8 software [63]. Favorable operation zones in SRE for high production of H2 were identified.

3.4. Simulation in Aspen Plus Software

The mathematical models obtained from RSM were used to make energy predictions in Aspen Plus. Figure 2 shows the simulation flowsheet. First, experimental data were normalized in Microsoft Excel 2016 (Microsoft, Silicon Valley, CA, USA) until complete 100% carbon balance. Thus, the block named “SRE” was used to link Aspen Plus V9.0 (Aspen Tech, Burlington, MA, USA, 2016) and Microsoft Excel 2016. NRTL-RK was used as thermodynamic package in the simulations in order to simultaneously model condensable and non-condensable compounds present in hydrocarbon reforming [39,77]. This allowed the results of the simulations to be downloaded directly into Excel and used in the mathematical models obtained from the RSM, replacing the “Actual Factors” of Table 3 in Equation (17). The percentage error between the experimental data and the results of the RSM and Aspen Plus integration was calculated according to Equation (21), where Error is the relative error, Dexp is the experimental data, and Dsimu is the result obtained by RSM-Aspen Plus integration. This error was plotted in Figure 3 as natural logarithmic ordinate (Ln(Error (%))). In addition, independent and random catalytic tests outside the statistical model were performed as an additional confirmation and included in Table 4.
E r r o r = | D Exp D Simu | D Exp × 100
According to Figure 2, a heat exchanger (HE1) was previously used to heat the feed from 20 °C to the reaction temperature. A condenser (CDS) at 40 °C was used to completely remove water. A yield reactor (PROX) was used to remove CO from the H2 stream, assuming a total CO conversion, and preheating (HE2) ensured the reaction temperature (150 °C) [65]. Then, a total separator (ADS) with precooling (HE3) was used to completely remove CH4 and CO2 assuming isothermal and adiabatic adsorption, due to their low concentration in the stream. ADS simulates an adsorber filled with activated carbon that operates at 70 °C, 1 bar, and 100% efficiency [66]. Finally, the FC was modeled as a reactor (FC) operating at 150 °C [67], with a preheating (HE4) to ensure this condition, and 80% H2 conversion and 40% electrical efficiency were assumed in FC [68]. Aspen Plus was used to calculate the enthalpies of each stream in order to determine the energy requirements in each equipment of the system (Figure 2) per mole of ethanol inlet and per mol of H2 produced in SRE according to Equations (22) and (23), respectively, where Δ H i is the total change of enthalpy in the equipment i (i.e., HE1, SRE, CDS, PROX, HE2, HE3, HE4, or FC); HS1i and HS2i are the total enthalpy (kJ/min) in the inflow and outflow of equipment i, respectively; F H 2 , outlet is the mole flow (mol/min) of H2 produced in the SRE; and F EtOH , inlet is the initial theoretical mole flow (mol/min) of ethanol at ambient temperature. Sensitivity analyses for temperature (400–700 °C) and different Rh–Pt ratios in the catalyst were performed in order to build a surface response in Design Expert 8 software. The net energy produced in the system was obtained according to Equation (18): it is expected that ΔHCDS, ΔHPROX, ΔHHE3, and ΔHFC are positive due to an energy release; that ΔHHE1, ΔHHE2, and ΔHHE4 are negative because of energy consumption; and that ΔHSRE can be positive or negative depending on the operating temperature.
Δ H i = H S 1 i H S 2 i F EtOH , intlet
Δ H i = H S 1 i H S 2 i F H 2 , outlet

4. Conclusions

The integration of the Response Surface Methodology (RSM) and Aspen Plus enabled the assessment of energy generation in a fuel cell (FC). FC was fed with H2 obtained from the steam reforming of ethanol (SRE) over RhPt/CeO2 catalysts. The effect of the operating temperature and the Rh–Pt weight ratio (1:0, 3:1, 1:1, 1:3, and 0:1) on SRE over RhPt/CeO2 was evaluated using RSM. A maximum of 4.2 mol H2/mol EtOH (700 °C) with the Rh0.4Pt0.4/CeO2 catalyst was obtained. The mathematical models obtained from the RSM were integrated into Aspen Plus through Excel in order to simulate an integrated H2 production by SRE; H2 purification by water condensation, preferential oxidation of CO, and a CH4 and CO2 adsorber; and energy generation in an FC. An energy sensitivity analysis of the process carried out in Aspen Plus was employed to generate new response surfaces. The response surfaces showed that an increase in H2 production requires more energy consumption in SRE. However, the higher the H2 production, the higher is the energy generation in the FC, which increased the overall system efficiency. A yield of 1.2 mol H2/mol EtOH was identified as the minimum necessary to make the system energetically feasible. A maximum net energy of 742 kJ/mol H2 was produced at 700 °C when using a Rh0.4Pt0.4/CeO2 catalyst for SRE. The portion of this energy that could be transformed into electricity in FC was 40% (297 kJ/mol H2 produced). According to the results of the integration of RSM and Aspen Plus, Rh0.4Pt0.4/CeO2 is a promising catalyst for use in an energy production system that uses fuel cells fed with H2 obtained from ethanol.

Acknowledgments

The authors are grateful to Colciencias and Universidad de La Sabana for the financial support of this work through the project number ING-163 (Colciencias contract 174-2016).

Author Contributions

Bernay Cifuentes and Martha Cobo contributed equally to this work. Manuel Figueredo participated in the integration of the mathematical models from Response Surface Methodology (RSM) with Aspen Plus. All authors contributed to the writing and review of this document.

Conflicts of Interest

This manuscript has not been published or presented elsewhere in part or entirety, and it is not under consideration by another journal. All the authors have approved the manuscript and agreed to its submission to your esteemed journal. There are no conflicts of interest to declare.

Appendix A

Table A1. Experimental results used to obtain response surfaces and carbon balances.
Rh Content (wt %)T (°C)Carbon Balance (%)Yield (mol/mol EtOH Inlet)Ethanol Conversion (%)
H2COCH4CO2Ethylene
0.0700933.111.090.130.643.0 × 10−6100
0.0680962.840.920.160.852.9 × 105100
0.0660912.520.980.190.655.0 × 105100
0.0640942.190.720.320.842.4 × 10−4100
0.0620921.960.820.180.831.1 × 10599.3
0.0600921.660.780.010.852.4 × 10−490.5
0.0580971.600.650.030.911.6 × 10−482.8
0.0560991.280.360.081.084.5 × 10−476.9
0.0540951.260.300.060.963.3 × 10571.1
0.0520961.190.100.091.095.0 × 10568.1
0.05001071.110.090.021.029.7 × 10549.7
0.04801091.130.070.040.823.5 × 10−436.8
0.04601091.130.120.000.825.3 × 10−437.7
0.04401061.150.010.000.813.7 × 10535.5
0.04201071.150.000.000.734.0 × 10−429.8
0.04001080.960.000.000.816.6 × 10−333.7
0.2700973.150.970.310.652.1 × 10−4100
0.2680932.870.780.440.631.1 × 10−4100
0.2660922.540.840.460.552.9 × 10−4100
0.2640922.280.840.380.632.1 × 10−4100
0.2620951.800.860.450.602.2 × 10−4100
0.2600891.490.800.350.61099.1
0.2580941.290.740.270.827.7 × 10597.4
0.2560891.180.390.430.59081.6
0.2540931.020.320.250.601.0 × 10−465.4
0.2520910.530.130.240.591.3 × 10−457.0
0.2500960.460.100.150.711.5 × 10−451.8
0.24801040.350.060.060.897.0 × 10−446.6
0.24601100.310.020.041.021.3 × 10−344.0
0.24401020.150.010.050.512.3 × 10−326.6
0.24201050.180.010.040.801.9 × 10−337.7
0.24001080.100.010.020.907.2 × 10539.0
0.4700964.101.340.260.317.7 × 105100
0.46801003.811.250.250.506.0 × 105100
0.4660963.321.240.260.428.2 × 105100
0.4640902.900.890.410.501.0 × 10−4100
0.4620912.680.980.500.340100
0.4600792.380.950.180.434.5 × 10−3100
0.4580932.080.940.170.754.5 × 10−3100
0.4560921.540.650.300.591.2 × 10−285,8
0.4540960.910.500.210.681.2 × 10−275.3
0.4520930.900.470.090.651.2 × 10−268.5
0.45001030.810.220.070.691.2 × 10−247.4
0.44801080.650.100.110.751.1 × 10−241.6
0.44601040.480.010.000.692.1 × 10−331.0
0.44401070.370.010.000.752.2 × 10−431.3
0.44201100.340.020.000.661.1 × 10−423.5
0.44001090.320.020.000.662.2 × 10−724.4
0.6700904.121.480.190.135.6 × 10−6100
0.66801003.401.280.220.502.4 × 10−4100
0.6660933.021.280.320.274.9 × 10−4100
0.6640932.410.960.280.614.8 × 10−499.7
0.6620931.960.850.350.661.0 × 10−3100
0.6600921.670.940.290.615.2 × 10−499.5
0.6580911.490.840.260.714.3 × 10−499.4
0.6560941.240.830.430.628.6 × 105100
0.65401000.950.740.270.730.13100
0.6520930.720.690.170.757.7 × 10−294.9
0.6500940.430.510.200.907.8 × 10−387.4
0.64801070.200.190.190.890.1370.1
0.64601010.180.180.120.597.7 × 10−252.0
0.6440920.130.120.130.447.8 × 10−344.0
0.6420930.090.090.000.373.8 × 10−233.7
0.6400900.030.030.040.291.2 × 10−229.1
0.8700984.071.710.040.194.5 × 10−3100
0.8680953.931.650.050.192.4 × 105100
0.8660953.341.570.070.253.7 × 10−499.8
0.8640912.651.420.080.334.8 × 10−499.6
0.8620892.231.250.090.433.1 × 10−499.2
0.8600971.891.310.090.411.1 × 10593.7
0.8580891.390.850.110.611.8 × 10−389.3
0.85601001.080.800.160.623.5 × 10−379.2
0.85401041.100.720.080.764.2 × 10−374.5
0.8520970.960.610.090.623.9 × 10−369.5
0.8500910.950.580.010.462.1 × 10−362.0
0.8480920.830.510.010.361.2 × 10−351.8
0.8460890.670.370.000.302.6 × 10−345.4
0.8440950.650.340.000.267.5 × 10−435.1
0.8420990.670.310.000.291.2 × 10−331.5
0.8400960.620.300.000.184.7 × 10−428.3
Mean97------
Standard deviation6.5------

References

  1. Rhodes, C.J. The 2015 Paris climate change conference: Cop21. Sci. Prog. 2016, 99, 97–104. [Google Scholar] [CrossRef] [PubMed]
  2. Lucia, U. Overview on fuel cells. Renew. Sustain. Energy Rev. 2014, 30, 164–169. [Google Scholar] [CrossRef]
  3. Sahoo, D.R.; Vajpai, S.; Patel, S.; Pant, K.K. Kinetic modeling of steam reforming of ethanol for the production of hydrogen over Co/Al2O3 catalyst. Chem. Eng. J. 2007, 125, 139–147. [Google Scholar] [CrossRef]
  4. Quintero, J.A.; Montoya, M.I.; Sánchez, O.J.; Giraldo, O.H.; Cardona, C.A. Fuel ethanol production from sugarcane and corn: Comparative analysis for a Colombian case. Energy 2008, 33, 385–399. [Google Scholar] [CrossRef]
  5. Elfasakhany, A. Investigations on the effects of ethanol–methanol–gasoline blends in a spark-ignition engine: Performance and emissions analysis. Eng. Sci. Technol. Int. J. 2015, 18, 713–719. [Google Scholar] [CrossRef]
  6. Chiu, W.-C.; Horng, R.-F.; Chou, H.-M. Hydrogen production from an ethanol reformer with energy saving approaches over various catalysts. Int. J. Hydrogen Energy 2013, 38, 2760–2769. [Google Scholar] [CrossRef]
  7. De Lima, S.; Da Cruz, I.; Jacobs, G.; Davis, B.; Mattos, L.; Noronha, F.B. Steam reforming, partial oxidation, and oxidative steam reforming of ethanol over Pt/CeZrO2 catalyst. J. Catal. 2008, 257, 356–368. [Google Scholar] [CrossRef]
  8. López, E.; Divins, N.J.; Anzola, A.; Schbib, S.; Borio, D.; Llorca, J. Ethanol steam reforming for hydrogen generation over structured catalysts. Int. J. Hydrogen Energy 2013, 38, 4418–4428. [Google Scholar] [CrossRef]
  9. Rabenstein, G.; Hacker, V. Hydrogen for fuel cells from ethanol by steam-reforming, partial-oxidation and combined auto-thermal reforming: A thermodynamic analysis. J. Power Sources 2008, 185, 1293–1304. [Google Scholar] [CrossRef]
  10. Liberatori, J.W.C.; Ribeiro, R.U.; Zanchet, D.; Noronha, F.B.; Bueno, J.M.C. Steam reforming of ethanol on supported nickel catalysts. Appl. Catal. A 2007, 327, 197–204. [Google Scholar] [CrossRef]
  11. Valle, B.; Aramburu, B.; Remiro, A.; Bilbao, J.; Gayubo, A.G. Effect of calcination/reduction conditions of Ni/La2O3–αAl2O3 catalyst on its activity and stability for hydrogen production by steam reforming of raw bio-oil/ethanol. Appl. Catal. B 2014, 147, 402–410. [Google Scholar] [CrossRef]
  12. Wang, H.; Zhang, L.; Yuan, M.; Xu, T.; Liu, Y. Steam reforming of ethanol over Ni/Ce0.7Pr0.3O2 catalyst. J. Rare Earths 2012, 30, 670–675. [Google Scholar] [CrossRef]
  13. Bilala, M.; Jackson, S.D. Ethanol steam reforming over Rh and Pt catalysts: Effect of temperature and catalyst deactivation. Catal. Sci. Technol 2013, 3, 754–766. [Google Scholar] [CrossRef]
  14. Guerrero, L.; Castilla, S.; Cobo, M. Advances in ethanol reforming for the production of hydrogen. Quim. Nova 2014, 37, 850–856. [Google Scholar] [CrossRef]
  15. Konsolakis, M.; Ioakimidis, Z.; Kraia, T.; Marnellos, G. Hydrogen production by ethanol steam reforming (ESR) over CeO2 supported transition metal (Fe, Co, Ni, Cu) catalysts: Insight into the structure-activity relationship. Catalysts 2016, 6, 39. [Google Scholar] [CrossRef]
  16. Liu, Y.; Murata, K.; Inaba, M. Steam reforming of bio-ethanol to produce hydrogen over Co/CeO2 catalysts derived from Ce1−xCoxO2−y precursors. Catalysts 2016, 6, 26. [Google Scholar] [CrossRef]
  17. Domínguez, M.; Taboada, E.; Molins, E.; Llorca, J. Co-Fe-Si aerogel catalytic honeycombs for low temperature ethanol steam reforming. Catalysts 2012, 2, 386–399. [Google Scholar] [CrossRef]
  18. Sheng, P.Y.; Chiu, W.W.; Yee, A.; Morrison, S.J.; Idriss, H. Hydrogen production from ethanol over bimetallic Rh-M/CeO2 (M = Pd or Pt). Catal. Today 2007, 129, 313–321. [Google Scholar] [CrossRef]
  19. Sheng, P.-Y.; Yee, A.; Bowmaker, G.A.; Idriss, H. H2 production from ethanol over Rh–Pt/CeO2 catalysts: The role of Rh for the efficient dissociation of the carbon–carbon bond. J. Catal. 2002, 208, 393–403. [Google Scholar] [CrossRef]
  20. Jacobs, G.; Keogh, R.A.; Davis, B.H. Steam reforming of ethanol over Pt/ceria with co-fed hydrogen. J. Catal. 2007, 245, 326–337. [Google Scholar] [CrossRef]
  21. Zou, J.; Yu, B.; Zhang, S.; Zhang, J.; Chen, Y.; Cui, L.; Xu, T.; Cai, W. Hydrogen production from ethanol over Ir/CeO2 catalyst: Effect of the calcination temperature. Fuel 2015, 159, 741–750. [Google Scholar] [CrossRef]
  22. Calles, J.; Carrero, A.; Vizcaíno, A.; Lindo, M. Effect of Ce and Zr addition to Ni/SiO2 catalysts for hydrogen production through ethanol steam reforming. Catalysts 2015, 5, 58–76. [Google Scholar] [CrossRef]
  23. Gutierrez, A.; Karinen, R.; Airaksinen, S.; Kaila, R.; Krause, A.O.I. Autothermal reforming of ethanol on noble metal catalysts. Int. J. Hydrogen Energy 2011, 36, 8967–8977. [Google Scholar] [CrossRef]
  24. Contreras, J.L.; Salmones, J.; Colín-Luna, J.A.; Nuño, L.; Quintana, B.; Córdova, I.; Zeifert, B.; Tapia, C.; Fuentes, G.A. Catalysts for H2 production using the ethanol steam reforming (a review). Int. J. Hydrogen Energy 2014, 39, 18835–18853. [Google Scholar] [CrossRef]
  25. Moura, J.S.; Souza, M.O.G.; Bellido, J.D.A.; Assaf, E.M.; Opportus, M.; Reyes, P.; do Carmo Rangel, M. Ethanol steam reforming over rhodium and cobalt-based catalysts: Effect of the support. Int. J. Hydrogen Energy 2012, 37, 3213–3224. [Google Scholar] [CrossRef] [Green Version]
  26. Cobo, M.; Pieruccini, D.; Abello, R.; Ariza, L.; Córdoba, L.F.; Conesa, J.A. Steam reforming of ethanol over bimetallic RhPt/La2O3: Long-term stability under favorable reaction conditions. Int. J. Hydrogen Energy 2013, 38, 5580–5593. [Google Scholar] [CrossRef]
  27. Ratnasamy, C.; Wagner, J.P. Water gas shift catalysis. Catal. Rev. 2009, 51, 325–440. [Google Scholar] [CrossRef]
  28. Mei, Z.; Li, Y.; Fan, M.; Zhao, L.; Zhao, J. Effect of the interactions between Pt species and ceria on Pt/ceria catalysts for water gas shift: The XPS studies. Chem. Eng. J. 2015, 259, 293–302. [Google Scholar] [CrossRef]
  29. Holgado, J.P.; Munuera, G. XPS/TPR study of the reducibility of M/CeO2 catalysts (M = Pt, Rh): Does junction effect theory apply? Stud. Surf. Sci. Catal. 1995, 96, 109–122. [Google Scholar]
  30. Ni, M.; Leung, D.Y.C.; Leung, M.K.H. A review on reforming bio-ethanol for hydrogen production. Int. J. Hydrogen Energy 2007, 32, 3238–3247. [Google Scholar] [CrossRef]
  31. O’Brien, F.J. Biomaterials & scaffolds for tissue engineering. Mater. Today 2011, 14, 88–95. [Google Scholar]
  32. Cifuentes, B.; Valero, M.F.; Conesa, J.A.; Cobo, M. Hydrogen production by steam reforming of ethanol on Rh-Pt catalysts: Influence of CeO2, ZrO2, and La2O3 as supports. Catalysts 2015, 5, 1872–1896. [Google Scholar] [CrossRef]
  33. Idriss, H.; Scott, M.; Llorca, J.; Chan, S.C.; Chiu, W.; Sheng, P.-Y.; Yee, A.; Blackford, M.A.; Pas, S.J.; Hill, A.J.; et al. A phenomenological study of the metal-oxide interface: The role of catalysis in hydrogen production from renewable resources. ChemSusChem 2008, 1, 905–910. [Google Scholar] [CrossRef] [PubMed]
  34. Kaila, R.K.; Gutiérrez, A.; Slioor, R.; Kemell, M.; Leskelä, M.; Krause, A.O.I. Zirconia-supported bimetallic RhPt catalysts: Characterization and testing in autothermal reforming of simulated gasoline. Appl. Catal. B 2008, 84, 223–232. [Google Scholar] [CrossRef]
  35. Song, H.; Ozkan, U.S. Economic analysis of hydrogen production through a bio-ethanol steam reforming process: Sensitivity analyses and cost estimations. Int. J. Hydrogen Energy 2010, 35, 127–134. [Google Scholar] [CrossRef]
  36. Myers, R.H.; Montgomery, D.C.; Anderson-Cook, C.M. Response Surface Methodology: Process and Product Optimization Using Designed Experiments; John Wiley & Sons: Hoboken, NJ, USA, 2009. [Google Scholar]
  37. Cifuentes, B.; Hernández, M.; Monsalve, S.; Cobo, M. Hydrogen production by steam reforming of ethanol on a RhPt/CeO2/SiO2 catalyst: Synergistic effect of the Si:Ce ratio on the catalyst performance. Appl. Catal. A 2016, 523, 283–293. [Google Scholar] [CrossRef]
  38. Geravand, E.; Shariatinia, Z.; Yaripour, F.; Sahebdelfar, S. Synthesis of copper–silica nanosized catalysts for 2-butanol dehydrogenation and optimization of preparation parameters by response surface method. Chem. Eng. Res. Des. 2015, 96, 63–77. [Google Scholar] [CrossRef]
  39. Rossetti, I.; Compagnoni, M.; Torli, M. Process simulation and optimization of H2 production from ethanol steam reforming and its use in fuel cells. 2. Process analysis and optimization. Chem. Eng. J. 2015, 281, 1036–1044. [Google Scholar] [CrossRef]
  40. Ye, G.; Xie, D.; Qiao, W.; Grace, J.R.; Lim, C.J. Modeling of fluidized bed membrane reactors for hydrogen production from steam methane reforming with Aspen Plus. Int. J. Hydrogen Energy 2009, 34, 4755–4762. [Google Scholar] [CrossRef]
  41. Chang, H.; Liau, J.-S.; Ho, C.-D.; Wang, W.-H. Simulation of membrane distillation modules for desalination by developing user’s model on Aspen Plus platform. Desalination 2009, 249, 380–387. [Google Scholar] [CrossRef]
  42. Sangal, V.; Kumar, V.; Mishra, M. Optimization of a divided wall column for the separation of C4-C6 normal paraffin mixture using Box-Behnken design. Chem. Ind. Chem. Eng. Q. 2013, 19, 107–119. [Google Scholar] [CrossRef] [Green Version]
  43. Hou, T.; Yu, B.; Zhang, S.; Xu, T.; Wang, D.; Cai, W. Hydrogen production from ethanol steam reforming over Rh/CeO2 catalyst. Catal. Commun. 2015, 58, 137–140. [Google Scholar] [CrossRef]
  44. Auprêtre, F.; Descorme, C.; Duprez, D. Bio-ethanol catalytic steam reforming over supported metal catalysts. Catal. Commun. 2002, 3, 263–267. [Google Scholar] [CrossRef]
  45. Kalamaras, C.M.; Petallidou, K.C.; Efstathiou, A.M. The effect of La3+-doping of CeO2 support on the water-gas shift reaction mechanism and kinetics over Pt/Ce1−xLaxO2−δ. Appl. Catal. B 2013, 136–137, 225–238. [Google Scholar] [CrossRef]
  46. Scarabello, A.; Dalle Nogare, D.; Canu, P.; Lanza, R. Partial oxidation of methane on Rh/ZrO2 and Rh/Ce–ZrO2 on monoliths: Catalyst restructuring at reaction conditions. Appl. Catal. B 2015, 174–175, 308–322. [Google Scholar] [CrossRef]
  47. Jakdetchai, O.; Nakajima, T. Mechanism of the water–gas shift reaction over Cu(110), Cu(111) and Cu(100) surfaces: An AM1-d study. J. Mol. Struct. THEOCHEM 2002, 619, 51–58. [Google Scholar] [CrossRef]
  48. Diagne, C.; Idriss, H.; Kiennemann, A. Hydrogen production by ethanol reforming over Rh/CeO2–ZrO2 catalysts. Catal. Commun. 2002, 3, 565–571. [Google Scholar] [CrossRef]
  49. Silva, A.M.; Costa, L.O.O.; Barandas, A.P.M.G.; Borges, L.E.P.; Mattos, L.V.; Noronha, F.B. Effect of the metal nature on the reaction mechanism of the partial oxidation of ethanol over CeO2-supported Pt and Rh catalysts. Catal. Today 2008, 133–135, 755–761. [Google Scholar] [CrossRef]
  50. Liu, H.-H.; Wang, Y.; Jia, A.-P.; Wang, S.-Y.; Luo, M.-F.; Lu, J.-Q. Oxygen vacancy promoted CO oxidation over Pt/CeO2 catalysts: A reaction at Pt–CeO2 interface. Appl. Surf. Sci. 2014, 314, 725–734. [Google Scholar] [CrossRef]
  51. Diagne, C.; Idriss, H.; Pearson, K.; Gómez-García, M.A.; Kiennemann, A. Efficient hydrogen production by ethanol reforming over Rh catalysts. Effect of addition of Zr on CeO2 for the oxidation of CO to CO2. Comptes Rendus Chim. 2004, 7, 617–622. [Google Scholar] [CrossRef]
  52. Cavallaro, S. Ethanol steam reforming on Rh/Al2O3 catalysts. Energy Fuels 2000, 14, 1195–1199. [Google Scholar] [CrossRef]
  53. Martínez-Arias, A.; Hungría, A.B.; Munuera, G.; Gamarra, D. Preferential oxidation of CO in rich H2 over CuO/CeO2: Details of selectivity and deactivation under the reactant stream. Appl. Catal. B 2006, 65, 207–216. [Google Scholar] [CrossRef]
  54. Llera, I.; Mas, V.; Bergamini, M.L.; Laborde, M.; Amadeo, N. Bio-ethanol steam reforming on Ni based catalyst. Kinetic study. Chem. Eng. Sci. 2012, 71, 356–366. [Google Scholar] [CrossRef]
  55. Munera, J.; Irusta, S.; Cornaglia, L.; Lombardo, E.; Vargascesar, D.; Schmal, M. Kinetics and reaction pathway of the CO2 reforming of methane on Rh supported on lanthanum-based solid. J. Catal. 2007, 245, 25–34. [Google Scholar] [CrossRef]
  56. da Silva, A.M.; de Souza, K.R.; Jacobs, G.; Graham, U.M.; Davis, B.H.; Mattos, L.V.; Noronha, F.B. Steam and CO2 reforming of ethanol over Rh/CeO2 catalyst. Appl. Catal. B 2011, 102, 94–109. [Google Scholar] [CrossRef]
  57. Yee, A.; Morrison, S.; Idriss, H. The reactions of ethanol over M/CeO2 catalysts. Catal. Today 2000, 63, 327–335. [Google Scholar] [CrossRef]
  58. Hou, T.; Zhang, S.; Chen, Y.; Wang, D.; Cai, W. Hydrogen production from ethanol reforming: Catalysts and reaction mechanism. Renew. Sustain. Energy Rev. 2015, 44, 132–148. [Google Scholar] [CrossRef]
  59. Özkara-Aydınoğlu, Ş.; Özensoy, E.; Aksoylu, A.E. The effect of impregnation strategy on methane dry reforming activity of Ce promoted Pt/ZrO2. Int. J. Hydrogen Energy 2009, 34, 9711–9722. [Google Scholar] [CrossRef] [Green Version]
  60. Yu, C.Y.; Lee, D.W.; Park, S.J.; Lee, K.Y.; Lee, K.H. Study on a catalytic membrane reactor for hydrogen production from ethanol steam reforming. Int. J. Hydrogen Energy 2009, 34, 2947–2954. [Google Scholar] [CrossRef]
  61. Ciambelli, P.; Palma, V.; Ruggiero, A. Low temperature catalytic steam reforming of ethanol. 2. Preliminary kinetic investigation of Pt/CeO2 catalysts. Appl. Catal. B 2010, 96, 190–197. [Google Scholar] [CrossRef]
  62. Zanchet, D.; Santos, J.B.O.; Damyanova, S.; Gallo, J.M.R.; Bueno, J.M.C. Toward understanding metal-catalyzed ethanol reforming. ACS Catal. 2015, 5, 3841–3863. [Google Scholar] [CrossRef]
  63. Anderson, M.J.; Whitcomb, P.J.; Shari, L.K.; Adams, W. Handbook for Experimenters; Stat-Ease, Inc.: Minneapoliscity, MN, USA, 2009. [Google Scholar]
  64. Lopes, D.G.; da Silva, E.P.; Pinto, C.S.; Neves, N.P.; Camargo, J.C.; Ferreira, P.F.P.; Furlan, A.L.; Lopes, D.G. Technical and economic analysis of a power supply system based on ethanol reforming and PEMFC. Renew. Energy 2012, 45, 205–212. [Google Scholar] [CrossRef]
  65. Liao, X.; Chu, W.; Dai, X.; Pitchon, V. Bimetallic Au-Cu supported on ceria for PROX reaction: Effects of Cu/Au atomic ratios and thermal pretreatments. Appl. Catal. B 2013, 142–143, 25–37. [Google Scholar] [CrossRef]
  66. Grande, C.A.; Lopes, F.V.S.; Ribeiro, A.M.; Loureiro, J.M.; Rodrigues, A.E. Adsorption of off-gases from steam methane reforming (H2, CO2, CH4, CO and N2) on activated carbon. Sep. Sci. Technol. 2008, 43, 1338–1364. [Google Scholar] [CrossRef]
  67. Hernández, L.; Kafarov, V. Use of bioethanol for sustainable electrical energy production. Int. J. Hydrogen Energy 2009, 34, 7041–7050. [Google Scholar] [CrossRef]
  68. Elmer, T.; Worall, M.; Wu, S.; Riffat, S.B. Fuel cell technology for domestic built environment applications: State of-the-art review. Renew. Sustain. Energy Rev. 2015, 42, 913–931. [Google Scholar] [CrossRef]
  69. Martavaltzi, C.S.; Pampaka, E.P.; Korkakaki, E.S.; Lemonidou, A.A. Hydrogen production via steam reforming of methane with simultaneous CO2 capture over CaO−Ca12Al14O33. Energy Fuels 2010, 24, 2589–2595. [Google Scholar] [CrossRef]
  70. Rydén, M.; Ramos, P. H2 production with CO2 capture by sorption enhanced chemical-looping reforming using NiO as oxygen carrier and CaO as CO2 sorbent. Fuel Process. Technol. 2012, 96, 27–36. [Google Scholar] [CrossRef]
  71. Ogo, S.; Shimizu, T.; Nakazawa, Y.; Mukawa, K.; Mukai, D.; Sekine, Y. Steam reforming of ethanol over K promoted Co catalyst. Appl. Catal. A 2015, 495, 30–38. [Google Scholar] [CrossRef]
  72. Freni, S.; Maggio, G.; Cavallaro, S. Ethanol steam reforming in a molten carbonate fuel cell: A thermodynamic approach. J. Power Sources 1996, 62, 67–73. [Google Scholar] [CrossRef]
  73. Sanchez, N.; Ruiz, R.Y.; Cifuentes, B.; Cobo, M. Hydrogen from glucose: A combined study of glucose fermentation, bioethanol purification, and catalytic steam reforming. Int. J. Hydrogen Energy 2016, 41, 5640–5651. [Google Scholar] [CrossRef]
  74. Ghelamallah, M.; Granger, P. Supported-induced effect on the catalytic properties of Rh and Pt-Rh particles deposited on La2O3 and mixed α-Al2O3-La2O3 in the dry reforming of methane. Appl. Catal. A 2014, 485, 172–180. [Google Scholar] [CrossRef]
  75. Mondal, T.; Pant, K.K.; Dalai, A.K. Catalytic oxidative steam reforming of bio-ethanol for hydrogen production over Rh promoted Ni/CeO2–ZrO2 catalyst. Int. J. Hydrogen Energy 2015, 40, 2529–2544. [Google Scholar] [CrossRef]
  76. Ferreira, S.L.C.; Bruns, R.E.; da Silva, E.G.P.; Dos Santos, W.N.L.; Quintella, C.M.; David, J.M.; de Andrade, J.B.; Breitkreitz, M.C.; Jardim, I.C.S.F.; Neto, B.B. Statistical designs and response surface techniques for the optimization of chromatographic systems. J. Chromatogr. A 2007, 1158, 2–14. [Google Scholar] [CrossRef] [PubMed]
  77. Adams, T.A.; Barton, P.I. Combining coal gasification and natural gas reforming for efficient polygeneration. Fuel Process. Technol. 2011, 92, 639–655. [Google Scholar] [CrossRef]
Figure 1. (a) Ethanol conversion (XEtOH) and yields of (b) H2, (c) CO, (d) CH4, (e) CO2, and (f) ethylene (C2H4) as a function of temperature over RhPt/CeO2 with different Rh–Pt ratios. Total metal loading (Rh + Pt) = 0.8 wt % in all catalysts. Response surface: Quartic model, R2 > 0.85, Adjusted R2 > 0.82, Probability F << 0.1 (significant), and Lack of Fit >> 3 (nonsignificant). Reaction conditions: S/E = 3, 100 mg catalyst, and GHSV = 70,600 h−1. Arrows in Figure 1e show the increasing variable direction.
Catalysts 07 00015 g001
Figure 2. Aspen Plus flowsheet of the process used for the analysis of the energy production in FC fed with H2 obtained through SRE of ethanol over Rh–Pt/CeO2. Thermodynamic method = NRTL-SK. Equipment notation: HE—Heat exchanger, SRE—Reactor for the steam reforming of ethanol, CDS—Condenser, PROX—Reactor for carbon monoxide preferential oxidation, ADS—Adsorber, FC—Reactor as fuel cells, ED—Energy divisor. Streams notation: continuous lines are mass flows (1–14) and dashed lines are energy flows (15–17).
Catalysts 07 00015 g002
Figure 3. Percentage errors between the experimental data and the results from the RSM-Aspen Plus integration for (a) ethanol conversion and (b) H2 yield during SRE over Rh–Pt/CeO2. Note that the vertical axis was linearized using Ln to make the difference between the errors more visible.
Catalysts 07 00015 g003
Figure 4. Changes in enthalpy during the SRE and net energy production of the system computed with Aspen Plus in terms of ethanol-inlet ((a) and (c)) and H2 ((b) and (d)) produced. Total metal loading (Rh + Pt) = 0.8 wt % in all Rh–Pt/CeO2 catalysts. Response surface: Quartic model, R2 > 0.85; Adjusted, R2 > 0.8, Probability F << 0.1 (significant) and Lack of Fit >> 3 (nonsignificant).
Catalysts 07 00015 g004
Table 1. Network of chemical reactions during the steam reforming of ethanol [10,11,12].
ReactionDescription
CH 3 CH 2 OH + 3 H 2 O 2 CO 2 + 6 H 2 (Steam reforming–ethanol)Equation (1)
CO + H 2 O CO 2 + H 2 (Water gas shift reaction)Equation (2)
CH 3 CH 2 OH CH 3 CHO + H 2 (Dehydrogenation–ethanol)Equation (3)
CH 3 CH 2 OH C 2 H 4 + H 2 O (Dehydration–ethanol)Equation (4)
CH 3 CH 2 OH CH 4 + CO + H 2 (Decomposition–ethanol)Equation (5)
CH 3 CHO CH 4 + CO (Decomposition–acetaldehyde)Equation (6)
CH 3 CHO + H 2 O CH 4 + CO 2 + H 2 (Steam reforming–acetaldehyde)Equation (7)
CH 4 + H 2 O CO + 3 H 2 (Steam reforming–methane)Equation (8)
2 CH 4 C 2 H 4 + 2 H 2 (Dehydrogenation–methane)Equation (9)
C 2 H 4 + 4 H 2 O 2 CO 2 + 6 H 2 (Steam reforming–ethylene)Equation (10)
Table 2. RhPt/CeO2 catalysts evaluated in steam reforming of ethanol (SRE).
Catalyst 1Rh (wt %)Pt (wt %)Rh–Pt (wt ratio)Weight Loss of Used Catalyst Samples (mg carbon/(gcat·h)) 2
CeO2000:04.06
Rh0.8/CeO20.801:01.00
Rh0.6Pt0.2/CeO20.60.23:10.36
Rh0.4Pt0.4/CeO20.40.41:10.42
Rh0.2Pt0.6/CeO20.20.61:30.52
Pt0.8/CeO200.80:13.31
1 Subscripts in RhPt/CeO2 catalysts correspond to the nominal metal loading; 2 measured by thermogravimetric analysis (TGA).
Table 3. Results of regression analysis and the Analysis of Variance (ANOVA) for the model of the experimental data for activity and yield of RhPt/CeO2 catalysts evaluated in steam reforming of ethanol (SRE).
Variable*/ParameterEthanol Conversion (%)H2 Yield
(mol H2/mol EtOH Inlet)
CO Yield
(mol CO/mol EtOH Inlet)
Coded FactorsActual FactorsCoded FactorsActual FactorsCoded FactorsActual Factors
-NS*4.9 × 10³NS*−34NS*32
TNS*−35NS*0.29NS*−0.22
C−3.3 × 10¹⁰−2.2 × 1032.1 × 109−412.4 × 10⁸−21
T*C3.9 × 10711NS*0.1NS*0.1
T21.5 × 1059.1 × 10−23.4 × 10³−8.8 × 10−4NS*5.6 × 10−4
C2−5.0 × 10103.9 × 1023.1 × 1091.0 × 1023.8 × 10813
T2*C3.1 × 105−1.8 × 10−26.9 × 103−1.2 × 10⁻⁴NS*−1.7 × 10⁻⁴
T*C2NS*−3.8NS*−9.2 × 10⁻²NS*−2.0 × 10⁻²
T31.5 × 103−1.0 × 10−4NS*1.1 × 10−6NS*−6.0 × 10⁻⁷
C3−3.6 × 1091.6 × 1032.1 × 109−1.4 × 1022.5 × 108−14
T2*C21.5 × 1052.8 × 10−33.5 × 1036.2 × 105NS*2.3 × 105
T3*C1.6 × 1039.4 × 10−6NS*−1.1 × 10−3NS*9.1 × 10−8
T*C3NS*0.71NS*−5.2 × 10⁻¹⁰NS*−4.7 × 10⁻³
T4214.2 × 10−8NS*85NS*2.4 × 10−10
C4−8.5 × 10⁹−1.4 × 1035.3 × 108856.2 × 10710
ModelQuarticQuarticQuartic
F-value164.08480.03200.86
Probability F<1 × 10⁻⁴<1 × 10⁻⁴<1 × 10⁻⁴
Standard deviation5.40.120.07
Mean72.01.530.55
R20.970.9900.977
Adjusted R20.970.9980.973
Predicted R20.960.9840.964
Adequate precision37.0981.9557.84
Lack of Fit747379
Variable*/ParameterCO2 Yield
(mol CO2/mol EtOH Inlet)
CH4 Yield
(mol CH4/mol EtOH Inlet)
Ethylene Yield
(mol Ethylene/mol EtOH Inlet)
Coded FactorsActual FactorsCoded FactorsActual FactorsCoded FactorsActual Factors
-NS*34NS*4.9NS*2.1
T−6.0 × 10⁵−0.232.1 × 105−3.5 × 10⁻²NS*−1.5 × 10⁻²
C−3.4 × 1082.1−5.1 × 10⁸−0.52NS*−3.2 × 10⁻²
T*C−1.8 × 1061.7 × 10−26.4 × 1052.9 × 10−4−5.9 × 10−21.8 × 10−4
T2−4.0 × 1036.1 × 10−4NS*8.9 × 105NS*3.9 × 105
C2−5.1 × 10⁸−57−7.7 × 10⁸−6.00.14−7.4 × 10⁵
T2*C−8.1 × 10³−5.7 × 105NS*2.2 × 105NS*−2.8 × 10⁻⁷
T*C2−1.8 × 1060.136.4 × 105−2.3 × 10⁻²NS*−4.5 × 10⁻⁷
T3NS*−7.5 × 10⁻⁷NS*−9.7 × 10⁻⁸NS*−4.5 × 10⁻⁸
C3−3.4 × 10840−5.2 × 10827NS*3.3 × 10−6
T2*C2−4.0 × 10³−7.2 × 105NS*4.1 × 10−6NS*1.2 × 10−10
T3*CNS*3.6 × 10⁻⁸NS*−1.8 × 10−8NS*1.6 × 10−10
T*C3−6.1 × 10⁵−3.3 × 10−22.2 × 1051.2 × 10−2NS*2.1 × 10−9
T4NS*3.5 × 10−10NS*3.9 × 10−11NS*1.9 × 10−11
C4−8.6 × 10⁷−14−1.3 × 10⁸−21−0.14−2.2 × 10⁻⁸
ModelQuarticQuartic-Quartic-
F-value42.5547.39-3.2-
Probability F<1 × 10⁻⁴<1 × 10⁻⁴-7 × 10⁻⁴-
Standard deviation0.120.04-0.02-
Mean0.630.13-0.01-
R20.9020.911-0.851-
Adjusted R20.8800.892-0.828-
Predicted R20.8120.864-0.820-
Adequate precision30.7726.01-7.65-
Lack of Fit7274-73-
* Nonsignificant term.
Table 4. Comparison between experimental data and values predicted by RSM-Aspen Plus integration.
Rh Content in Catalyst (wt %) 1T (°C)Yield (mol/mol EtOH Inlet) 2Ethanol Conversion (%)
H2COCH4CO2
ESESESESES
04301.01.20.00.00.00.00.80.83633
0.26302.12.00.70.90.60.40.10.696100
0.45301.00.90.50.50.20.20.70.77172
0.64700.20.30.40.20.20.20.30.76661
0.86102.12.11.41.30.10.10.40.49697
1 SRE over RhPt/CeO2 with different Rh–Pt ratios. Total metal loading (Rh + Pt) = 0.8 wt % in all catalysts. Reaction conditions: S/E = 3, 100 mg catalyst, and GHSV = 70,600 h−1; 2 E = experimental data and S = values predicted by RSM-Aspen Plus integration.

