Article

Co-Production of Ethanol and 1,2-Propanediol via Glycerol Hydrogenolysis Using Ni/Ce–Mg Catalysts: Effects of Catalyst Preparation and Reaction Conditions

1
Department of Biological Engineering, University of Idaho, Moscow, ID 83844, USA
2
Division of Soil & Land Resources, University of Idaho, Moscow, ID 83844, USA
*
Author to whom correspondence should be addressed.
Catalysts 2017, 7(10), 290; https://doi.org/10.3390/catal7100290
Submission received: 17 August 2017 / Revised: 12 September 2017 / Accepted: 25 September 2017 / Published: 29 September 2017
(This article belongs to the Special Issue Enabling Technologies toward Green Catalysis)

Abstract

:
Crude glycerol from biodiesel production is a biobased material capable of co-producing biofuels and chemicals. This study aimed to develop a line of Ni catalysts supported on cerium–magnesium (Ce–Mg) to improve the process efficiency of glycerol hydrogenolysis for ethanol and 1,2-propanediol (1,2-PDO). Results showed that catalytic activity was greatly improved by changing the preparation method from impregnation to deposition precipitation (DP), and by adjusting calcination temperatures. Prepared via DP, the catalysts of 25 wt % Ni supported on Ce–Mg (9:1 mol/mol) greatly improved the effectiveness in glycerol conversion while maintaining the selectivities to ethanol and 1,2-PDO. Calcination at 350 °C provided the catalysts better selectivities of 15.61% to ethanol and 67.93% to 1,2-PDO. Increases in reaction temperature and time improved the conversion of glycerol and the selectivity to ethanol, but reduced the selectivity to 1,2-PDO. A lower initial water content led to a higher conversion of glycerol, but lower selectivities to ethanol and 1,2-PDO. Higher hydrogen application affected the glycerol conversion rate positively, but the selectivities to ethanol and 1,2-PDO negatively. A comparison to the commercial Raney® Ni catalyst showed that the Ni/Ce–Mg catalyst developed in this study showed a better potential for the selective co-production of ethanol and 1,2-PDO from glycerol hydrogenolysis.

1. Introduction

Concerns of long term economic and energy securities, emergence of global warming and climate change have drastically increased the interest globally in utilizing renewable resources to produce fuels and valuable chemicals [1,2,3]. Biodiesel, the renewable alternative of diesel fuel [4], is typically produced from plant oils or animal fats via transesterification with an alcohol, usually methanol, under the aid of a catalyst and appropriate process conditions [4,5,6]. The products are a mixture of fatty acid methyl esters (FAME) or biodiesel, and the byproduct glycerol. Based on the chemical reaction stoichiometry, approximately 10 kg of crude glycerol is produced for 100 kg of oil or fat feedstock.
Biodiesel production has been increased dramatically in the past decade worldwide. For example, biodiesel production in the United States reached 1.568 billion gallons or 5.83 million m3 in 2016 [7], which yielded also approximately 52 million kg of crude glycerol. US EIA has projected that worldwide biodiesel production is to rise to 33 million m3 by 2018 [8], which accounts for approximately 295 million kg of crude glycerol. This byproduct glycerol from biodiesel production led to a huge surplus in glycerol supply, and caused a significant drop in price for both crude and purified glycerol in the past years [7,8,9,10,11]. This development has been seen as an opportunity to utilize glycerol as an inexpensive renewable feedstock for the production of valuable chemicals [12]. Various options are available for the conversion of glycerol into valuable chemicals, which can be achieved through a chemical, biochemical, or thermochemical route [9,10,13].
Depending on the process conditions and catalysts employed in the thermochemical route, glycerol may be converted through pyrolysis, gasification, oxidation, dehydration, or hydrogenolysis [13]. Ethanol, a widely used alternative transportation fuel [14], solvent, raw material in chemical synthesis, and beverage [15], can be produced from glycerol hydrogenolysis or aqueous phase reforming (APR) along with other alcohols, such as 1,3-propanediol (1,3-propylene glycol), 1,2-propanediol (also named 1,2-propylene glycol or 1,2-PDO), propanol, isopropanol, ethylene glycol (EG), and methanol [16,17,18,19,20,21,22,23]. According to the proposed glycerol hydrogenolysis or APR pathway, ethanol may be produced from glycerol with 1,3-propanediol, ethylene glycol, or 1,2-PDO as the intermediates [18,21,22,23]. Only a few studies have reported satisfactory yields of ethanol from glycerol hydrogenolysis or APR using heterogeneous catalysts [17,18,19,20,21,22,23]. However, ethanol yield does not go beyond 40% [18,19,20,21,22,23] with the conditions for optimal ethanol selectivity/yield leading to further hydrogenolysis, generation of degradation/undesired products, decreased overall selectivity towards valuable chemicals, and decreased overall product value [18,19,20,21,22,23].
The co-production of ethanol at sub-optimal selectivity/yield with valuable chemicals, such as 1,2-PDO and EG, presents an interesting alternative as compared to production of ethanol at optimal selectivity/yield. This approach allows optimal utilization of glycerol for the production of valuable hydrogenolysis products, improving atom economy [24] and overall profitability [25] for production of ethanol from glycerol hydrogenolysis. In a previous study, we reported a novel catalyst for the selective co-production of ethanol and 1,2-PDO from glycerol hydrogenolysis using a nickel (Ni) catalyst supported on cerium–magnesium (Ce–Mg) at a 9:1 Ce–Mg molar ratio. Ethanol and 1,2-PDO were co-produced with selectivities of 15.28% and 62.14%, respectively, at a glycerol conversion of 28.63% [20].
Aside from the effect of catalyst composition, the choice of catalyst preparation method, i.e., impregnation (IM), to the deposition precipitation (DP) method, also affects the catalyst activity [26]. Meanwhile, the operating conditions in catalyst applications also potentially affect catalyst activity, as observed previously [20]. The objective of this study was to develop and characterize a line of specialty Ni catalysts supported on Ce–Mg, targeting at the enhanced co-production of ethanol and 1,2-PDO from glycerol through hydrogenolysis. The effects of preparation method (impregnation vs. deposition precipitation) and calcination temperature were studied. The effects of operating parameters in catalyst applications, including reaction temperature, initial water content, hydrogen application rate, and reaction time, on catalyst activity, in terms of the conversion of glycerol and the selectivities to ethanol and 1,2-PDO, are also reported.

2. Results and Discussion

2.1. Catalyst Characterization

2.1.1. Textural Properties

To determine the effects of preparation method and calcination temperature on the textural properties of Ni/Ce–Mg catalysts, Brunauer-Emmett-Teller (BET)-surface area and pore volume were determined by a N2 adsorption–desorption experiment (Table 1). Higher specific surface area (BET Surface) and pore volume, but lower pore diameters, were achieved when the catalysts were prepared by DP as compared to IM. Raising the calcination temperature from 350 °C to 550 °C resulted in a decline of both specific surface area and pore volume, and an increase in pore diameter. These properties remained approximately the same with a calcination temperature increase to 650 °C. These observations are in agreement with others using supported Ni catalysts [27,28] and a DP-prepared zirconia-supported Cu catalyst [26].

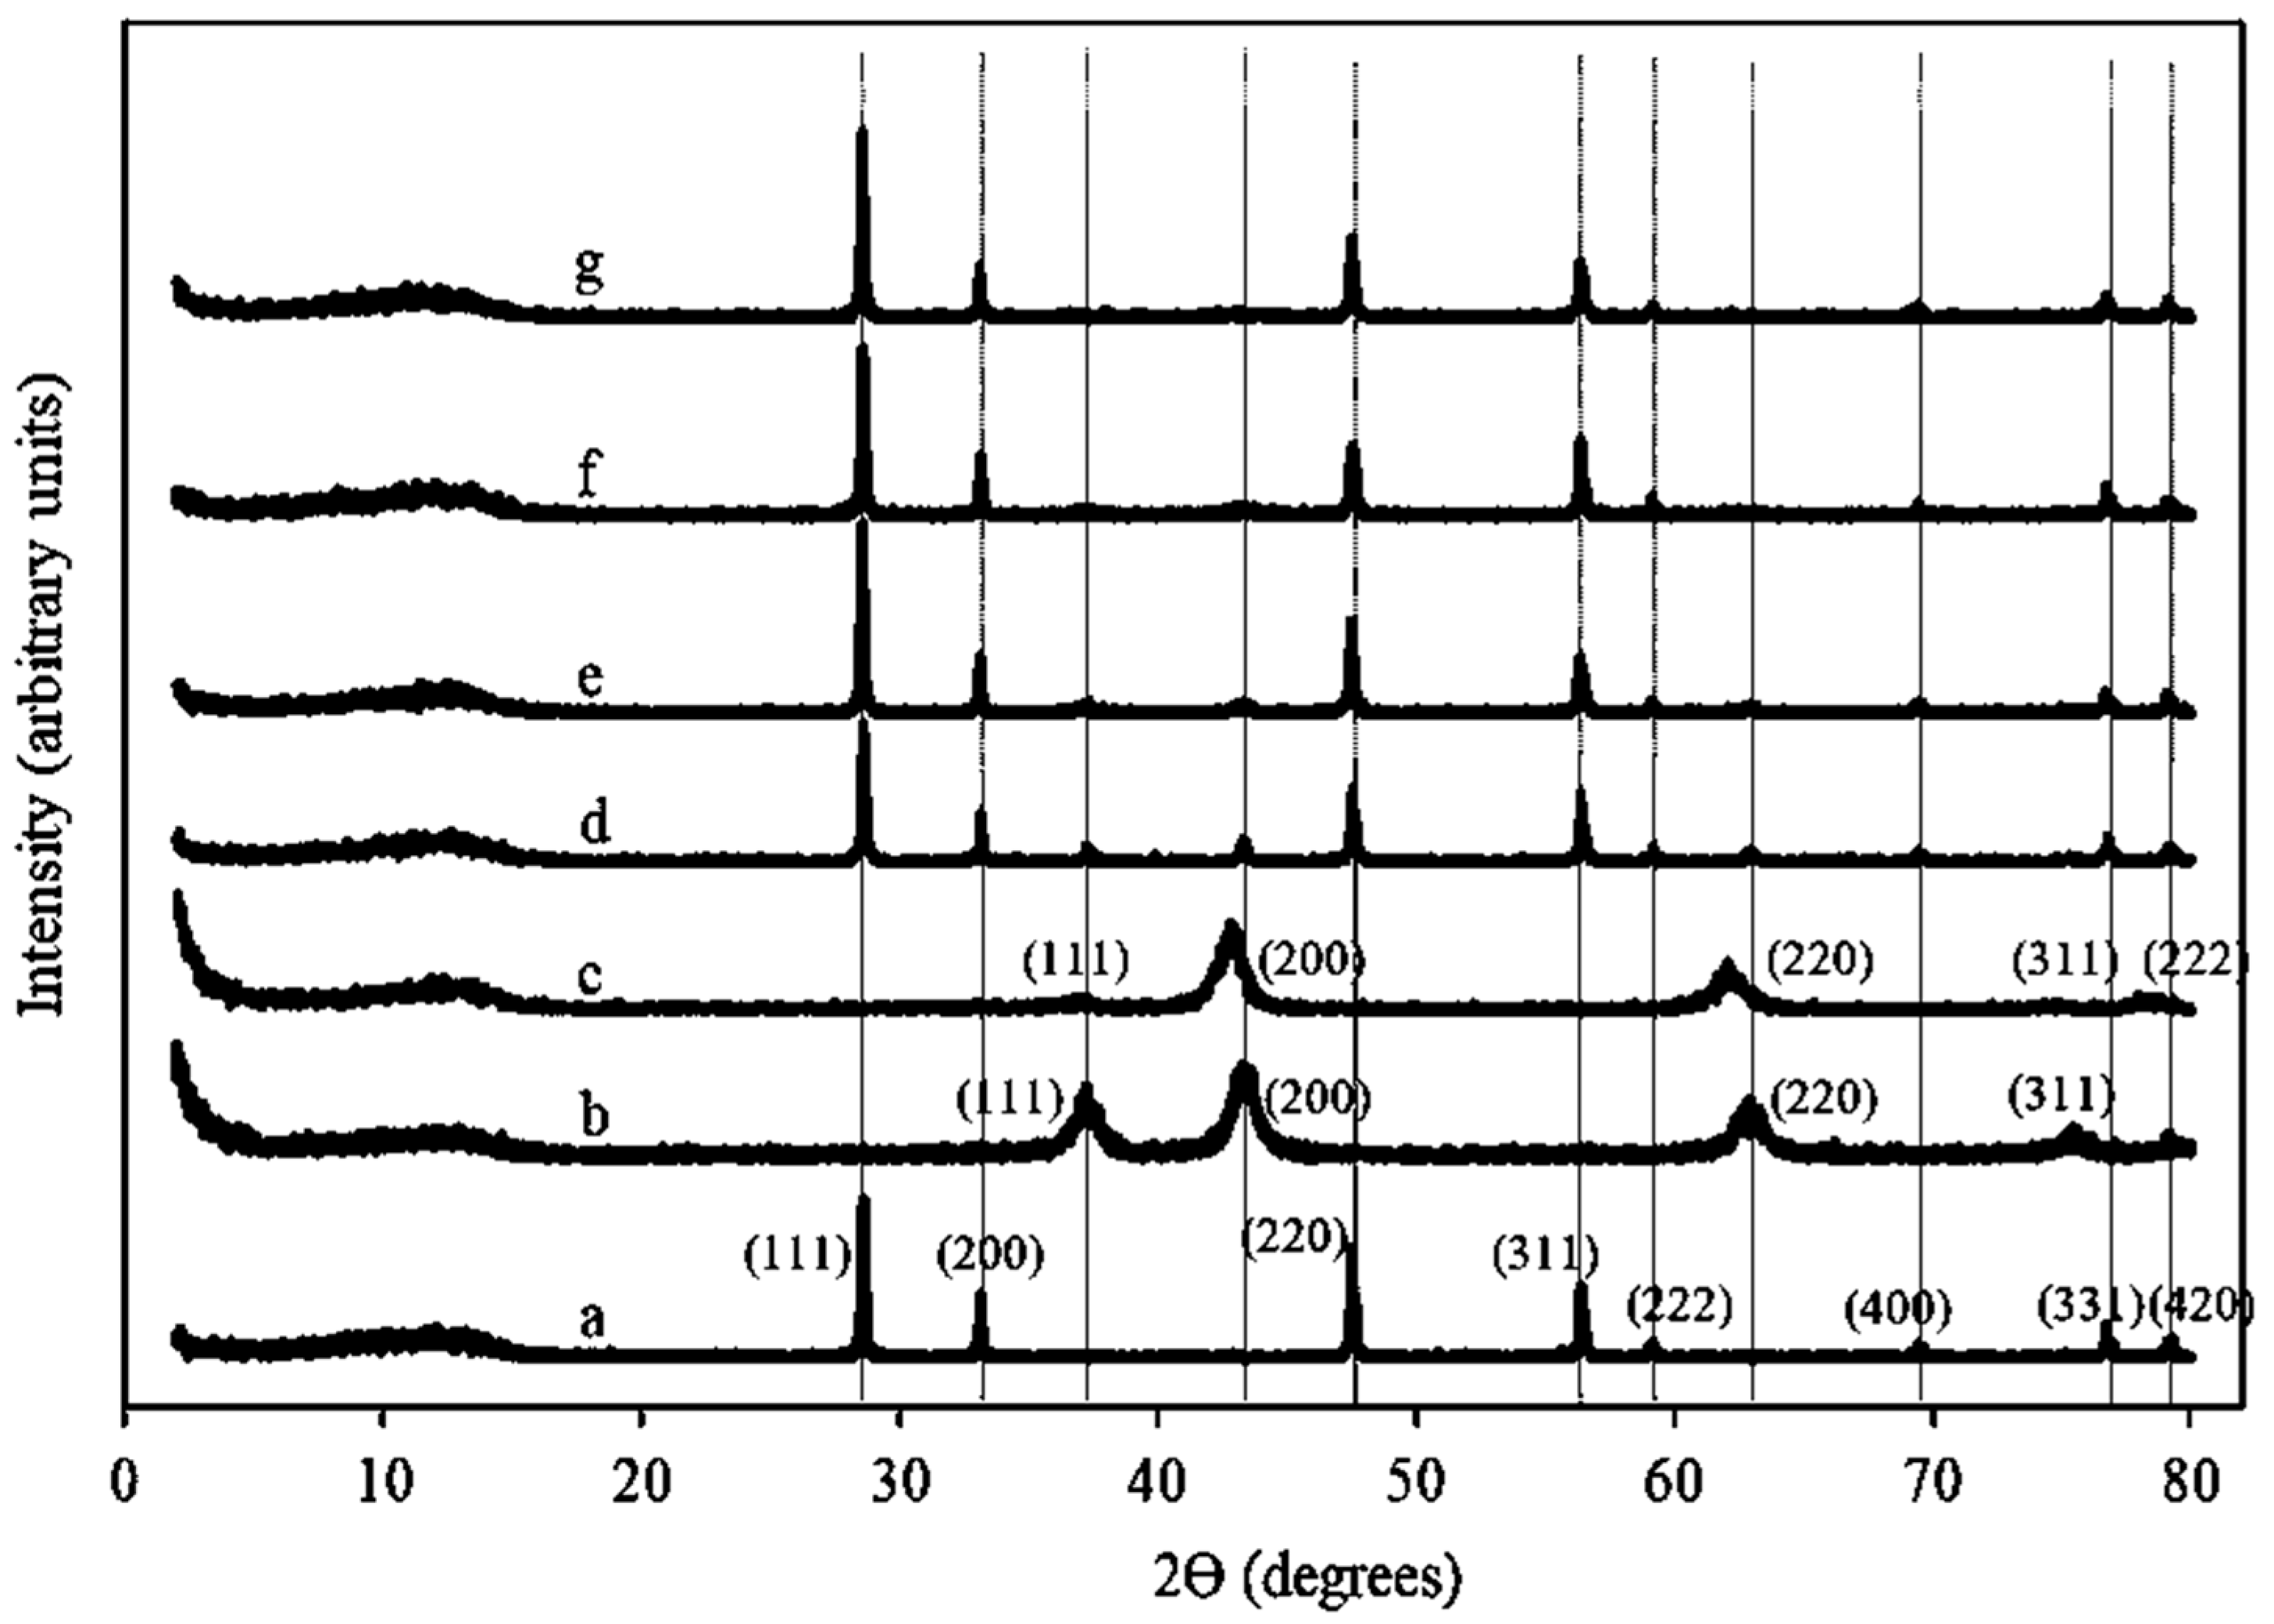
2.1.2. XRD Patterns of Ni/Ce–Mg Catalysts

To evaluate the effects of preparation method and calcination temperature on catalyst structure, X-ray diffraction (XRD) patterns were obtained from the activated/reduced Ni catalysts on Ce–Mg (9:1 mol/mol) prepared by IM and calcined at 550 °C, and by DP with calcination at 350 °C, 550 °C, and 650 °C. Figure 1 shows the characteristic XRD patterns of CeO2 (a), NiO (b), MgO (c), 25 wt % Ni/Ce–Mg 9:1 prepared by IM and calcined at 550 °C (d), 25 wt % Ni/Ce–Mg 9:1 prepared by DP and calcined at 650 °C (e), 25 wt % Ni/Ce–Mg 9:1 prepared by DP and calcined at 550 °C (f), and 25 wt % Ni/Ce–Mg 9:1 prepared by DP and calcined at 350 °C (g). The peaks at 28.54–29.06°, 33.06–33.16°, 47.46–47.58°, 56.36–56.42°, 59.08–59.26°, 69.14–69.66°, 76.66–76.88°, and 79.12–79.28° observed for the XRD pattern in Figure 1a,d–g on the 2ϴ scale are attributed to (111), (200), (220), (311), (222), (400), (331), and (420) planes of the cubic CeO2 phase with a fluorite structure (JCPDS card No. 34-0394) [29,30], 37.08–37.80°, 43.26–43.34°, 62.90–63.20°, and 75.40–75.62° observed for the XRD pattern of Figure 1b,d–g on the 2ϴ scale correspond to (111), (200), (220), and (311) planes of the face-centered cubic phase of NiO (JCPDS card No. 47-1049) [31], and 36.80°, 42.66°, 62.22°, 74.66°, and 78.46° observed for the XRD pattern of Figure 1c on the 2ϴ scale correspond to (111), (200), (220), (311), and (222) planes of the face-centered cubic phase of MgO (JCPDS card No. 89-7746) [32,33].
The XRD patterns observed from the catalysts reveal the preservation of the CeO2-support crystal structure [29,30,34,35]. The intensity of the peaks relating to NiO decreased or was not observed in the XRD patterns (Figure 1d–g) with the change of preparation method from IM to DP. This result suggests that NiO, possibly in an amorphous form, is highly dispersed in the catalysts by DP as compared to that by IM [36,37]. A slight shift in peak positions relative to the peaks associated with pure CeO2 was also observed for each catalyst. The shift increased with the change from IM to DP, and decreased with the increase of calcination temperature. This behaviour is likely caused by the formation of a solid solution of NiO–CeO2, MgO–CeO2, or NiO–MgO–CeO2 [36,37].

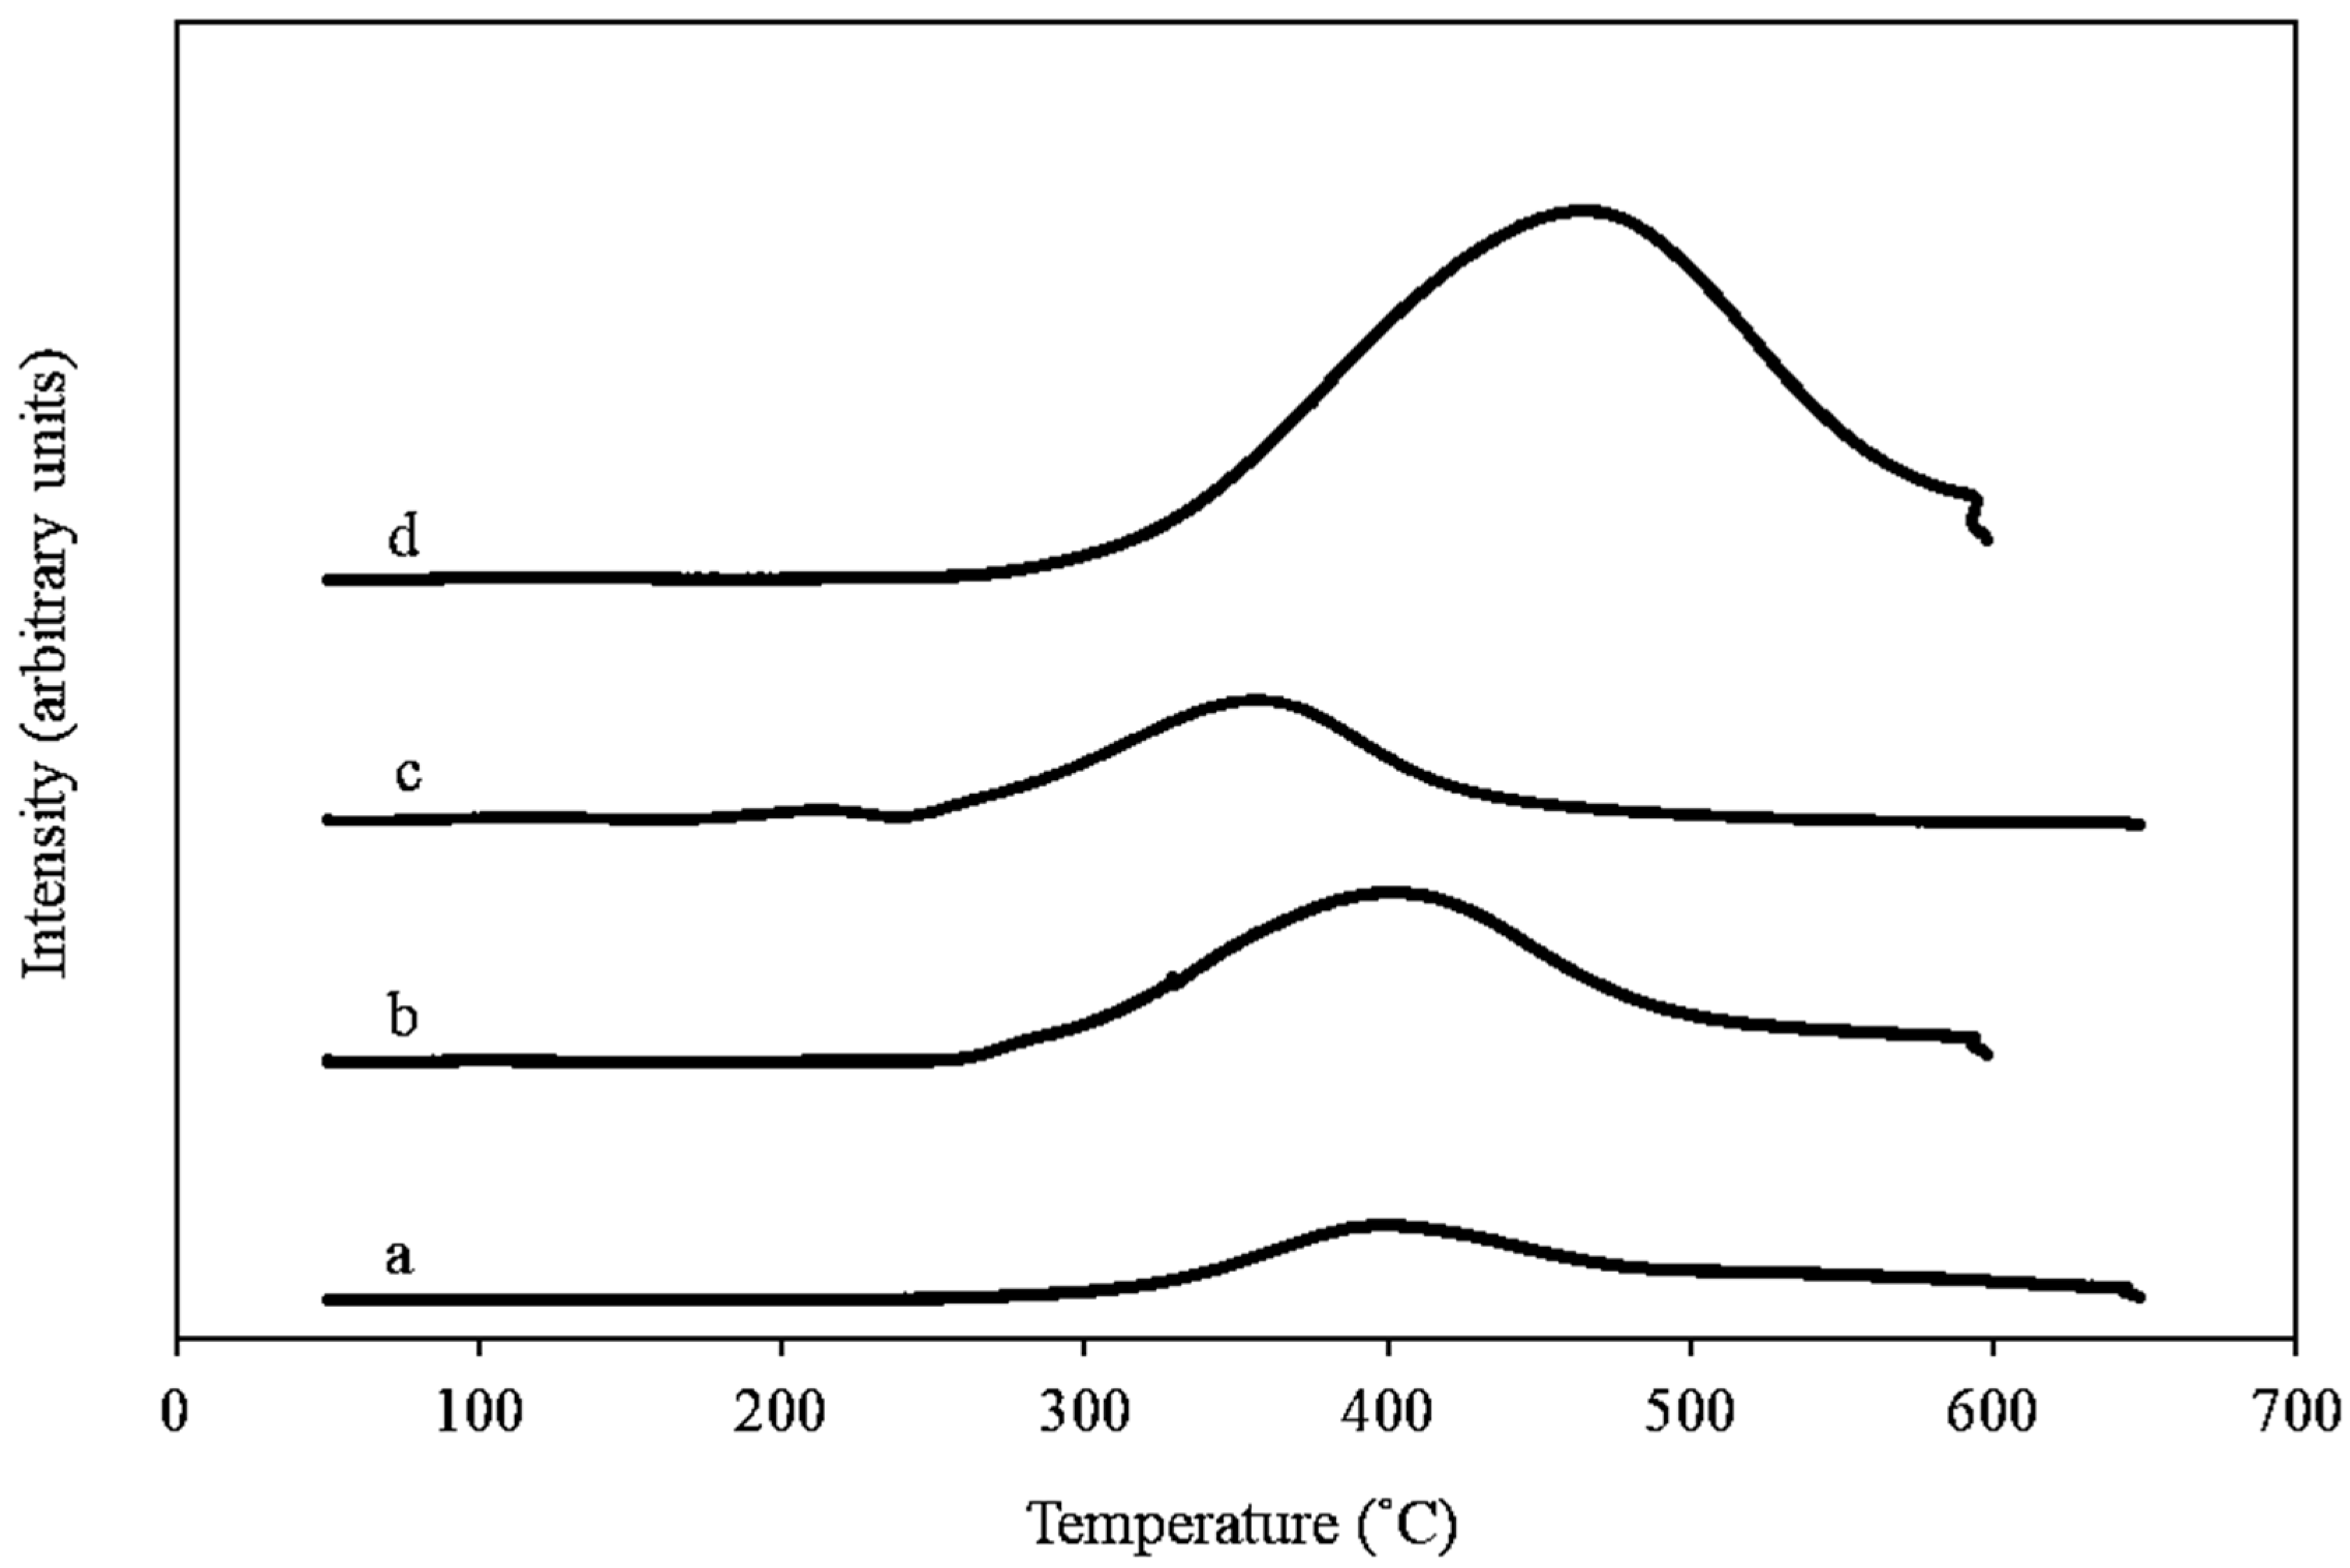
2.1.3. Temperature Programmed Reduction (H2-TPR)

The reducibility, or change in oxidation state, of the NiO species and metal–support interaction was studied through H2-TPR experiments (Figure 2) [38]. The catalysts were the ones of 25 wt % Ni/Ce–Mg (9:1 mol/mol) prepared by IM and DP and calcined at 350 °C, 550 °C, and 650 °C. The major peaks observed were at 400 °C for the catalyst prepared by IM and calcined at 550 °C, and at 400 °C, 357 °C, and 465 °C, for the DP-prepared catalysts calcined at 550 °C, 350 °C, and 650 °C, respectively. These peaks are likely from the reduction of bulk NiO, while the different peak temperatures are attributed to the interaction strength between NiO and CeO2 support [38,39,40]. The change in preparation method did not alter the peak temperature positions noticeably, suggesting that there was no change in the interaction between the active metal and the support. Raising the calcination temperature on the DP-prepared catalysts shifted the major peaks to higher temperatures, suggesting that the alterations of support properties and strengthening of the Ni–support interaction occurred [38,39,40], as observed in Ni catalysts by others [27,28]. A distinct minor peak in the vicinity of 213 °C was observed with the catalyst prepared by DP and calcined at 350 °C, which could be from the reduction of NiO, which had no or minimal interaction with the support [27].

2.2. Effect of Preparation Method

The catalyst of 25 wt % Ni/Ce–Mg (9:1 mol/mol) by DP provided a higher glycerol conversion at 45.71%, as compared to 28.63%, for the IM-prepared catalyst (Table 2). The improvement in glycerol conversion was likely caused by better dispersion of Ni and Mg onto CeO2, as suggested by the XRD results. The observed increase in surface area and pore volume (Table 1) may also have contributed to improved glycerol conversion. The increases in surface area and pore volume would allow better accessibility for reacting species, given the same amount of catalyst used, which could result in a higher glycerol conversion rate [41]. The selectivities toward 1,2-PDO, ethanol, ethylene glycol (EG), and n-propanol were not altered by the preparation method. Similarly, the peak temperature positions in the H2-TPR results (Figure 2) were not altered by the choice of preparation method. The H2-TPR results suggest that there is no change in the interaction between the active metal and the support, and between the preparation methods of IM and DP. This explains why there was no difference in product selectivity by the catalysts prepared via IM or DP.

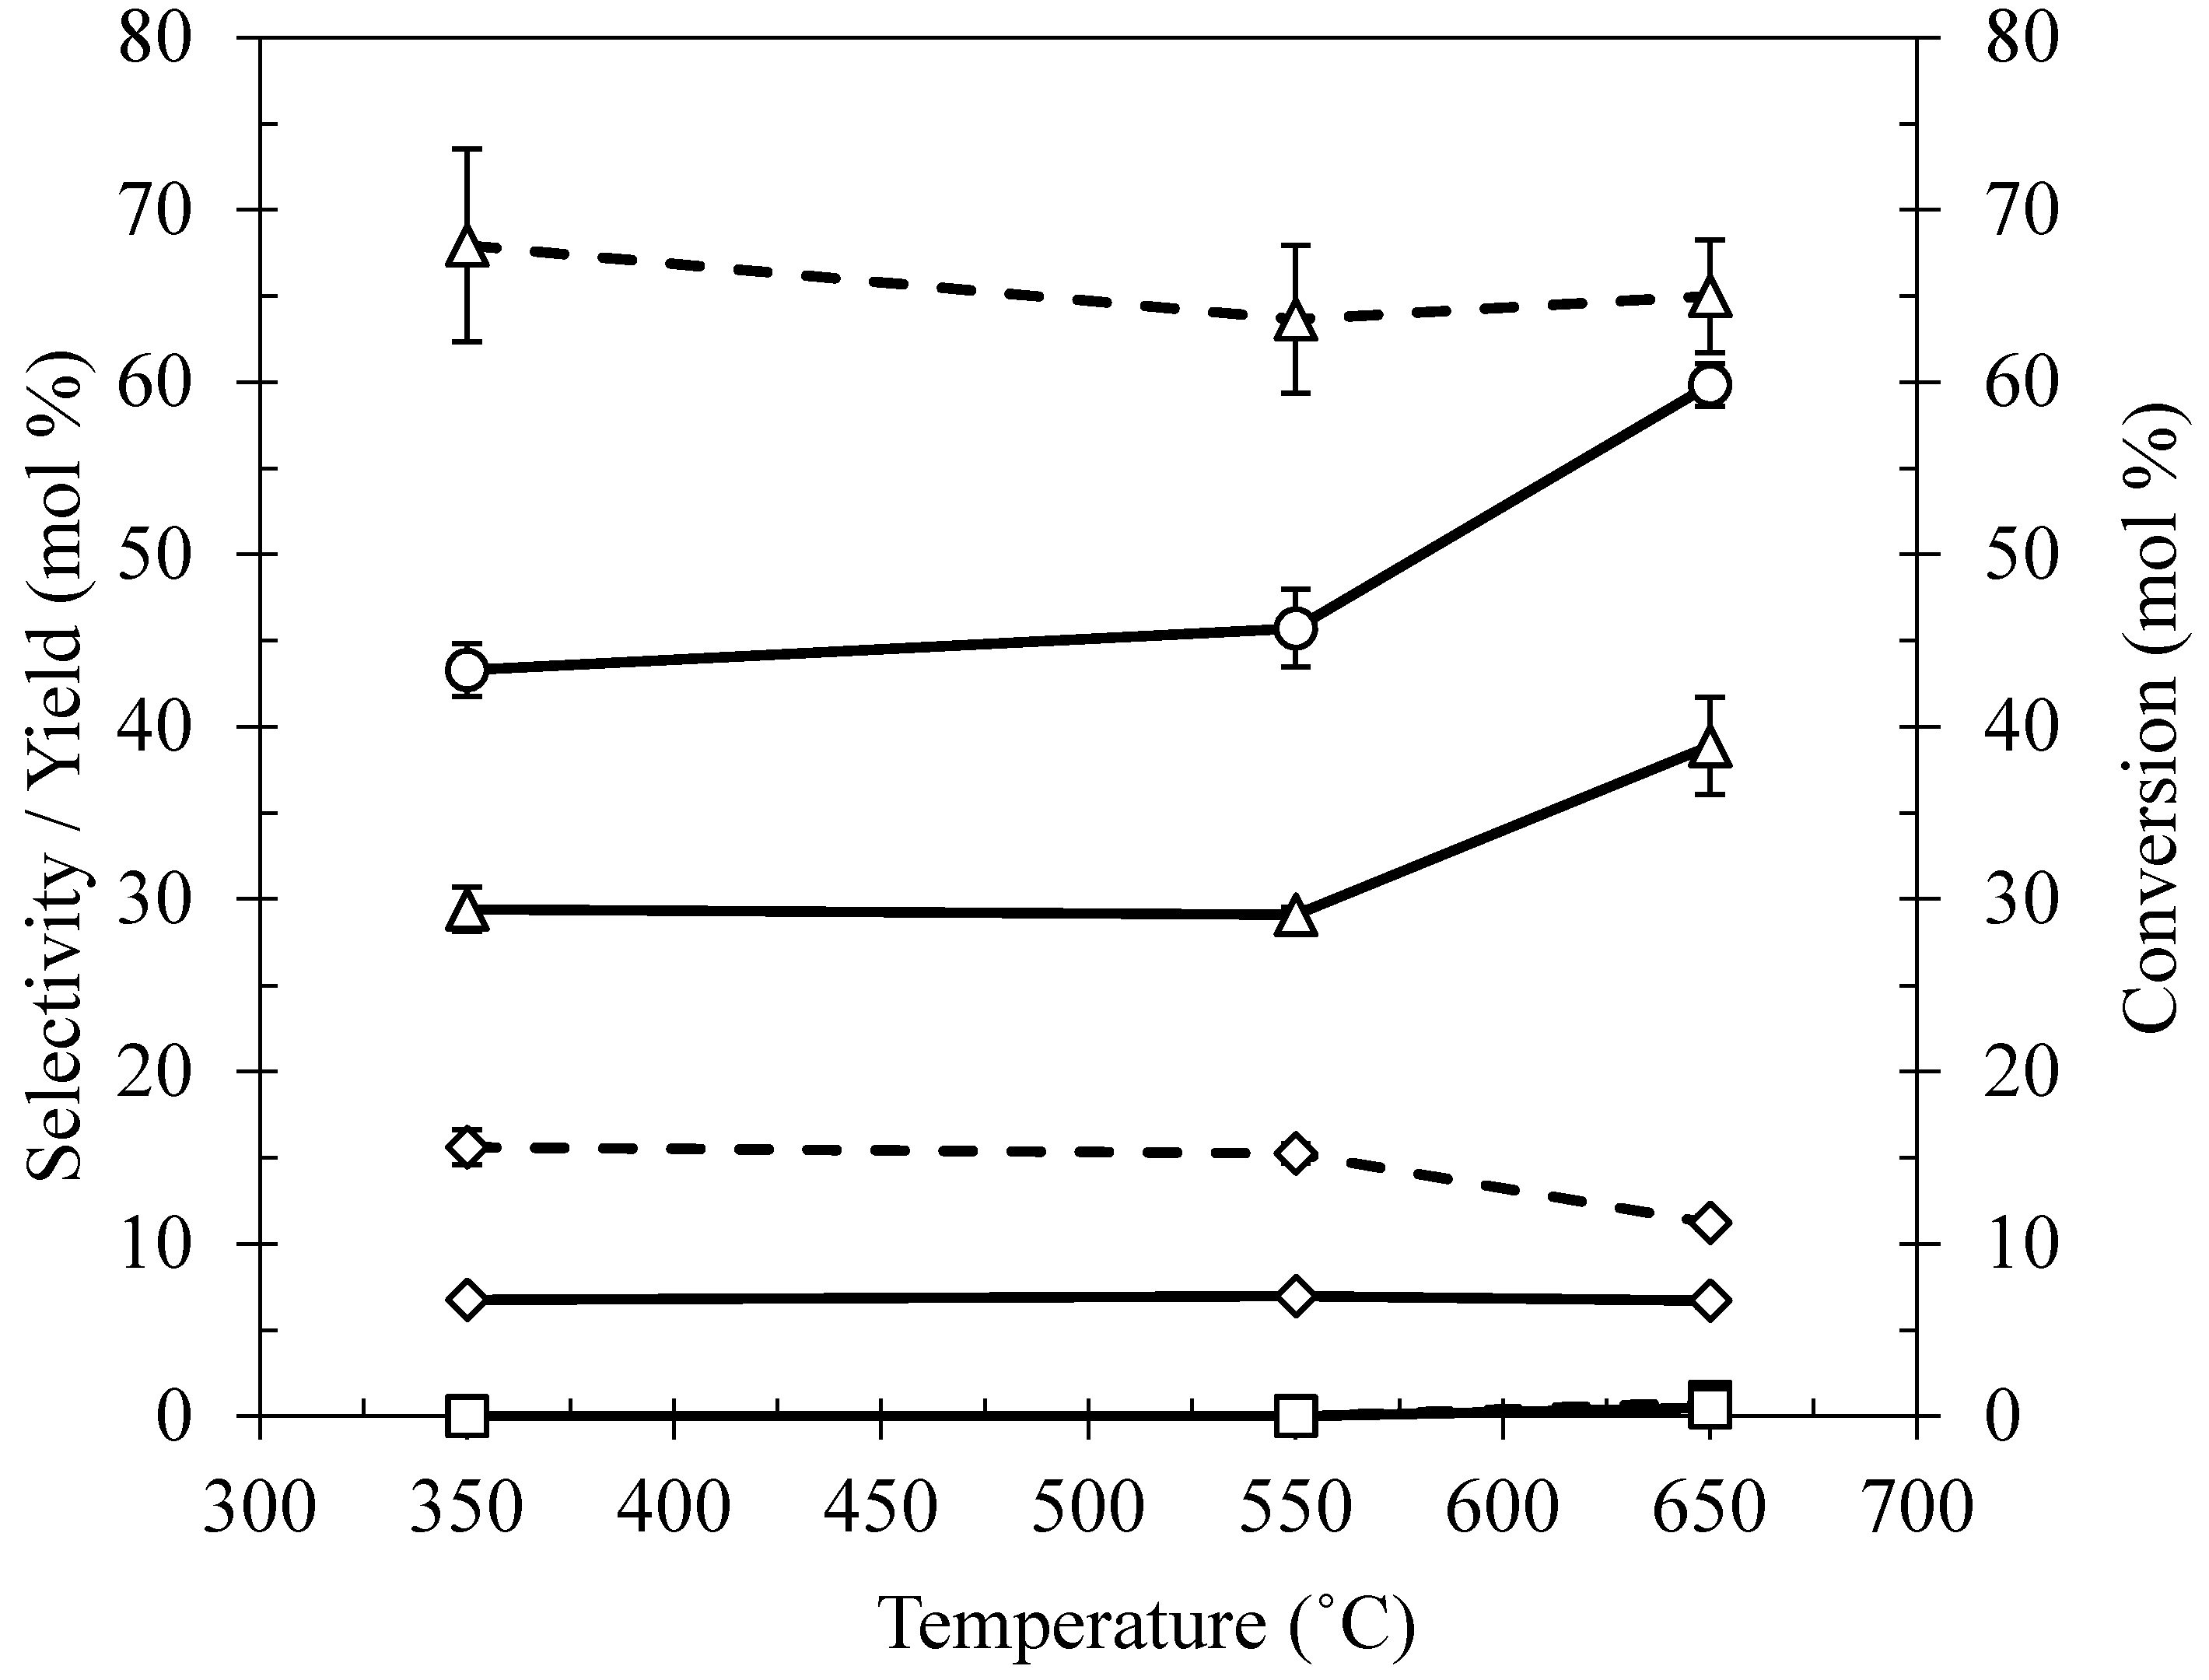
2.3. Effect of Calcination Temperature on Ni/Ce–Mg Catalysts Prepared by DP

Comparable glycerol conversions of 43.29% and 45.71% were observed with the catalysts calcined at 350 °C and 550 °C, respectively (Figure 3). Further increasing calcination temperature to 650 °C resulted in a noticeable increase in glycerol conversion to 59.83%. The selectivity to 1,2-PDO was 67.93% for the catalyst calcined at 350 °C, with a decreasing trend for selectivities at higher temperatures. Selectivity to ethanol was virtually unchanged, at 15.61% and 15.26%, respectively, as the calcination temperature increased from 350 °C to 550 °C, but declined to 11.22% with the temperature increase to 650 °C. No n-propanol was detected with the catalysts calcined at 350 °C and 550 °C, but was observed at a selectivity of 0.83% with the catalyst calcined at 650 °C. In terms of selectivity, the catalyst calcined at 350 °C gave the highest overall preference towards ethanol, 1,2-PDO, and ethylene glycol (EG), and thereafter, was used to further study the effects of process conditions.
The differences in activity and selectivity of the catalysts prepared by DP is likely caused by differences in their physical and structural characteristics [27]. Although the catalyst calcined at 350 °C has a higher surface area and a high pore volume, the interaction of Ni with the support is much weaker than that of the catalysts calcined at 550 °C and 650 °C. This combination may have contributed to the improved overall selectivity towards the desired products, with its activity being similar to the catalyst calcined at 550 °C. Catalysts calcined at 550 °C and 650 °C have similar physical properties, but the interaction of Ni and the support is greater for the latter. A stronger metal–support interaction has been shown to improve the metal dispersion and to increase the surface area of Ni catalysts by avoiding agglomeration [27]. In turn, the improved dispersion and increased surface area of Ni catalysts may have contributed to the observed increase in glycerol conversion. Catalyst calcination at different temperatures may have altered support properties as indicated by the shifts of reduction peaks (Figure 2) and the slight shifts in XRD peaks (Figure 1), which may lead to slight differences in product selectivities.
Legend: solid lines for glycerol conversion and product yields, dashed lines for product selectivity, (○) glycerol conversion, (◇) ethanol, (□) n-propanol, (Δ) 1,2-PDO. Error bars are based on the average values of duplicate experimental data.

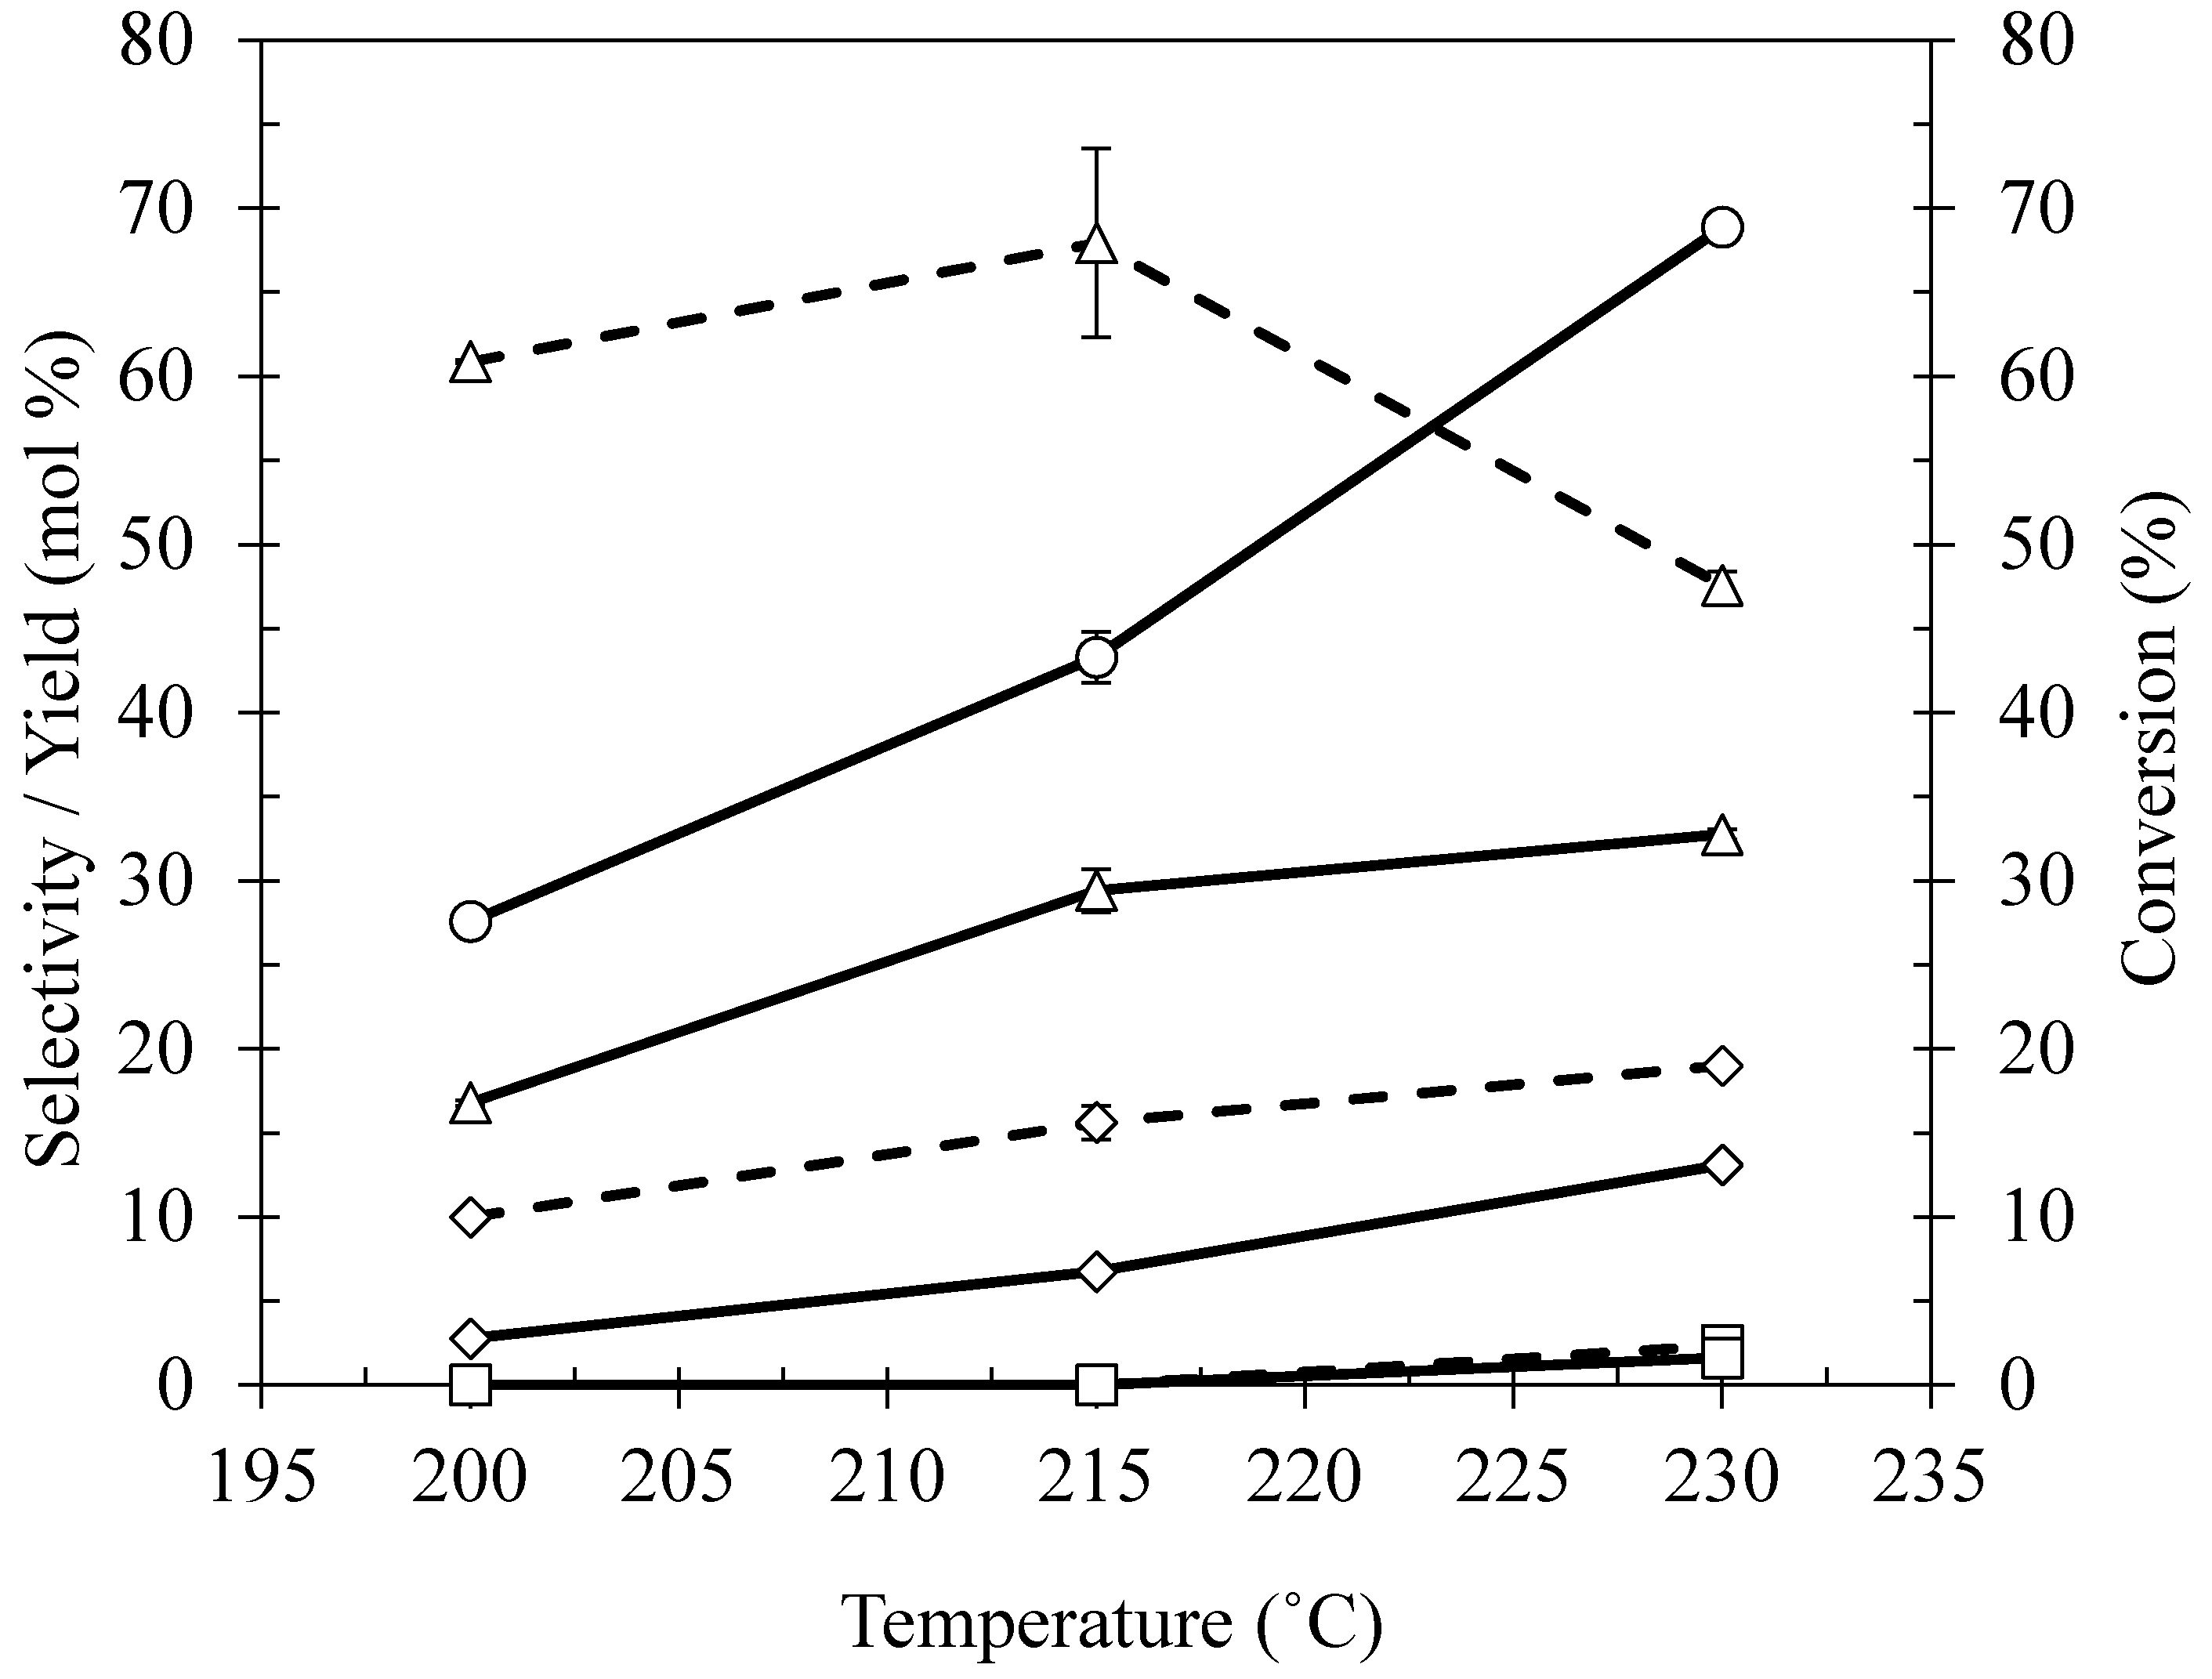
2.4. Effect of Reaction Temperature

Glycerol conversion increased from 27.57%, 43.29%, and to 68.87%, when temperature was raised from 200 °C, 215 °C, and to 230 °C, respectively (Figure 4). The selectivity to 1,2-PDO was maintained in the range of 60–68% with the increase of operating temperature from 200 °C to 215 °C, but declined to 47.57% at 230 °C. The selectivity to ethanol increased from 9.99%, 15.61%, and to 19.02%, at 200 °C, 215 °C, and 230 °C, respectively. The quantity of n-propanol was only detectable at 230 °C with a low selectivity of 2.36%.
Legend: solid lines for glycerol conversion and product yields, dashed lines for product selectivity, (○) glycerol conversion, (◇) ethanol, (□) n-propanol, (Δ) 1,2-PDO. Error bars are based on the average values of duplicate experimental data.
The increase in glycerol conversion with temperature may have resulted from the enhanced energy intensity at higher temperatures for the reactions to occur, especially the dehydration reaction in glycerol hydrogenolysis. Better selectivity to 1,2-PDO at 200–215 °C was potentially caused by the balance between dehydration and hydrogenation reactions, since dehydration is favored at higher temperatures and hydrogenation at lower temperatures [42]. The decline in 1,2-PDO selectivity at 230 °C may have been caused by its further hydrogenolysis, which is evidenced by the higher ethanol and n-propanol contents in the system [18,19,20,21,22,23]. Similar trends were observed when using the Ni catalysts on SiO2 or Al2O3 for glycerol hydrogenolysis [18]. Although a higher selectivity to ethanol was observed at 230 °C, glycerol hydrogenolysis at 215 °C has better potential for ethanol production, due to the fact that it has much higher selectivity towards 1,2-PDO, and a much lower selectivity towards n-propanol, and thus, a better overall efficiency in the conversion of glycerol to desirable hydrogenolysis products.

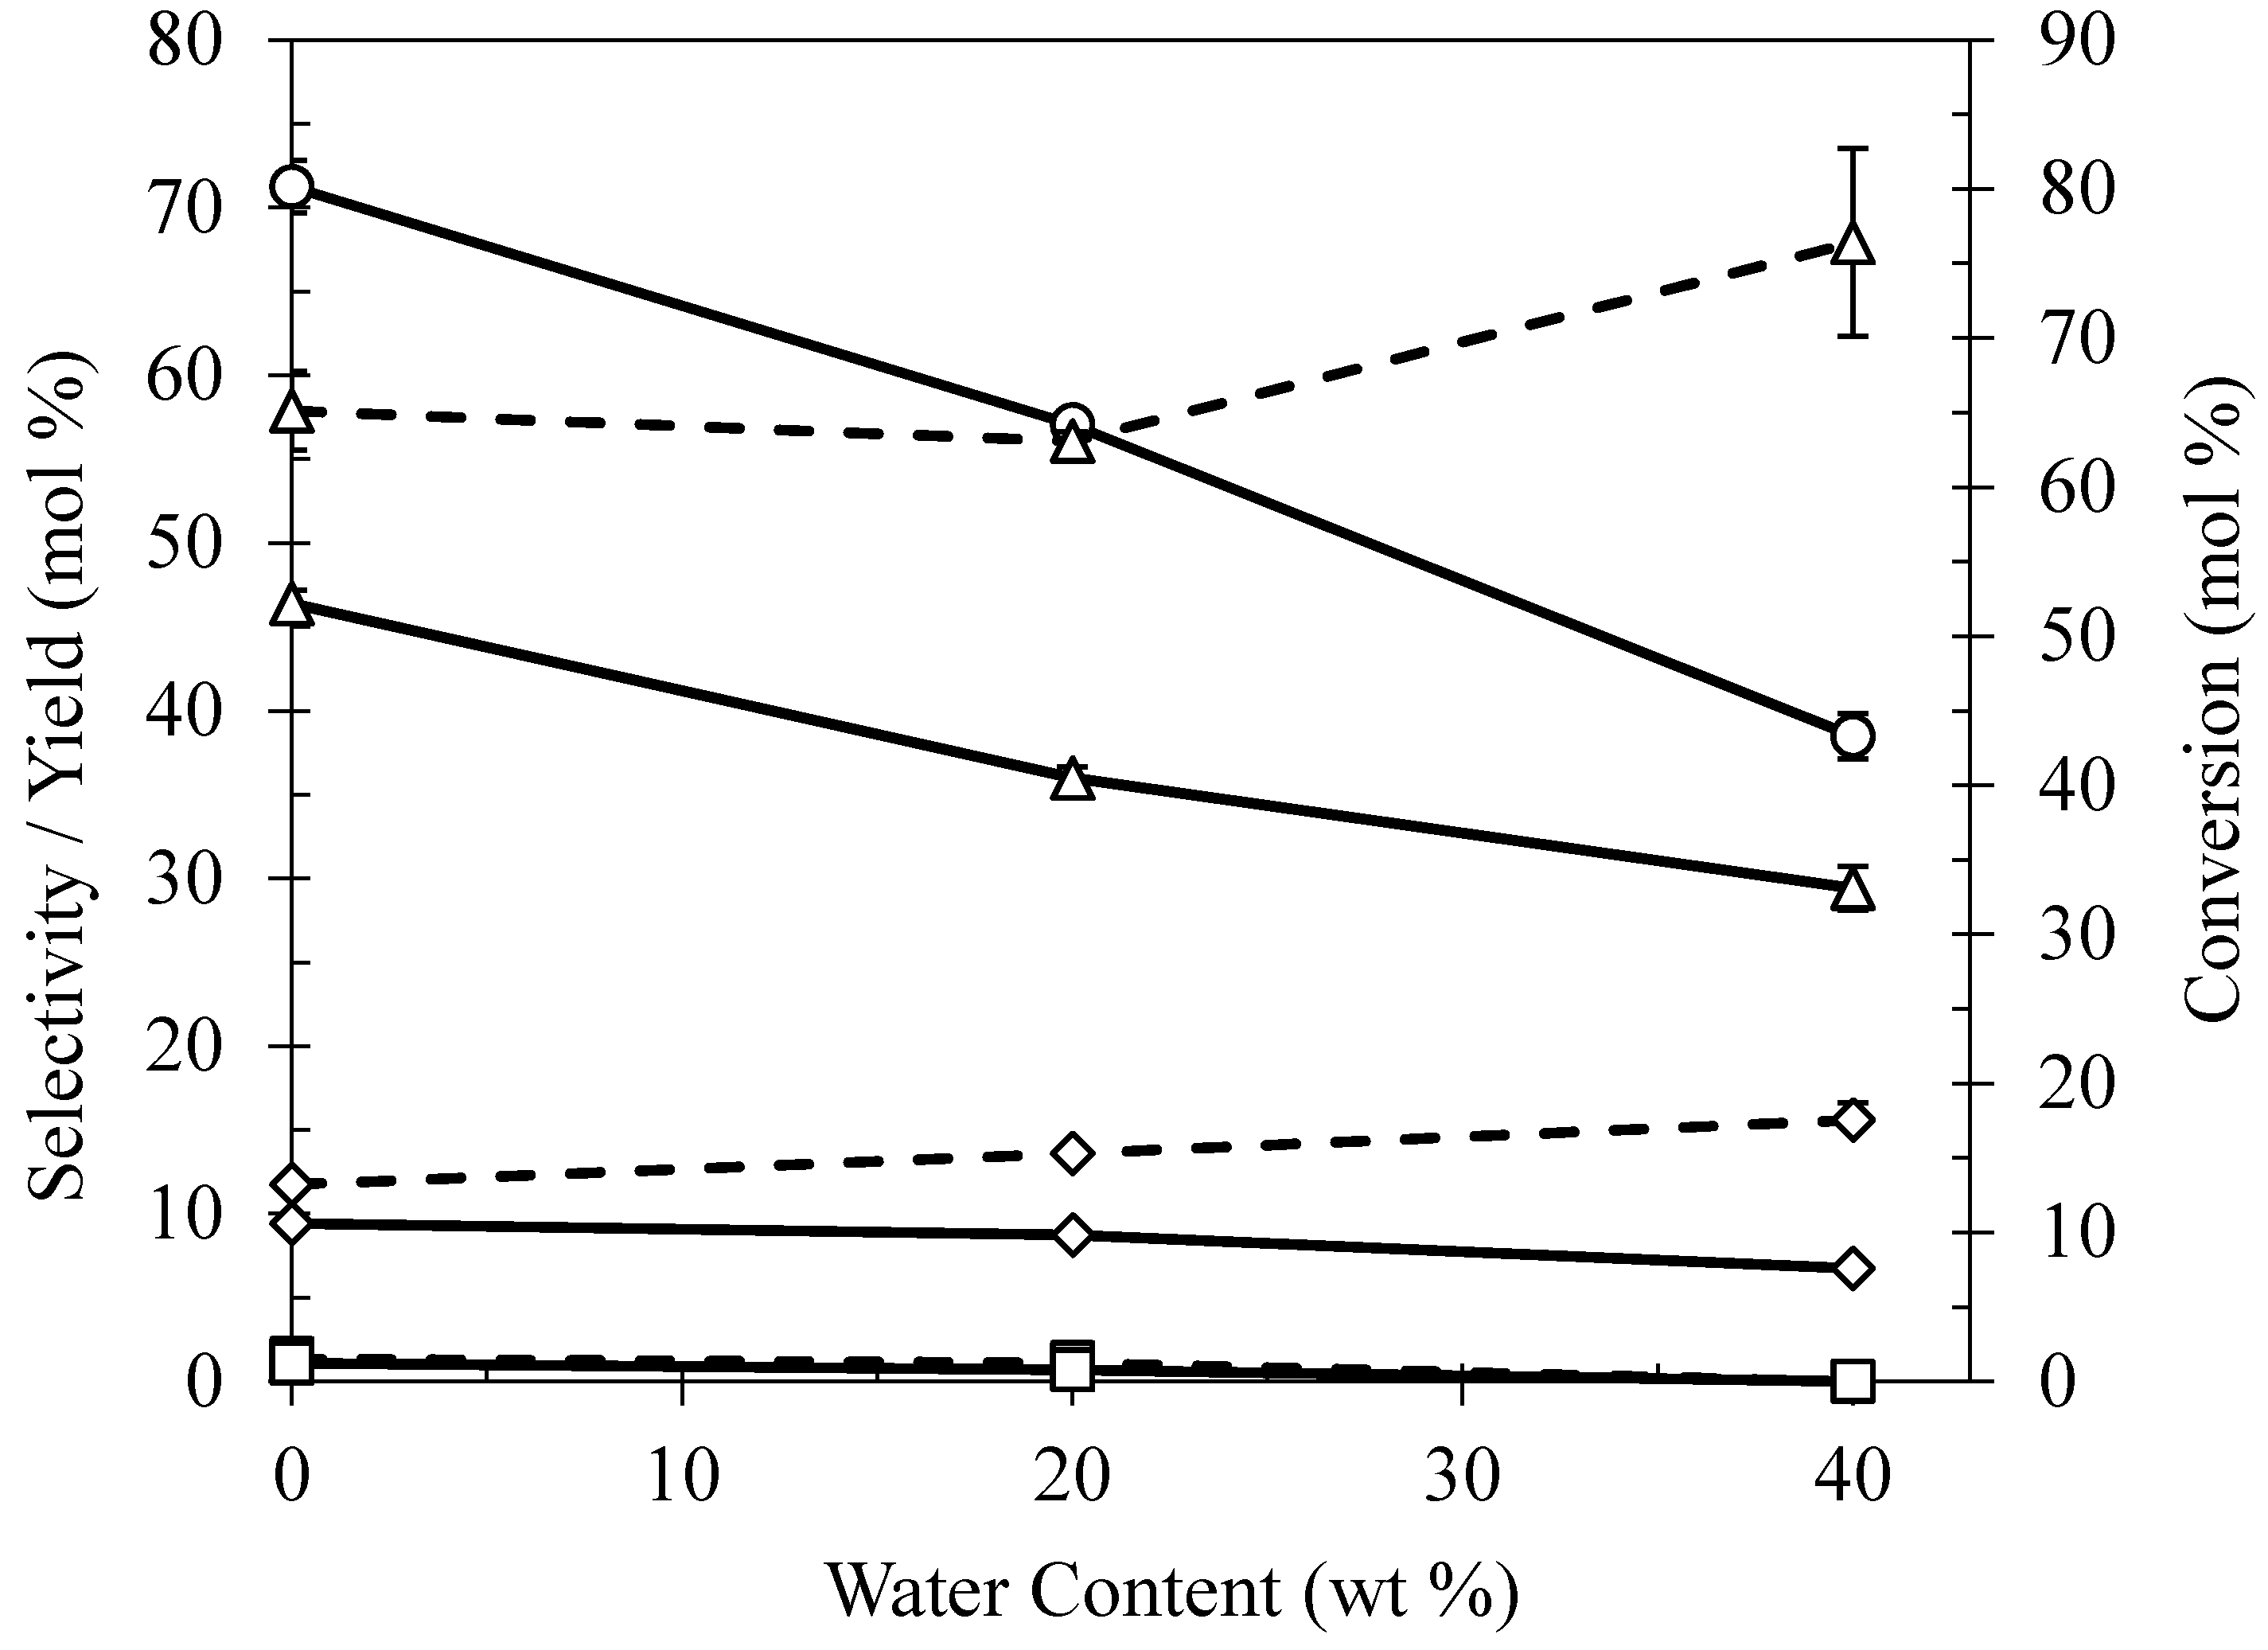
2.5. Effect of Water Content

Water is typically present as an impurity in crude glycerol, with its quantity depending on the biodiesel production process employed [43]. In addition, glycerol is known to be hygroscopic in nature, and likely contains water in some amount [12]. As reported in our previous study, water plays a beneficial role in thermochemical conversion of glycerol to value-added products [44]. Therefore, water was included in the reaction system in this study. The effect of water content on the catalytic activity of 25 wt % Ni/Ce–Mg (9:1 mol/mol) catalysts prepared by DP, was investigated by varying the water content from 0 to 40 wt % (Figure 5).
Glycerol conversion declined from 80.14%, 64.18%, and to 43.29% upon an increase in water content from 0, 20, and to 40 wt %, respectively. The selectivity of 1,2-PDO was maintained at the level of 56–58%, with a water content in the range of 0–20 wt %, then improved to 67.93% when the water content was increased to 40 wt %. The selectivity to ethanol improved from 11.76%, 13.61%, and to 15.61%, with an increase in water content from 0 wt %, 20 wt %, and to 40 wt % in the initial reaction mixture, respectively. Meanwhile, the selectivity to n-propanol production was low. It was 1.37%, 1.10%, and 0%, with initial water contents of 0 wt %, 20 wt %, and 40 wt %, respectively, in the reaction mixture.
The decline in glycerol conversion with the increase in water content may be due to the dilution effect of water as a solvent and its inhibition to hydrogenolysis. Since water is a by-product in the hydrogenolysis of glycerol, its presence favors the reverse reaction of dehydration, thereby inhibiting hydrogenolysis [45,46]. At a lower water content, 1,2-PDO and ethanol selectivities declined, which may have resulted from the degradation or polymerization of these products [47,48,49]. The decrease in ethanol selectivity may also be caused by an increase in n-propanol production at lower water contents, which competes with the subsequent ethanol production. The production of n-propanol from glycerol requires the dehydration of two water molecules. The presence of excess water did not favor such a reaction, as observed by the decrease in selectivity to n-propanol as water content increased.
Legend: solid lines for glycerol conversion and product yields, dashed lines for product selectivity, (○) glycerol conversion, (◇) ethanol, (□) n-propanol, (Δ) 1,2-PDO. Error bars are based on the average values of duplicate experimental data.

2.6. Effect of Initial Hydrogen Pressure

Increasing the initial H2 pressure in the system improved, slightly, the conversion of glycerol and the selectivity of n-propanol, but caused reductions in selectivities of 1,2-PDO and ethanol (Table 3). Because hydrogen is a reactant in hydrogenolysis, increasing the initial hydrogen pressure in the enclosed batch process increased the initial amount of hydrogen available. The presence of excess hydrogen may favour hydrogenolysis with a preference for glycerol utilization and n-propanol production. The increase in glycerol utilization and n-propanol production, however, may inhibit or reduce ethanol production. The decline in 1,2-PDO selectivity may have resulted from the increase in n-propanol and ethylene glycol (EG) production [18].

2.7. Effect of Reaction Time

It was proposed that the formation of ethanol in the hydrogenolysis is from the conversion of intermediates such as 1,2-PDO [44]. To verify this, experiments were conducted to investigate whether ethanol yield could be improved by extending the reaction time. Results showed that glycerol conversion and ethanol selectivity are both improved as the reaction time was extended from 24 h to 48 h. Meanwhile, 1,2-PDO selectivity declined, which was assumed to be the result of further hydrogenolysis, as evidenced by the increase in ethanol and n-propanol selectivities. These results are in agreement with previous studies, in which 1,2-PDO is considered a precursor for ethanol and propanol production [17,18,19,20,21,22,23,44].

2.8. Comparison with Raney® Ni Catalyst

The catalytic activity of the 25 wt % Ni/Ce–Mg (9:1 mol/mol) catalyst prepared by DP and calcined at 350 °C was compared to a commercial Raney® Ni (Ni ≥ 89%; 6–9% Al) catalyst (Table 4), which is known to catalyze selectively for glycerol hydrogenolysis to 1,2-PDO and ethanol [17,44]. The conditions were chosen to get similar glycerol conversions and allow direct comparison on the catalyst performance. Similar glycerol conversions were achieved when 5 g of catalyst was reacted for 6 h, as compared to 10 g of the 25 wt % Ni/Ce–Mg (9:1 mol/mol) catalyst reacted for 24 h, which showed Raney® Ni’s superior activity in terms of rate of conversion [44]. However, it was observed that the catalyst developed in this study led to higher 1,2-PDO, ethanol, and overall selectivity towards desired hydrogenolysis products at all temperatures tested. The results suggest that the catalyst developed in this study has good potential for the selective co-production of ethanol and 1,2-PDO from glycerol hydrogenolysis.

3. Experimental Section

3.1. Materials

The precursor chemicals used for catalyst preparation included Ni(NO3)2·6H2O (98%) from Alfa Aesar (Ward Hill, MA, USA), Mg(NO3)2·6H2O from Ward’s Science (Rochester, NY, USA), and CeO2 from Acros Organics (NJ, USA). The precipitating agent in catalyst preparation was Na2CO3. De-ionized (DI) water was used in the preparation of catalysts and the aqueous reactant mixture with glycerol in catalyst evaluation. Glycerol (>99.5%) for catalyst evaluation was obtained from Macron Fine Chemicals (Avantor, Center Valley, PA, USA). Standard chemicals that were used as internal references for GC analysis included ethanol (USP grade) from Pharmco (Mount Vernon, WA, USA); methanol (99.8%), acetone (HPLC grade), and isopropyl alcohol (99.99%) from EMD Chemicals (Gibbstown, NJ, USA); n-propanol (99.7%), n-butanol (99.8%), and hydroxyacetone (90%) from Sigma-Aldrich (St. Louis, MO, USA); ethylene glycol (100%) from J.T. Baker (Center Valley, PA, USA); and 1,2-PDO (99.5%) from Alfa Aesar (Ward Hill, MA, USA). The commercial catalyst of Raney® Ni, used for comparison of catalyst activities, was obtained from Aldrich Chemistry (St. Louis, MO, USA).

3.2. Catalyst Preparation

Catalysts were prepared by either the impregnation method (IM) or the deposition precipitation method (DP) as commonly reported in the literature [26]. Impregnation was carried out in a 400 mL glass beaker by adding Ni(NO3)2·6H2O (50.54 g), Mg(NO3)2·6H2O (4.84 g), and CeO2 (29.24 g) to DI water (250 mL), under stirring, for at least 24 h. The resulting slurry was then heated to evaporate water, until the precipitate was visibly dry [20]. The precipitate was further dried in an oven at 60 °C for at least 48 h prior to calcination. Calcination of the precipitate was achieved by loading the dried precipitate into a muffle furnace at 550 °C for 4 h. The calcined precipitate was then crushed into a powder of approximately 100–200 mesh in a mortar before being loaded in the reactor for pre-reduction/activation. Complete reduction of the catalysts was carried out at 200 °C for 4 h under 5.2 MPa of H2 gas in an enclosed pressure reactor (300 mL; Parr Instrument, Moline, IL, USA).
Deposition precipitation was carried out in a 2 L glass beaker by adding Ni(NO3)2·6H2O (50.54 g), Mg(NO3)2·6H2O (4.84 g), and CeO2 (29.24 g) to DI water (400 mL) under stirring for approximately 1 h. Precipitation was then achieved by adding, dropwise, the 1.5 M Na2CO3 solution (1 L) to the above prepared mixture. After being aged for at least 24 h prior to filtration, the solid precipitate was filtered out using Whatman® filter paper (#202) with a pore size of 15–19 μm. After filtration, the precipitate was washed thoroughly with at least 4 L of DI water. The washed precipitate was then dried in a 60 °C oven for at least 48 h prior to calcination. Calcination was achieved by loading the dried precipitate into a muffle furnace heated at the desired temperatures for 4 h. The calcined precipitate was then crushed into a powder in a mortar before pre-reduction/activation. Complete reduction of the catalyst was carried out in the same way as mentioned above.

3.3. Catalyst Characterization

X-ray diffraction (XRD) scans of catalyst samples were conducted on a Siemens D5000 theta-theta diffractometer (Siemens/Bruker Corp., Billerica, MA, USA) using Cu κ-α radiation (1.54 Å) from 2 to 80° 2Ɵ at 0.02°/step and 1 s/step scan rate. Nitrogen adsorption–desorption experiments were recorded by a Micromeritics TriStar II 3020 Automatic Physisorption Analyzer (Norcross, GA, USA). Before the adsorption analysis, catalyst samples were degassed under vacuum at 300 °C for 1 h. The Brunauer–Emmett–Teller (BET) surface area was obtained using the BET model. H2 temperature-programmed reduction (H2-TPR) was conducted on a Micromeritics AutoChem II 2920 Chemisorption Analyzer (Norcross, GA, USA) equipped with a thermal conductivity detector (TCD). Approximately 50 mg of catalyst sample was loaded in a U-shaped quartz reactor, pretreated by flowing He (50 sccm) at 200 °C for 1 h, then cooled to 50 °C before the sample chamber was purged until a stable baseline was reached. The H2-TPR was then started by ramping the temperature up to 600 °C at a rate of 10 °C/min under a flowing H2–Ar (10% H2) mixture at 50 sccm.

3.4. Catalytic Activity Testing

To test the activities of the catalysts developed in this study, glycerol hydrogenolysis was carried out in an enclosed pressure reactor (300 mL; Parr Instrument, Moline, IL, USA). Preset amounts of glycerol, DI water, and catalyst were charged into the reactor in preparation for testing. The reactor was flushed with H2 at least three times to remove residual air from the headspace, then pressurized with H2 to the desired initial pressure before being heated to the preset temperature. Agitation was supplied when the temperature was 30–40 °C lower than the preset temperature and noted as the starting time for reaction. After the designated reaction time, the reactor was quenched in a water bath to approximately 15 °C, prior to gas venting and liquid sampling. The liquid products were analyzed using a gas chromatograph (Agilent 6890N; Agilent Technologies, Santa Clara, CA, USA) equipped with a flame ionization detector (FID) and DB wax column (30 m long, 0.32 mm inside diameter, and 0.5 μm film thickness) [20].
The results of catalyst effectiveness testing were reported by glycerol conversion (mol %), selectivity towards a specific product (mol %), and yield of a specific product (mol %).
Glycerol conversion (C, mol %) was computed as
C   ( mol   % )   =   G c G i   ×   100   =   Gi G f G i   ×   100
where: Gc is the moles of glycerol converted, Gi moles of glycerol before reaction, and Gf moles of unreacted glycerol after reaction.
Selectivity towards a specific product (Si, mol %) was computed as
S i ( mol   % )   =   P i G c   ×   100
where Pi is the moles of a specific product after reaction.
Yield of a specific product (Yi, mol %) was computed as:
Y i ( mol   % )   =   S i   ×   C 100

4. Conclusions

The change in preparation method for 25 wt % Ni/Ce–Mg (9:1 mol/mol) catalysts from impregnation to DP resulted in higher catalytic activity, while retaining similar levels of ethanol and 1,2-PDO selectivities. The increase in calcination temperature for the catalysts prepared by DP from 350 °C to 650 °C improved glycerol conversion, but reduced selectivities for 1,2-PDO and ethanol. An increase in the reaction temperature from 200 °C to 230 °C improved glycerol conversion and selectivities for ethanol and propanol production. Among the temperatures tested, the highest 1,2-PDO selectivity reached 67.93% at 215 °C. The combined selectivity for 1,2-PDO and ethanol was favored at 215 °C, reaching 83.54%. An increase in initial water content reduced glycerol conversion, but improved selectivities for 1,2-PDO and ethanol production. Increasing hydrogen initial pressure from 6.9 MPa to 8.6 MPa improved glycerol conversion, however, the selectivities to ethanol and 1,2-PDO production were reduced. Extension of reaction time from 24 h to 48 h increased glycerol conversion and selectivities to ethanol and n-propanol, while decreasing the selectivity to1,2-PDO. A comparison on the catalytic activity to the commercial Raney® Ni catalyst revealed that the Ni/Ce–Mg catalyst developed in this study has a better potential for co-production of ethanol and 1,2-PDO from glycerol hydrogenolysis in the temperature range of 200–230 °C.

Acknowledgments

This project was financially sponsored in part by the Agriculture and Food Research Initiative competitive grant 2011-67009-20094 and Hatch project (IDA01469) from the USDA National Institute of Food and Agriculture (NIFA). The authors gratefully acknowledge technical and financial support from the Department of Biological Engineering at the University of Idaho. The authors also express their sincere gratitude to Mr. Keegan Duff, engineering support scientist and Prof. Tom Williams from the Department of Geology at the University of Idaho for their assistance in this study.

Author Contributions

Russel N. Menchavez (R.N.M.) and B. Brian He (B.B.H.) conceived and designed the experiments, and Matthew J. Morra (M.J.M.) provided constructive and critical comments and suggestions. R.N.M. performed the experiments. R.N.M. and B.B.H. analyzed and interpreted the data. R.N.M. drafted the manuscript. All three co-authors have contributed to the revised the manuscript with critical reviews, discussions, and writing.

Conflicts of Interest

The authors declare no conflict of interest.

References

  1. Corma, A.; Iborra, S.; Velty, A. Chemical routes for the transformation of biomass into chemicals. Chem. Rev. 2007, 107, 2411–2502. [Google Scholar] [CrossRef] [PubMed]
  2. Kumar, P.; Barrett, D.; Delwiche, M.; Stroeve, P. Methods for pretreatment of lignocellulosic biomass for efficient hydrolysis and biofuel production. Ind. Eng. Chem. Res. 2009, 48, 3713–3729. [Google Scholar] [CrossRef]
  3. Sheldon, R.A. Utilisation of biomass for sustainable fuels and chemicals, molecules, methods and metrics. Catal. Today 2011, 167, 3–13. [Google Scholar] [CrossRef]
  4. Leung, D.Y.C.; Wu, X.; Leung, M.K.H. A review on biodiesel production using catalyzed transesterification. Appl. Energy 2010, 87, 1083–1095. [Google Scholar] [CrossRef]
  5. Silitonga, A.S.; Ong, H.C.; Mahlia, T.M.I.; Masjuki, H.H.; Chong, W.T. Biodiesel conversion from high FFA crude Jatropha curcas, Calophyllum inophyllum and Ceiba pentandra Oil. Energy Procedia 2014, 61, 480–483. [Google Scholar] [CrossRef]
  6. Shahid, E.M.; Jamal, Y. Production of biodiesel, a technical review. Renew. Sustain. Energy Rev. 2011, 15, 4732–4745. [Google Scholar] [CrossRef]
  7. US EIA. U.S. Biodiesel Production Capacity and Production. Available online: https //www.eia.gov/biofuels/biodiesel/production/table1.pdf (accessed on 15 August 2017).
  8. International Energy Agency. Medium-Term Renewable Energy Market Report. 2014. Available online: http://www.iea.org/Textbase/npsum/MTrenew2014SUM.pdf (accessed on 16 August 2017).
  9. Anand, P.; Saxena, R.K. A comparative study of solvent-assisted pretreatment of biodiesel derived crude glycerol on growth and 1,3-propanediol production from Citrobacter freundii. New Biotechnol. 2012, 29, 199–205. [Google Scholar] [CrossRef] [PubMed]
  10. Yang, F.; Hanna, M.A.; Sun, R. Value-added uses for crude glycerol—A byproduct of biodiesel production. Biotechnol. Biofuels 2012, 5, 13. [Google Scholar] [CrossRef] [PubMed]
  11. Johnson, D.T.; Taconi, K.A. The glycerin glut, options for the value-added conversion of crude glycerol resulting from biodiesel production. Environ. Prog. 2007, 26, 338–348. [Google Scholar] [CrossRef]
  12. Pagliaro, M.; Rossi, M. Glycerol, Properties and Production. In The Future of Glycerol, 2nd ed.; The Royal Society of Chemistry: London, UK, 2010; Chapter 1; pp. 1–28. [Google Scholar]
  13. Zhou, C.H.; Beltramini, J.; Fan, Y.X.; Lu, G.Q. Chemoselective catalytic conversion of glycerol as a biorenewable source to valuable commodity chemicals. Chem. Soc. Rev. 2008, 37, 527–549. [Google Scholar] [CrossRef] [PubMed]
  14. Balat, M. Production of bioethanol from lignocellulosic materials via the biochemical pathway: A review. Energy Convers. Manag. 2011, 52, 858–875. [Google Scholar] [CrossRef]
  15. Kosaric, N.; Duvnjak, Z.; Farkas, A.; Sahm, H.; Bringer-Meyer, S.; Goebel, O.; Mayer, D. Ullmann’s Encyclopedia of Industrial Chemistry; Wiley-VCH Verlag GmbH & Co. KGaA: Weinheim, Germany, 2000. [Google Scholar]
  16. Nakagawa, Y.; Tomishige, K. Heterogeneous catalysis of the glycerol hydrogenolysis. Catal. Sci. Technol. 2011, 1, 179–190. [Google Scholar] [CrossRef]
  17. Perosa, A.; Tundo, P. Selective hydrogenolysis of glycerol with Raney nickel. Ind. Eng. Chem. Res. 2005, 44, 8535–8537. [Google Scholar] [CrossRef] [Green Version]
  18. Van Ryneveld, E.; Mahomed, A.S.; van Heerden, P.S.; Green, M.J.; Friedrich, H.B. A catalytic route to lower alcohols from glycerol using Ni-supported catalysts. Green Chem. 2011, 13, 1819–1827. [Google Scholar] [CrossRef]
  19. Huang, J.; Chen, J. Comparison of Ni2P/SiO2 and Ni/SiO2 for hydrogenolysis of glycerol, a consideration of factors influencing catalyst activity and product selectivity. Chin. J. Catal. 2012, 33, 790–796. [Google Scholar] [CrossRef]
  20. Menchavez, R.N.; Morra, J.M.; He, B.B. Glycerol hydrogenolysis using a Ni/Ce-Mg catalyst for improved ethanol and 1,2-propanediol selectivities. Can. J. Chem. Eng. 2017, 95, 1332–1339. [Google Scholar] [CrossRef]
  21. Wawrzetz, A.; Peng, B.; Hrabar, A.; Jentys, A.; Lemonidou, A.A.; Lercher, J.A. Towards understanding the bifunctional hydrodeoxygenation and aqueous phase reforming of glycerol. J. Catal. 2010, 269, 411–420. [Google Scholar] [CrossRef]
  22. Peng, B.; Zhao, C.; Mejía-Centeno, I.; Fuentes, G.A.; Jentys, A.; Lercher, J.A. Comparison of kinetics and reaction pathways for hydrodeoxygenation of C3 alcohols on Pt/Al2O3. Catal. Today 2012, 183, 3–9. [Google Scholar] [CrossRef]
  23. Mauriello, F.; Vinci, A.; Espro, C.; Gumina, B.; Musolino, M.G.; Pietropaolo, R. Hydrogenolysis vs. aqueous phase reforming (APR) of glycerol promoted by a heterogeneous Pd/Fe catalyst. Catal. Sci. Technol. 2015, 5, 4466–4473. [Google Scholar] [CrossRef]
  24. Anastas, P.; Eghbali, N. Green chemistry, principles and practice. Chem. Soc. Rev. 2010, 39, 301–312. [Google Scholar] [CrossRef] [PubMed]
  25. Werpy, T.; Petersen, G.R.; Aden, A.; Bozell, J.J.; Holladay, J.; White, J.; Manheim, A.; Eliot, D.; Lasure, L.; Jones, S. Top value added chemicals from biomass. In Results of Screening for Potential Candidates from Sugars and Synthesis Gas; National Renewable Energy Laboratory: Springfield, VA, USA, 2004; Volume 1. [Google Scholar]
  26. Liu, J.; Shi, J.; He, D.; Zhang, Q.; Wu, X.; Liang, Y.; Zhu, Q. Surface active structure of ultra-fine Cu/ZrO2 catalysts used for the CO2+H2 to methanol reaction. Appl. Catal. A Gen. 2001, 218, 113–119. [Google Scholar] [CrossRef]
  27. Yaakob, Z.; Bshish, A.; Ebshish, A.; Tasirin, S.; Alhasan, F. Hydrogen production by steam reforming of ethanol over nickel catalysts supported on sol gel made alumina, influence of calcination temperature on supports. Materials 2013, 6, 2229–2239. [Google Scholar] [CrossRef] [PubMed]
  28. Daza, C.; Kiennemann, A.; Moreno, S.; Molina, R. Stability of Ni-Ce catalysts supported over Al-PVA modified mineral clay in dry reforming of methane. Energy Fuels 2009, 23, 3497–3509. [Google Scholar] [CrossRef]
  29. Hernández-Enríquez, J.M.; Silva-Rodrigo, R.; García-Alamilla, R.; García-Serrano, L.A.; Handy, B.E.; Cárdenas-Galindo, G.; Cueto-Hernández, A. Synthesis and physico-chemical characterization of CeO2/ZrO2-SO42- mixed oxides. J. Mex. Chem. Soc. 2012, 56, 115–120. [Google Scholar]
  30. Veranitisagul, C.; Kaewvilai, A.; Sangngern, S.; Wattanathana, W.; Suramitr, S.; Koonsaeng, N.; Laobuthee, A. Novel recovery of nano-structured Ceria (CeO2) from Ce(III)-benzoxazine dimer complexes via thermal decomposition. Int. J. Mol. Sci. 2011, 12, 4365–4377. [Google Scholar] [CrossRef] [PubMed]
  31. El-Kemary, M.; Nagy, N.; El-Mehasseb, I. Nickel oxide nanoparticles, synthesis and spectral studies of interactions with glucose. Mater. Sci. Semicond. Process. 2013, 16, 1747–1752. [Google Scholar] [CrossRef]
  32. Umaralikhan, L.; Jamal Mohamed Jaffar, M. Green synthesis of MgO nanoparticles and its antibacterial activity. Iran. J. Sci. Technol. Trans. A Sci. 2016. [CrossRef]
  33. Bindhu, M.R.; Umadevi, M.; Kavin Micheal, M.; Arasu, M.V.; Abdullah Al-Dhabi, N. Structural, morphological and optical properties of MgO nanoparticles for antibacterial applications. Mater. Lett. 2016, 166, 19–22. [Google Scholar] [CrossRef]
  34. Daza, C.E.; Parkhomenko, K.; Kiennemann, A. Ni-Ce/Mg Catalysts prepared by self-combustion for CO2 reforming of methane. Adv. Chem. Lett. 2013, 1, 321–329. [Google Scholar] [CrossRef]
  35. Wang, S.F.; Yeh, C.T.; Wang, Y.R.; Wu, Y.C. Characterization of samarium-doped ceria powders prepared by hydrothermal synthesis for use in solid state oxide fuel cells. J. Mater. Res. Technol. 2013, 2, 141–148. [Google Scholar] [CrossRef]
  36. Arena, F.; Frusteri, F.; Parmaliana, A.; Plyasova, L.; Shmakov, A.N. Effect of calcination on the structure of Ni/MgO catalyst, an X-ray diffraction study. J. Chem. Soc. Faraday Trans. 1996, 92, 469–471. [Google Scholar] [CrossRef]
  37. Li, L.; Zhang, L.; Shi, X.; Zhang, Y.; Li, J. Carbon dioxide reforming of methane over nickel catalysts supported on mesoporous MgO. J. Porous Mater. 2014, 21, 217–224. [Google Scholar] [CrossRef]
  38. Zangouei, M.; Moghaddam, A.Z.; Arasteh, M. The influence of nickel loading on reducibility of NiO/Al2O3 catalysts synthesized by sol-gel method. Chem. Eng. Res. Bull. 2010, 14, 97–102. [Google Scholar] [CrossRef]
  39. Taufiq-Yap, Y.H.; Sudarno, U.; Zainal, Z. CeO2–SiO2 supported nickel catalysts for dry reforming of methane toward syngas production. Appl. Catal. A 2013, 468, 359–369. [Google Scholar] [CrossRef] [Green Version]
  40. Montoya, J.A.; Romero-Pascual, E.; Gimon, C.; Del Angel, P.; Monzón, A. Methane reforming with CO2 over Ni/ZrO2–CeO2 catalysts prepared by sol–gel. Catal. Today 2000, 63, 71–85. [Google Scholar] [CrossRef]
  41. Kim, N.D.; Oh, S.; Joo, J.B.; Jung, K.S.; Yi, J. Effect of preparation method on structure and catalytic activity of Cr-promoted Cu catalyst in glycerol hydrogenolysis. Korean J. Chem. Eng. 2010, 27, 431–434. [Google Scholar] [CrossRef]
  42. Sato, S.; Akiyama, M.; Inui, K.; Yokota, M. Selective conversion of glycerol into 1,2-propanediol at ambient hydrogen pressure. Chem. Lett. 2009, 38, 560–561. [Google Scholar] [CrossRef]
  43. Xiao, Y.; Xiao, G.; Varma, A. A universal procedure for crude glycerol purification from different Feedstocks in biodiesel production, experimental and simulation study. Ind. Eng. Chem. Res. 2013, 52, 14291–14296. [Google Scholar] [CrossRef]
  44. Maglinao, R.L.; He, B.B. Catalytic thermochemical conversion of glycerol to simple and polyhydric alcohols using Raney nickel catalyst. Ind. Eng. Chem. Res. 2011, 50, 6028–6033. [Google Scholar] [CrossRef]
  45. Xiao, Z.; Li, C.; Xiu, J.; Wang, X.; Williams, C.T.; Liang, C. Insights into the reaction pathways of glycerol hydrogenolysis over Cu–Cr catalysts. J. Mol. Catal. A Chem. 2012, 365, 24–31. [Google Scholar] [CrossRef]
  46. Guo, L.; Zhou, J.; Mao, J.; Guo, X.; Zhang, S. Supported Cu catalysts for the selective hydrogenolysis of glycerol to propanediols. Appl. Catal. A 2009, 367, 93–98. [Google Scholar] [CrossRef]
  47. Meher, L.C.; Gopinath, R.; Naik, S.N.; Dalai, A.K. Catalytic hydrogenolysis of glycerol to propylene glycol over mixed oxides derived from a hydrotalcite-type precursor. Ind. Eng. Chem. Res. 2009, 48, 1840–1846. [Google Scholar] [CrossRef]
  48. Zhao, B.; Li, C.; Xu, C. Insight into the catalytic mechanism of glycerol hydrogenolysis using basal spacing of hydrotalcite as a tool. Catal. Sci. Technol. 2012, 2, 1985–1994. [Google Scholar] [CrossRef]
  49. Dasari, M.A.; Kiatsimkul, P.P.; Sutterlin, W.R.; Suppes, G.J. Low-pressure hydrogenolysis of glycerol to propylene glycol. Appl. Catal. A Gen. 2005, 281, 225–231. [Google Scholar] [CrossRef]
Figure 1. XRD patterns of (a) CeO2, (b) NiO, (c) MgO, (d) Ni/Ce–Mg prepared by IM and calcined at 550 °C, (e) Ni/Ce–Mg by DP at 650 °C, (f) Ni/Ce–Mg by DP at 550 °C, and (g) Ni/Ce–Mg by DP at 350 °C. The Ce–Mg molar ratios are 9:1 for all Ni/Ce–Mg catalysts.
Catalysts 07 00290 g001
Figure 2. H2-TPR profiles of the catalysts of 25 wt % Ni/Ce–Mg (9:1 mol/mol), (a) by impregnation and calcined at 550 °C, (b) by DP and calcined at 550 °C, (c) by DP and calcined at 350 °C, and (d) by DP and calcined at 650 °C.
Catalysts 07 00290 g002
Figure 3. Effect of calcination temperature on the activity of 25 wt % Ni/Ce–Mg (9:1) catalysts prepared by DP. Reaction conditions: reactant 100 g (60 wt % glycerol in H2O), 10 g catalyst, hydrogen initial pressure pH2 = 6.9 MPa, reaction temperature T = 215 °C, and reaction time t = 24 h.
Catalysts 07 00290 g003
Figure 4. Effect of reaction temperature on the activity of 25 wt % Ni/Ce–Mg (9:1 mol/mol) catalysts prepared by DP and calcined at 350 °C. Reaction conditions: reactant 100 g (60 wt % glycerol in H2O), 10 g catalyst, hydrogen initial pressure pH2 = 6.9 MPa, and reaction time t = 24 h.
Catalysts 07 00290 g004
Figure 5. Effect of initial water content on the activity of 25 wt % Ni/Ce–Mg (9:1 mol/mol) catalysts prepared by DP and calcined at 350 °C. Reaction conditions: reactant 60 g glycerol, 10 g catalyst, hydrogen initial pressure pH2 = 6.9 MPa (initial), and reaction time t = 24 h.
Catalysts 07 00290 g005
Table 1. Textural properties of catalysts prepared by different methods.
Preparation Method aCalcination Temp. (°C)BET Surface (m2/g)Pore Volume b (cm3/g)Pore Diameter c (nm)
Impregnation (IM)5508.080.052127.1
Deposition Precipitation (DP)55027.330.087910.2
65027.780.083210.4
35070.780.09734.6
a All catalysts are 25 wt % Ni on Ce–Mg with a Ce–Mg molar ratio of 9:1. b Barrett–Joyner–Halenda (BJH) Adsorption cumulative pore volume. c BJH Adsorption average pore width.
Table 2. Effect of preparation method on the activity of Ni/Ce–Mg catalysts a,b.
Preparation MethodConversion (mol %)EthanolEGn-Propanol1,2-PDOOthers
SYSYSYSYS
AE bAEAEAEAE
RERERERERE
Impregnation (IM)28.6315.284.385.341.53NDND62.1417.7917.25
0.480.410.17-1.55
1.680.683.18-2.49
Deposition Precipitation (DP)45.7115.266.985.762.63NDND63.6429.0915.34
2.260.570.36-4.28
4.943.746.25-6.72
a All catalysts are 25 wt % Ni on Ce–Mg with a Ce:Mg molar ratio of 9:1 calcined at 550 °C. Catalyst testing conditions: reactant 100 g (60 wt % glycerol in H2O), 10 g catalyst, initial hydrogen pressure pH2 = 6.9 MPa, reaction temperature T = 215 °C, and reaction time t = 24 h. b Abbreviations: S—selectivity of product (mol %), Y—yield of product (mol %), ND—none detected, AE—Absolute Error = (measured value − average value), RE—Relative Error (%) = (AE/average value) × 100.
Table 3. Effect of initial hydrogen pressure and time a.
Conditions b pH2 (MPa); Time (h)Conversion
(mol %)
EthanolEGn-Propanol1,2-PDOOthers
SYSYSYSYS
AEAEAEAEAE
RERERERERE
6.9; 2443.2915.616.756.802.94NDND67.9329.419.66
1.531.020.54-5.6
3.536.537.94-8.24
8.6; 2451.4012.406.387.383.800.730.3864.123315.37
1.660.040.30.011.50
3.230.324.071.372.34
8.6; 4875.6415.4311.687.305.531.341.0260.8146.015.12
1.930.650.080.070.36
2.554.211.105.220.59
a Reaction conditions: reactant 100 g (60 wt % glycerol in H2O), 25 wt % Ni/Ce–Mg (9:1 mol/mol) catalyst prepared by DP and calcined at 350 °C, reaction temperature 215 °C. b pH2—initial hydrogen pressure at room temperature, WC—water content, ND—not detected, AE—Absolute Error (%) = (measured value − average value), RE—Relative Error (%) = (AE/average value) × 100.
Table 4. Catalyst activity comparison of Ni/Ce–Mg catalyst with Raney® Ni a,b,c.
CatalystT
(°C)
Conversion (mol %)EthanolEGn-Propanol1,2-PDOOthers
SYSYSYSYS
SDSDSDSDSD
CVCVCVCVCV
Ni/Ce–Mg20027.579.992.755.771.59NDND60.8716.7823.37
0.461.060.17-3.49
1.669.952.84-5.54
21543.2915.616.756.802.94NDND67.9329.419.66
2.581.760.85-5.41
5.8010.7011.72-7.93
23068.8719.0213.106.802.942.361.6347.5732.7622.62
0.621.310.150.161.76
0.917.182.556.343.63
Raney® Ni20031.004.591.4252.8016.39NDND22.346.9320.27
1.090.411.89-0.36
3.508.933.57-1.59
21549.409.074.4834.7317.160.760.3826.1512.9229.9
1.340.261.330.010.60
2.722.825.731.292.29
23067.4611.437.7118.6312.571.190.8026.7018.0142.05
2.620.331.730.040.34
3.882.859.283.661.29
a The Ni/Ce–Mg was prepared with 25 wt % Ni on the Ce–Mg support with a Ce–Mg molar ratio of 9:1 by DP and calcined at 350 °C. b Reaction conditions: feed 100 g (60 wt % glycerol in H2O), initial hydrogen pressure pH2 = 6.9 MPa. Raney® Ni catalyst of 5 g was used with t = 6 h, while for Ni/Ce–Mg catalyst of 10 g was used with t = 24 h. c S—selectivity of product (mol %), Y—yield of product (mol %), SD (%) = absolute value of the standard deviation (%), CV = Coefficient of Variation (%) = (SD/Average value) × 100.

