Alcohol Dehydrogenation on Kraft Lignin-Derived Chars with Surface Basicity
by
 , ,
, ,
Francisco J. García-Mateos
1, 
Imane Moulefera
1,2,
Juana M. Rosas
1,
Abdelghani Benyoucef
2 ,
,
José Rodríguez-Mirasol
1,* and
Tomás Cordero
1,* 1
Departamento de Ingeniería Química, Campus de Teatinos s/n, Universidad de Málaga, Andalucía Tech, 29010 Málaga, Spain
2
Laboratoire de Génie des Procédés et Chimie des Solutions, Université de Mustapha Stambouli de Mascara, Bp 763, Mascara 29000, Algeria
*
Authors to whom correspondence should be addressed.
Catalysts 2017, 7(10), 308; https://doi.org/10.3390/catal7100308
Submission received: 27 September 2017
/
Revised: 13 October 2017
/
Accepted: 15 October 2017
/
Published: 19 October 2017
(This article belongs to the Special Issue Catalytic Sustainable Processes in Biorefineries)
Abstract
:The properties of lignin and its potential as a renewable source make it an ideal precursor for carbon products. Specifically, the high content of Na observed in Kraft lignin makes this industrial by-product an interesting precursor for the preparation of catalysts for different applications. In this work, basic activated carbons with different textural properties and surface chemistry were obtained from Kraft lignin by direct carbonization at various temperatures. The influence of a further washing treatment and partial gasification with CO2 was also evaluated. The carbon catalysts were tested as catalysts for the alcohol decomposition reaction. In this sense, 2-propanol, a molecule widely used for testing the acidic-basic character of heterogeneous catalysts, was selectively transformed into acetone, meanwhile, ethanol and methanol yielded mainly acetaldehyde and formaldehyde, respectively.
Keywords:
alcohol dehydrogenation; biomass; lignin; bio-char; CO2 gasification; activated carbon; sodium1. Introduction
Lignin is the second most abundant polymer in the world, after cellulose, and it is the most abundant renewable source of aromatic products [1,2]. Most of the lignin produced in the world is a by-product in the pulp–paper industry, with the most lignin obtained from the Kraft process [3]. In this process, lignin fraction is separated from cellulose of the lignocellulosic biomass during wood pulping, with an aqueous solution of NaOH + Na2S, obtaining the corresponding black liquors enriched in lignin. Most lignin is consumed as fuel after evaporation of black liquors in this pulp–paper industry to recover energy and chemical reactants.
In a biorefinery context, an increase in cellulose production must involve a search of new alternatives to make use of lignin, different from combustion [2]. Among the different options, depolymerization is an interesting route to obtain different chemical products by biochemical, catalytic, and thermochemical processes. The production by these routes of renewable chemical products, biofuels, and high added-value materials becomes essential for the integral development of the biorefinery concept. In this way, our research group has studied alternative uses for lignin, such as the preparation of carbon materials from different types of lignin [4,5], highlighting the creation of activated carbons from physical [6,7] and chemical activation [8,9]; all of the carbon materials have interesting applications as adsorbents [9,10] and catalyst supports [11,12]. Furthermore, the following have also been obtained: carbon materials with a high degree of graphitization [13]; nanomaterials with hierarchical porosity by the zeolite template method [14], for use in electrochemical applications [15]; and carbon fibers and tubes [16,17] also with remarkable results as electrodes [18] and electrocatalysts [19].
In the field of acid catalysis, activated carbons obtained by chemical activation with H3PO4 have proven to be very good acid catalysts [20], showing outstanding results compared to zeolites in alcohol dehydration, with high chemical and thermal stability, even in the presence of water [21,22]. Furthermore, these catalysts are very selective to olefins, producing ethylene from ethanol [23], propylene from 2-propanol [21], and 1- and 2-buthene from butanol [22]. In the case of methanol, these catalysts mainly produced the intermolecular dehydration to dimethyl-ether.
Alcohols can be molecules of great interest from the point of view of the biorefinery, given that they are raw chemical and energetic sources and, also, are easy to store and transport. In this sense, they can be obtained from biomass, in some cases directly by thermochemical or biochemical reactions, such as pyrolysis (methanol, 2-propanol) or fermentation (ethanol, buthanol), or indirectly, as in the case of methanol, obtained from syngas derived from lignocellulosic biomass gasification.
Following our research about the preparation of carbon materials from lignocellulosic sources and their application in heterogeneous catalysis related to the biorefinery process, this work deals with the preparation of basic catalysts from Kraft lignin, with different textural properties and surface chemistries for alcohol (2-propanol, ethanol and methanol) dehydrogenation.
2. Results and Discussion
2.1. Characterization of the Catalysts
Table 1 summarizes the ash content on a dry basis (d.b.), the ultimate analyses on a dry ash free basis (d.a.f.), and the preparation yields of the different carbon catalysts obtained in this work. For the sake of comparison, the ash content and the ultimate analyses of the starting material has been also included. In this sense, the black liquors in Kraft pulp production plants, from which carbons are obtained, are alkaline solutions. The evaporation of these black liquors yields solid lignin with a high content of sodium compounds. The ash content of the bio-chars is around 30%, which is approximately twice the value of the lignin raw material, L (16.9%). This increase is due to the loss of volatile matter during the carbonization, and it is in agreement with the yield of the process (around 50%), suggesting that the inorganic matter is not significantly volatilized in this stage. After the carbonization process of L at the different temperatures, the carbon and the sulfur contents significantly increased, meanwhile, the amount of oxygen and hydrogen considerably decreased, due to the devolatilization and aromatic condensation occurring during the carbonization process.
The washing of the L900 char removed most of its inorganic matter, obtaining a final ash content of 4%. However, this process was not totally effective, probably due to the narrower, porous structure of this char. This treatment also reduced the oxygen and the sulfur amounts, and consequently increased the carbon content in the obtained carbon, L900W.
Gasification of L900 and L900W chars to obtain L900G and L900WG activated carbons, respectively, produced an increase of the ash content (L900G: 44%; L900WG: 8%), as a consequence of the carbonaceous matter loss (burn-off (B.O.) = 44% and 60%, respectively). This loss was also accompanied by an increase of the oxygen content due to formation of new carbon-oxygen surface groups which were created by chemical reactions between the activation agent (CO2) and the carbon surface.
2.1.1. Textural Properties
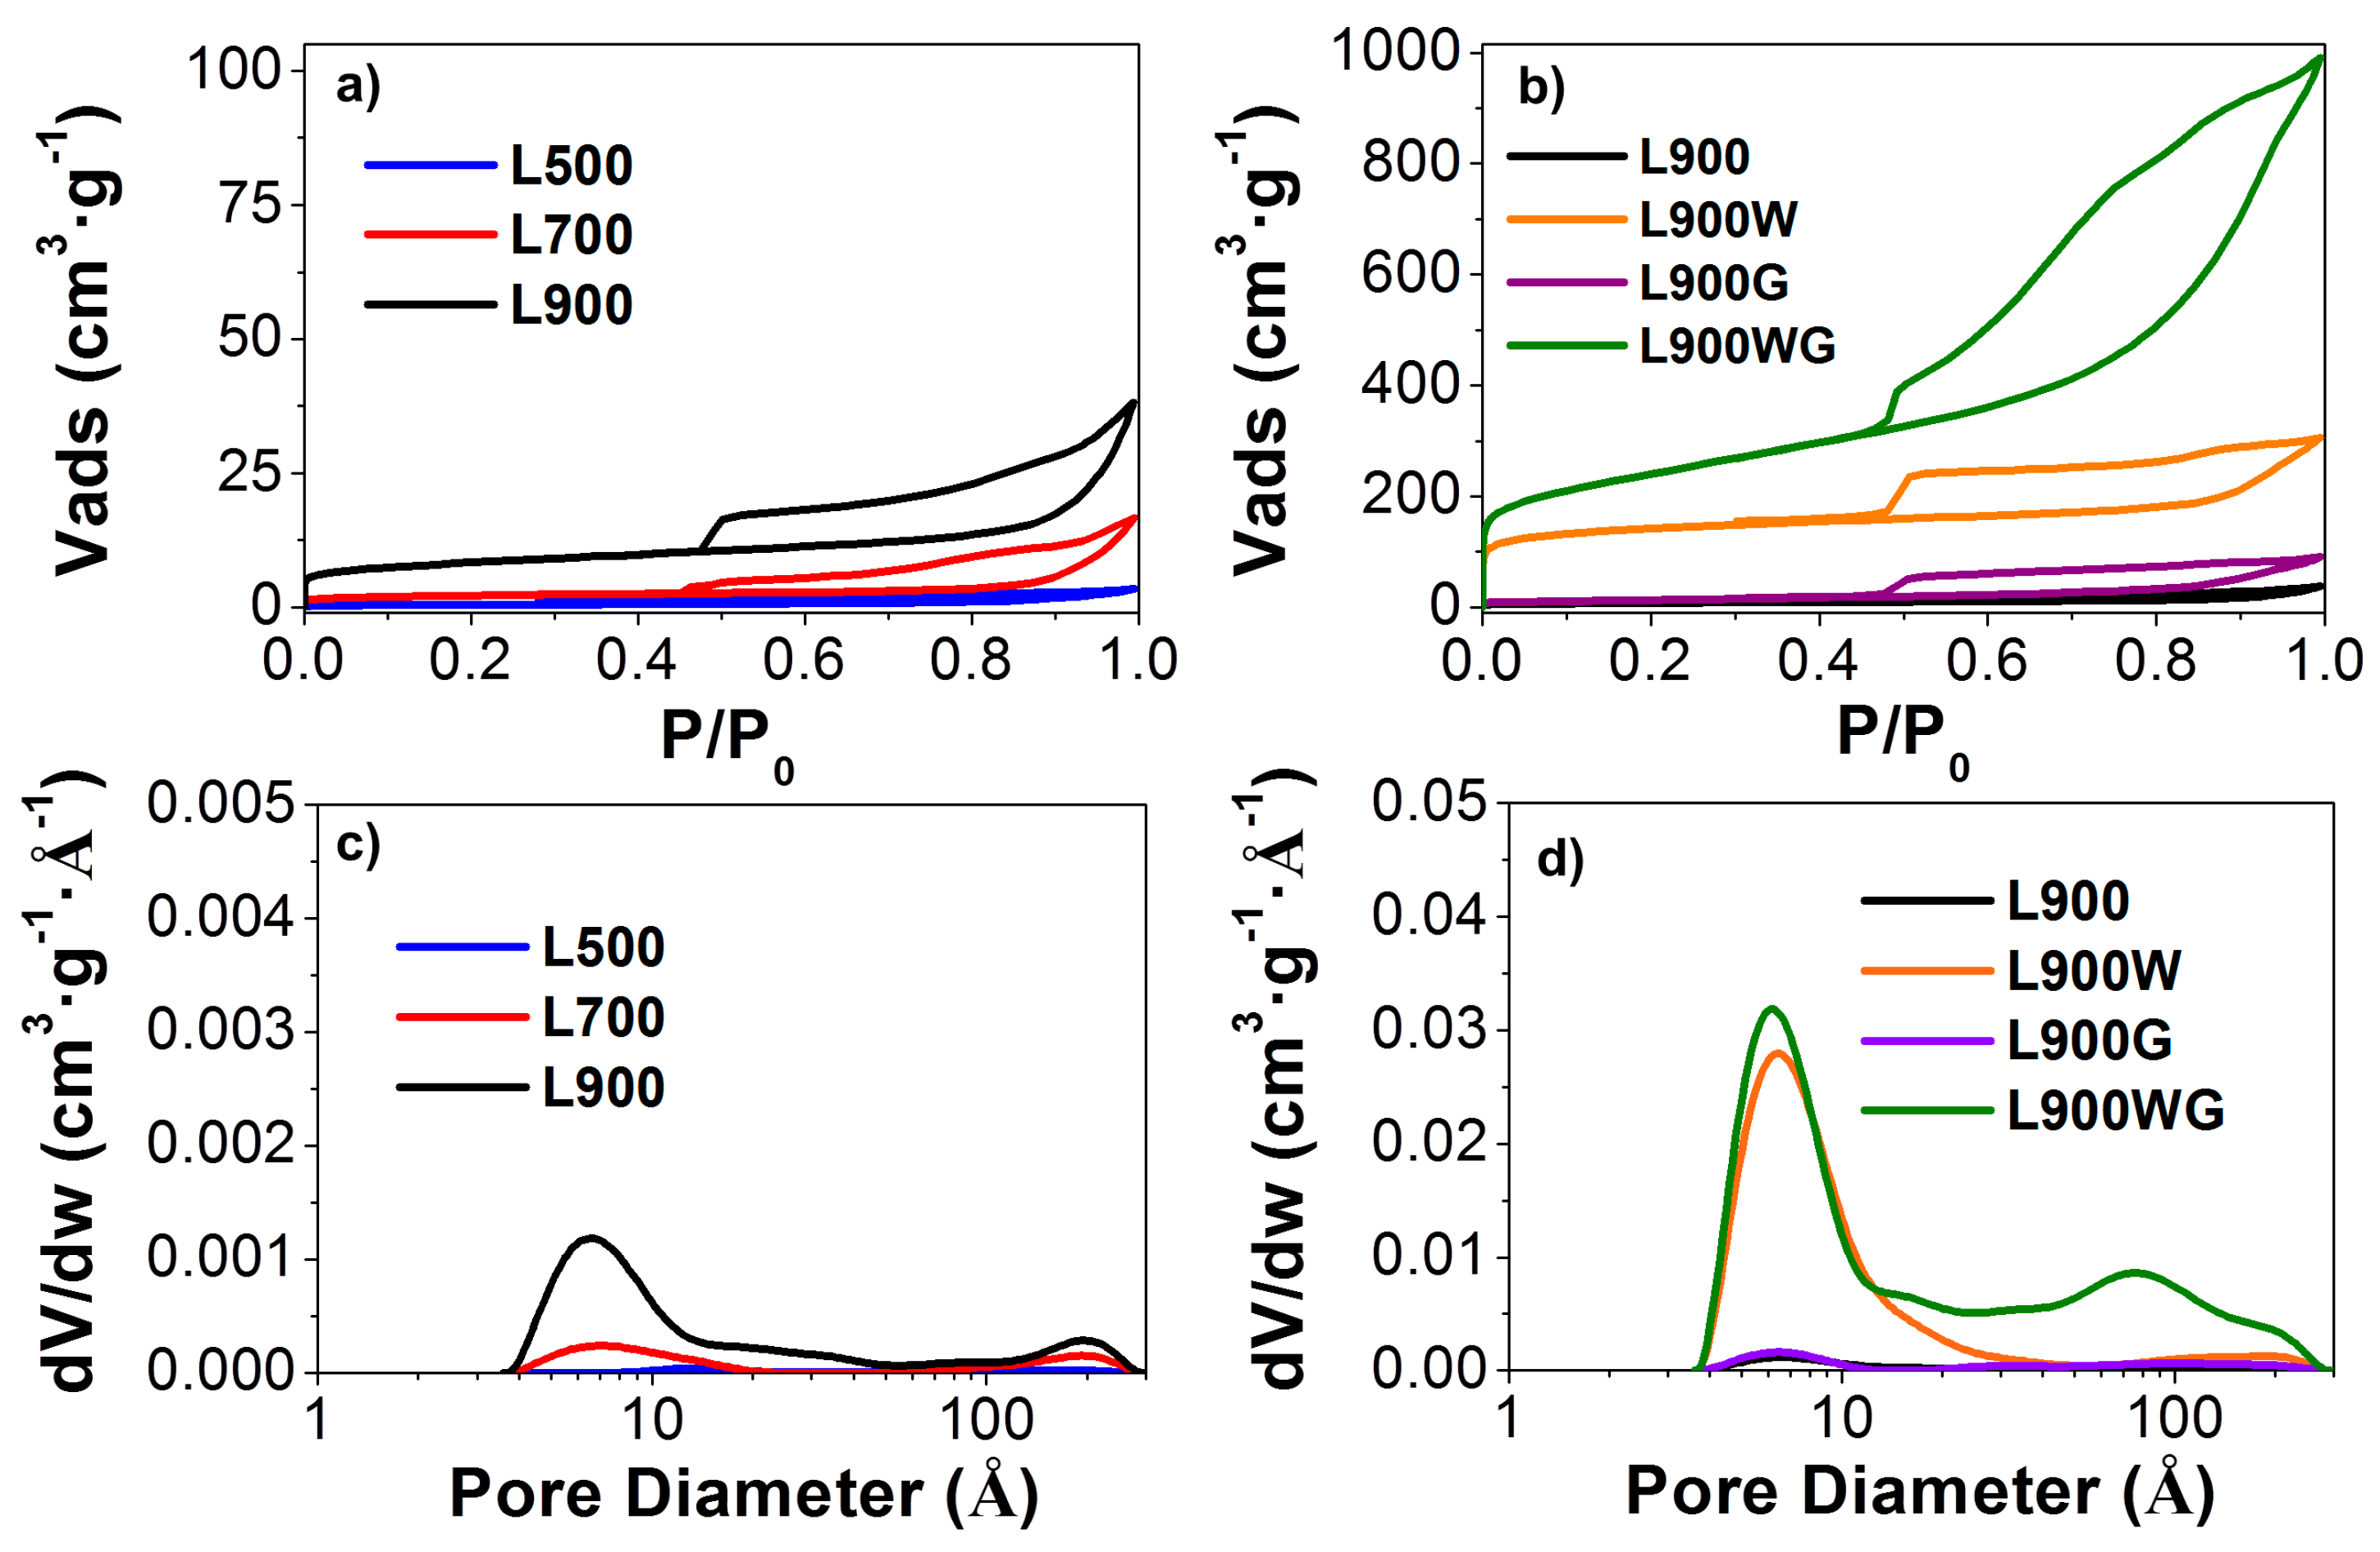
Figure 1 shows the N2 adsorption-desorption isotherms at −196 °C of the different carbon catalysts prepared. The catalyst obtained by the direct carbonization at 500 °C presents low N2 adsorption in the entire relative pressure range of the isotherm, typical of a nonporous solid. The increase of the carbonization temperature produced a slight development of a porous structure, as is shown by the increased amount of adsorbed N2 (Figure 1a), due to the activation produced by sodium oxide when the carbonization temperature was increased. The isotherms of the non-washed catalysts obtained at 900 °C before and after the gasification step (Figure 1b) are very similar, due to the presence of inorganic matter that hinders the development of porosity during the gasification step, probably by hampering the complete devolatilization [23]. In contrast, the washing treatment releases to a great extent the porosity of the sample L900W due to the removal of the inorganic matter, mainly composed of Na and S. The gasification of this sample produces high porosity in L900WG, showing a type IV isotherm with an increase of the adsorbed volume in the whole relative pressure range, which corresponds to a large amount of porosity with micropores and mesopores. The presence in this sample of H4 type hysteresis loops is associated to slit-shaped pores.
Figure 1c,d also shows the micropore size distribution of the different carbon catalysts. Most of the carbon materials have micropores within an effective pore width in the range of 4–15 Å. The increase of the carbonization temperature (Figure 1c) produces a slight increase of the micropore size as a consequence of a higher devolatilization. In this sense, the samples treated at 900 °C present a multimodal pore size distribution. After the washing of the L900 carbon, an important widening of micropore size is revealed, showing a maximum around 6 Å. The following gasification of this sample (L900WG) produces a further broadening of the porosity, presenting another important maximum around 80 Å.
Table 2 summarizes the values of the textural properties that characterize the porous texture calculated from N2 adsorption-desorption and CO2 adsorption isotherms of the different carbon catalysts. The catalysts obtained directly by carbonization at the different temperatures show significantly higher values of specific surface area from the CO2 isotherm (ADR) than that of apparent surface area (ABET), indicative of a very narrow porous structure, with mean pore size values under 7 Å [24]. After the washing treatment, the sample L900W has high values of micropore volume obtained from the N2 isotherm (Vt), mesopore volume (Vmes), and micropore volume derived from the CO2 isotherm (VDR) than those of L900, revealing that the removal of the inorganic matter (from 31 to 4%) removes to a great extent the porosity. The similarities between ABET and ADR values, obtained for L900W carbon, are typical of microporous solids.
Gasification of L900 does not produce any apparent development of the porosity. This fact probably can be associated to the high ash content (44%) of the sample L900G, which may block access to the pores. In contrast, gasification of L900W generated a notable development of the porosity, obtaining an ABET as high as 850 m2 g−1. In this case, an ABET higher than the value of ADR indicates the presence of a wide porous structure. Furthermore, Vmes is higher than Vt, indicating a high contribution to mesoporosity.
2.1.2. Surface Morphology
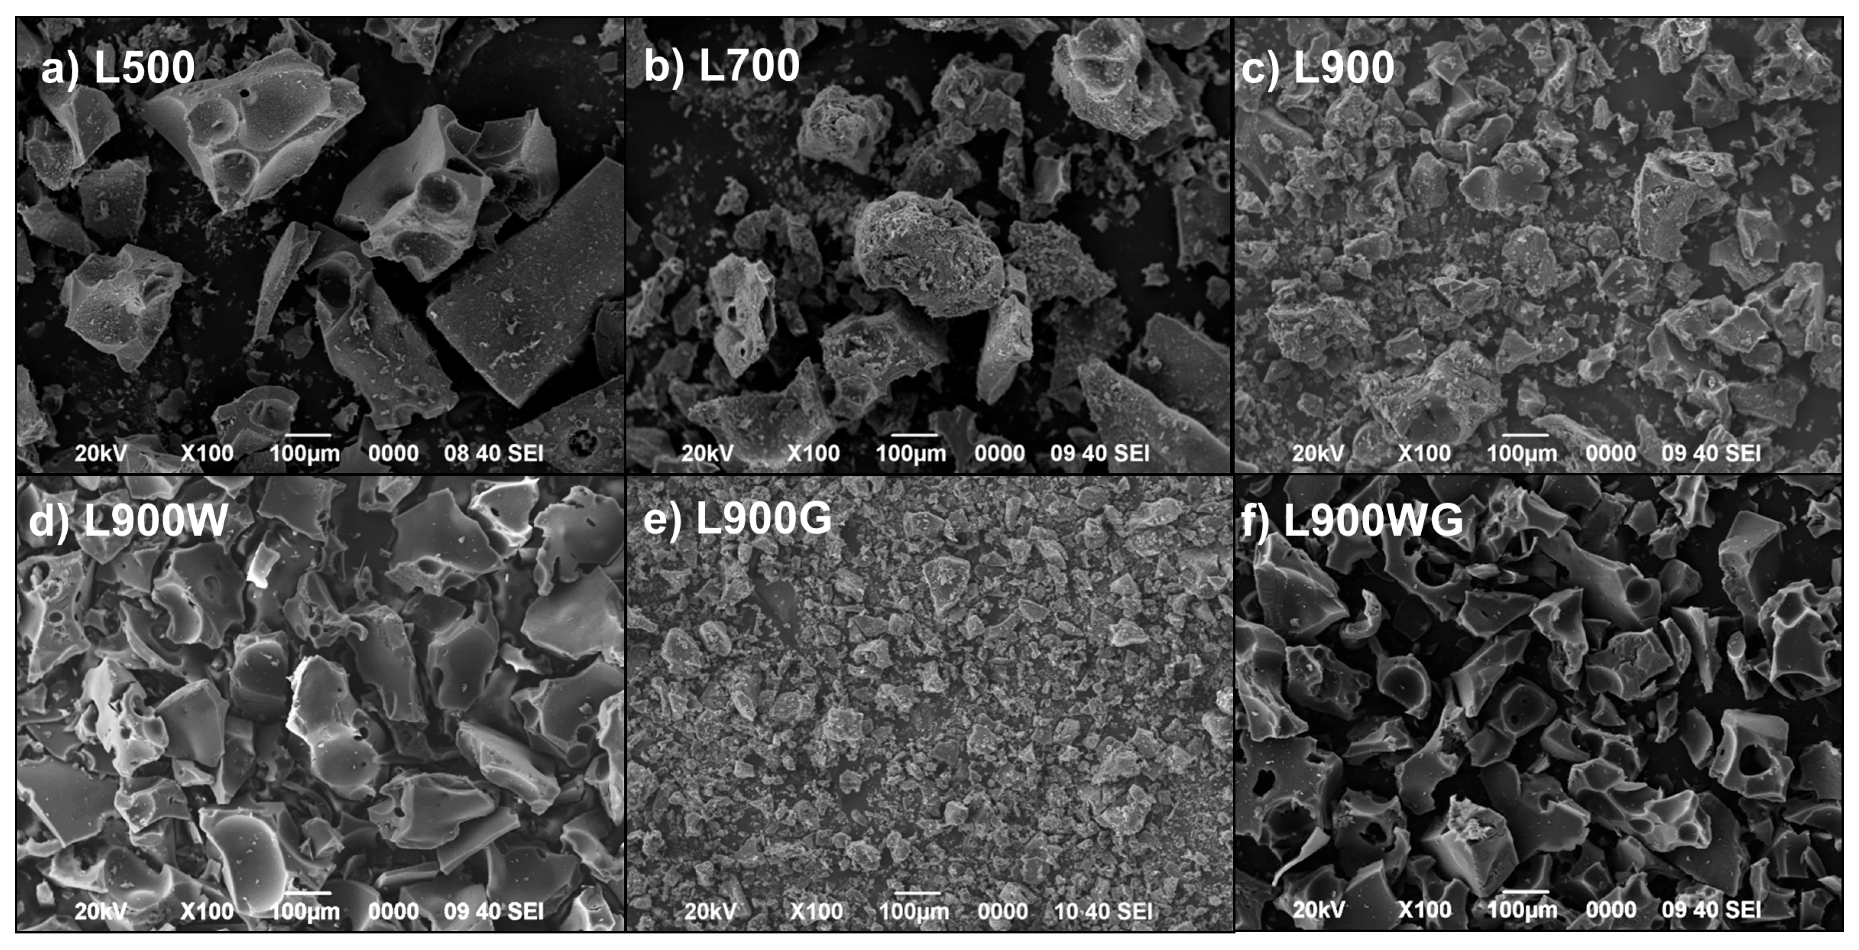
Figure 2 collects the SEM micrographs of the different carbon catalysts. The morphology of the carbon catalysts obtained at the different carbonization temperatures is very similar. The samples carbonized at 900 °C and washed (L900W) show a slight reduction of the particle size, probably due to the high reduction of the ash content. With regard to the gasification, the sample L900G suffers an important reduction of the particle size, however, as aforementioned, the treatment does not produce any development of the porosity. These results suggest that gasification takes place, with diffusional control, on the external surface of the particle and, consequently, a shrinking unreacted core model mechanism could explain the evolution of the gasification process. In contrast, the sample L900WG presents the same particles size, indicating that gasification proceeds in the entire available particle surface, without diffusional problems, and with an important porosity development [25].
2.1.3. Surface Chemistry
X-ray photoelectron spectroscopy (XPS) analyses were carried out in order to evaluate the surface element distribution and the surface chemical composition of the carbon catalysts. The main components of the carbon catalysts are carbon, oxygen, sulfur, and sodium. It is important to highlight the low carbon content of these carbon catalysts (L500, L700, and L900), these values are considerably lower than those obtained by other lignocellulosic chars [23], indicating that the main part of the inorganic matter is present in the outer surface. The weight ratio O/C determined by XPS in these three carbon catalysts is approximately 3, and the ash content is around 30%. If it is assumed that most of the inorganic matter is composed of sodium, a weight ratio Na/CXPS of approximately 2 can be observed. These values suggest that sodium is mainly present in the form of sodium salt (carbonates, sulfates, and sulfides). After the washing treatment, more of the ashes are removed and, consequently, the carbon content significantly increases in detriment of the oxygen, sulfur, and sodium contents.
On the other hand, it was expected that the carbon content of L900G would decrease with respect to that of L900 as a consequence of the carbon loss by the gasification. However, the gasification process increased the carbon amount and decreased the sulfur and sodium percentages. This could be due, in part, to the carbonation of the sodium ions present on the surface during the gasification process. In this sense, some volatilization of the sulfur compounds can take place during gasification with CO2, as suggested by the decrease of the sulfur content close to the formation of sodium clusters that reduce the relative concentration of this atom in the external surface, so increasing the carbon content. Gasification of the carbon L900W produces, as expected, an increase of the sulfur and sodium contents and a reduction of the carbon amount caused by the carbon gasification.
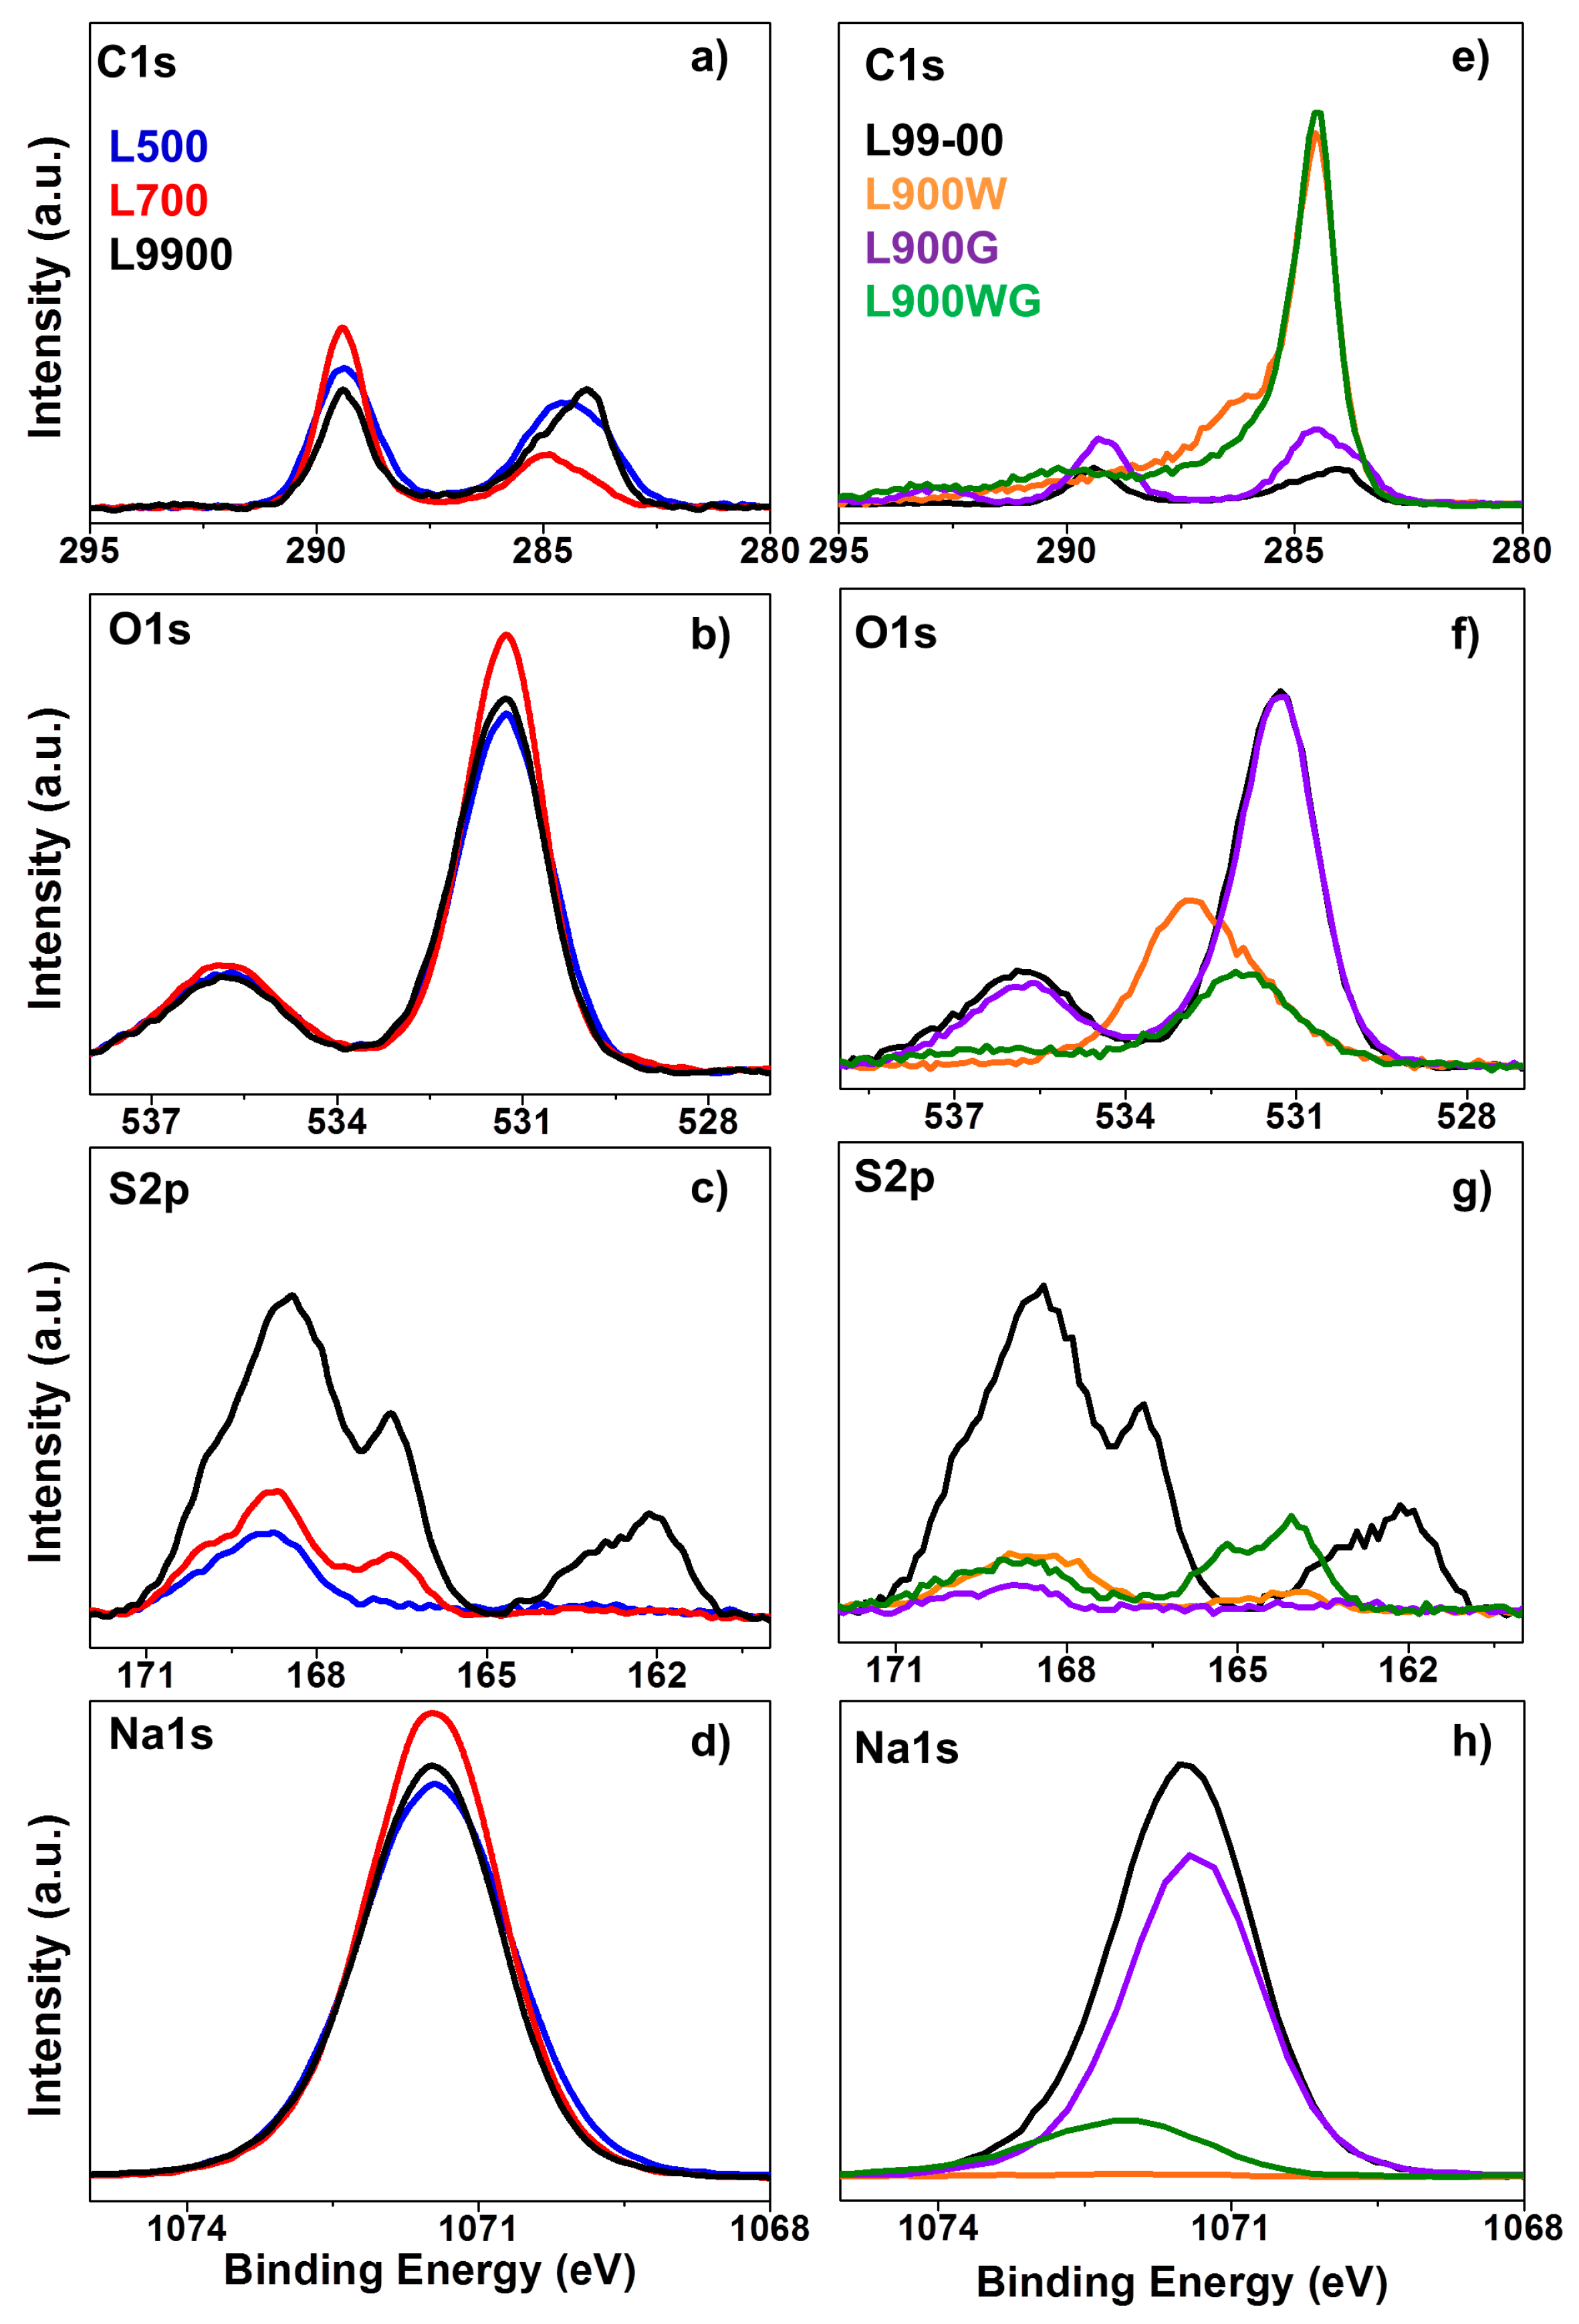
Figure 3 shows the C1s, O1s S2p, and Na1s spectra of the different carbon catalysts. C1s spectrum of the samples carbonized at the different temperatures shows two broad peaks associated to the presence of different chemical states. In this sense, it shows the presence of C-C (284.5 eV), C-OH (285.5 eV), C-O-C (286.3 eV); C=O (288 eV), and CO32− bonds (290 eV). The contribution of carbonates is very important in these samples, being even higher than those of the other species. The C1s spectrum of the washed carbons (Figure 2e) shows an important reduction of the carbonates peak at the same time as an increase of the peak associated to carbon in the C-C bond. O1s spectrum shows a wide and similar band around 531.5 eV in all the carbon catalysts, this band can be deconvoluted into several peaks in the range of 530.4–530.8, 532.4–533.1, and 534.8–535.6 eV, which have been ascribed to C=O groups, C-OH and/or C-O-C groups, and chemisorbed oxygen and/or water, respectively. Furthermore, an important band around 531.1 eV can be also obtained due to the oxygen atoms in the carbonate ions of sodium carbonate [26]. These samples also present a broad peak found around 535.5 eV, which corresponds to the sodium Auger peak (Na KLL). This last peak and the one found at 531.1 eV are considerably decreased in the washed samples.
The sulfur spectrum presents a doublet corresponding to S2p3/2 and S2p1/2. The S2p spectrums of the samples L500 and L700 show two contributions at 167.6 and 169.4 eV that could be associated to sulfite and sulfate groups, respectively. The carbonization at the highest temperature produces the appearance of another peak at 162.1 eV, related to the formation of sulfide (thiolate) groups. The washing treatment reduces considerably the presence of sulfur, only leaving some sulfur in the form of sulfate groups. Only the sample L900WG has a peak at 163.4 eV, associated to disulfide or sulfide and unbound thiol. The Na1s spectrum for the carbon catalysts obtained at different carbonization temperatures can be assigned to sodium carbonate, sodium sulfate, and sodium sulfide, with the more significant contribution associated to sodium carbonate. These species almost disappear with the washing treatment.
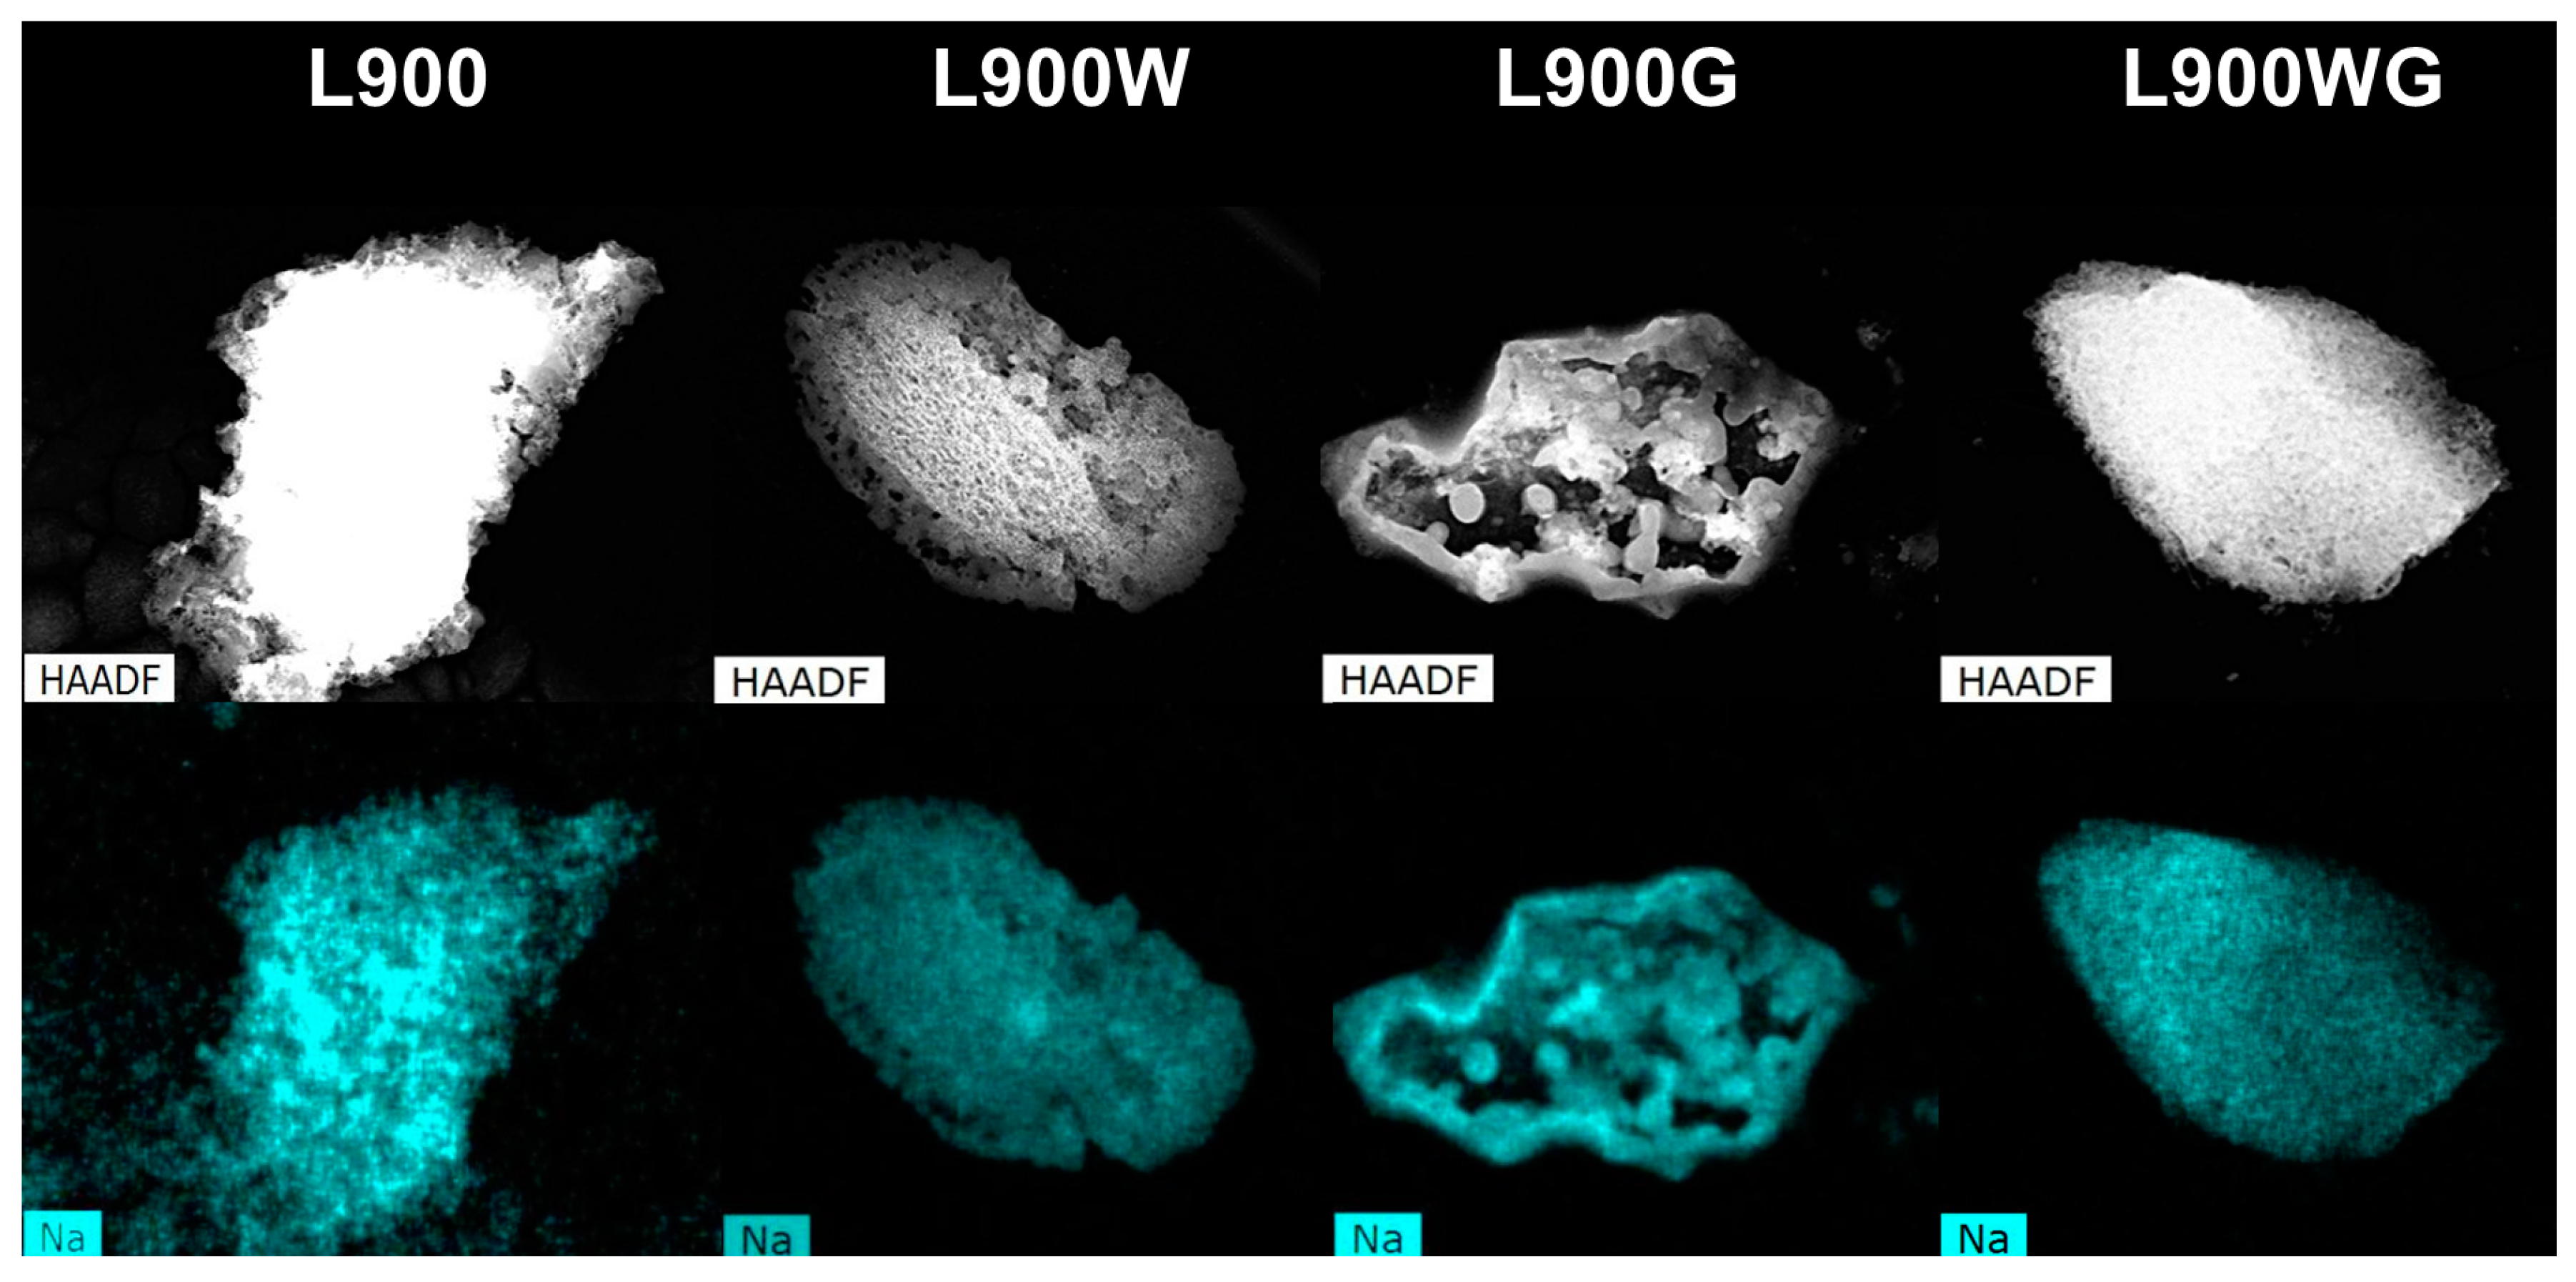
Figure 4 displays the sodium dispersion derived from SEM equipped with energy-dispersive X-ray analyses (SEM-EDX) analyses of the different carbon catalysts obtained at 900 °C. As can be seen, sodium is well distributed in the sample carbonized at 900 °C. After the washing treatment, its distribution is very homogeneous, in spite of the important reduction of its content. The formation of sodium clusters can be noticed in the sample L900G, in agreement with the decrease of Na content detected by X-ray photoelectron spectroscopy (XPS) analyses, however, those clusters are not observed in the carbon L900WG. This difference can be associated to the lower Na content of this sample. Furthermore, Na is a well-known catalyst of the gasification reactions, and its high amount in the sample L900G can produce local increases of the temperature, favoring the sintering of clusters in that case.
The surface chemistry of the carbon catalysts was also analyzed by the temperature-programmed desorption (TPD) technique, which is used to characterize the carbon-oxygen groups of the samples. Carbon materials release different oxygen surface groups whose nature and quantity depend on the starting material and the activation treatment [27]. The acidic groups (carboxylic, lactonic) evolve as CO2, whereas the non-acidic (carbonyl, ether, quinone) and phenol groups produce CO. Anhydride evolves as both CO and CO2 [28]. Figure 5a–d shows, respectively, the CO2 and CO evolved during the TPD experiments performed on the different carbon catalysts. Decomposition of surface oxygen complexes such as CO and CO2 is quite high in all the carbon catalysts. In general, the evolution of CO is higher than that of CO2. The chars obtained at the different temperatures (Figure 5a,c) show high amounts of very stable carbon-oxygen groups, which decompose at temperatures higher than 600 °C, where decomposition of both inorganic compounds and carbonyl and quinone groups takes place. The increase of the carbonization temperature produces an increase of the CO and CO2 evolution. In the case of CO, the last peak associated to more stable carbon-oxygen complexes remains very similar after carbonization at the different temperatures, however, the peak around 700 °C decreases in the carbon catalyst prepared at 900 °C, probably as a consequence of the higher temperature of the treatment. On the other hand, CO2 profiles increase with the carbonization temperature. The evolution at low temperatures is almost negligible, and most of the evolution is centered on 700 °C, which probably can be associated to the decomposition of sodium carbonates [29]. However, the different chars have very similar ash and Na content (determined by XPS analyses), so their differences must be associated to the increase of the sulfur content and its possible reduction from sulfate to sulfide groups. This reduction would produce the oxidation of the carbon to carbonate surface in the form of groups, which decompose as CO2. Nevertheless, another feasible explanation could be the formation of sodium atom clusters in the external surface, decreasing the relative amount of sodium, as revealed by XPS [30].
Figure 5b,d collects the CO and CO2 evolutions of the carbon catalysts obtained at 900 °C. When L900 is washed, an important reduction of the CO and CO2 evolution is noticed, related to the considerable removal of the inorganic matter. With regard to the gasified samples, gasification of carbon samples with high ash content produces the increase of the amount of oxygen groups that evolved as CO2 during the TPD, as occurs in the L900WG catalyst. However, the L900G sample shows a similar CO profile, and a CO2 evolution substantially decreased. Specifically, the peak around 700 °C is significantly reduced. This decrease may be due to decomposition of alkaline metal carbonates, which can take place at temperatures below the melting point (820 °C) when heating carbonate-carbon mixtures. In this case, the temperature of the gasification treatment was 750 °C, so decomposition of the groups of L900 was probably produced during its gasification [31]. Table 3 also summarizes the amounts of CO and CO2 evolved with temperature during the TPD experiment for the different carbon catalysts. As can be seen, the catalyst L900 presents the highest CO2 evolution; meanwhile the sample L900G evolves the highest amount of CO.
2.1.4. Catalytic Activity
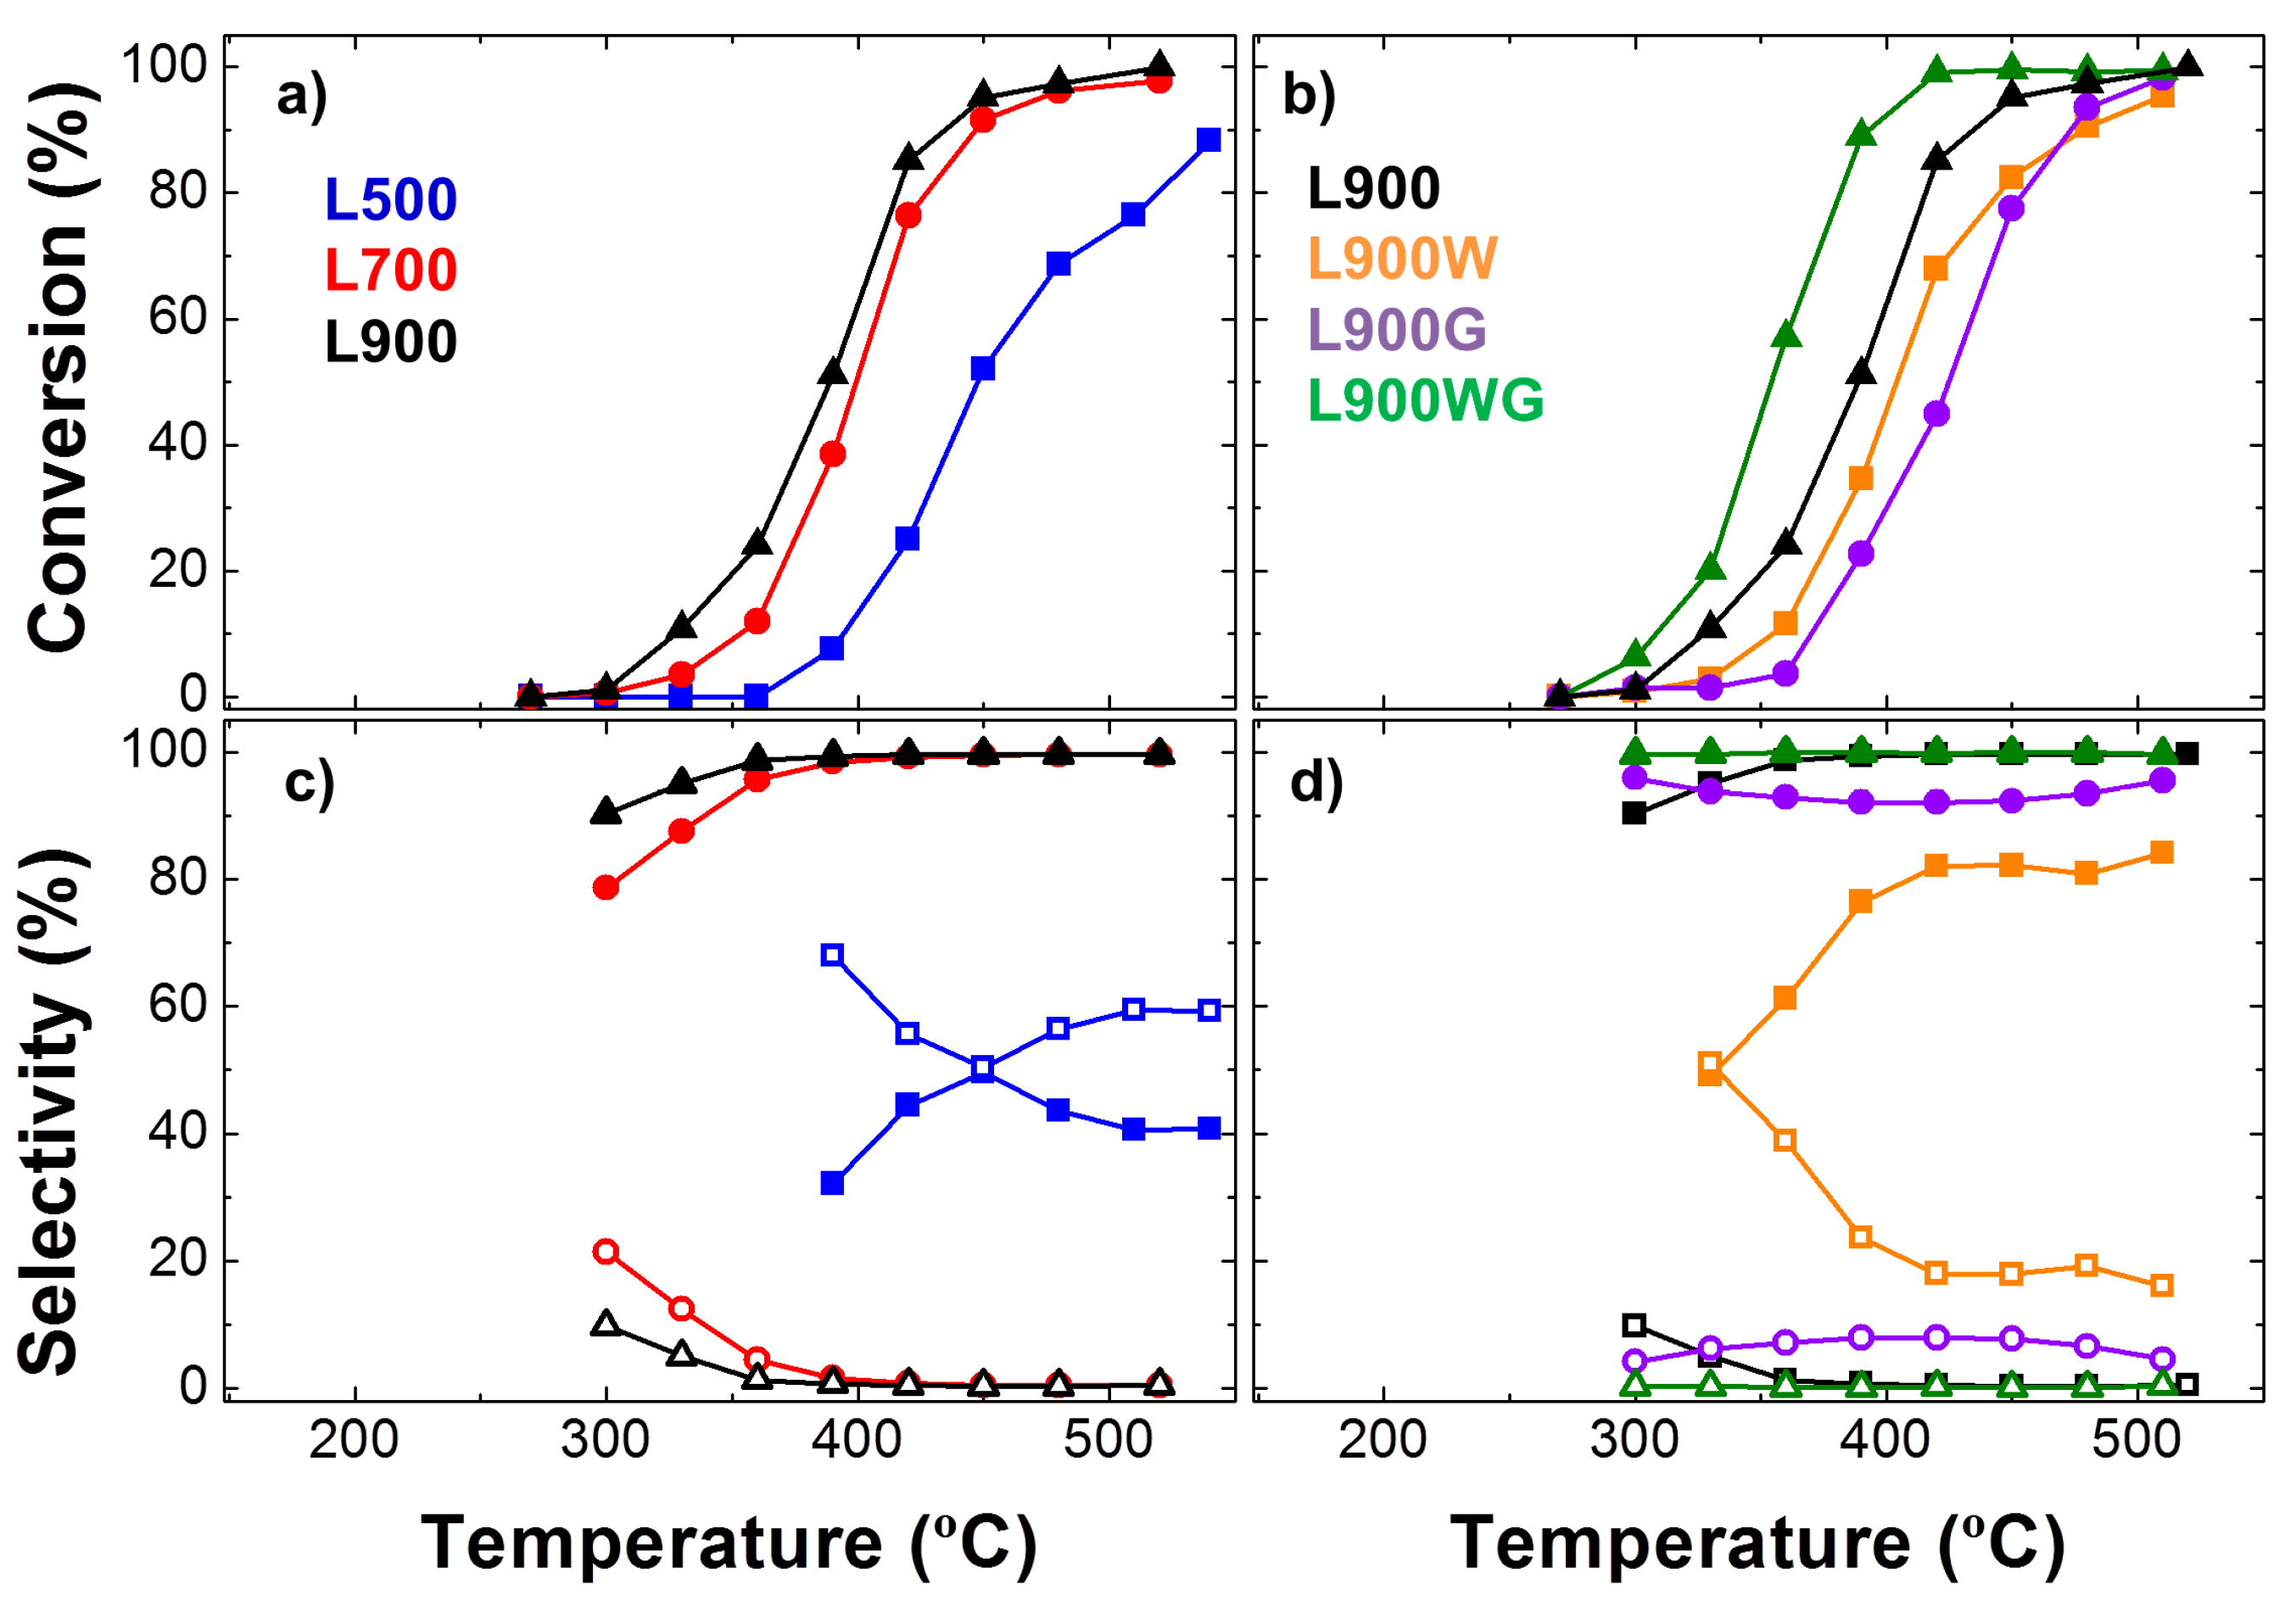
Alcohol molecules, mainly 2-propanol, are widely used for testing the acidic-basic character of heterogeneous catalysts [20,21]. In this sense, alcohol dehydrogenation products (aldehydes and ketones) are preferentially formed on basic catalysts, while dehydration products (olefins and ethers) are favored when acidic sites are present. Figure 6 shows the evolution of the steady-state conversions of 2-propanol and the selectivity to acetone and propylene with the temperature for all the carbon catalysts (Partial alcohol pressure: PoALC = 0.0185 atm; space time W/FoALC = 0.073 g s μmol−1). As expected, 2-propanol conversion increases with the reaction temperature. The increase of the carbonization temperature produces an enhancement of the steady-state conversions, showing the catalyst carbonized at 900 °C as the highest steady-state conversions of the three chars. On the other hand, the series of the carbon catalysts prepared at 900 °C (Figure 6b) follows the sequence L900WG > L900 > L900W > L900G. The most active catalysts correspond to the carbon with the highest development of porosity and a high dispersion of Na, meanwhile the catalyst L900G presents quite a low apparent surface area and a poor dispersion of sodium, as evidenced the SEM-EDX analyses.
The main product is acetone in most of the carbon catalysts, obtained as 2-propanol dehydrogenation product. However, the catalyst L500 and to a lesser extent L900W also yield an important amount of propylene, indicating the presence of both acid and basic surface sites. Furthermore, most of samples carbonized at 900 °C, showing selectivity to acetone higher than 95% at reaction temperatures higher than 350 °C.
In this sense, the hydrogen atom on the hydroxyl group of alcohols is acidic in the presence of basic catalysts and/or basic sites. So, the interaction between a basic site (for example, quinone groups present in these catalysts, especially in L900WG) and an alcohol molecule causes the abstraction of the proton from the -OH group, forming a surface alkoxide intermediate. The following abstraction of a Hα or Hβ from the corresponding alkoxide intermediate leads to ketone or alkene formation, respectively; the latter is less favored.
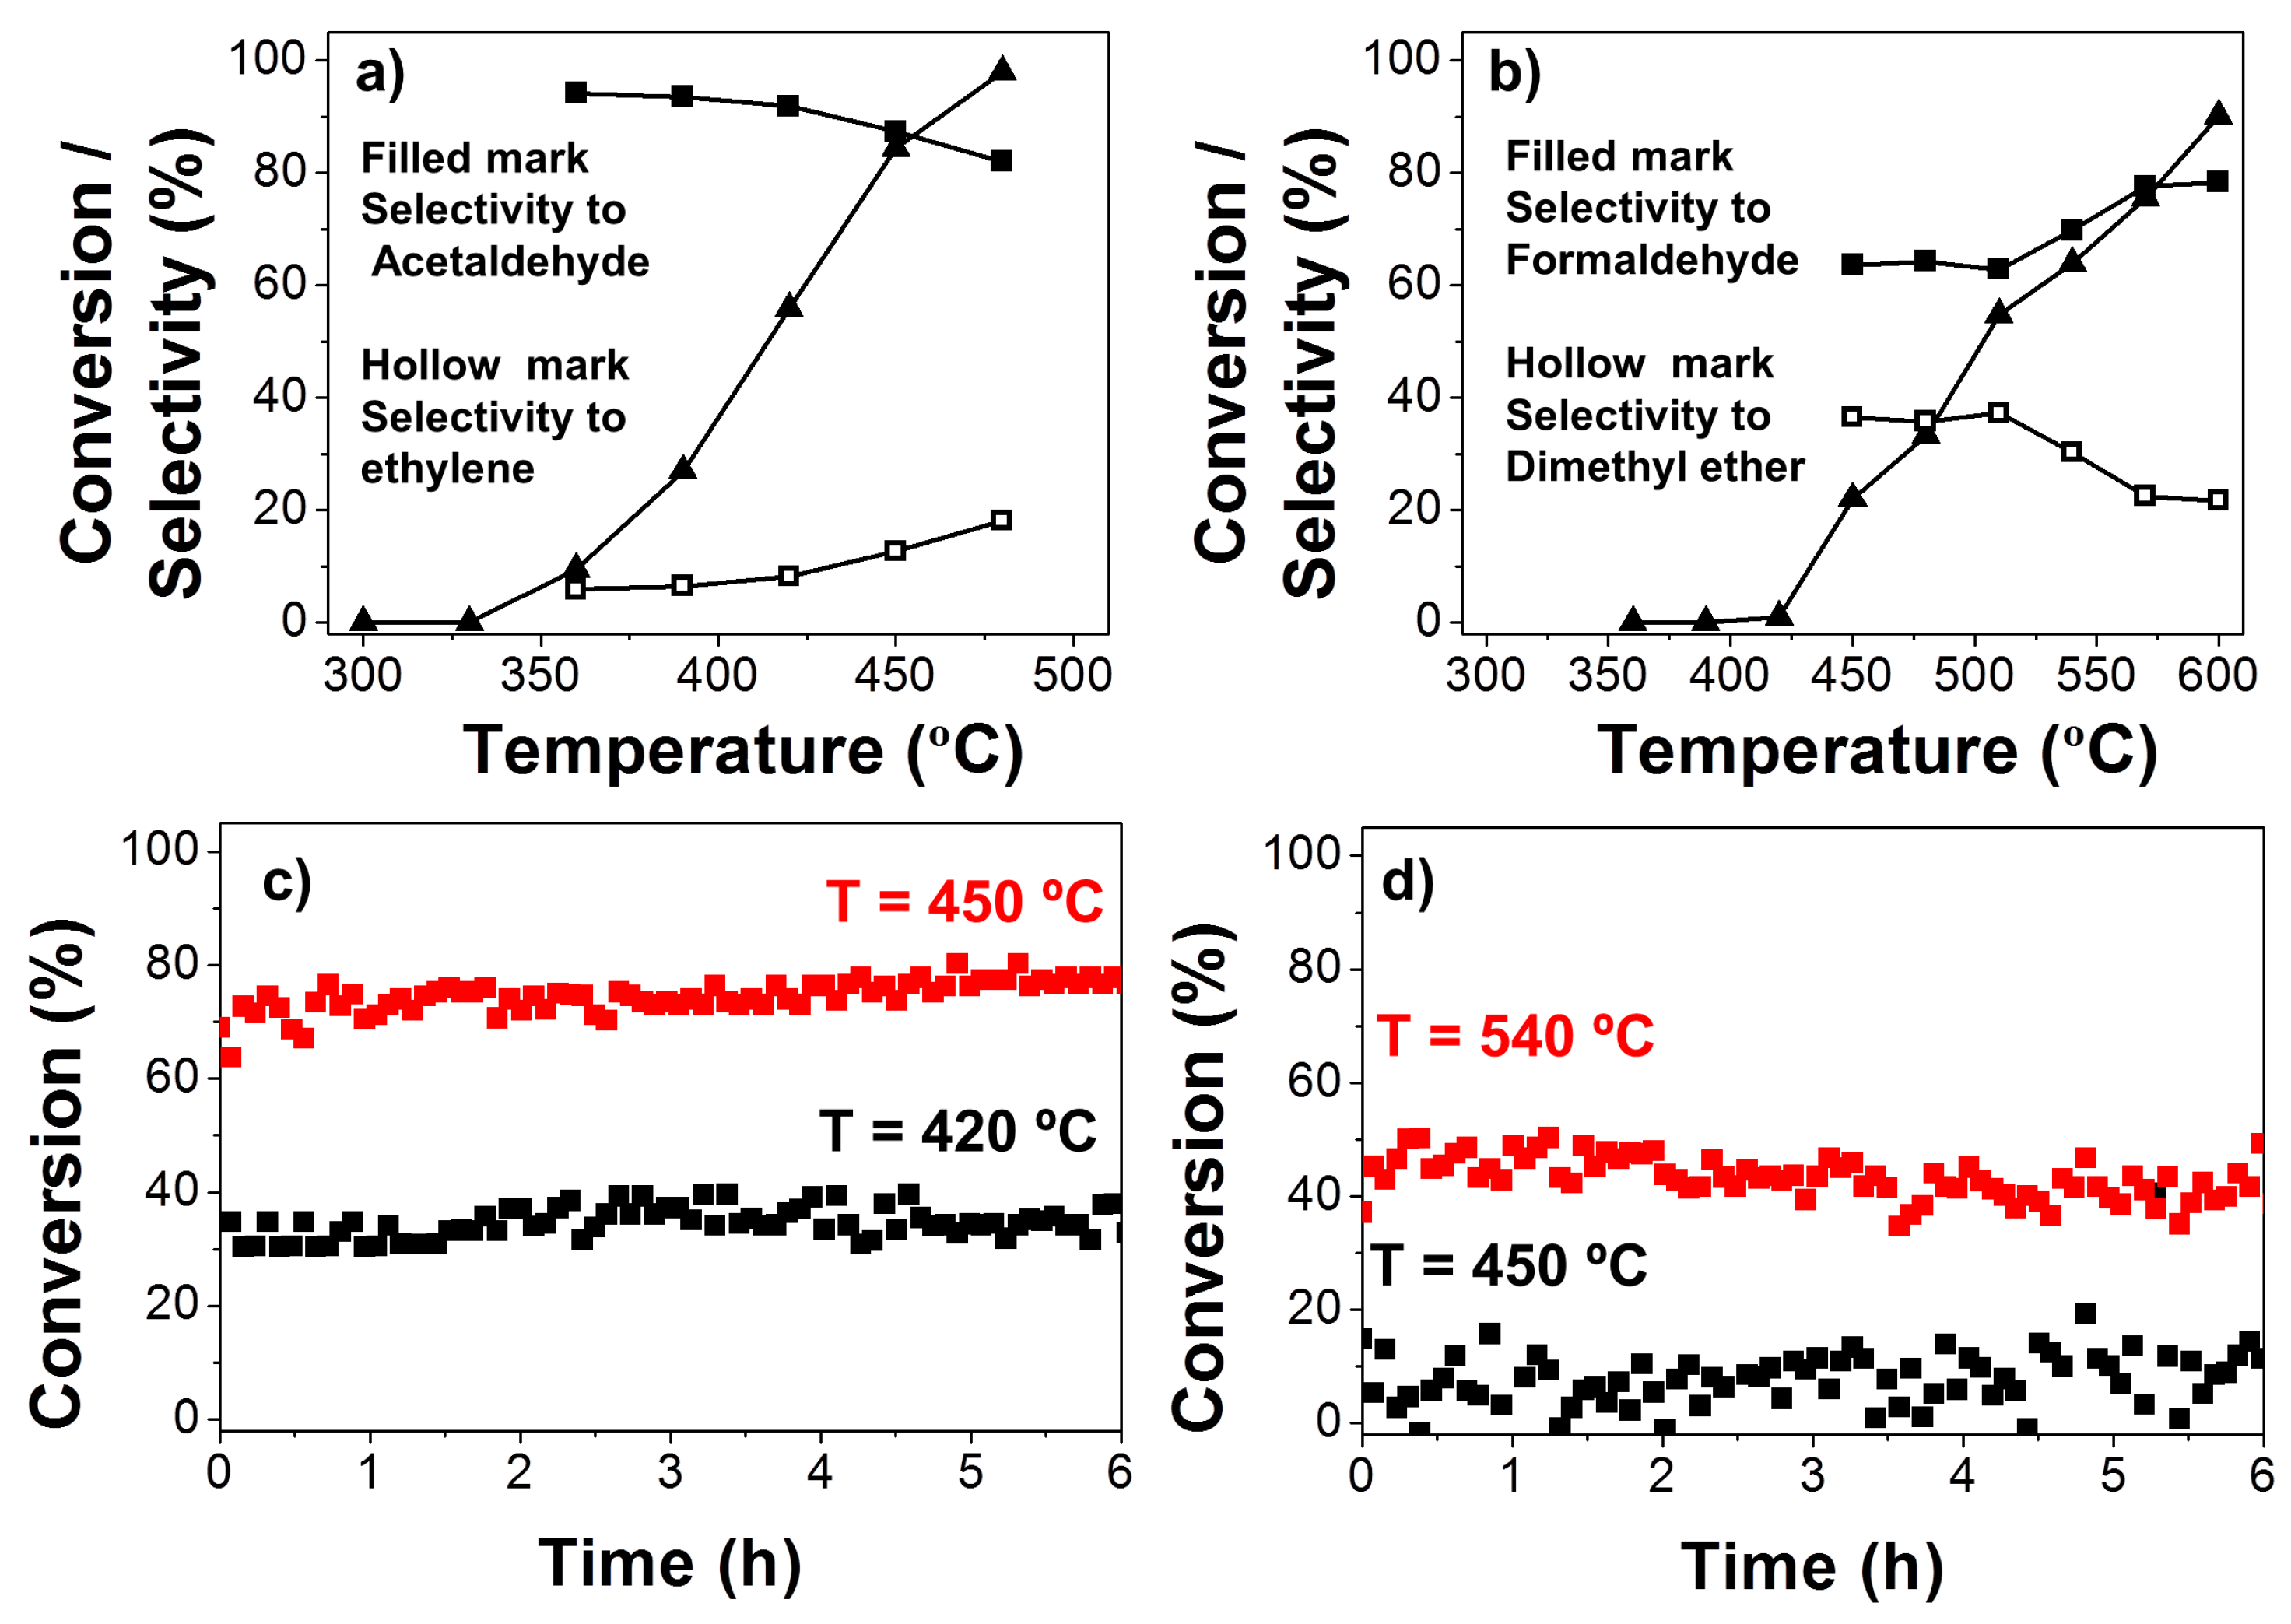
Decomposition of ethanol and methanol was also evaluated for the carbon catalyst more active in the 2-propanol decomposition of L900WG. Figure 7 shows the evolution of the steady-state conversions of ethanol (a) and methanol (b). Furthermore, the selectivity to aldehydes (filled marks) and to ethylene and dimethyl ether (hollow marks) was also included as a function of the reaction temperature in a helium flow (PoALC = 0.0185 atm; W/FoALC = 0.073 g s μmol−1). Although the conversions observed for these catalysts were not as high as some reported in the literature [32,33,34], selectivity of ethanol to acetaldehyde was higher than 80% in the whole range of conversions studied, values considerably larger than those obtained by those authors. In addition, our catalyst was obtained from a renewable source by a cheap and easy synthesis method. The stability of this catalyst for the ethanol conversion was also evaluated at two different temperatures: 420 and 450 °C (Figure 7c). The catalyst showed the same activity along the experiment, with the same selectivity toward acetaldehyde.
With regard to methanol, conversions were comparable to those reported in the literature [35,36]. The selectivity to formaldehyde increased gradually with temperature and reached a maximum (approximately 80%) at the highest temperature studied, which is near the commercial operation temperature. At the lowest temperatures (<475 °C), methanol was mainly dehydrated to dimethyl ether, making the yield of olefins (propylene or butenes) very low. The possible deactivation of the catalyst was also analyzed for 6 h at 450 and 540 °C. The conversion remained the same during this reaction time.
In general, the selectivity of ethanol and methanol to acetaldehyde and formaldehyde, respectively, were lower than those observed for 2-propanol to acetone. Specifically, the formation of alkene was higher when ethanol was used versus 2-propanol, due to the chemical similarities of Hα and Hβ to ethanol. In the case of methanol, there is a competition between the nucleophilic substitution to yield dimethyl ether (DME) and the abstraction of Hα, which is slower as it is less favored than in higher alcohols.
3. Materials and Methods
3.1. Catalyst Preparation
Sodium-lignosulphonate powder with high purity derived from wood (L), as lignocellulosic raw material, was supplied by Sappi Biotech GmbH, Stockstadt, Germany. This type of Kraft lignin has the typical proximate analyses (carbon fixed: 30.8%; volatile content: 52.3%; ash content: 16.9%). The precursor was submitted to a carbonization treatment at different temperatures between 500 and 900 °C under a continuous N2 flow (150 cm3 min−1). The carbon material obtained at 900 °C was then washed with distillated water at 60 °C, until a constant pH was reached, to remove part of the inorganic matter. The nomenclature used for the carbon based catalysts was L followed by a number referring to the carbonization temperature (500, 700, and 900 °C, respectively), and W in the case of the sample washed. The carbon materials obtained at 900 °C, L900, and L900W, were also partially gasified under a continuous CO2 atmosphere (150 cm3 min−1) at 750 °C for 30 min, which gave rise to the corresponding samples, named as L900G and L900WG, respectively.
3.2. Catalyst Characterization
The porous texture of the catalysts was characterized by N2 adsorption-desorption at −196 °C and CO2 adsorption at 0 °C, using a Micromeritics ASAP2020 apparatus (Micromeritics Instrument Corp., Norcross, GA, USA). Samples were previously outgassed for 8 h at 150 °C under vacuum. The apparent surface area (ABET) was calculated using the BET equation from the N2 adsorption-desorption isotherm, besides, micropore volume (Vt) and external surface area (At) were determined by using the t-method. Mesopore volume (Vmes) was calculated as the difference between total pore volume (Vtot) at P/P0 = 0.95 and micropore volume. The Dubinnin-Radushkevich equation was used for the calculation of micropore volume and specific surface area from the CO2 isotherm (VDR and ADR respectively).
The surface chemistry was analyzed by X-ray photoelectron spectroscopy (XPS) analysis (Physical Electronics Inc., Chanhassen, MN, USA) and by temperature-programmed desorption (TPD) experiments. XPS analyses were carried out in a Phi 5700 model Physical Electronics apparatus with AlKα radiation (1486.6 eV). The C1s peak position was set at 284.5 eV and used as a reference to locate the other peaks. TPD experiments were carried out in a customized quartz fixed-bed reactor placed inside an electrical furnace. CO and CO2, as output gases, were measured by a non-dispersive infrared (NDIR) gas analyzer, Siemens ULTRAMAT 22 (Siemens AG, Munich, Germany). Eighty mg of dry carbon sample was heated from room temperature to 930 °C at a heating rate of 10 °C min−1 under N2 flow (200 cm3 min−1).
Catalyst particle morphology was studied by Scanning Electron Microscopy (SEM) (JEOL USA, Inc., Pleasanton, CA, USA), using a JSM 6490LV JEOL microscope working at 25 kV. The atomic distribution of the particle surfaces was analyzed in a FEI Quanta 250 FEG Scanning Electron Microscope equipped with energy-dispersive X-ray analyses (SEM-EDX) (Thermo Fisher Scientific, Hillsboro, OR, USA).
3.3. Alcohol Dehydration
The activities of the catalysts were measured by the decomposition of alcohols performed at atmospheric pressures, in a quartz fixed bed microreactor (4 mm i.d.) (Alba Nueva Científica S.A., Alhaurín de la Torre, Málaga, Spain) placed inside a vertical furnace with temperature control, using 100 mg of catalyst (200–400 µm particle size). Alcohols were fed into the system in a controlled way by using a syringe pump (Cole-Parmer® 74900-00-05 model (Cole-Parmer Instrument Company, LLC., Vernon Hills, IL, USA)) and the helium flow adjusted to obtain, in each case, a total inlet stream of 100 cm3 STP min−1. To avoid condensation of alcohol or any reaction product, all lines were heated up to 130 °C. The space time used was W/FoAlcohol = 0.073 g s·µmol−1. Reactant and product concentrations were measured by gas chromatography (490 micro-GC equipped with PPQ, 5A molsieve, and Wax columns, Agilent Technologies, Santa Clara, CA, USA).
The alcohol conversion was defined as the ratio of the amount of alcohol converted to the amount of alcohol supplied to the reactor. The selectivity (in mol %) was defined as the molar ratio of a specific hydrocarbon product to all the hydrocarbon products formed. The carbon balance was reached with an error lower than 3%.
4. Conclusions
The properties of lignin and its potential as a renewable source make it an ideal precursor for carbon products. Most of the lignin in the world is produced as a by-product in the pulp and paper industry, with the most obtained from the Kraft process. The black liquors in Kraft pulp production plants, from which carbons are obtained, are alkaline solutions. The evaporation of these black liquors yields solid lignin with a high content of sodium compounds, such as sodium hydroxide, sulfate, and lignosulfonate.
The carbonization of this lignin produces chars with a high content of oxygen surface groups, as a consequence of the oxidation of carbon and the reduction of the sulfur salts to sulfide. The oxygenated groups are mainly quinone, carbonyl, and carbonate (sodium carbonate). The washing of these chars partially removes the sodium sulfide and, to a lesser extent, the sodium carbonate. Meanwhile, the gasification with CO2 developed the porosity in the washed sample. The surface of the carbon shows a basic character with carbonyl and quinone groups and carbon basal planes (with high electron density), which can act as electron donor sites.
The carbon materials obtained were evaluated as catalysts for the alcohol decomposition. The catalytic test of 2-propanol decomposition supported the strong basic character of these catalysts, as alcohol was selectively transformed into acetone. Once the basic character was established, the catalyst with the highest activity, L900WG, was evaluated for the ethanol and methanol decomposition. The results of conversions were not as high as expected. However, the selectivity of the catalyst was higher than 80%, yielding acetaldehyde and formaldehyde. Finally, the stability of the catalyst was also analyzed for 6 h. The conversion and selectivity for both alcohols remained the same during this reaction time.
Acknowledgments
This work was supported by the Spanish Ministry of Economy and Competitiveness under the CTQ2015-68654-R project. The authors would like to thank the Servicio Central de Apoyo a la Investigación (SCAI) of University of Málaga for the porous texture, XPS, and SEM/TEM analysis.
Author Contributions
The authors F.J.G.M., I.M., and J.M.R. provided substantial contributions to the catalysts preparation, acquisition, interpretation, and analysis of data, as well as to the drafting of the work. A.B., J.R.M., and T.C. designed the research presented and contributed to its critical revision for important intellectual content.
Conflicts of Interest
The authors declare no conflict of interest.
References
- Chen, H.Z. Biotechnology of Lignocellulose: Theory and Practice; Chemical Industry Press: Beijing, China; Springer: Dordrecht, The Netherlands, 2014; ISBN 978-9-4-0076897-0. [Google Scholar]
- Production of Biofuels and Chemicals from Lignin; Zhen, F.; Richard, L.S., Jr. (Eds.) Springer: Berlin, Germany, 2016; ISBN 978-981-10-1964-7. [Google Scholar]
- Handbook of Composites from Renewable Materials, Structure and Chemistry; Vijay, K.T.; Manju, K.T.; Michael, R.K. (Eds.) Wiley: Hoboken, NJ, USA, 2017. [Google Scholar]
- Rosas, J.M.; Berenguer, R.; Valero-Romero, M.J.; Rodriguez-Mirasol, J.; Cordero, T. Preparation of different carbon materials by thermochemical conversion of lignin. Front. Mater. 2014, 1, 1–17. [Google Scholar] [CrossRef]
- Rodríguez, J.J.; Cordero, T.; Rodríguez-Mirasol, J. Carbon Materials from Lignin and Their Applications. In Production of Biofuels and Chemicals from Lignin; Zh, F., Richard, L.S., Jr., Eds.; Springer: Berlin, Germany, 2016; Chapter 8; ISBN 978-981-10-1964-7. [Google Scholar]
- Rodríguez-Mirasol, J.; Cordero, T.; Rodríguez, J.J. Preparation and characterization of activated carbons from eucalyptus kraft-lignin. Carbon 1993, 31, 87–95. [Google Scholar] [CrossRef]
- Rodríguez-Mirasol, J.; Cordero, T.; Rodríguez, J.J. Activated carbons from CO2 partial gasification of eucalyptus kraft lignin. Energy Fuel 1993, 7, 133–138. [Google Scholar] [CrossRef]
- Gonzalez-Serrano, E.; Cordero, T.; Rodriguez-Mirasol, J.; Rodrıguez, J.J. Development of porosity upon chemical activation of kraft lignin with ZnCl2. Ind. Eng. Chem. Res. 1997, 36, 4832–4838. [Google Scholar] [CrossRef]
- Gonzalez-Serrano, E.; Cordero, T.; Rodriguez-Mirasol, J.; Cotoruelo, L.M.; Rodrıguez, J.J. Removal of water pollutants with activated carbons prepared from H3PO4 activation of lignin from kraft black liquors. Water Res. 2004, 38, 3043–3050. [Google Scholar] [CrossRef] [PubMed]
- Cotoruelo, L.M.; Marques, M.D.; Diaz, F.J.; Rodriguez-Mirasol, J.; Rodriguez, J.J.; Cordero, T. Adsorbent ability of lignin-based activated carbons for the removal of p-nitrophenol from aqueous solutions. Chem. Eng. J. 2012, 184, 176–183. [Google Scholar] [CrossRef]
- Bedia, J.; Rosas, J.M.; Rodriguez-Mirasol, J.; Cordero, T. Pd supported on mesoporous activated carbons with high oxidation resistance as catalysts for toluene oxidation. Appl. Catal. B Environ. 2010, 94, 8–18. [Google Scholar] [CrossRef]
- Guillen, E.; Rico, R.; Lopez-Romero, J.M.; Bedia, J.; Rosas, J.M.; Rodriguez-Mirasol, J.; Cordero, T. Pd-activated carbon catalysts for hydrogenation and Suzuki reactions. Appl. Catal. A Gen. 2009, 368, 113–120. [Google Scholar] [CrossRef]
- Rodríguez-Mirasol, J.; Cordero, T.; Rodriguez, J.J. High temperature carbons from lignin. Carbon 1996, 34, 43–52. [Google Scholar] [CrossRef]
- Valero-Romero, M.J.; Márquez-Franco, E.M.; Bedia, J.; Rodríguez-Mirasol, J.; Cordero, T. Hierarchical porous carbons by liquid phase impregnation of zeolite templates with lignin solution. Microporous Mesoporous Mater. 2014, 196, 68–78. [Google Scholar] [CrossRef]
- Ruiz-Rosas, R.; Valero-Romero, M.J.; Salinas-Torres, D.; Rodríguez-Mirasol, J.; Cordero, T.; Morallón, E.; Cazorla-Amorós, D. Electrochemical performance of hierarchical porous carbon materials obtained from the infiltration of lignin into zeolite templates. ChemSusChem 2014, 7, 1458–1467. [Google Scholar] [CrossRef] [PubMed]
- Lallave, M.; Bedia, J.; Ruiz-Rosas, R.; Rodriguez-Mirasol, J.; Cordero, T.; Otero, J.C.; Marquez, A.; Barrero, A.; Loscertales, I.G. Filled and hollow carbon nanofibers by coaxial electrospinning of Alcell lignin without binder polymers. Adv. Mater. 2007, 19, 4292–4296. [Google Scholar] [CrossRef]
- Ruiz-Rosas, R.; Bedia, J.; Lallave, M.; Loscertales, I.G.; Barrero, A.; Rodriguez-Mirasol, J.; Cordero, T. The production of submicron diameter carbon fibers by the electrospinning of lignin. Carbon 2010, 48, 696–705. [Google Scholar] [CrossRef]
- Berenguer, R.; García-Mateos, F.J.; Ruiz-Rosas, R.; Cazorla-Amorós, D.; Morallon, E.; Rodriguez-Mirasol, J.; Cordero, T. Biomass-derived binderless fibrous carbon electrodes for ultrafast energy storage. Green Chem. 2016, 18, 1506–1515. [Google Scholar] [CrossRef]
- García-Mateos, F.J.; Cordero-Lanzac, T.; Berenguer, R.; Morallón, E.; Cazorla-Amorós, D.; Rodríguez-Mirasol, J.; Cordero, T. Lignin-derived Pt supported carbon (submicron) fiber electrocatalystsfor alcohol electro-oxidation. Appl. Catal. B Environ. 2017, 211, 18–30. [Google Scholar] [CrossRef]
- Bedia, J.; Rosas, J.M.; Marquez, J.; Rodriguez-Mirasol, J.; Cordero, T. Preparation and characterization of carbon based acid catalysts for the dehydration of 2-propanol. Carbon 2009, 47, 286–294. [Google Scholar] [CrossRef]
- Bedia, J.; Ruiz-Rosas, R.; Rodríguez-Mirasol, J.; Cordero, T. A kinetic study of 2-propanol dehydration on carbon acid catalysts. J. Catal. 2010, 271, 33–42. [Google Scholar] [CrossRef]
- Bedia, J.; Ruiz-Rosas, R.; Rodríguez-Mirasol, J.; Cordero, T. Kinetic study of the decomposition of 2-butanol on carbon- based acid catalyst. AIChE J. 2010, 56, 1557–1568. [Google Scholar] [CrossRef]
- Rosas, J.M.; Bedia, J.; Rodríguez-Mirasol, J.; Cordero, T. On the preparation and characterization of chars and activated carbons from orange skin. Fuel Process. Technol. 2010, 91, 1345–1354. [Google Scholar] [CrossRef]
- Rodríguez-Reinoso, F.; Garrido, J.; Martín-Martínez, J.M.; Molina-Sabio, M.; Torregrosa, M. The combined use of different approaches in the characterization of microporous carbons. Carbon 1989, 27, 23–32. [Google Scholar] [CrossRef]
- Rosas, J.M.; Ruiz-Rosas, R.; Rodríguez-Mirasol, J.; Cordero, T. Kinetic study of the oxidation resistance of phosphorus-containing activated carbons. Carbon 2012, 50, 1523–1537. [Google Scholar] [CrossRef]
- Zhubrikov, A.V.; Legurova, E.A.; Gutkin, V.; Uvarov, V.; Khitrov, N.V.; Lev, O.; Tripol’skaya, T.A.; Prikhodchenko, P.V. XPS characterization of sodium percarbonate granulated with sodium silicate. Russ. J. Inorg. Chem. 2009, 54, 1455–1458. [Google Scholar] [CrossRef]
- Bansal, R.C.; Donnet, J.B.; Stoeckli, H.F. Active Carbon; Marcel Dekker: New York, NY, USA, 1988. [Google Scholar]
- Figueiredo, J.L.; Pereira, M.F.R.; Freitas, M.M.A.; Orfao, J.J.M. Modification of the surface chemistry of activated carbons. Carbon 1999, 37, 1379–1389. [Google Scholar] [CrossRef]
- Nevskaia, D.M.; Santianes, A.; Muñoz, V.; Guerrero-Ruiz, A. Interaction of aqueous solutions of phenol with commercial activated carbon: An adsorption and kinetic study. Carbon 1999, 37, 1065–1074. [Google Scholar] [CrossRef]
- Bedia, J.; Rodriguez-Mirasol, J.; Cordero, T. Water vapour adsorption on lignin-based activated carbons. J. Chem. Technol. Biotechnol. 2007, 82, 548–557. [Google Scholar] [CrossRef]
- Lillo-Ródenas, M.A.; Cazorla-Amorós, D.; Linares-Solano, A. Understanding chemical reactions between carbons and NaOH and KOH. An insight in to the chemical activation mechanism. Carbon 2003, 41, 267–275. [Google Scholar] [CrossRef]
- Bedia, J.; Barrionuevo, R.; Rodríguez-Mirasol, J.; Cordero, T. Ethanol dehydration to ethylene on acid carbon catalysts. Appl. Catal. B Environ. 2011, 103, 302–310. [Google Scholar] [CrossRef]
- Sato, A.G.; Volanti, D.P.; Meira, D.M.; Damyanova, S.; Longo, E.; Bueno, J.M.C. Effect of the ZrO2 phase on the structure and behavior of supported Cu catalysts for ethanol conversion. J. Catal. 2013, 307, 1–17. [Google Scholar] [CrossRef]
- Freitas, I.C.; Damyanova, S.; Oliveira, D.C.; Marques, C.M.P.; Bueno, J.M.C. Effect of Cu content on the surface and catalytic properties of Cu/ZrO2 catalyst for ethanol dehydrogenation. J. Mol. Catal. A Chem. 2014, 381, 26–37. [Google Scholar] [CrossRef]
- Qian, M.; Liauw, M.A.; Emig, G. Formaldehyde synthesis from methanol over silver catalysts. Appl. Catal. A Gen. 2003, 238, 211–222. [Google Scholar] [CrossRef]
- Ruiz-Rosas, R.; Bedia, J.; Rosas, J.M.; Lallave, M.; Loscertales, I.G.; Rodríguez-Mirasol, J.; Cordero, T. Methanol decomposition on electrospun zirconia nanofibers. Catal. Today 2012, 187, 77–87. [Google Scholar] [CrossRef]
Figure 1.
N2 adsorption-desorption isotherms at −196 °C of (a) the carbon catalysts obtained at different carbonization temperatures and (b) the series of carbons prepared at 900 °C. Micropore size distributions of (c) the carbon catalysts obtained at different carbonization temperatures and (d) the series of carbons prepared at 900 °C.

Figure 2.
SEM micrographs of the different carbon catalysts. (a) L500; (b) L700; (c) L900; (d) L900W; (e) L900G; (f) L900WG.
Figure 2.
SEM micrographs of the different carbon catalysts. (a) L500; (b) L700; (c) L900; (d) L900W; (e) L900G; (f) L900WG.

Figure 3.
(a) and (e) C1s, (b) and (f) O1s, (c) and (g) S2p, and (d) and (h) Na1s spectra of the different carbon catalysts at different temperatures and carbon catalysts prepared at 900 °C, respectively.
Figure 3.
(a) and (e) C1s, (b) and (f) O1s, (c) and (g) S2p, and (d) and (h) Na1s spectra of the different carbon catalysts at different temperatures and carbon catalysts prepared at 900 °C, respectively.

Figure 4.
Sodium dispersion mapping from SEM equipped with energy-dispersive X-ray analyses (SEM-EDX) of the different carbon catalysts.
Figure 4.
Sodium dispersion mapping from SEM equipped with energy-dispersive X-ray analyses (SEM-EDX) of the different carbon catalysts.

Figure 5.
TPD profiles of the different carbon catalysts. (a,b) CO evolution; (c,d) CO2 evolution of different carbon catalysts.
Figure 5.
TPD profiles of the different carbon catalysts. (a,b) CO evolution; (c,d) CO2 evolution of different carbon catalysts.
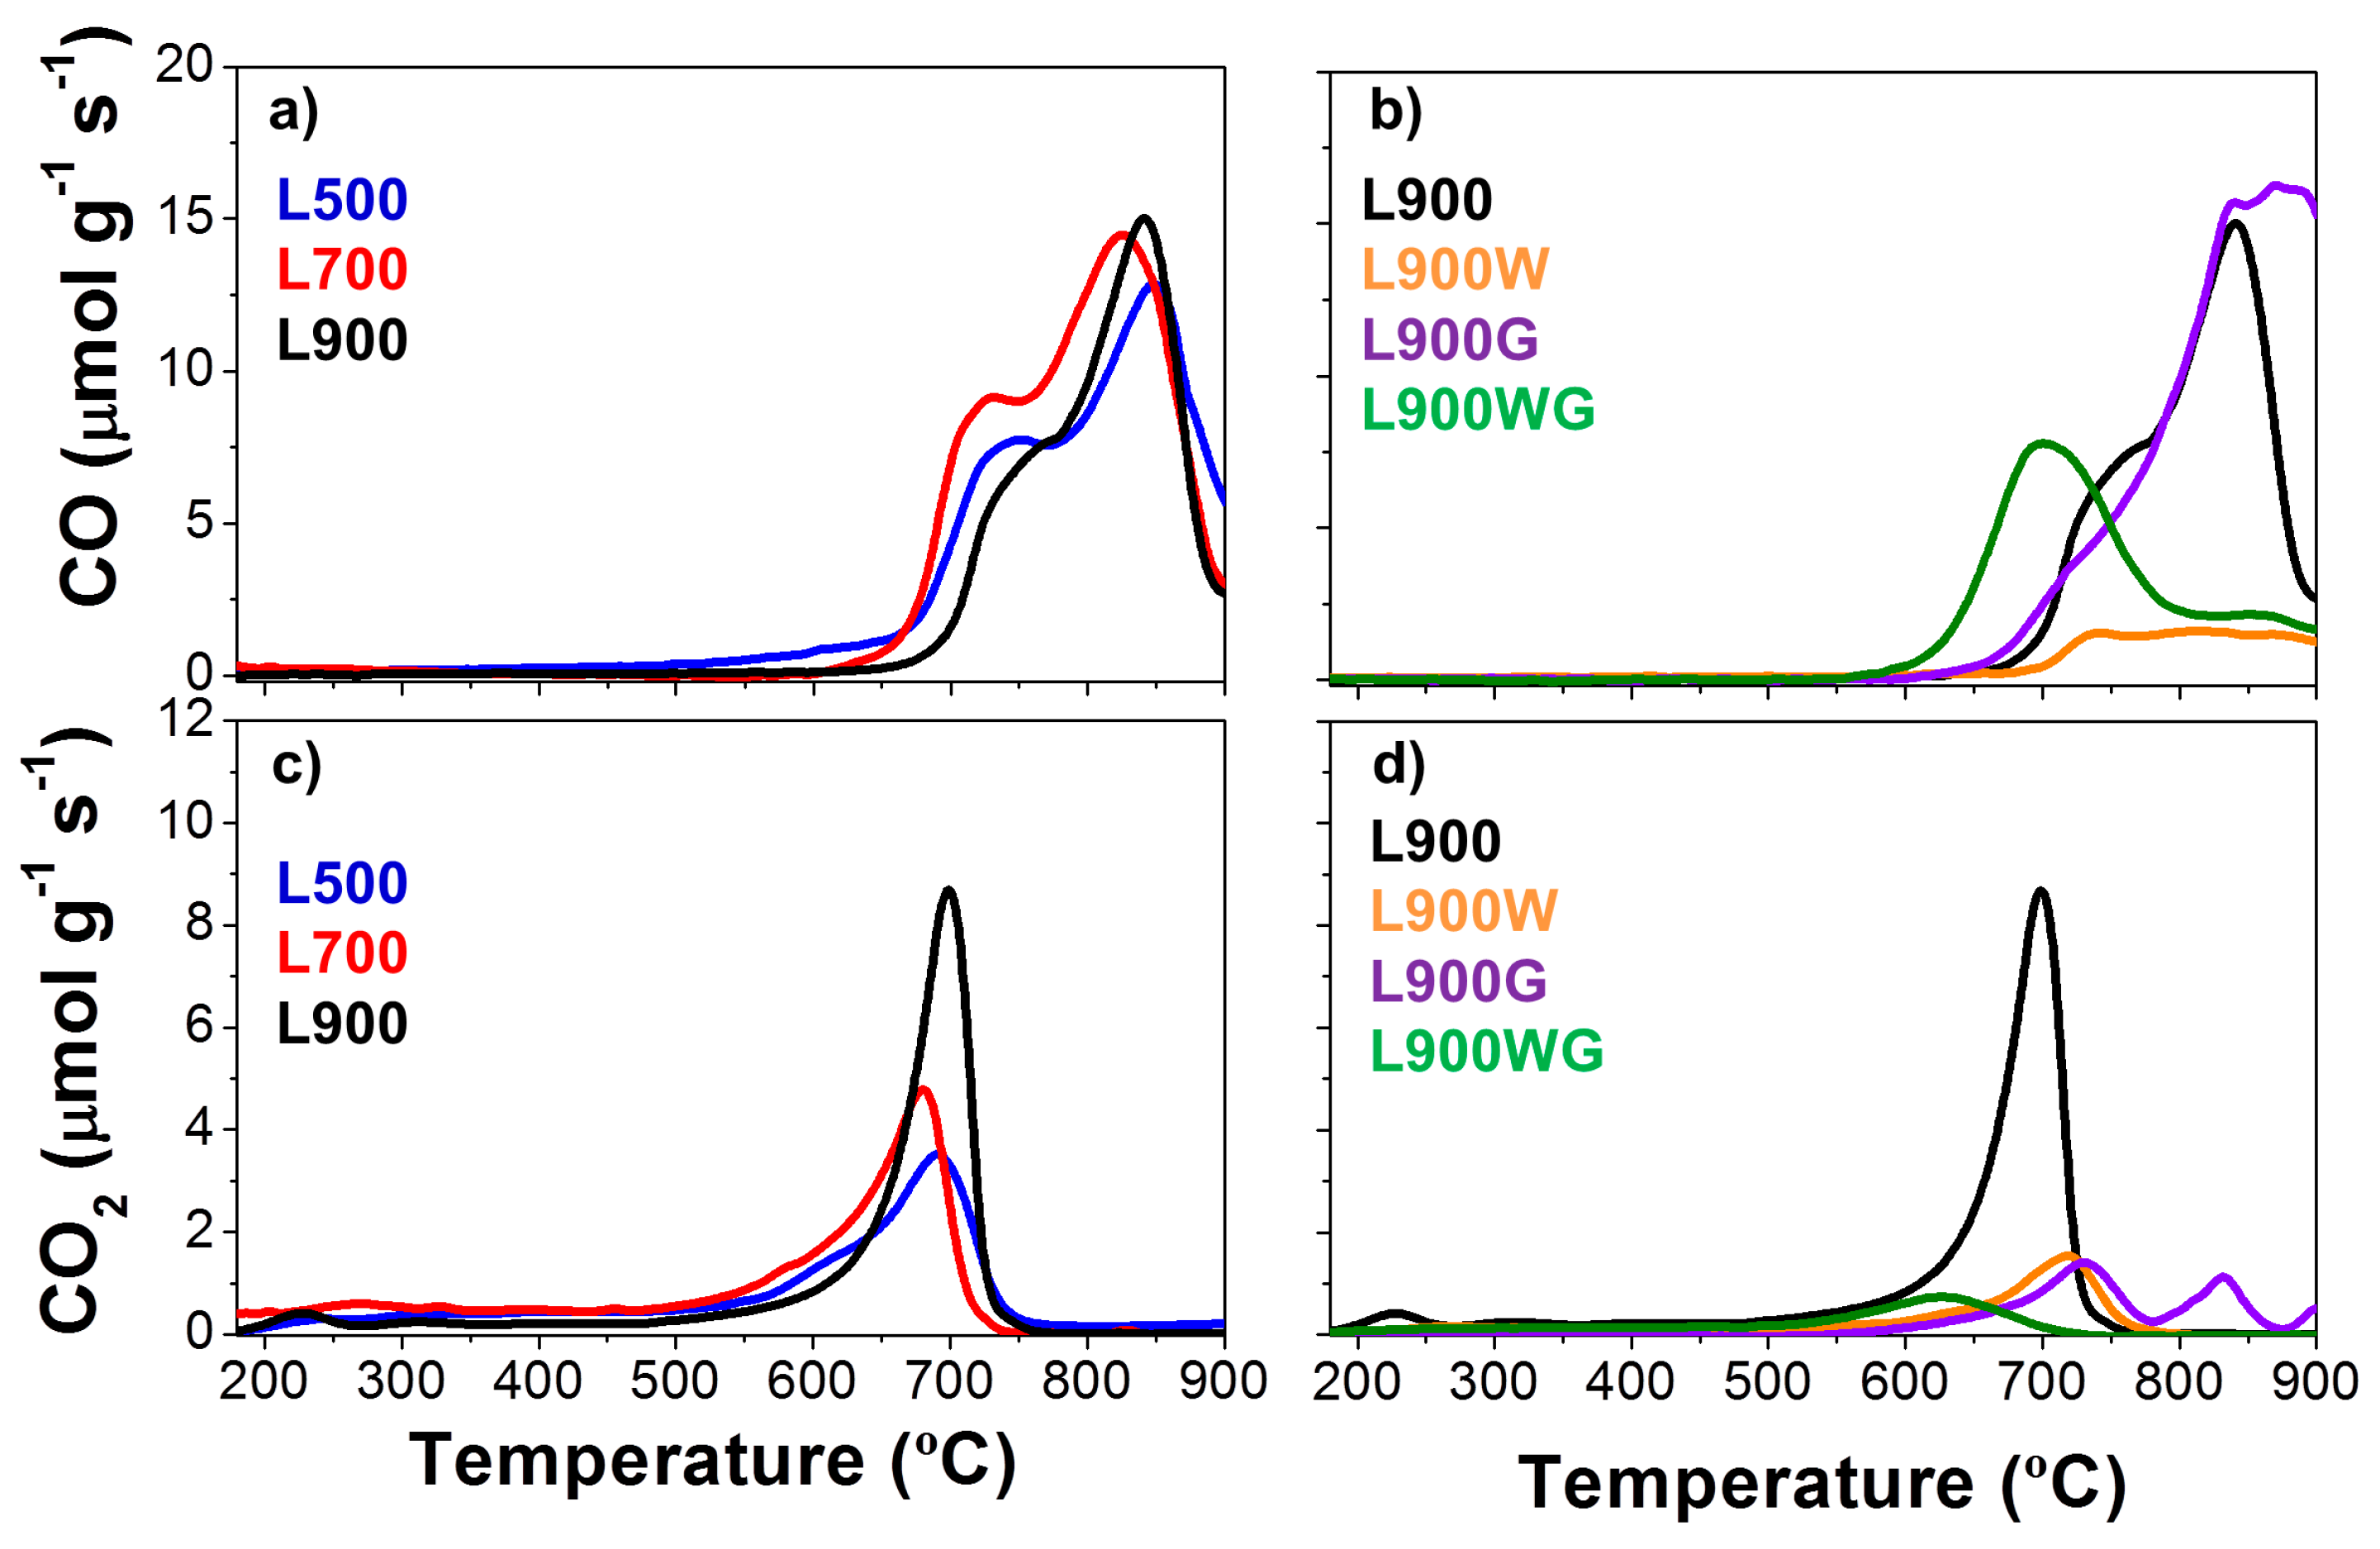
Figure 6.
Evolution of the steady-state conversions of 2-propanol (a,b) and selectivity to acetone (filled marks) and propylene (hollow marks) with the temperature (c,d) for all the carbon catalysts in a helium flow (PoALC = 0.0185 atm; W/FoALC = 0.073 g s μmol−1).
Figure 6.
Evolution of the steady-state conversions of 2-propanol (a,b) and selectivity to acetone (filled marks) and propylene (hollow marks) with the temperature (c,d) for all the carbon catalysts in a helium flow (PoALC = 0.0185 atm; W/FoALC = 0.073 g s μmol−1).

Figure 7.
Evolution of the steady-state conversions of ethanol (a) and methanol (b) and selectivity to aldehydes and ketones (filled marks) and olefins and ethers (hollow marks) with the temperature for all the carbon catalysts in a helium flow (PoALC = 0.0185 atm; W/FoALC = 0.073 g s μmol−1); ethanol (c) and methanol (d) conversions as a function of time on stream at different temperatures with PoALC = 0.0185 atm and W/FoALC = 0.073 g s μmol−1.

Table 1.
Ash content, preparation yields, and ultimate analyses of the different samples.
| Catalysts | Preparation Yields (%) | Ash (%) | Ultimate Analysis (d.a.f.) | ||||
|---|---|---|---|---|---|---|---|
| C (%) | H (%) | N (%) | S (%) | O* (%) | |||
| L | -- | 16.9 | 40.6 | 5.1 | 0.1 | 3.5 | 50.7 |
| L500 | 60.5 | 28 | 62.6 | 1.7 | 0.3 | 6.5 | 28.9 |
| L700 | 53.2 | 30 | 62.6 | 0.7 | 0.3 | 5.9 | 30.5 |
| L900 | 38.0 | 31 | 61.6 | 0.4 | 0.3 | 7.2 | 30.5 |
| L900W | 18.0 | 4 | 78.6 | 1.0 | 0.3 | 3.2 | 16.9 |
| L900G | 21.3 (B.O. 44%) | 44 | 31.8 | 1.2 | 0.2 | 0.0 | 66.8 |
| L900WG | 7.8 (B.O. 57%) | 8 | 76.6 | 0.4 | 0.2 | 0.4 | 22.3 |
d.a.f. = dry ash free basis; O*: by difference; B.O.: burn off.
Table 2.
Textural parameters obtained from N2 and CO2 isotherms at −196 °C and 0 °C, respectively, of all the carbon catalysts. ABET = apparent surface area; At = external surface area; Vt = micropore volume obtained from the N2 isotherm; Vtot = total pore volume; Vmes = mesopore volume; ADR = specific surface area from the CO2 isotherm; VDR = micropore volume derived from the CO2 isotherm.
| Catalysts | N2 Isotherm | CO2 Isotherm | |||||
|---|---|---|---|---|---|---|---|
| ABET (m2 g−1) | At (m2 g−1) | Vt (cm3 g−1) | Vtot (cm3 g−1) | Vmes (cm3 g−1) | ADR (m2 g−1) | VDR (cm3 g−1) | |
| L500 | 2 | 2 | 0.000 | 0.005 | 0.005 | 214 | 0.086 |
| L700 | 8 | 3 | 0.002 | 0.026 | 0.024 | 173 | 0.069 |
| L900 | 30 | 12 | 0.009 | 0.059 | 0.050 | 48 | 0.019 |
| L900W | 528 | 83 | 0.194 | 0.474 | 0.280 | 471 | 0.189 |
| L900G | 48 | 46 | 0.002 | 0.140 | 0.138 | 18 | 0.007 |
| L900WG | 847 | 586 | 0.126 | 1.532 | 1.406 | 271 | 0.109 |
Table 3.
Mass surface concentration determined by X-ray photoelectron spectroscopy (XPS) analyses and amounts of CO and CO2 evolved with temperature during the temperature-programmed desorption (TPD) experiment for the different carbon catalysts.
Table 3.
Mass surface concentration determined by X-ray photoelectron spectroscopy (XPS) analyses and amounts of CO and CO2 evolved with temperature during the temperature-programmed desorption (TPD) experiment for the different carbon catalysts.
| Catalysts | XPS Surface Composition (wt %) | TPD | ||||
|---|---|---|---|---|---|---|
| C | O | S | Na | CO (mmol g−1) | CO2 (mmol g−1) | |
| L500 | 15.7 | 41.6 | 1.7 | 41.0 | 12.8 | 2.5 |
| L700 | 10.6 | 44.4 | 2.4 | 42.6 | 13.8 | 3.1 |
| L900 | 12.5 | 40.8 | 7.6 | 39.1 | 10.8 | 3.7 |
| L900W | 81.3 | 17.0 | 1.2 | 0.5 | 2.4 | 1.1 |
| L900G | 30.2 | 39.6 | 0.7 | 29.5 | 15.4 | 1.2 |
| L900WG | 79.9 | 12.0 | 2.1 | 6.0 | 6.9 | 0.8 |
© 2017 by the authors. Licensee MDPI, Basel, Switzerland. This article is an open access article distributed under the terms and conditions of the Creative Commons Attribution (CC BY) license (http://creativecommons.org/licenses/by/4.0/).
Share and Cite
MDPI and ACS Style
García-Mateos, F.J.; Moulefera, I.; Rosas, J.M.; Benyoucef, A.; Rodríguez-Mirasol, J.; Cordero, T. Alcohol Dehydrogenation on Kraft Lignin-Derived Chars with Surface Basicity. Catalysts 2017, 7, 308. https://doi.org/10.3390/catal7100308
AMA Style
García-Mateos FJ, Moulefera I, Rosas JM, Benyoucef A, Rodríguez-Mirasol J, Cordero T. Alcohol Dehydrogenation on Kraft Lignin-Derived Chars with Surface Basicity. Catalysts. 2017; 7(10):308. https://doi.org/10.3390/catal7100308
Chicago/Turabian StyleGarcía-Mateos, Francisco J., Imane Moulefera, Juana M. Rosas, Abdelghani Benyoucef, José Rodríguez-Mirasol, and Tomás Cordero. 2017. "Alcohol Dehydrogenation on Kraft Lignin-Derived Chars with Surface Basicity" Catalysts 7, no. 10: 308. https://doi.org/10.3390/catal7100308
Note that from the first issue of 2016, this journal uses article numbers instead of page numbers. See further details here.