Hydrogen Production via Water Dissociation Using Pt–TiO2 Photocatalysts: An Oxidation–Reduction Network
by
J. F. Guayaquil-Sosa
1, 
Alan Calzada
2,
Benito Serrano
2,
Salvador Escobedo
1 and
Hugo De Lasa
1,* 1
Faculty of Engineering, Chemical Reactor Engineering Centre (CREC), Western University, London, ON N6A 5B9, Canada
2
Unidad de Ciencias Químicas, Autonomous University of Zacatecas, Zacatecas, Zac 98000, México
*
Author to whom correspondence should be addressed.
Catalysts 2017, 7(11), 324; https://doi.org/10.3390/catal7110324
Submission received: 18 September 2017
/
Revised: 18 October 2017
/
Accepted: 18 October 2017
/
Published: 30 October 2017
(This article belongs to the Special Issue Photocatalytic Water Splitting)
Abstract
:Several TiO2 based semiconductors with different Pt loadings are prepared using incipient impregnation, wet impregnation and the sol-gel method. These photocatalysts are evaluated in the Photo-CREC-Water II Photoreactor for hydrogen production via water dissociation, using an organic renewable scavenger (ethanol). Results obtained show the influence of the photocatalyst preparation in the production of hydrogen and in the observed quantum yields. Furthermore, it is established that the reaction networks leading to hydrogen production, using various photocatalysts, share common features. This analysis is developed by both identifying and quantifying different chemical species and their changes with irradiation time. Key species in this oxidation–reduction network are hydrogen, hydrogen peroxide, ethanol, methane, ethane, acetaldehyde and carbon dioxide. On this basis, it is shown that under an inert gas atmosphere, ethanol consumption is sub-stoichiometric. This points towards simultaneous ethanol consumption and the formation of the ethanol scavenger.

1. Introduction
Heterogeneous photocatalysis is a technique based on the excitation of a semiconductor. Photons having enough energy can promote the transition of an electron from the valence band to the conduction band. In this way, a couple of electrical charges are generated: the electron (e−) and the hole (h+). It is in this promoted outer semiconductor particle surface site, where the various redox reactions are initiated [1,2,3,4]. Hydroxide ions (OH−) from dissociated water may react with electron holes (h+) yielding •OH radicals. These •OH radicals may be consumed by ethanol at 1.00–2.00% v/v concentrations. The efficiency of the photocatalytic process can be enhanced by the addition of so-called sacrificial reagents (i.e., ethanol, methanol) [5,6,7]. Ethanol is an attractive organic renewable scavenger that can be produced from sugars or agricultural waste fermentation processes at a low cost. Electrons may eventually react with protons (H+) to form H● radicals. H● radicals may dimerize, forming molecular hydrogen (H2).
Nowadays, TiO2 is the most widely used photocatalyst due to its photocatalytic activity, chemical stability in aqueous solutions and favourable band gap energy (3.20 eV in anatase) [5]. However, new materials such as modified TiO2 combined with noble metals are gaining importance in hydrogen production because of the reported reduced band gaps [1,2,6,7]. In 2005, Galinska et al. [4] performed photocatalytic water splitting over Pt–TiO2 (Degussa P25) using various sacrificial reagents under UV irradiation. Nevertheless, these authors did not report values for the quantum yield. Despite this progress, the value of doped noble metals on TiO2 semiconductors for hydrogen production has not yet been established and remains broadly unreported. To address this issue, this manuscript describes hydrogen formation via water splitting in a Photo CREC Water-II Reactor (PCW-II) using 2.00% v/v ethanol under inert gas. A diversity of Pt–TiO2 photocatalysts are evaluated, showing the criticality of the preparation method. This is important to achieve the 22% high quantum yield reported by Guayaquil-Sosa et al. [8]. We are not aware of comparable results reported in the technical literature until today.
Quantum Efficiencies
An assessment of photocatalyst performance can be established using quantum efficiency, as shown in Equation (1). This is the case for the conversion of organic species in both air and water.
In the case of hydrogen production, a Quantum Yield (QY) can be defined as the ratio between the number of generated chemical species molecules and the number of photons absorbed by the photocatalysts [8,9]:
or
where (a) the represents the rate of moles of formed hydrogen radicals at any time during the photocatalyst irradiation and (b) Pa is the number of moles of photons absorbed by the catalyst per unit of time. Additional details of the Pa calculation are provided in Appendix A.
Regarding the rate, it can be calculated by multiplying the slope of the cumulative hydrogen produced by 2. It has to be mentioned that, in this respect, Equation (2) applies to all the photocatalysts considered in the present study. Additional information regarding is given in Appendix C.
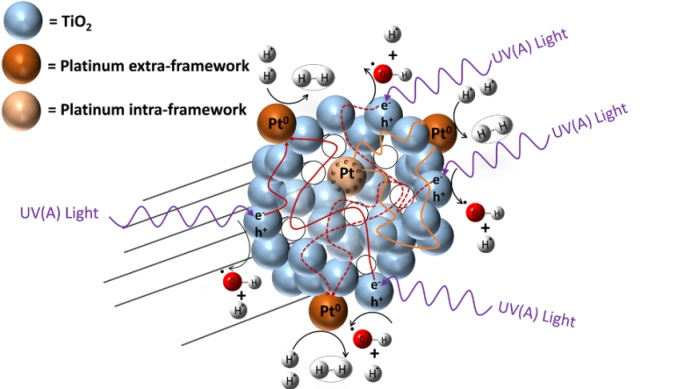
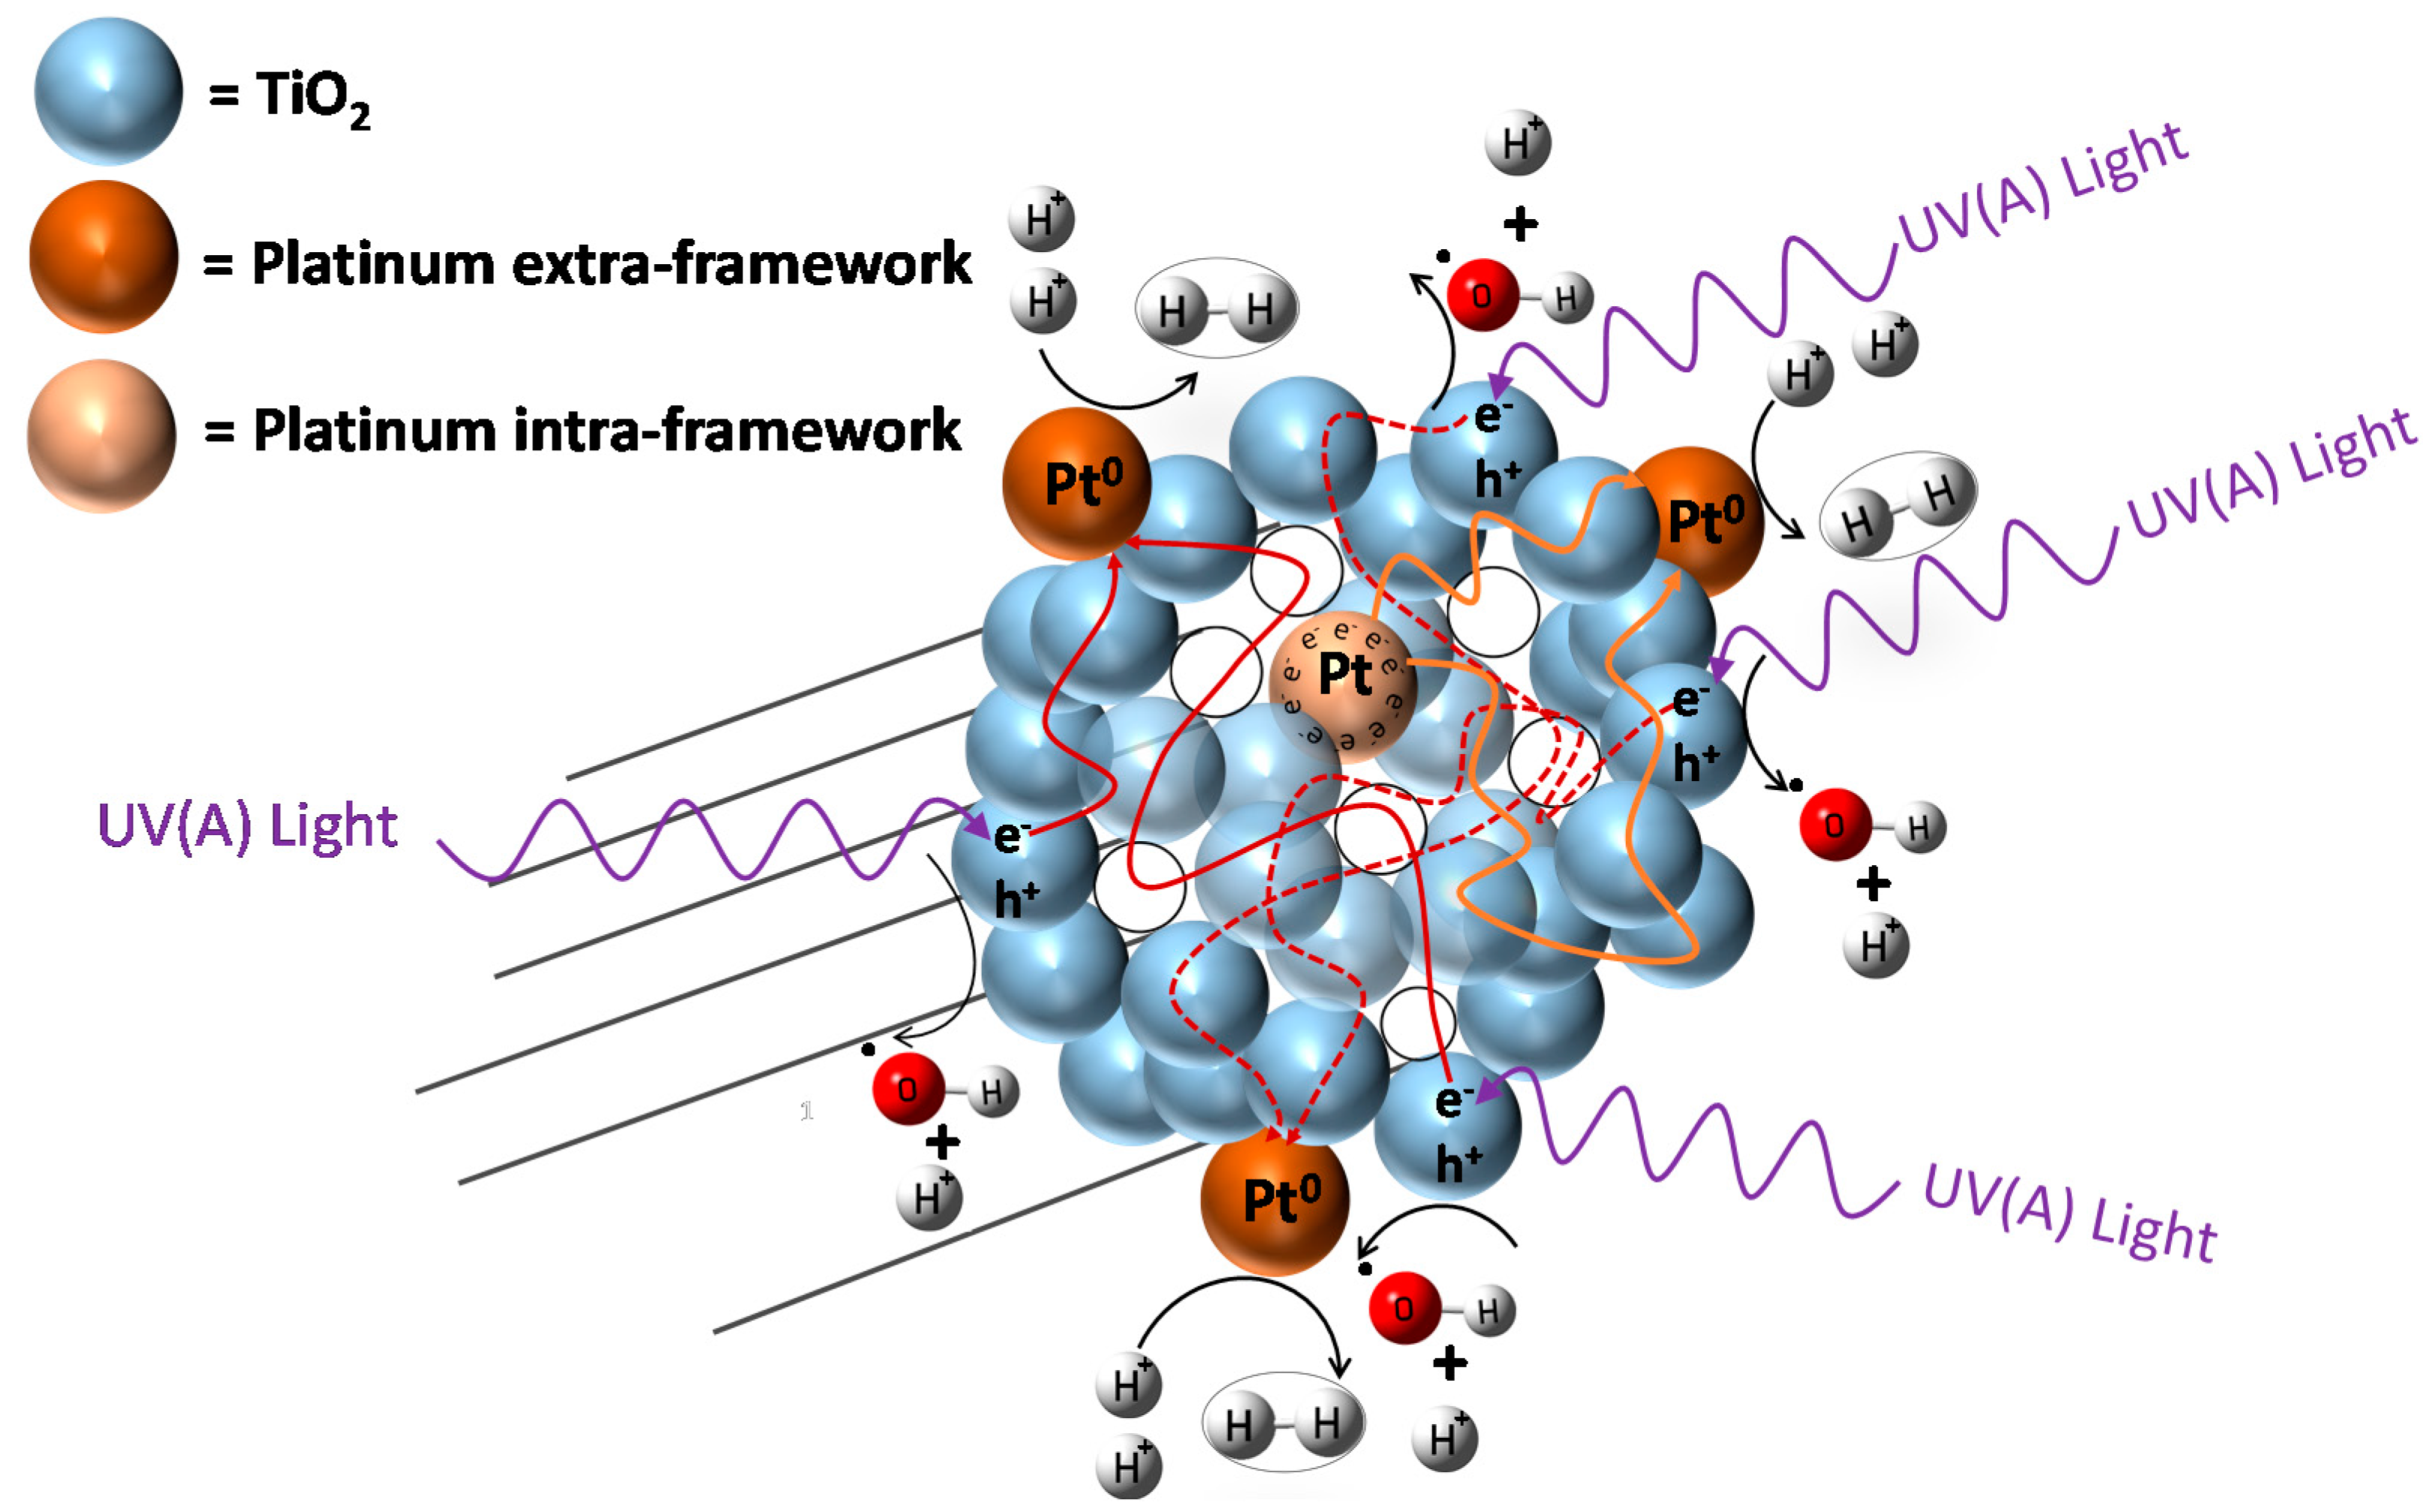
However, to favour hydrogen production with high quantum yields, one can provide additional electron sites (i.e., inner metal sites) as illustrated in Figure 1. These sites act as electron reservoirs on the photocatalyst inner surface. This approach for enhanced hydrogen production over mesoporous TiO2 doped with Pt was recently reported by Guayaquil-Sosa et al. [8].
2. Experimental Methods
The photocatalysts of the present study were doped with platinum using incipient impregnation, wet impregnation and a sol-gel method. Pt loadings were confirmed using XRF with deviations from nominal values not exceeding 10% in any case. The TiO2 semiconductors synthesized and doped with Pt exhibit a light grey colour for small Pt loadings (<1.00 wt %) and a dark grey colour for high Pt concentrations (>1.00 wt %). These photocatalysts were characterized using BET analysis, UV spectroscopy with diffuse reflectance, and X-ray diffraction (XRD). Furthermore, a near UV lamp was employed during the runs in the Photo-CREC-Water II Reactor. Various methodologies used for photocatalyst preparation as well as for hydrogen production experiments are described in the upcoming sections of this manuscript.
2.1. Photocatalyst Preparation of Pt/TiO2
2.1.1. Incipient Wetness Impregnation Method
An incipient wetness impregnation technique can be used to prepare a modified Pt–TiO2 photocatalyst [5]. The material utilized as a support was a Degussa P25 semiconductor of titanium dioxide (TiO2) from Evonik Degussa Co. (Essen, Germany). Platinum was added on the outer surface of the TiO2 particles by employing a 99.90 wt % H2PtCl6 xH2O reagent from Sigma-Aldrich Co. (St. Louis, MO, USA). Furthermore, the modified Pt–TiO2 photocatalyst was fully characterized as presented in Guayaquil-Sosa et al. [8]. This prepared material was used as a reference, for assessing the performance of two other synthesized photocatalysts of the present study.
2.1.2. Wet Impregnation Method
The wet impregnation method was developed by incorporating 2.00 g of Degussa P25 (TiO2) in a solution of 10.00 mL deionized water, under continuous stirring. The doping solution was prepared with a dihydrogen-dinitro-sulfate platinate solution (H2PtNO2SO4) at different concentrations. This was done to obtain platinum loadings on TiO2 in the 0.40–1.70 wt % range. This solution was added to the TiO2, and mixed for one hour. A reducing agent of 0.03 M of sodium borohydride (NaBH4) was then employed. The resulting solution was mixed for another 10 h. Then, the obtained solids were filtered, dried at 110 °C for 18 h, and finally calcined at 450 °C for 3 h.
2.1.3. Sol-Gel Method
Regarding this method, two different routes, labelled sol-gel A and sol-gel B, were developed.
Sol-Gel A
The synthesis of the sol-gel A was achieved using titanium(IV) isopropoxide (C12H28O4Ti, Sigma-Aldrich 97.00%), isopropanol (C3H7OH, J.T. Baker 99.90%), and dihydrogen dinitro-sulfate platinate(II). 70.00 mL of isopropanol reagent (organic solvent) was poured into a flask, under nitrogen bubbling flow. Then, the titanium(IV) isopropoxide was added dropwise. Once this step was completed, the resulting blend was mixed for 20 min to remove all the dissolved oxygen. Then, 7.50 mL of the dihydrogen dinitro-sulfate palatinate(II) solution were added dropwise. The resulting solution was allowed to stand for 20 min. H2Pt(NO2)2SO4 concentrations were carefully selected to obtain Pt loadings of 0, 0.40, 0.80 and 1.70 wt %. Finally, and to reduce platinum into its metal state, a 0.03 M of sodium borohydride (NaBH4) reducing solution was used. The prepared solution was placed in a 1200 W microwave unit for 30 min, at 215 °C and allowed to rest for 1 h. The resulting slurry was filtered and washed with distillate water. The obtained wet-paste was dried out at 110 °C for 18 h and later calcined at 450 °C for 3 h.
Sol-Gel B
The sol-gel B method first involves the dissolution of 2.00 g of Pluronic F127 in 40 mL of ethanol (CH3CH2OH) and 3.30 g of hydrochloric acid (37 wt % purity) as reported in Guayaquil et al. [8]. Once this is achieved, 0.63 g of citric acid were added and mixed continuously at room temperature for 2 h. When this step was completed, 2.85 g of titanium(IV) isopropoxide were added to the resulting blend. This method was used to prepare the mesoporous titanium dioxide. This sol-gel synthesis process gives a Pt loaded TiO2 with the following valuable properties: 150 m2/g of specific surface area, 10–40 nm pore sizes, 0.68 cm3/g pore volume, 100% anatase content, 10 nm Pt crystallite sizes and 45% metal dispersion.
2.2. Photocatalytic Reactor
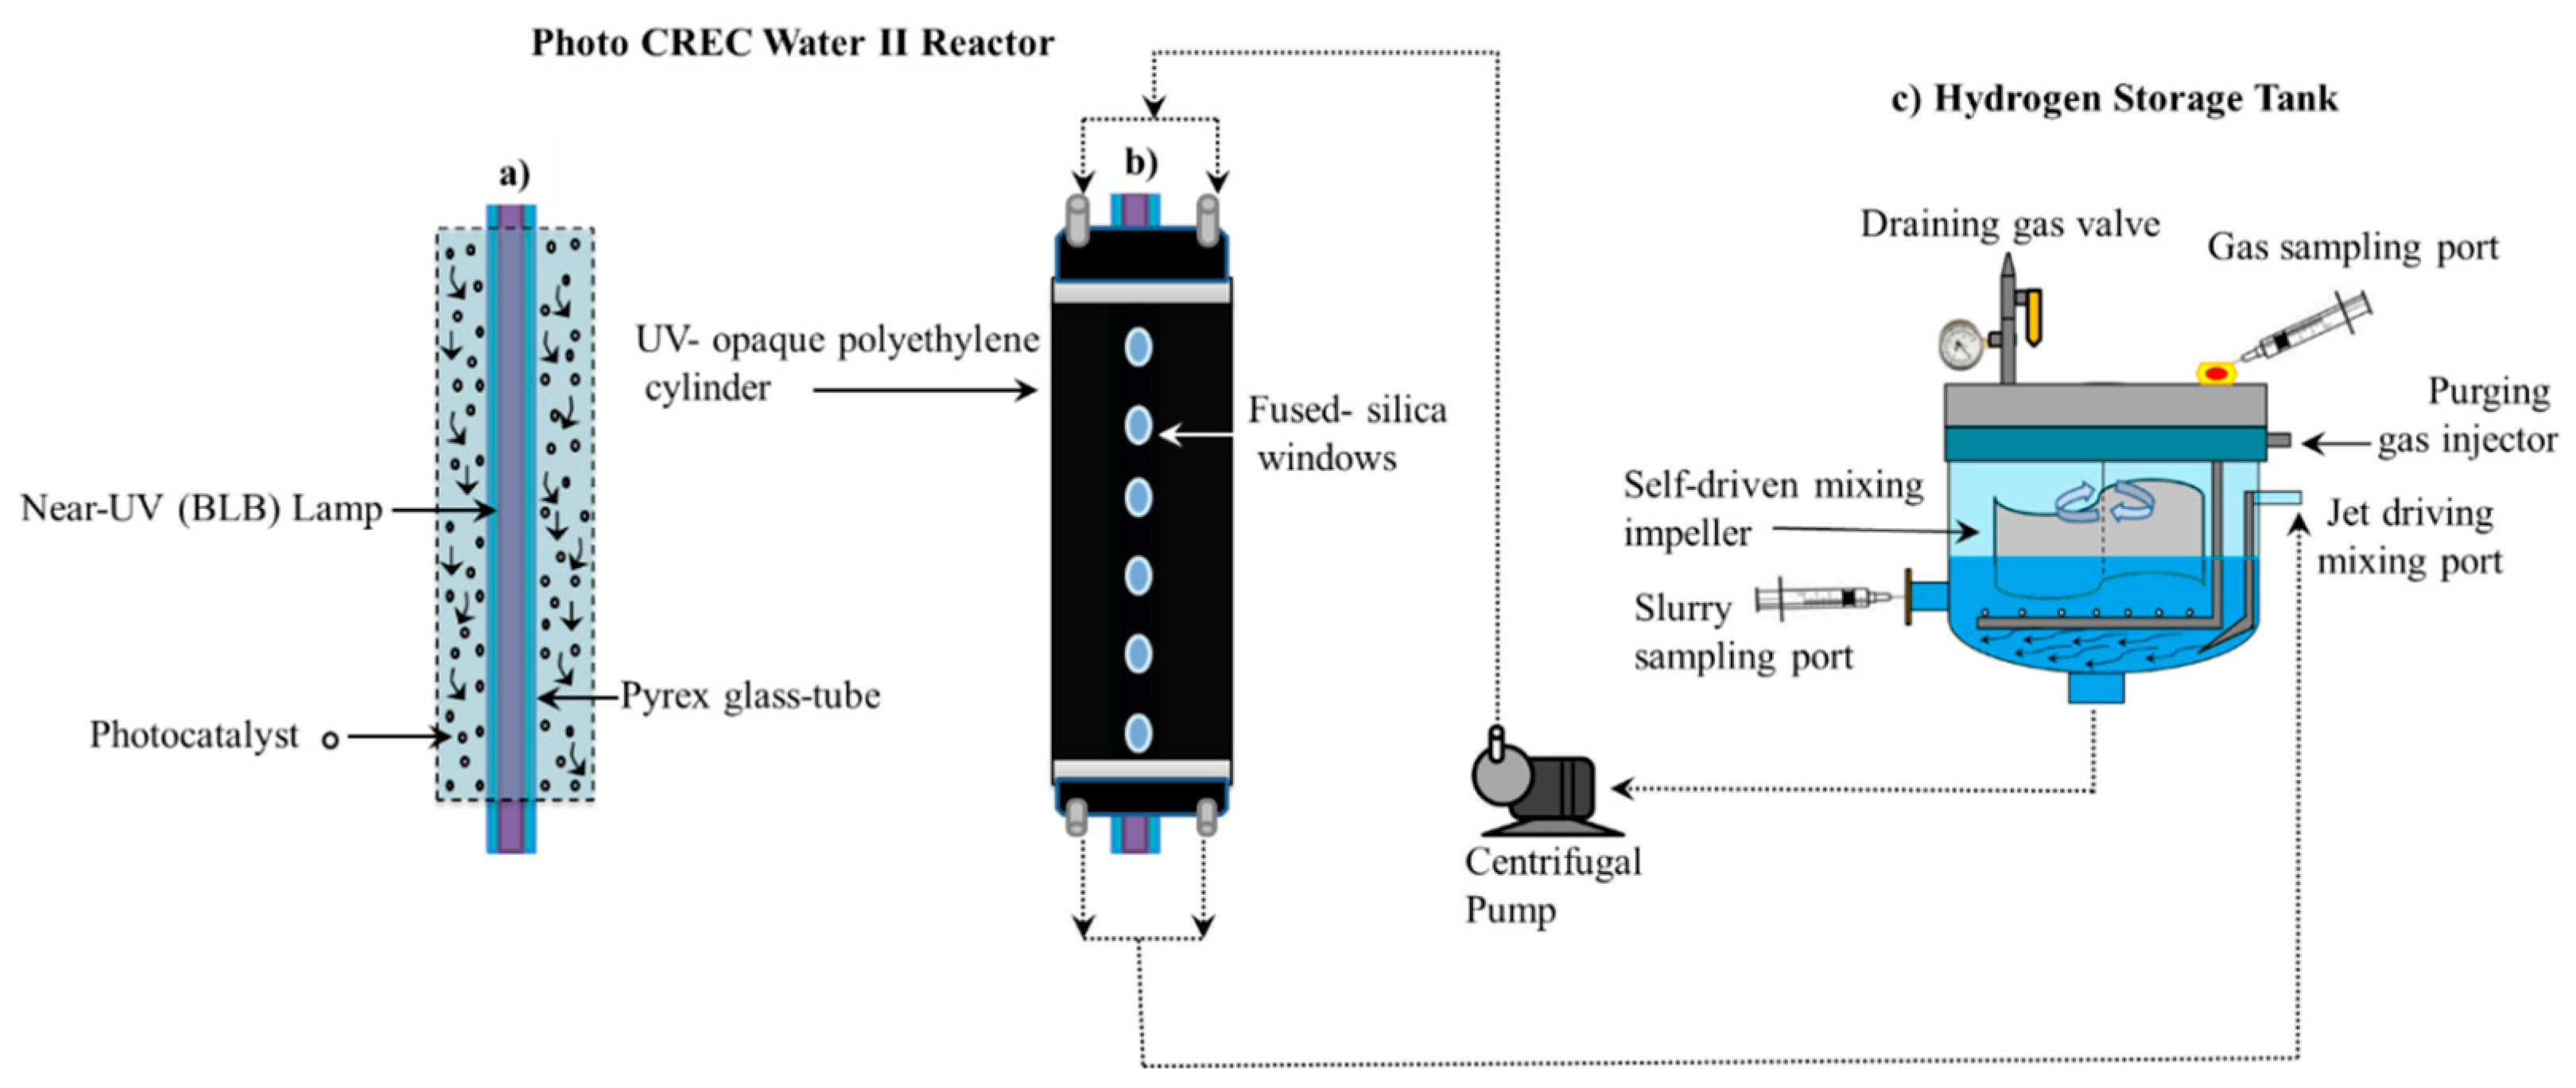
Figure 2 reports a schematic diagram of the Photo-CREC Water II Reactor and its accessories for hydrogen production used in the present study. This modified Photo-CREC Water II Reactor is a “well mixed” batch unit that produces hydrogen. Figure 2 shows the overall unit configuration: a sealed stirred tank chamber connected in series with a tubular photocatalytic reactor. The Photo-CREC Water II Reactor includes the additional following components: (i) a BLB Lamp; (ii) a Pyrex glass tube; (iii) a UV-opaque polyethylene cylinder; (iv) fused-silica windows; (v) a centrifugal pump; (vi) a H2 storing/mixing tank; (vii) a gas sampling port; (viii) a slurry sampling port; (ix) a purging gas injector; (x) a jet driving mixing port; (xi) a self-driven mixing impeller and (xii) a draining gas valve.
The experimental runs of the present study were performed by employing the following: (a) 6 L of distillate deionized water; (b) 0.90 g of photocatalyst and (c) 2 M of H2SO4 to adjust the solution pH to 4.00 ± 0.05. As well, the near UV lamps of the present study were characterized using a Solatell Spectroradiometer capable of measuring UV intensities in the 1 × 10⁻⁷ to 2 × 10⁻² W/cm2 range. This was used to determine the energy flux of the BLB lamp absorbed in the Photo-CREC Water II Reactor unit. Additional details regarding lamp characterization and macroscopic balances are reported in Appendix B. Table 1 reports the flux of absorbed photons for each photocatalyst using the macroscopic balance methodology described in Guayaquil-Sosa et al. [8].
Table 1 shows that there is no significant difference between the photon absorption efficiencies of the various photocatalysts prepared either via incipient and wet impregnation. These absorption efficiencies remain in the 84–87% range. On the other hand, one can observe that the sol-gel synthesized mesoporous Pt photocatalysts displayed slightly higher efficiencies, with these small differences being attributed to the different surface morphology properties of the synthesized photocatalysts.
2.3. Analytical Methods
To quantify the chemical species (ethanol, acetaldehyde, methane, ethane, carbon monoxide, carbon dioxide and hydrogen) present during every run, combined FID and TCD GC analysis were implemented. Carbon balances developed using these species data are reported in Appendix E.
2.4. Photocatalyst Characterisation
Three photocatalyst characterisation techniques were employed in this study: (a) Specific surface area determined using a Micromeritics, ASAP 2010 unit, through nitrogen adsorption; (b) The band gap energy (Ebg) obtained from diffuse reflectance measurements (Cary 500 UV-Vis NIR Varian spectrophotometer) and (c) The X-ray diffraction (XRD) developed by employing a diffractometer RIGAKU Ultima IV and a multi-purpose diffractometer.
It is, in this respect, anticipated that semiconductors with larger specific surface areas doped with novel metals may lead to a higher density of metal active sites. Hence, this could enhance hydrogen evolution. Thus, specific surface areas were calculated using the Brunauer–Emmett–Teller (BET) method while the pore volume distributions were measured with the Barrett–Joyner–Halenda (BJH) model.
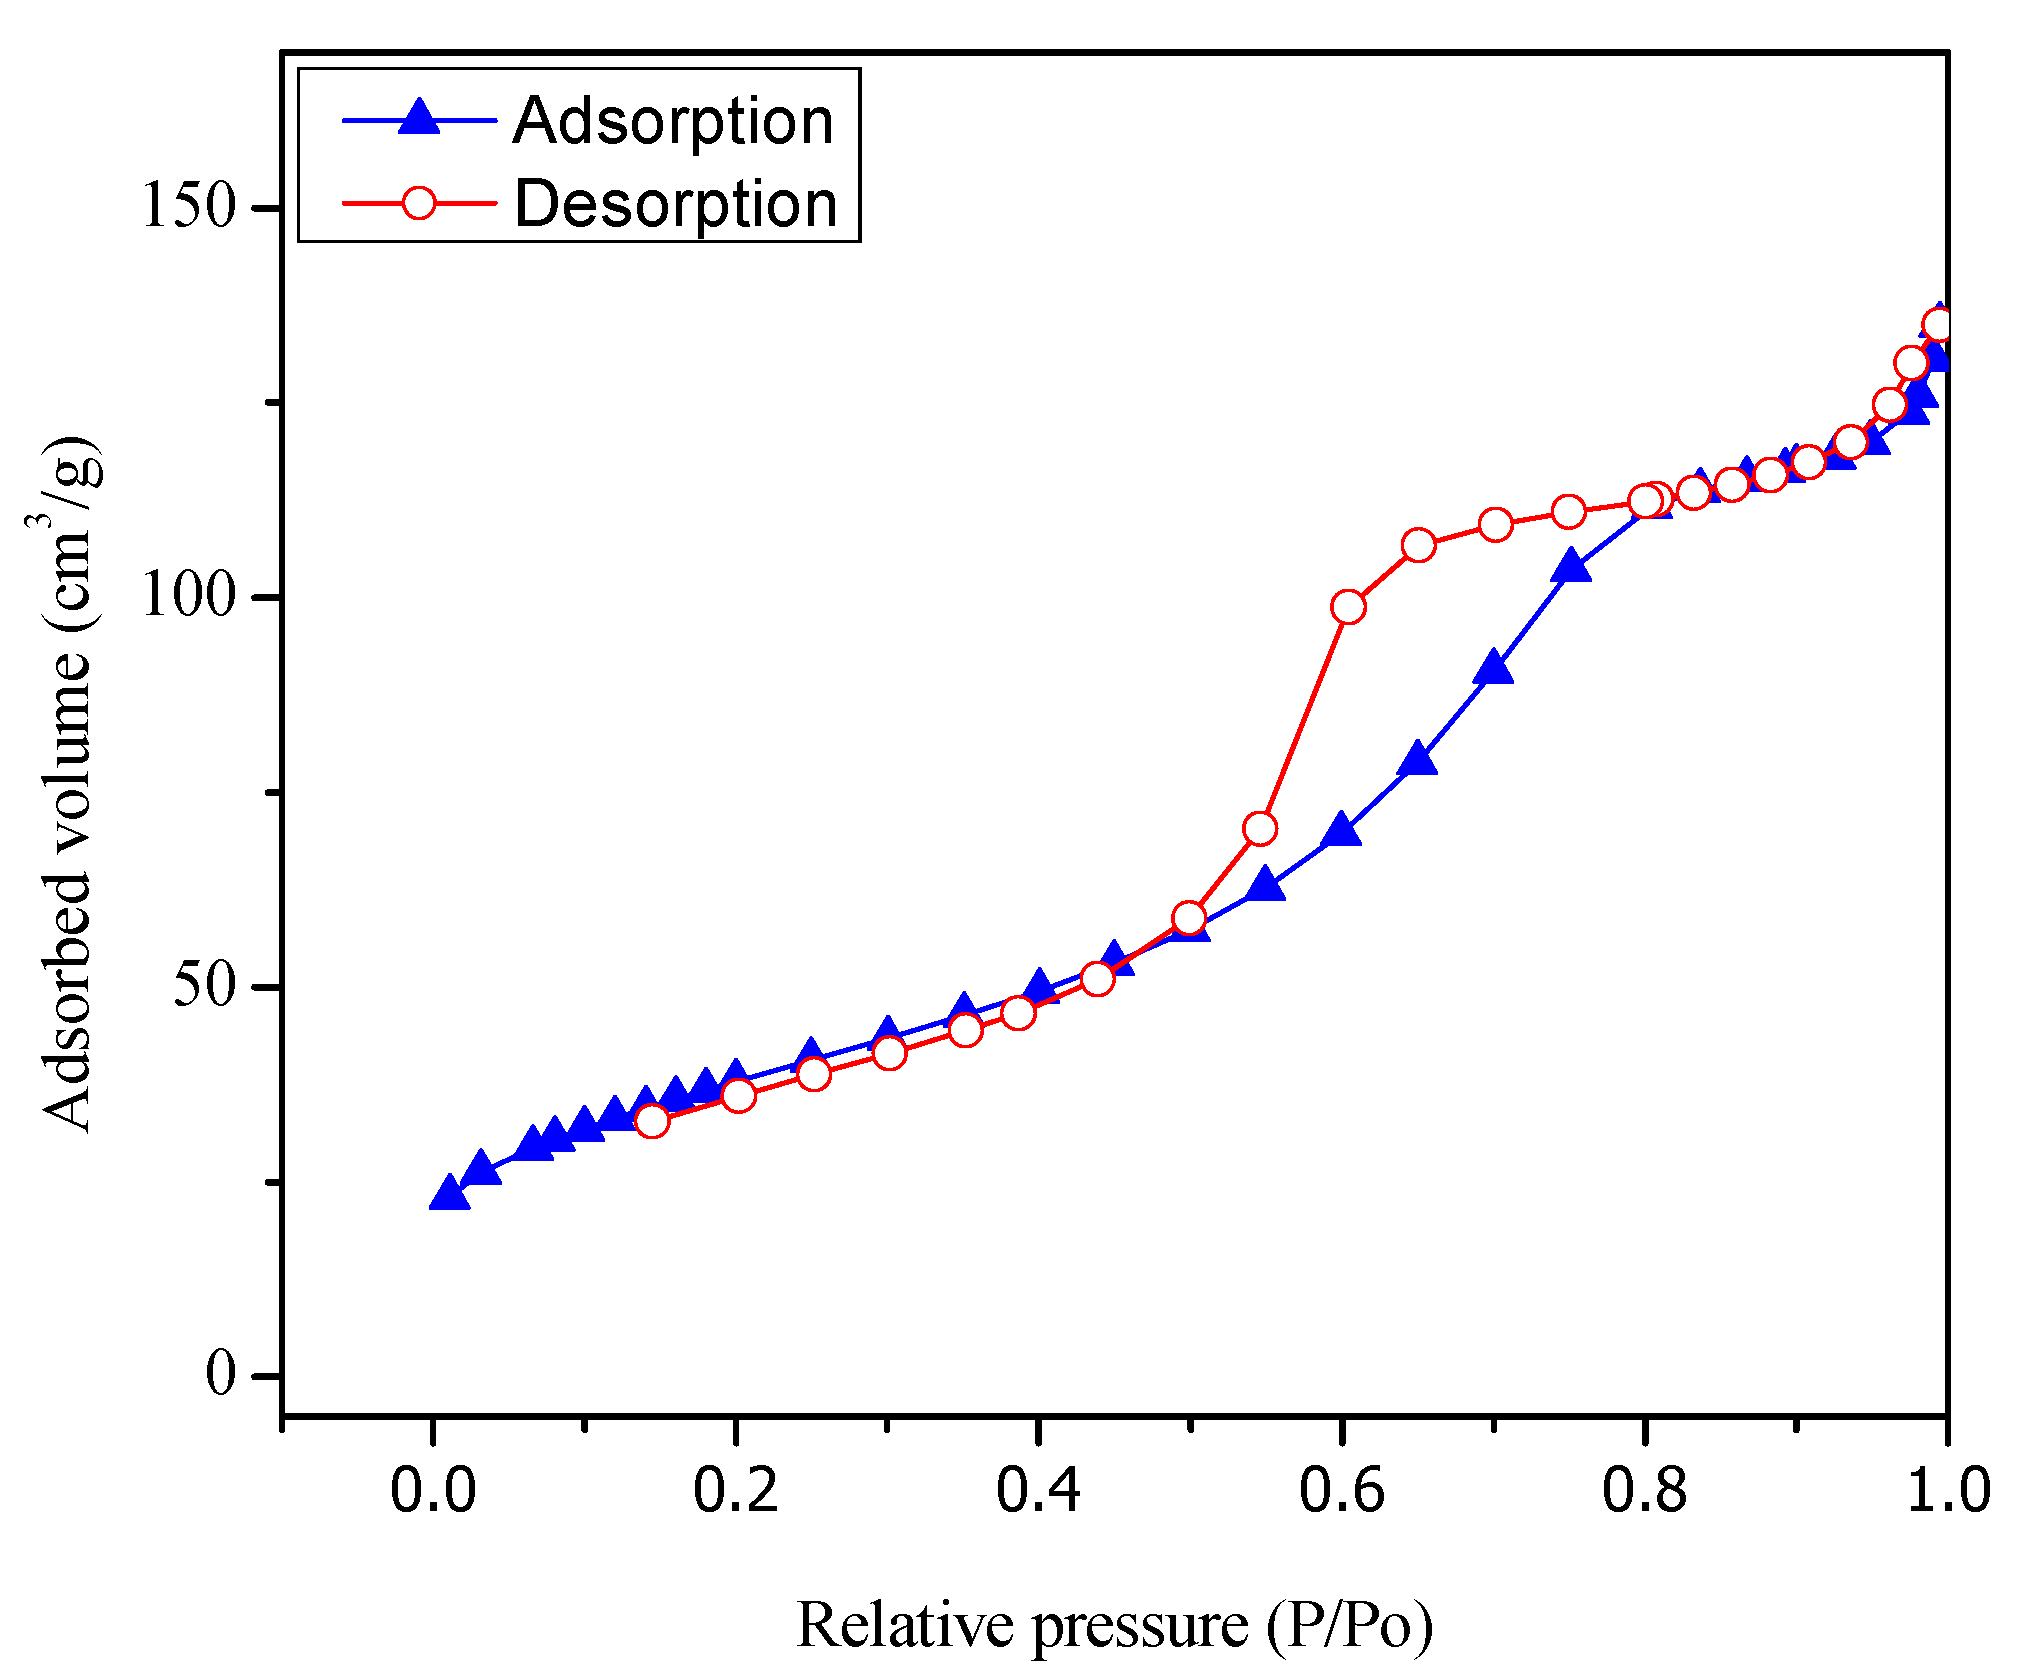
Figure 3 reports both adsorption and desorption isotherms type V for the Pt–TiO2 prepared via wet impregnation with 1.70 wt % Pt loading.
Figure 4 shows the adsorption isotherm for the sol-gel A synthesized TiO2 with 1.70 wt % Pt. One can notice that the sol-gel A synthesized semiconductors display a type IV isotherm.
Table 2 reports the specific surface area of the photocatalysts synthesized by different methods.
One can also observe a 52 m2/g for the specific surface area of the Degussa P25 impregnated via incipient wetness with a Pt precursor. This specific surface area increases progressively to 116 and 150 m2/g for sol-gel A and sol-gel B, respectively. These findings point towards higher promoted specific surface areas for platinum-sol-gel prepared photocatalysts.
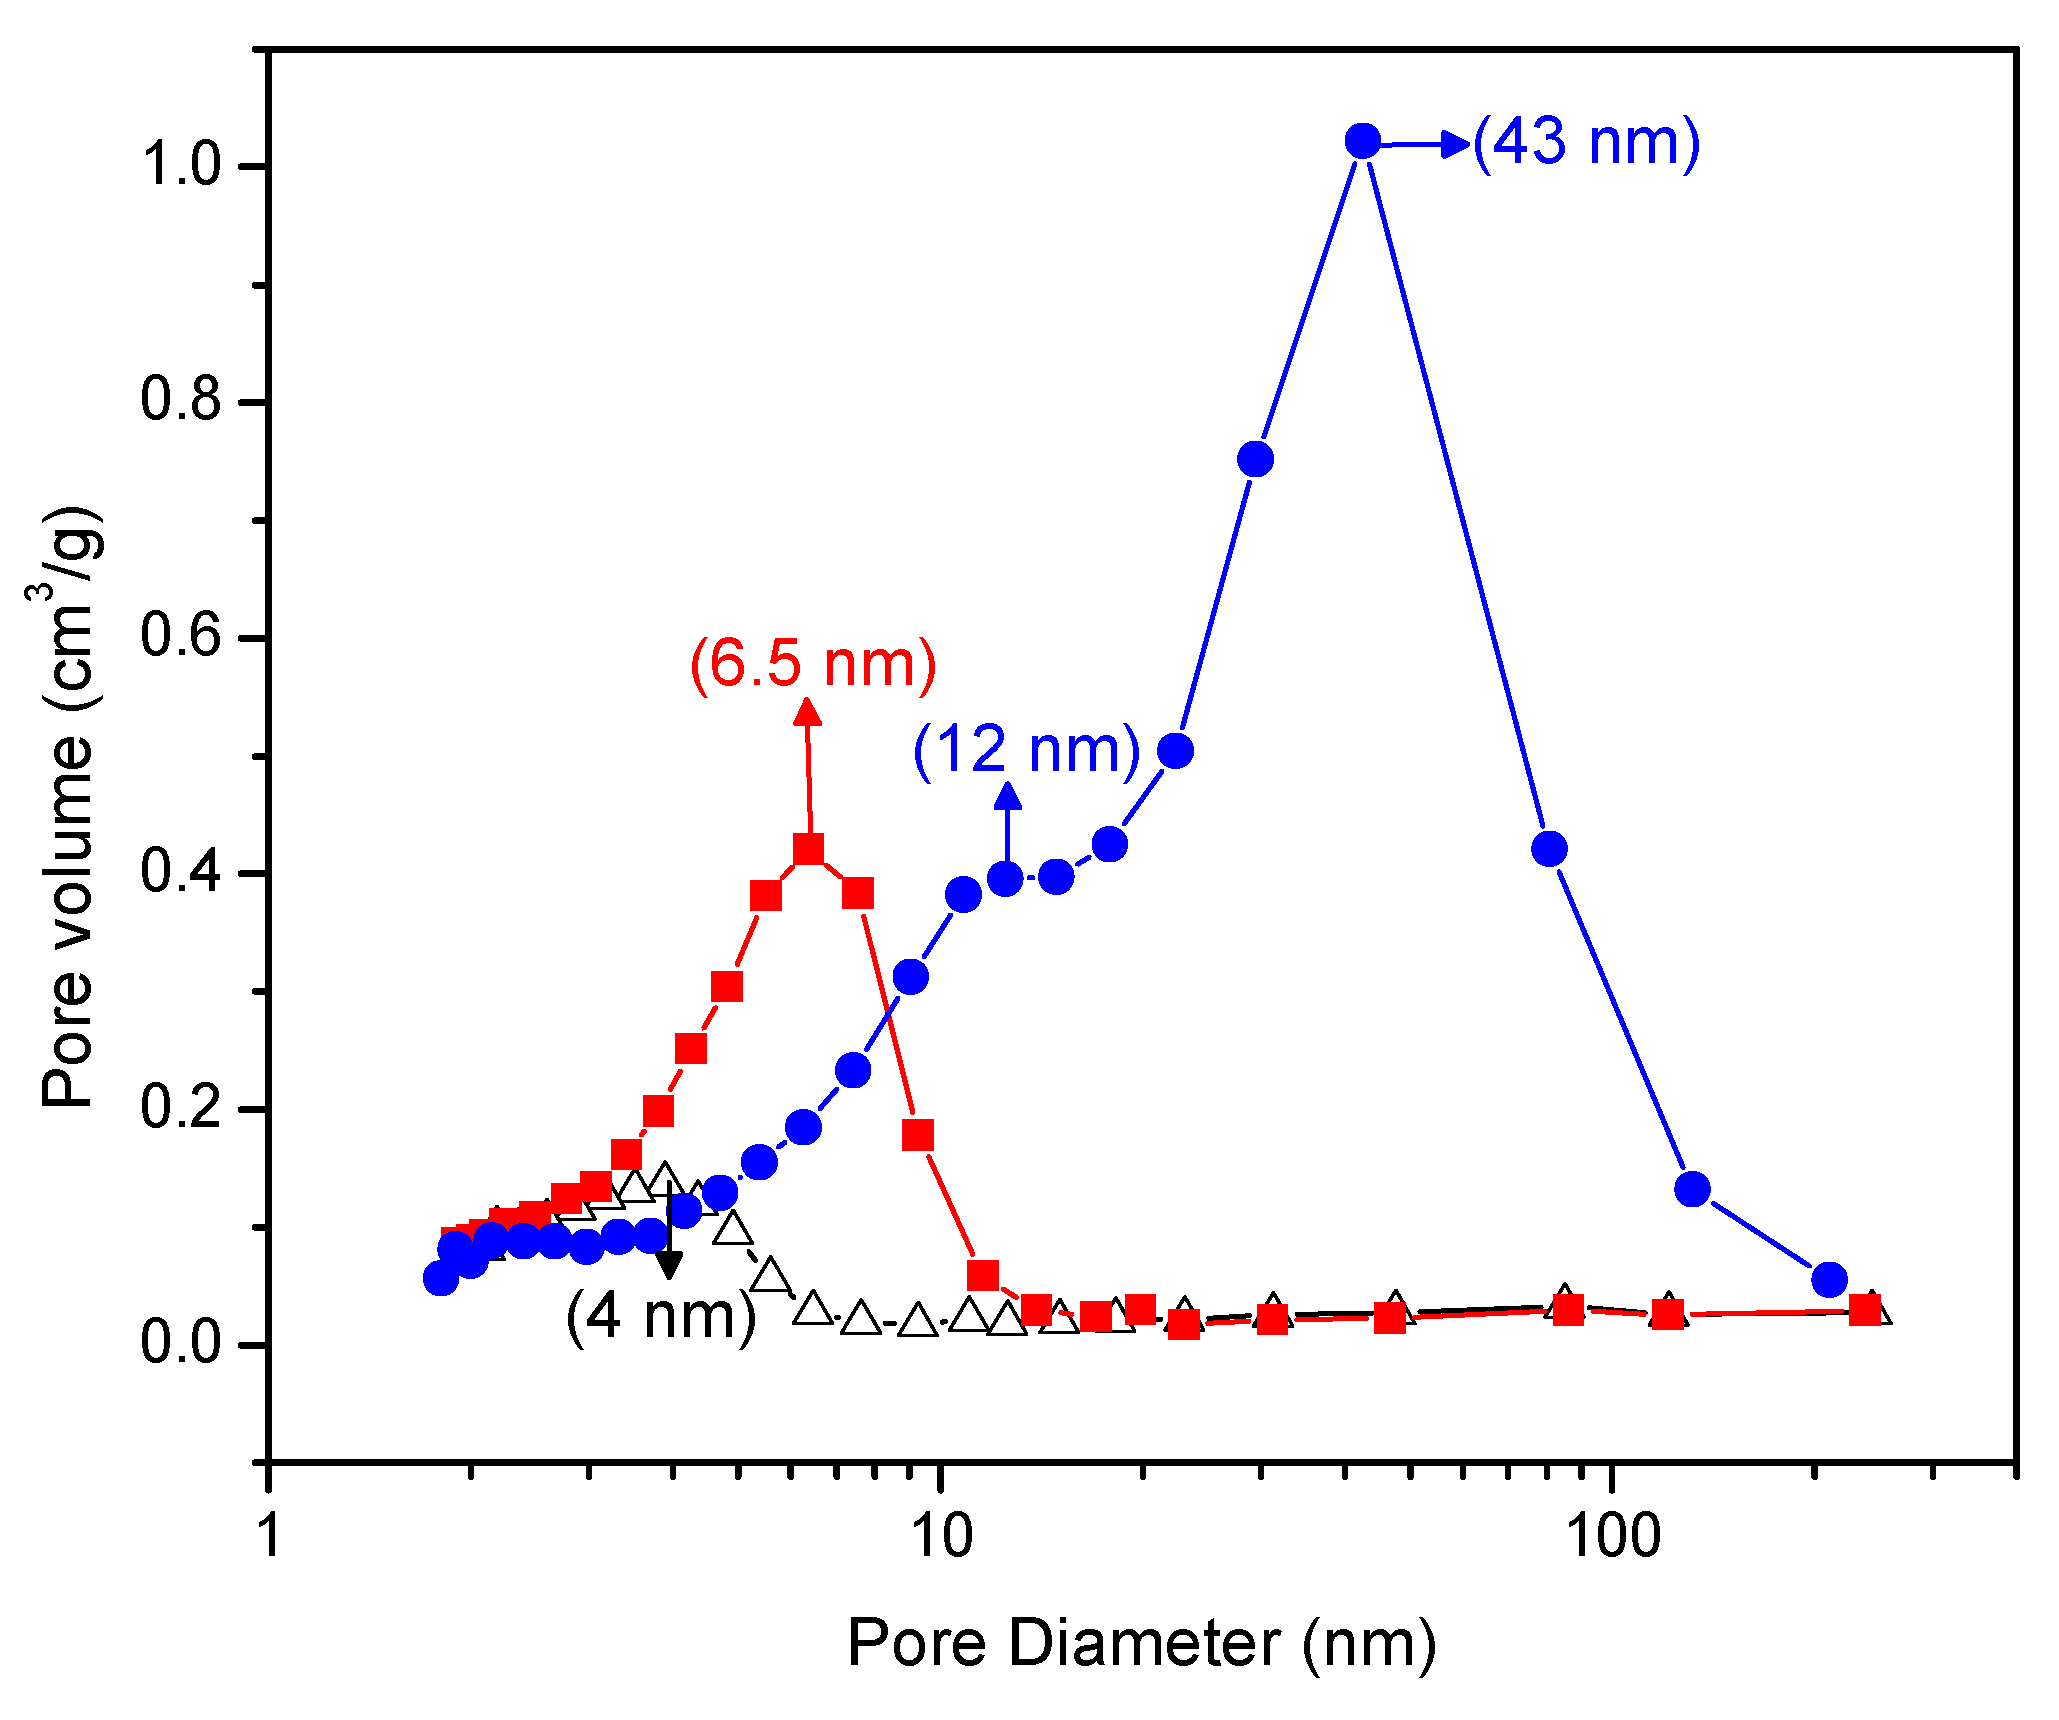
Figure 5 gives a Barrett–Joyner–Halenda plot that shows the pore size distribution of the Pt–TiO2. One can clearly see in this figure that the doped Pt–TiO2 obtained via incipient wet impregnation and the sol-gel A and sol-gel B TiO2 doped with Pt differ in both pore size distribution and pore volume.
In this respect, and as shown in Figure 5, the Pt–TiO2 obtained via incipient impregnation shows a 4.0 nm average pore size, while the Pt added on sol-gel prepared via method A displays a 6.5 nm average pore size.
Furthermore, the Pt-doped photocatalyst synthesized using sol-gel method B shows a bimodal pore size distribution with dominant 12.0 nm and 43.0 nm pore sizes. As reported in Figure 5, one can notice for the Pt on sol-gel prepared photocatalysts, and especially for the Pt on sol-gel prepared by method B, there is an increased volume fraction in the mesoporous pore range.
The band gap energy can be estimated using the Kubelka–Munk equation and the Tauc plot, as described in Guayaquil et al. [8]. Figure 6 reports the Tauc plots for sol-gel materials with different platinum loadings.
Based on the red line slope extrapolation in Figure 6, one can calculate the band gap energy (refer to the caption of Figure 6) with the higher platinum loading photocatalysts yielding reduced band gaps. These band gaps range from 3.20 eV (Pristine TiO2 via sol-gel A and B) to 2.70 eV (TiO2-1.70 wt % Pt). Additionally, one can see that the Pt doped on TiO2 via sol-gel yields semiconductors with the lowest band gap. This reduction of the band gap energy allows one to speculate about the enhanced activation of these semiconductors under visible light.
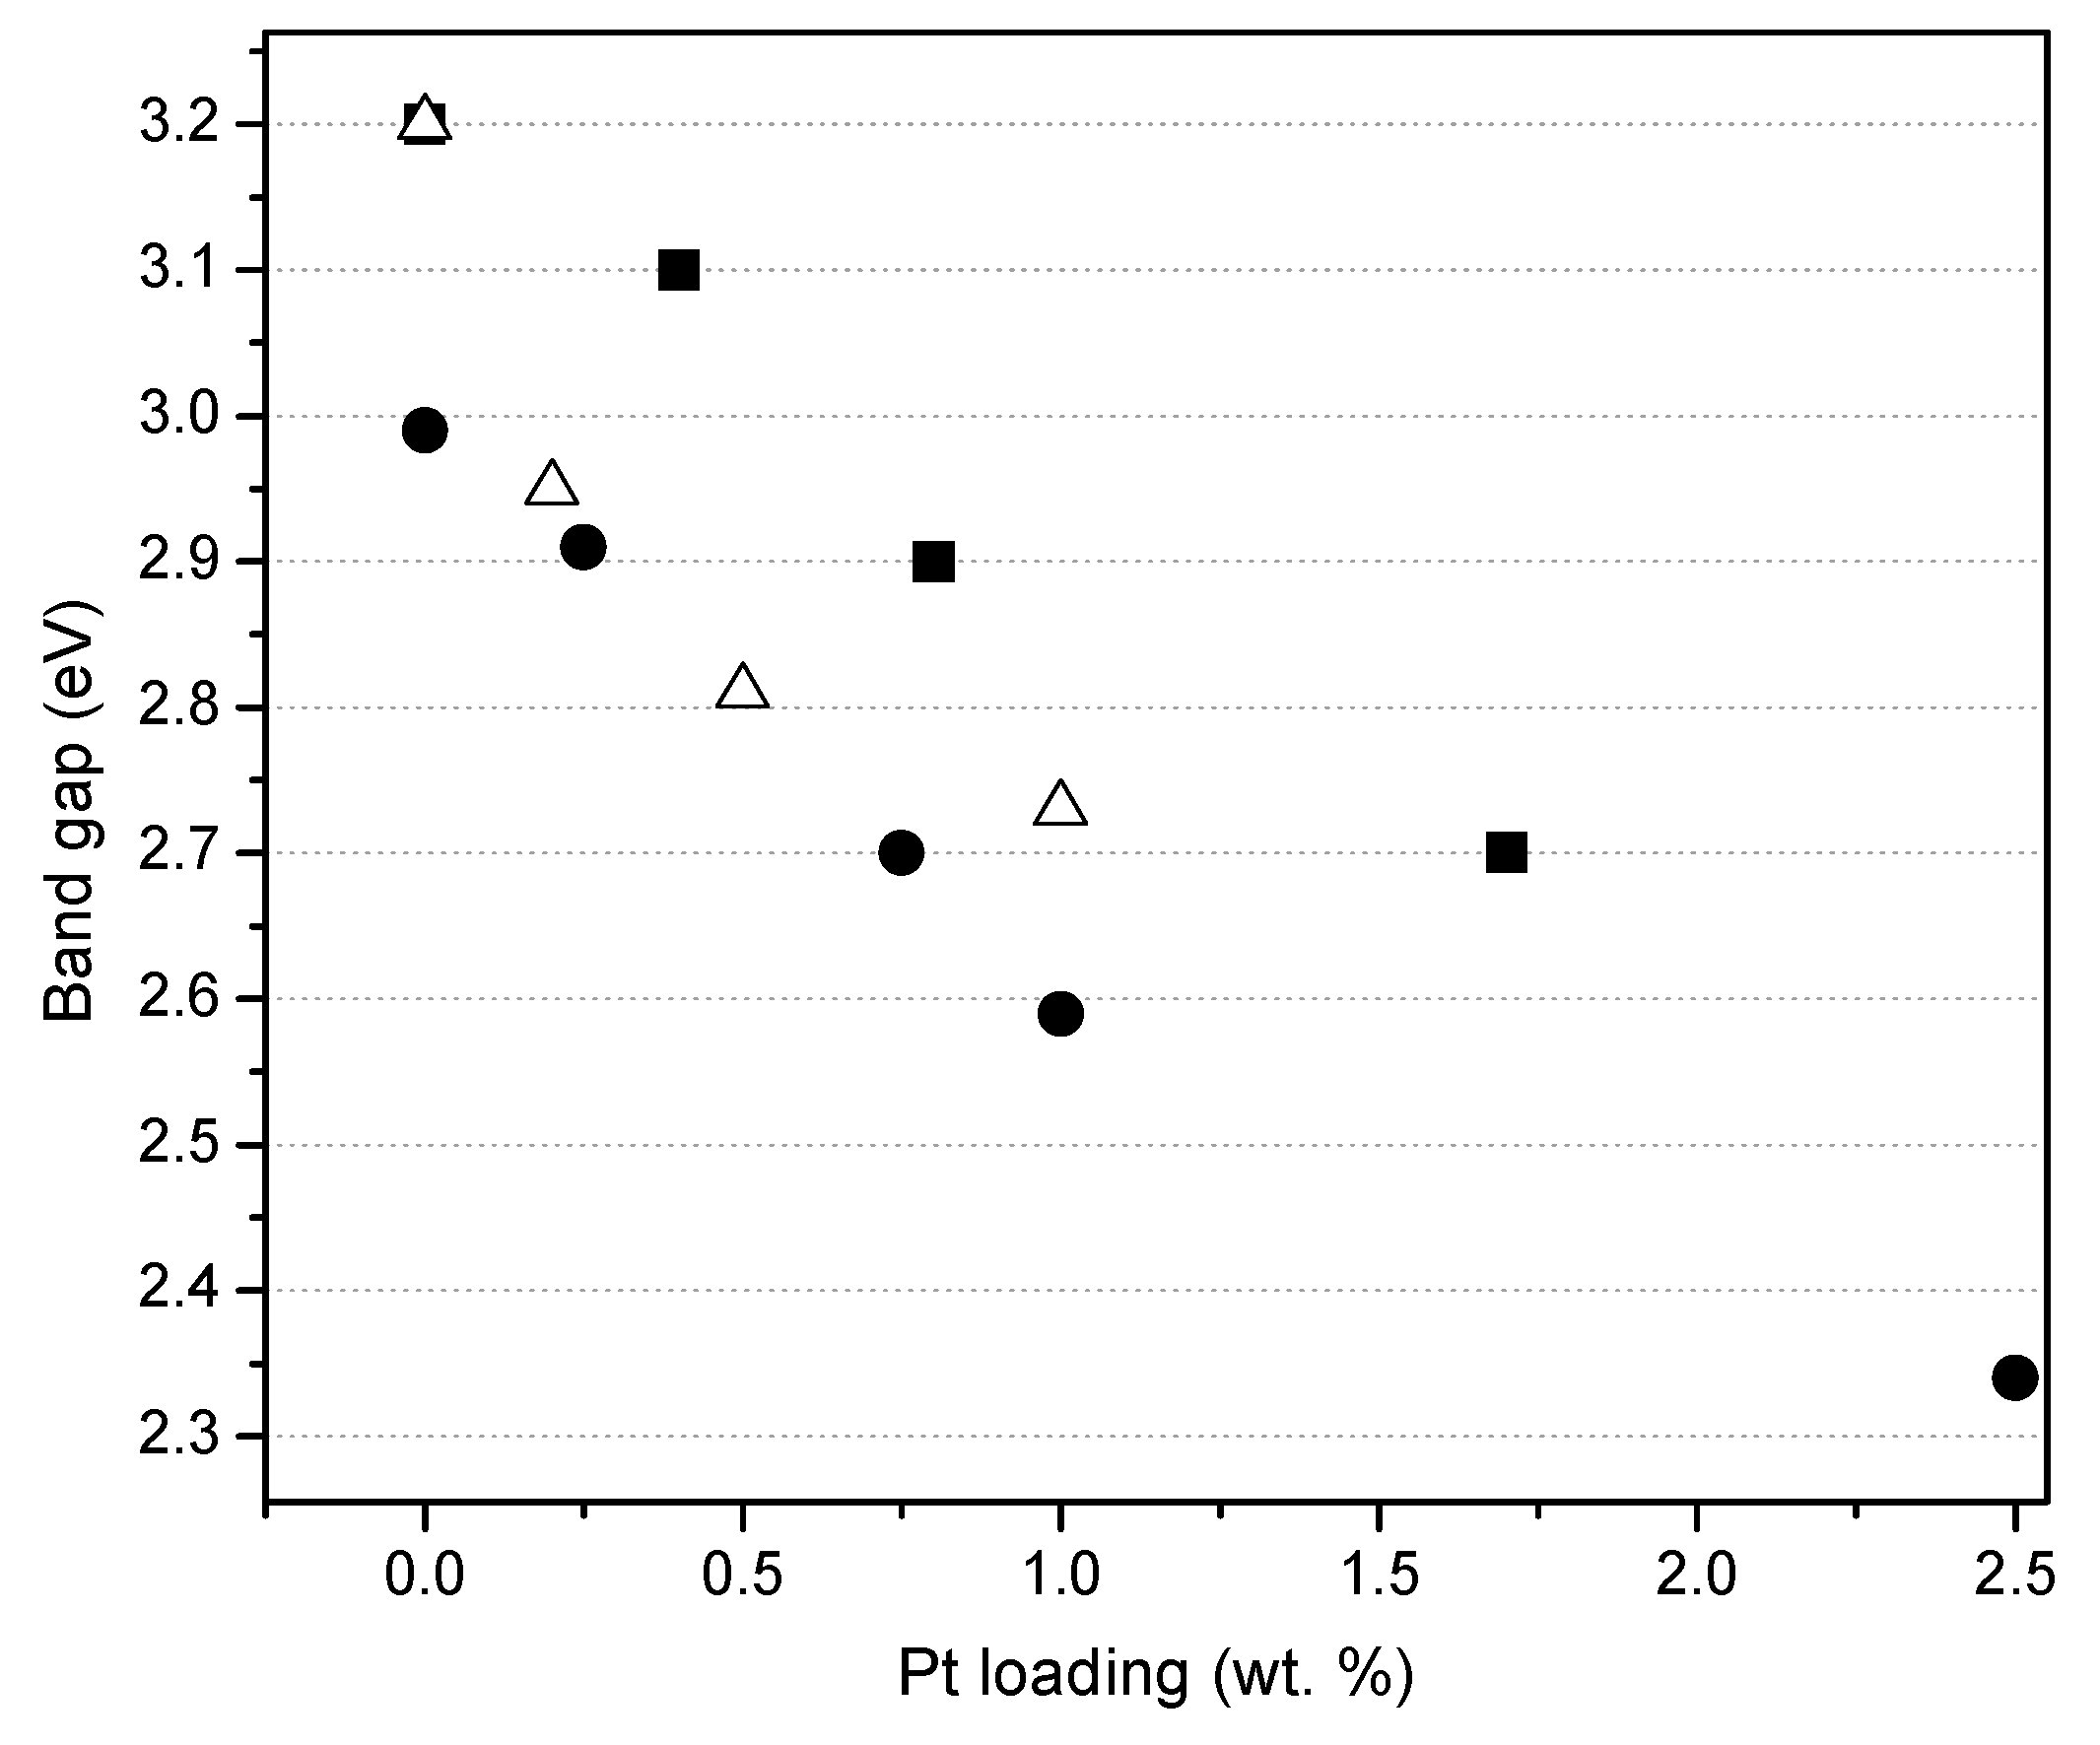
Figure 7 reports the effect of the platinum loading on the photocatalyst band gap, for the photocatalysts prepared by sol-gel. One can observe that the band gap for the Degussa P25 impregnated via incipient wetness with a Pt precursor, remains in the 3.10–3.20 eV range. Moreover, Pt–TiO2 photocatalysts being prepared using both sol-gel methods leads to a significant reduction of the band gap from 3.20 to 2.70 eV as a function of the platinum loading.
Thus, it is confirmed, as reported in Figure 7, that for the various platinum-loaded TiO2 photocatalysts of the present study, Pt has a consistent beneficial effect, reducing the band gap energy.
Figure 8 reports a typical XRD diffractogram for TiO2-based materials prepared by either wet or incipient impregnation. In addition, one can recognize the characteristic peaks of the two crystalline phases of titanium dioxide (anatase and rutile), with platinum also being included.
Figure 7 reports a change of the different XRD peaks for the wet and incipient platinum impregnated TiO2–Degussa P25. One can notice that both photocatalysts display rutile (110) crystal plane and that this given the characteristic 27° Bragg angle band. One can also observe, as reported in Table 3, that for the various sol-gel Pt–TiO2, there is no recordable 27° Bragg angle. As a result, this shows that the various synthesized sol-gel Pt–TiO2 are free of rutile (110) facet.
2.5. Photocatalytic Reaction Mechanism for Hydrogen Production
Experiments of hydrogen production using heterogeneous photocatalysis were carried out using the modified Photo-CREC Water II Reactor. There was a minimum of three repeats for each experimental condition considered. Hydrogen generation runs were performed at room temperature and pressure, under an inert argon atmosphere, with a 2.00% v/v ethanol concentration, and with a pH of 4.00 ± 0.05.
Figure 9 reports the cumulative hydrogen produced using the wet impregnated photocatalyst with platinum loadings in the 0.42 to 1.70 wt % range. Photocatalyst loading in all experiments was 0.15 g/L.
It can be noticed in Figure 9 that the cumulative hydrogen production increases both with irradiation time and platinum loading. Thus, it appears that augmenting the Pt loadings from 0.82 wt % to 1.70 wt % leads to higher Pt surface density sites and provides increased electron storage capacity. This augmented electron storage capacity helps in reducing electron-hole recombination, contributing to H+ conversion into H•.
Furthermore, one can observe from these experiments that there is a consistent linear trend with irradiation time and the cumulative hydrogen being produced. This shows zero-order hydrogen formation kinetics with no detectable activity decay. Thus, it can be concluded that all the prepared photocatalysts are very stable, with performance unaffected by the extent of irradiation.
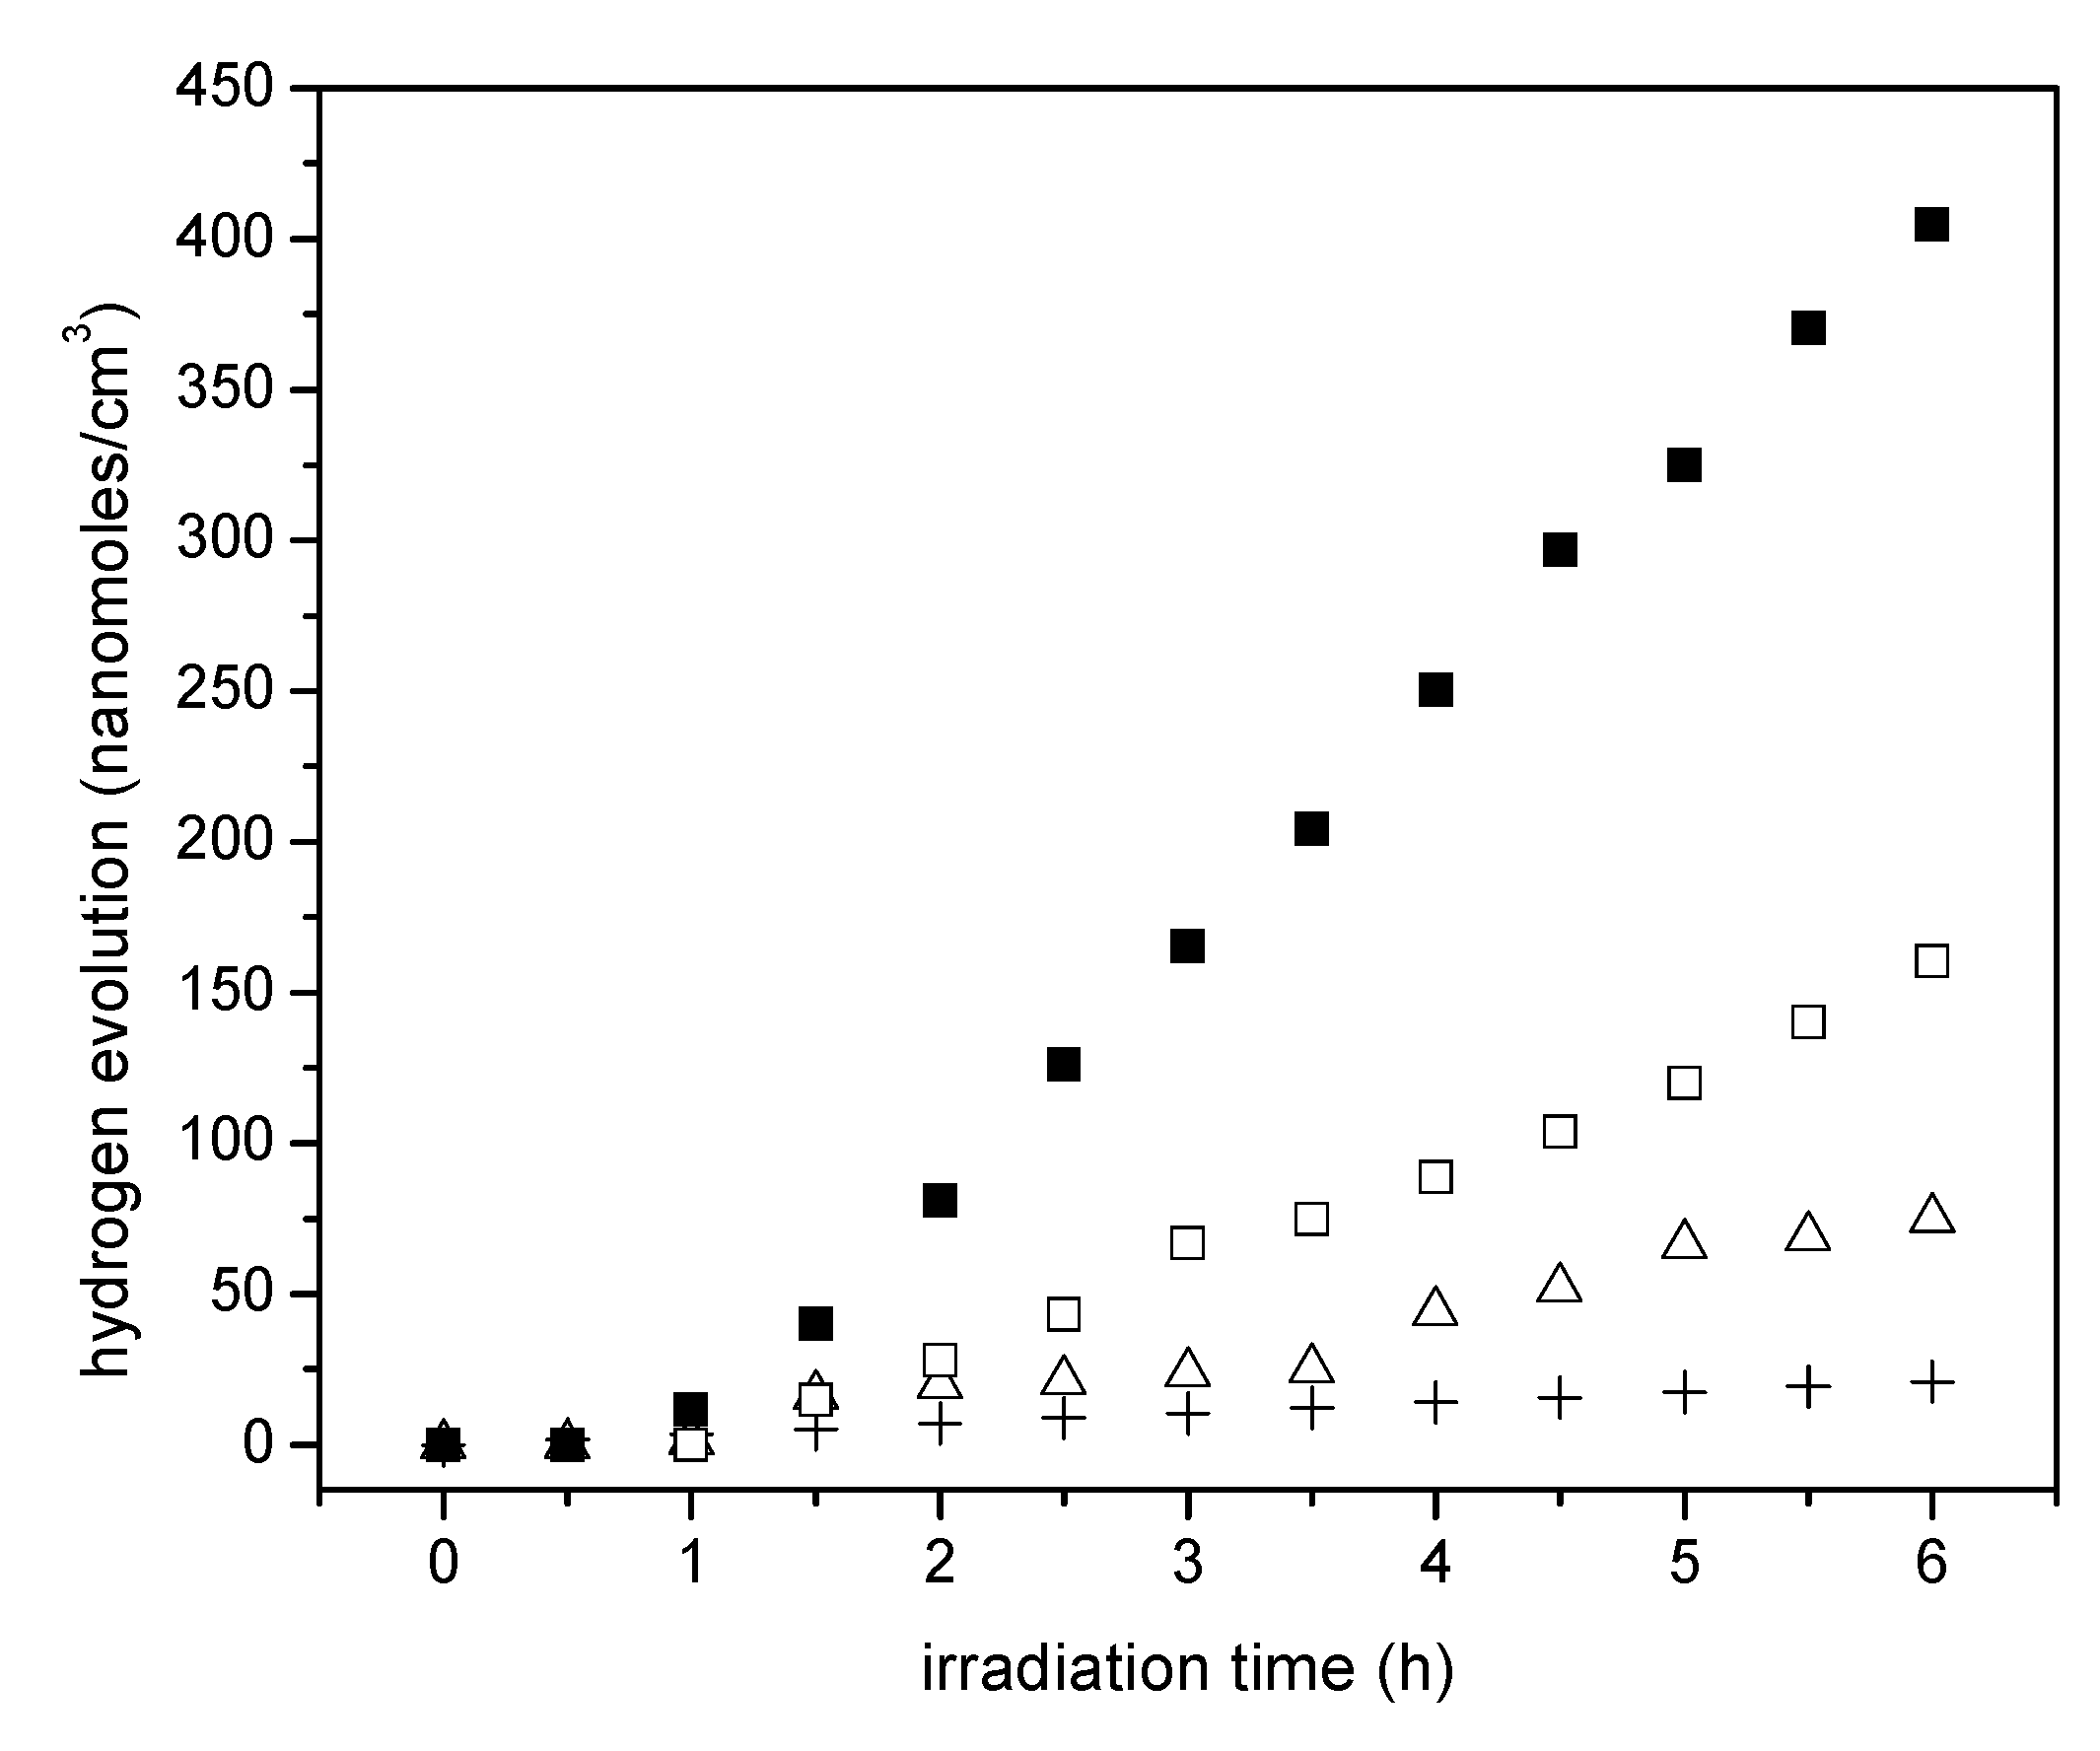
Figure 10 reports the cumulative hydrogen production for TiO2 prepared using sol-gel method A. One can observe an increase of hydrogen production when using TiO2 prepared via the sol-gel A method and compared to that obtained with Degussa P25. Furthermore, one can notice a further enhancement of the hydrogen production with the Pt–TiO2 prepared via sol-gel A with 1.70 wt % of Pt loadings. This cumulative hydrogen production is again of zero order in all cases, with no observable photocatalyst deactivation.
Figure 11 shows the cumulative hydrogen production for the Pt–TiO2 synthesized photocatalysts using the sol-gel Method B. One can recognize that the observed linear trend is consistent with the photocatalyst prepared using the sol-gel Method A and with respect to Degussa P25.
Additionally, one can notice that Pt addition leads to a further improvement of the hydrogen production. Hence, consistent increase of hydrogen production with Pt loadings is observed. This cumulative hydrogen production is again of zero order with no observable photocatalyst deactivation.
If one compares the cumulative hydrogen production of the 1.70 wt % Pt–TiO2 of Figure 9 with respect to that of Figure 10, one can observe that sol-gel A displayed a mildly increased hydrogen production versus the one prepared via incipient impregnation: from 350 nanomoles/cm3 to 400 nanomoles/cm3.
Furthermore, if one considers the hydrogen production when using the 1.00 wt % Pt–TiO2 sol-gel B (refer to Figure 11), one can see that this photocatalyst yields essentially the same amount of hydrogen as the one with a higher Pt loading (1.70 wt % Pt–TiO2 sol-gel Method A, refer to Figure 10). As well, after 5 h of irradiation, a further increase of Pt up to 2.50 wt % in sol-gel B gives a valuable 600 nanomoles/cm3 of cumulative hydrogen.
2.6. Hydrogen Formation with Ethanol Scavenger
Hydrogen formation with the consumption of an ethanol scavenger, using a Pt–TiO2 photocatalyst, can be described as the contribution of two photocatalyst sites: (a) a TiO2 site promoting oxidation reactions; and (b) a TiO2 site enhanced by Pt promoting hydrogenation (reduction) reactions. Hence, both oxidation and reduction networks are of series-parallel type. This series-parallel network character can be assigned to: (a) the variability of irradiated photons and thus the h+ changing density on TiO2; and (b) the changing extent of stored electron density in the Pt sites.
Therefore, as described in Figure 12, the resulting series-parallel network is of the redox type [10]. Included in this process is the formation of hydrogen peroxide. Additional details of various oxidation and reduction steps are provided in Table 4 and Table 5, respectively.
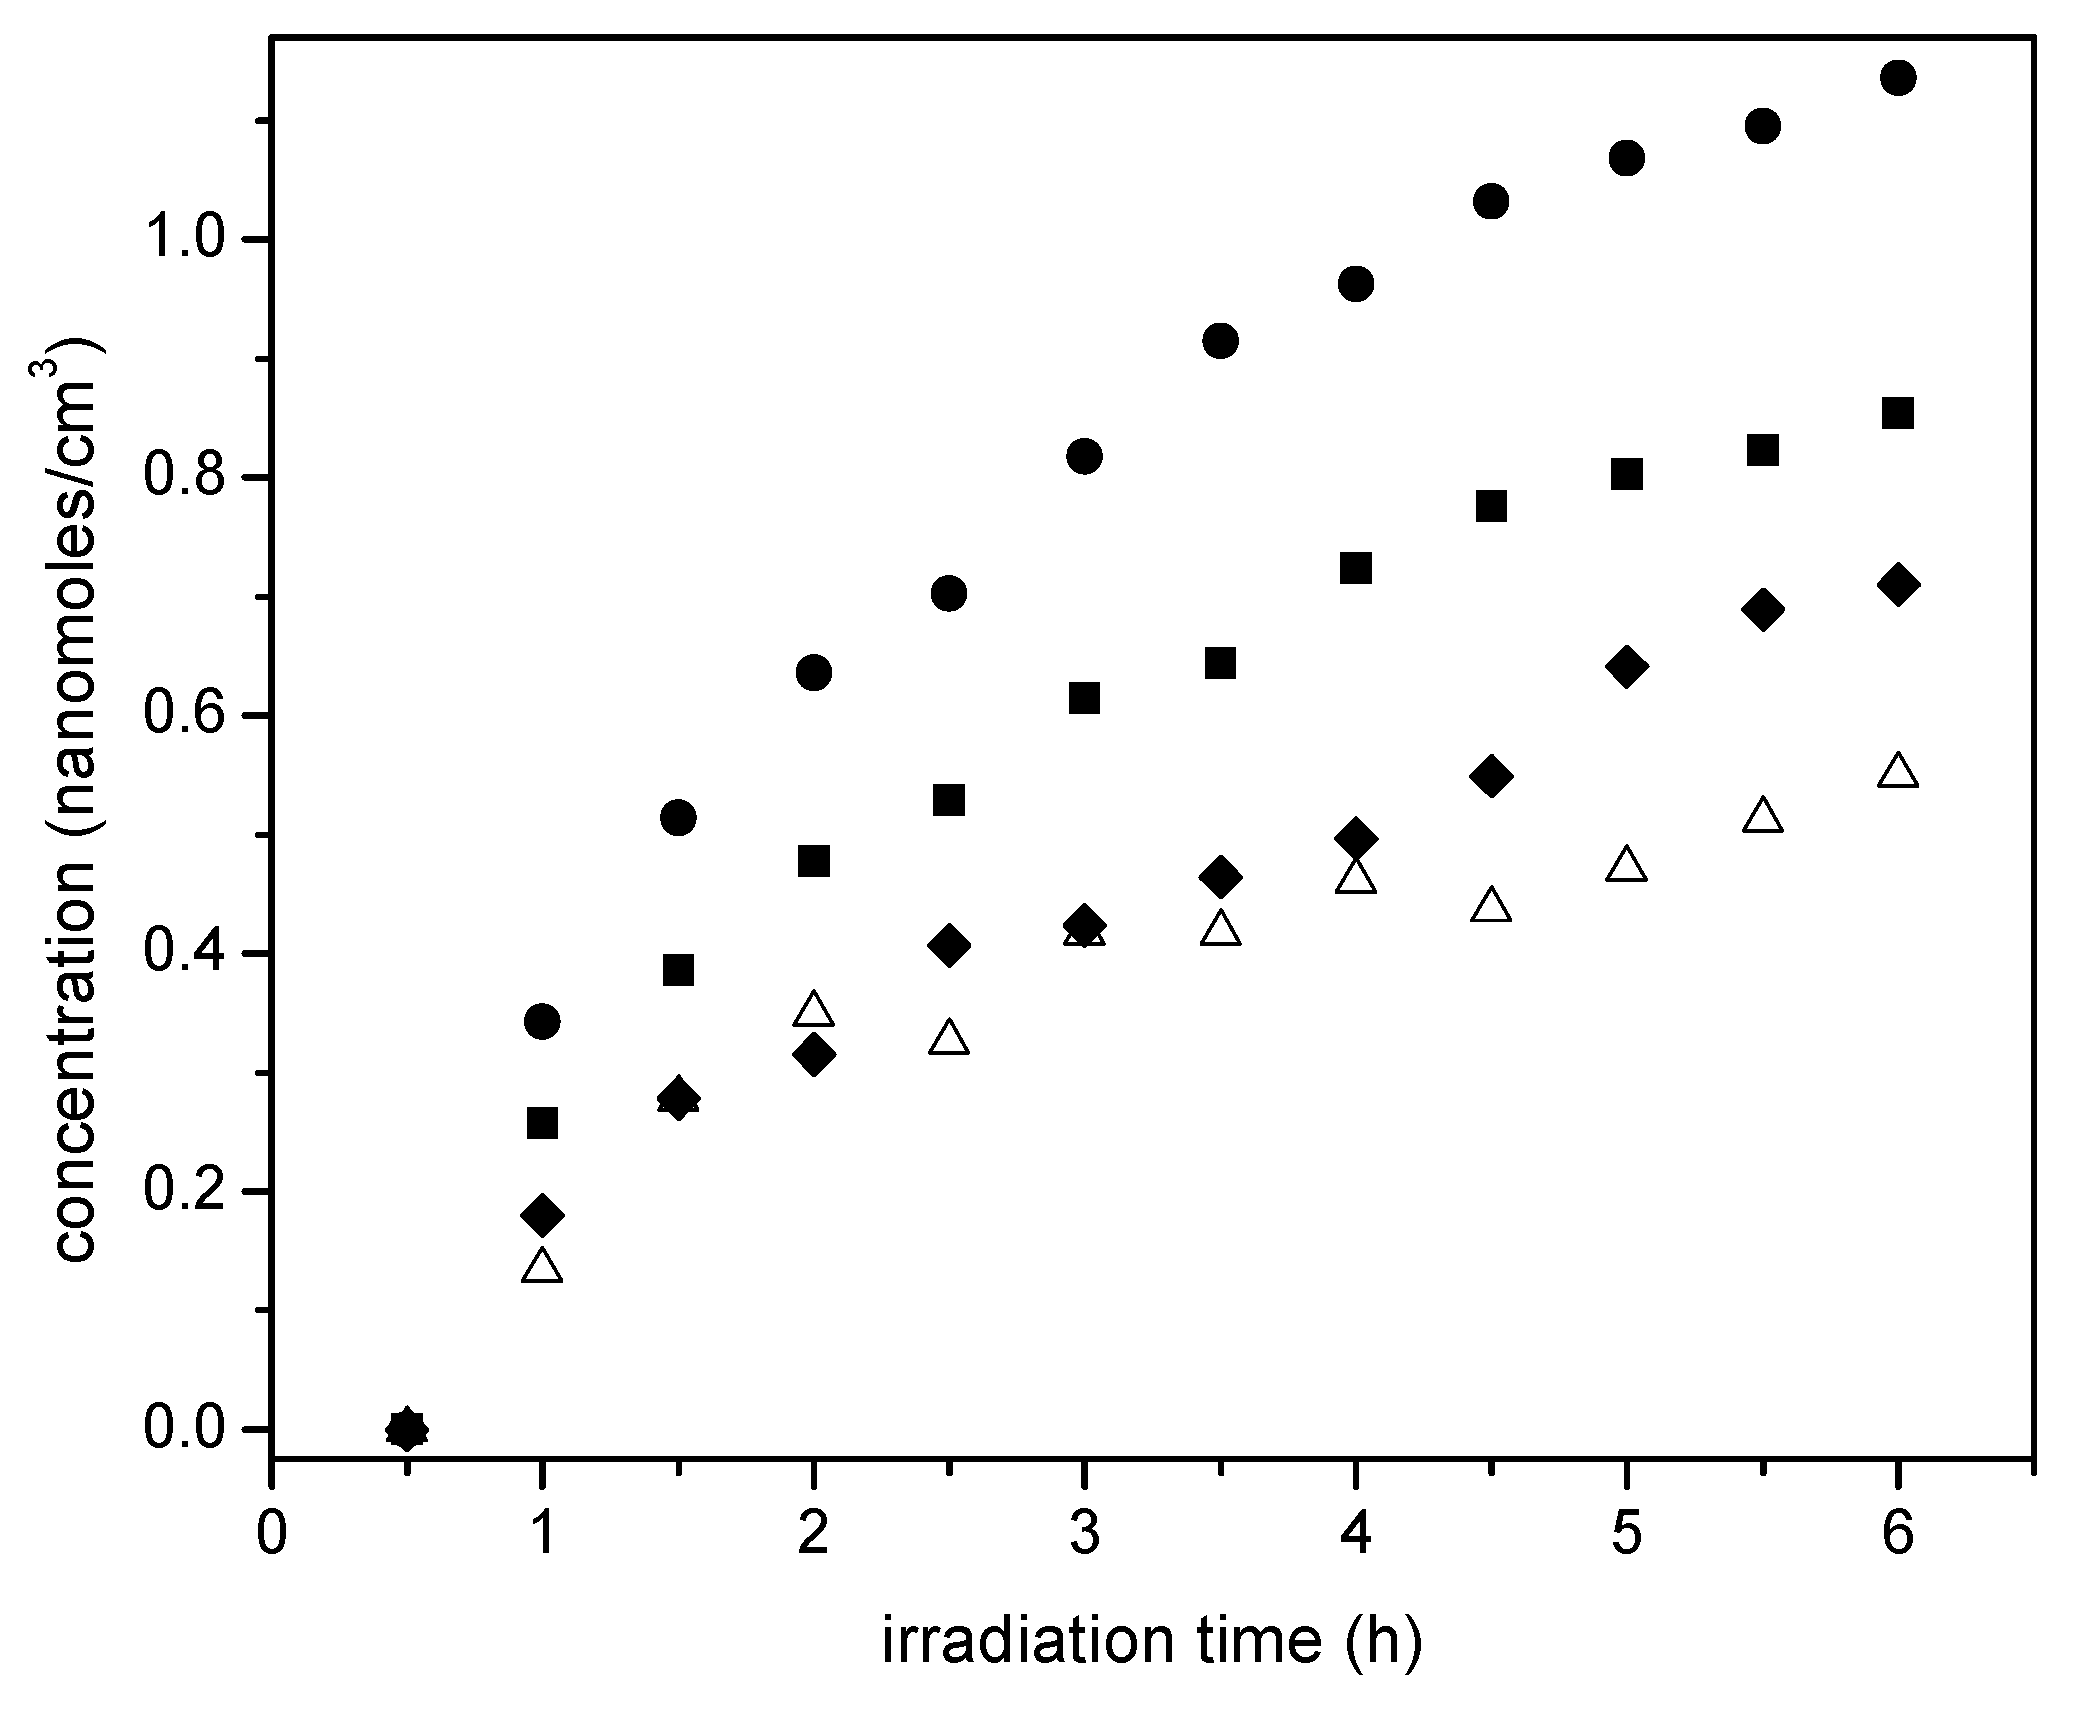
Figure 13 reports the progressive and consistent methane formation for various Pt-doped photocatalysts prepared using incipient impregnation, wet impregnation and sol-gel. The Degussa P25 photocatalyst without Pt addition is reported as a reference.
One can see in Figure 13 that methane formation augments yet tends to stabilize with irradiation time. This is a consistent trend for all the photocatalysts of the present study. Thus, these findings highlight the photocatalytic reduction character of the proposed reaction network. Furthermore, it is observed that 1.70 wt % wet impregnation, and 1.70 wt % Pt sol-gel A photocatalysts yield comparable methane concentrations. These methane concentrations are however, surpassed when 2.50 wt % Pt on TiO2 (sol-gel B) is considered. This case shows an enhanced hydrogenating activity at higher Pt loadings, with this being consistent with the results reported in Figure 10.
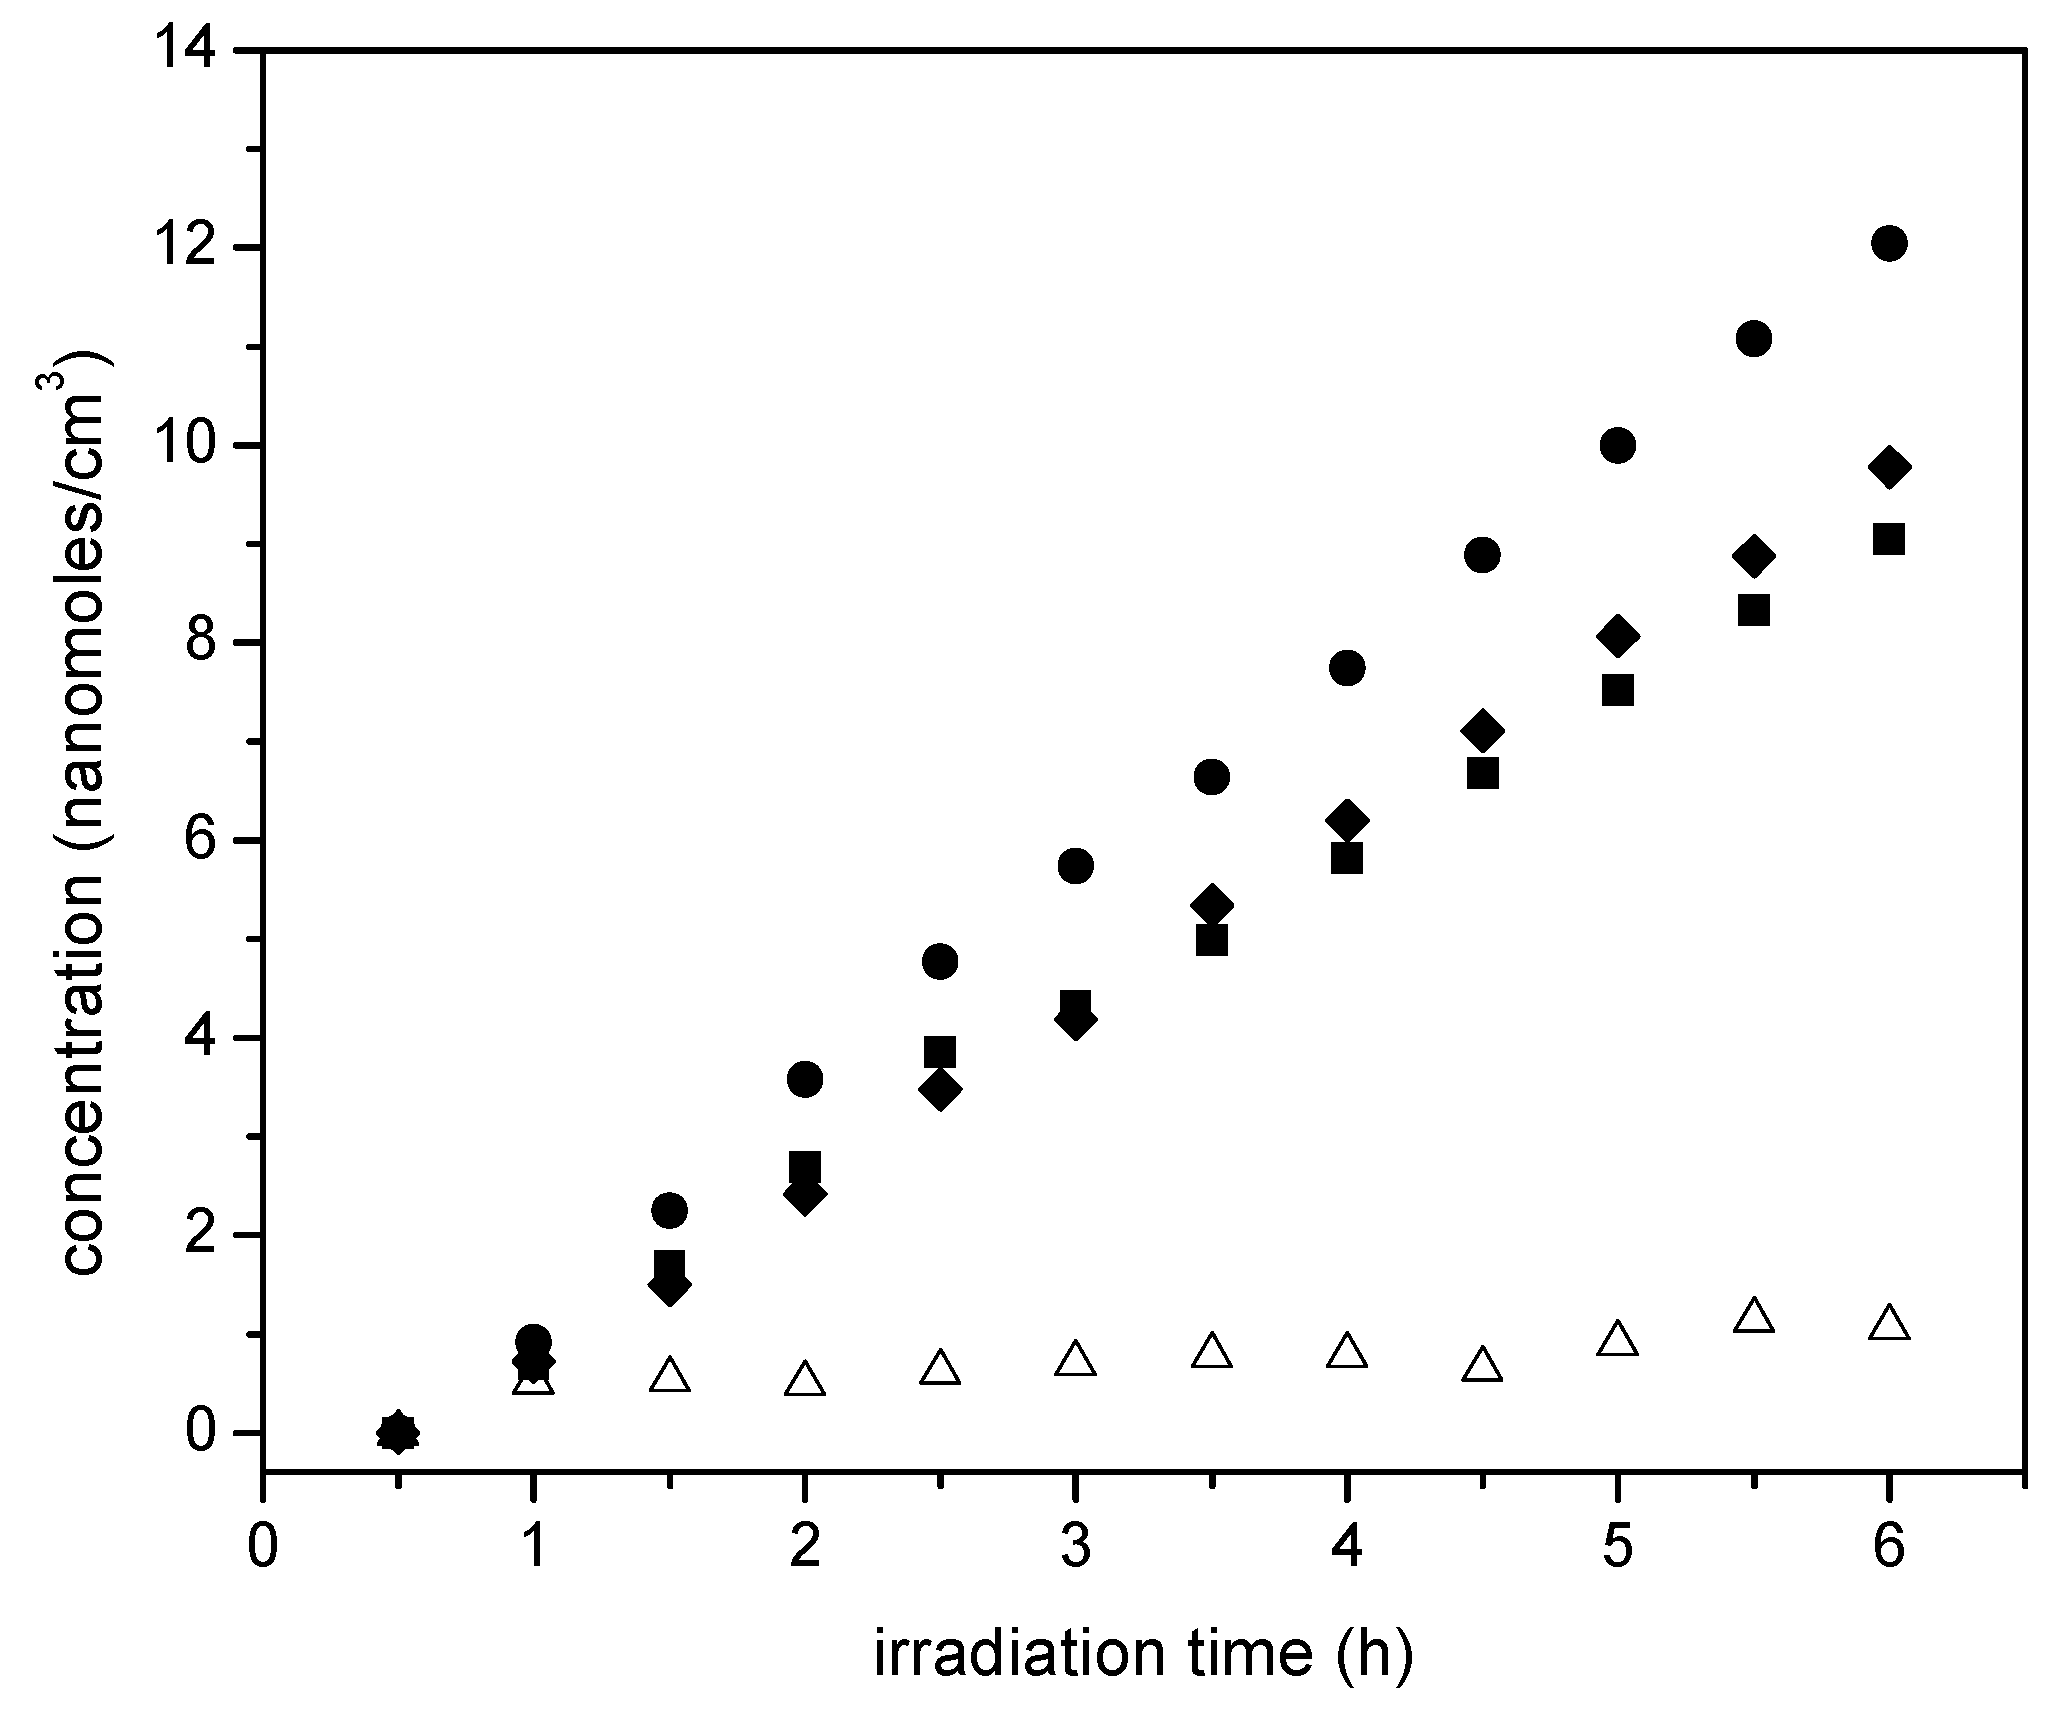
Figure 14 reports ethane cumulative formation with irradiation time for the various photocatalysts of the present study.
Figure 14 shows that ethane increases linearly with irradiation time. Thus, it appears that ethane is a main reduction final product of the proposed series-parallel network. Again, here the highest ethane concentration levels were obtained using the sol-gel B with the 2.50 wt % Pt loadings. In other words, it can be concluded that the photocatalytic conversion of the ethanol scavenger is significantly affected by several reduction steps leading to the formation of both methane and ethane.
On the other hand, Figure 14 reports the acetaldehyde obtained, with acetaldehyde formation increasing progressively with irradiation time. This described trend was observed consistently for all the studied photocatalysts with added Pt.
Thus, as shown in Figure 15, photocatalysis with loaded Pt leads to the oxidation of the ethanol scavenger. One should notice in this respect, that acetaldehyde is a characteristic representative species of primary oxidation products of the network oxidation branch, as described in Table 4. One can notice in Figure 15 that the 1.70 wt % Pt-sol-gel A yields the highest acetaldehyde concentrations, consistent with higher overall photocatalytic activity.
In order to validate the proposed redox mechanism, various detectable chemical species (methane, ethane, acetaldehyde, ethanol, hydrogen peroxide, hydrogen) were identified and quantified both in the gas phase as well in the liquid phase. This was done at various stages (every 30 min of the 6-h irradiation period). This approach was consistently used in all runs utilizing the various photocatalysts of the present study.
Furthermore, Figure 16 reports carbon dioxide concentrations augmenting steadily with irradiation. This carbon dioxide presence in the product gases points to a complete oxidation of some ethanol contained carbons during the photocatalytic reaction.
One can notice in Figure 16 the formation of CO2 even at the early stages of irradiation. This observation, combined with the concurrent formation of acetaldehyde at short irradiation times, points towards a series-parallel network for the photoconversion of water and air pollutants as reported by our research group in earlier studies [5,9].
Furthermore, and to establish the total amount of CO2 at every stage of the irradiation process, vapour–liquid equilibrium calculations for CO2 shall be considered, as described in Appendix E.
Figure 17 reports the ethanol scavenger concentration changes in the liquid phase with radiation time. These changes of ethanol with irradiation time are reported for the various Pt-doped photocatalysts of the present study.
One can observe in Figure 17 a progressive and mild decline of the ethanol scavenger concentration with irradiation time. This tendency for net ethanol to decrease is in line with an oxidation–reduction network where ethanol may be consumed and formed simultaneously.
2.7. Quantum Yields
In order to evaluate photocatalytic efficiency, a quantum yield can be defined as described with Equation (2) based on the moles of H● produced.
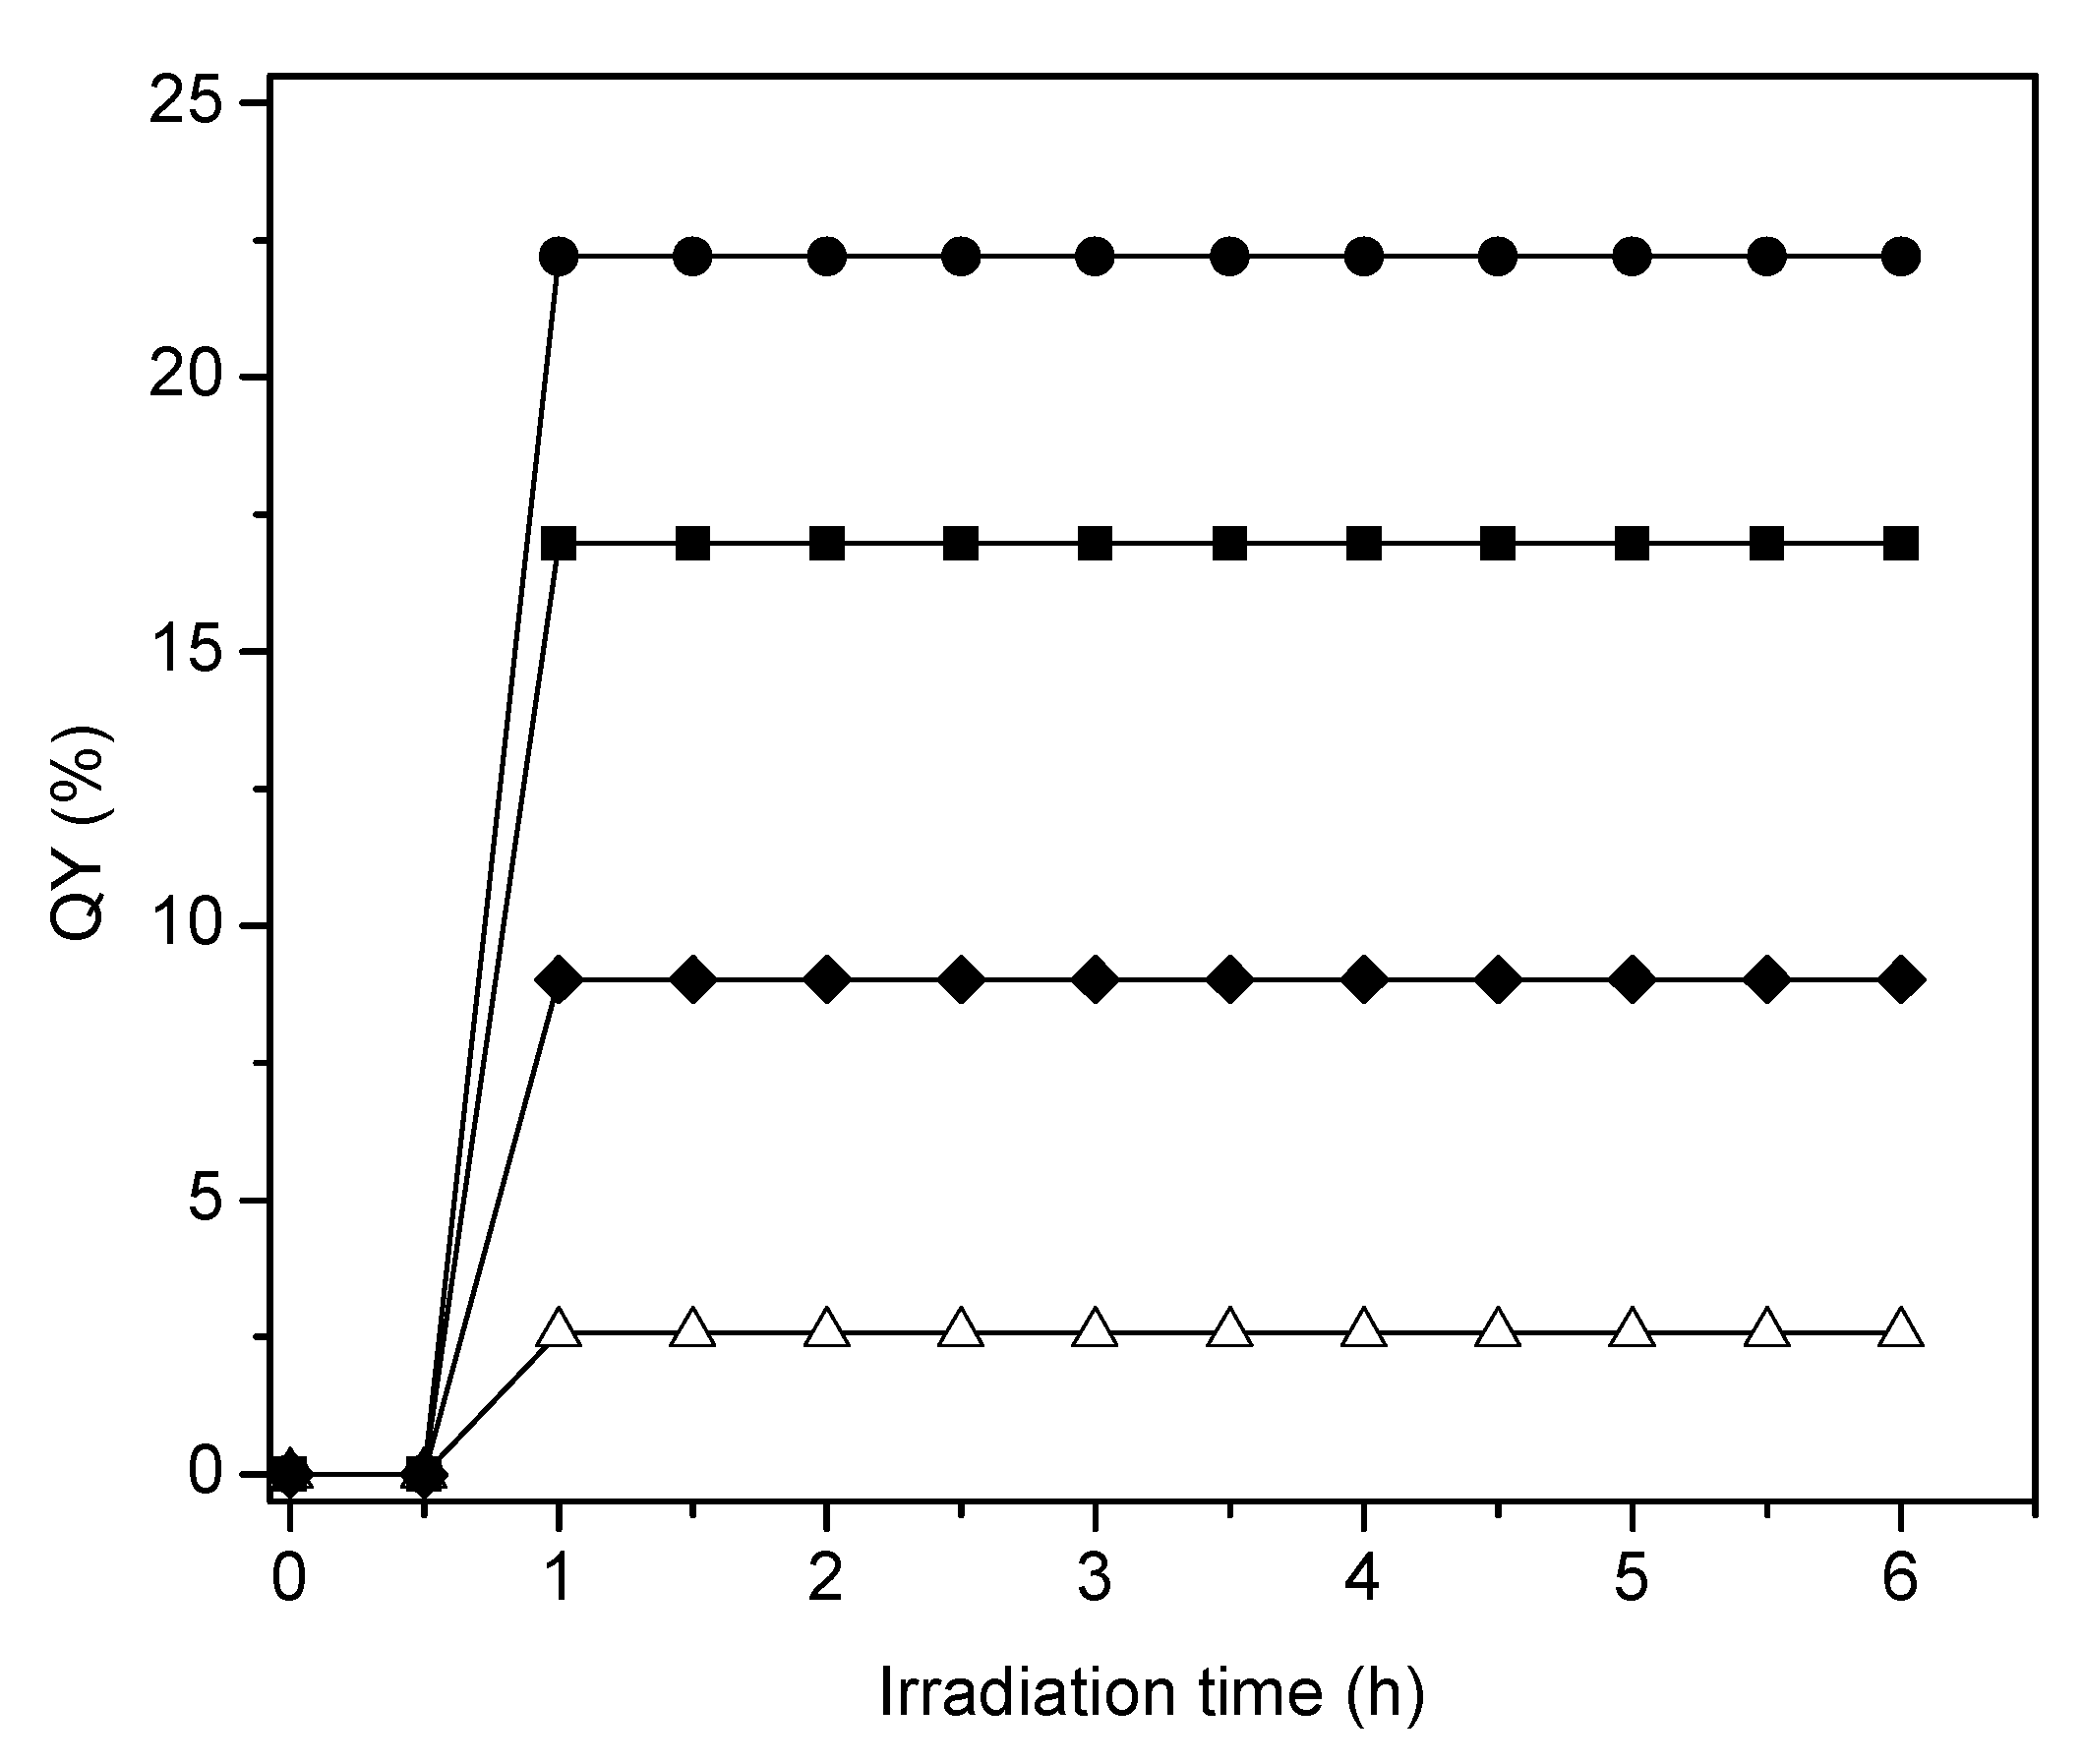
Figure 18 reports the quantum yield efficiencies for the various photocatalysts of the present study using sol-gel as well as wet impregnation methods. These photocatalysts contain various Pt loadings.
One can notice in Figure 18 that in all cases the quantum yields display a first irradiation period with progressively increasing values. Following this initial phase, quantum yields stabilize and remain essentially unchanged during the remaining 5 h of the run. These results point towards a very important property of the synthesized photocatalysts: showing no photoactivity decay. Additionally, one can observe that the increase of Pt loading augments the moles of H● produced. Thus, quantum yields reach valuable levels as high as 22.2% for 2.50 wt % of Pt-TiO2 sol-gel B catalyst.
3. Conclusions
The following are the main conclusions of the present study:
(a) Pt-loaded photocatalysts can be prepared using both wet impregnation and sol-gel synthesis. These photocatalysts are used very effectively to produce hydrogen via water splitting with 2.00% v/v ethanol as an organic scavenger.
(b) The Pt–TiO2 sol-gel photocatalysts showed a reduced 2.34 eV band gap. This reduced band gap can be attributed to the role of Pt in the modified semiconductor. In addition, the XRD for the Pt–TiO2 sol-gel photocatalysts showed a dominant anatase content, contributing to enhanced photocatalytic activity for hydrogen production.
(c) A common series-parallel reaction network with reduction–oxidation steps included was observed for all photocatalysts studied for hydrogen production, using ethanol as an organic scavenger. Both reduced species (methane, ethane) and oxidized species (acetaldehyde, carbon dioxide) were consistently detected in all experiments.
(d) The proposed reaction network was found to be consistent with the overall carbon balance, accounting for various carbon-containing species involved in both oxidation and reduction steps.
Acknowledgments
The authors would like to express their gratitude to the Natural Sciences and Engineering Research Council of Canada (NSERC) for the Discovery Grant awarded to Professor de Lasa, which provided valuable financial support to this project. Jesus Fabricio Guayaquil-Sosa (J.F.G.-S.) would like to thank the National Council for Science and Technology (CONACyT), México, for the scholarship (N 359213) and the Secretariat of Public Education (SEP), México, for the supplementary bursary “Beca Complemento” (N 7493). We would like also to thank Florencia de Lasa for her assistance in the editing of the manuscript.
Author Contributions
J.F.G.-S. conceived and designed the experiments, wrote a draft of the paper, contributed in modifying the manuscript and to its revision, performed experiments as well as data analyses; A.C. contributed to the synthesis of the impregnated materials and the ones prepared via Sol-Gel method A, and to the determination of hydrogen peroxide concentrations; B.S. assisted with the manuscript writing process, treatment and analysis of data; S.E. helped with the design of the storage hydrogen tank; and H.d.L. provided the final revision of the manuscript and shared thoughts for the rebuttals.
Conflicts of Interest
The authors declare no conflict of interest.
Nomenclature
| c | speed of light (3.0 × 10⁸ m/s) |
| C | Celsius |
| dp | porous diameter (cm) |
| e− | electron |
| h+ | hole |
| h | Planck’s constant (6.63 × 10⁻³⁴ J/s) |
| E | energy of a photon at a given wavelength (J) |
| Eav | average energy of a photon at a wavelength range, (J/mol photon). |
| Ebg | energy band gap (eV) |
| eV | electron volts |
| H2PtCl6 | hexachloroplatinic acid |
| H● | hydrogen radical dot |
| Pa | rate of absorbed photons by semiconductor (photons/s) |
| Pbs | rate of backscattered photons flying off the system (photons/s) |
| Pi | rate of photons reaching the reactor inner surface (photons/s) |
| Pt | rate of transmitted photons (photons/s) |
| Pt | platinum |
| OH− | hydroxide ions |
| ●OH | hydroxyl radical dot |
| t | time (h) |
| TiO2 | titanium dioxide |
| Vg | volume of the gas phase in the storage tank (cm3) |
| W | weight (g) |
| wt % | weight percent (% m/m) |
| Greek symbols | |
| α | absorbance (a.u.) |
| θ | diffraction angle (°) |
| λ | wavelength (nm) |
| ν | frequency (1/s) |
| Acronyms | |
| BJH | Barrett–Joyner–Halenda model |
| BLB | black light blue lamp |
| BET | Brunauer–Emmett–Teller surface area method |
| CB | conduction band |
| DP25 | TiO2 Degussa P25 |
| PCWII | Photo CREC Water II Reactor |
| QY | quantum yield |
| UV | ultraviolet |
| VB | balance band |
| Subscripts | |
| a | absorbed photons by the photocatalyst |
| bg | band gap |
| bs | photons backscattered by the photocatalyst |
| g | gas phase |
| i | incident photons to the photocatalyst |
| t | photons transmitted by the photocatalyst |
| max | maximum |
| min | minimum |
Appendix A. Pa Absorbed Photon Energy
The calculation of the Pa absorbed photon energy involves: (a) the amount of incident photons on the semiconductor surface (Pi); (b) the number of photons transmitted by the semiconductor (Pt); and (c) the photons backscattered by the semiconductor (Pbs).
One calculates the number of absorbed photons by the photocatalyst through the algebraic addition of the Pi, Pt, Pbs ratios as follows:
with the units of all these terms being in photons/s.
Appendix B. Eav Average Photon Energy
The average photon energy can be calculated by using the spectrum of the lamp and the following equation [10]:
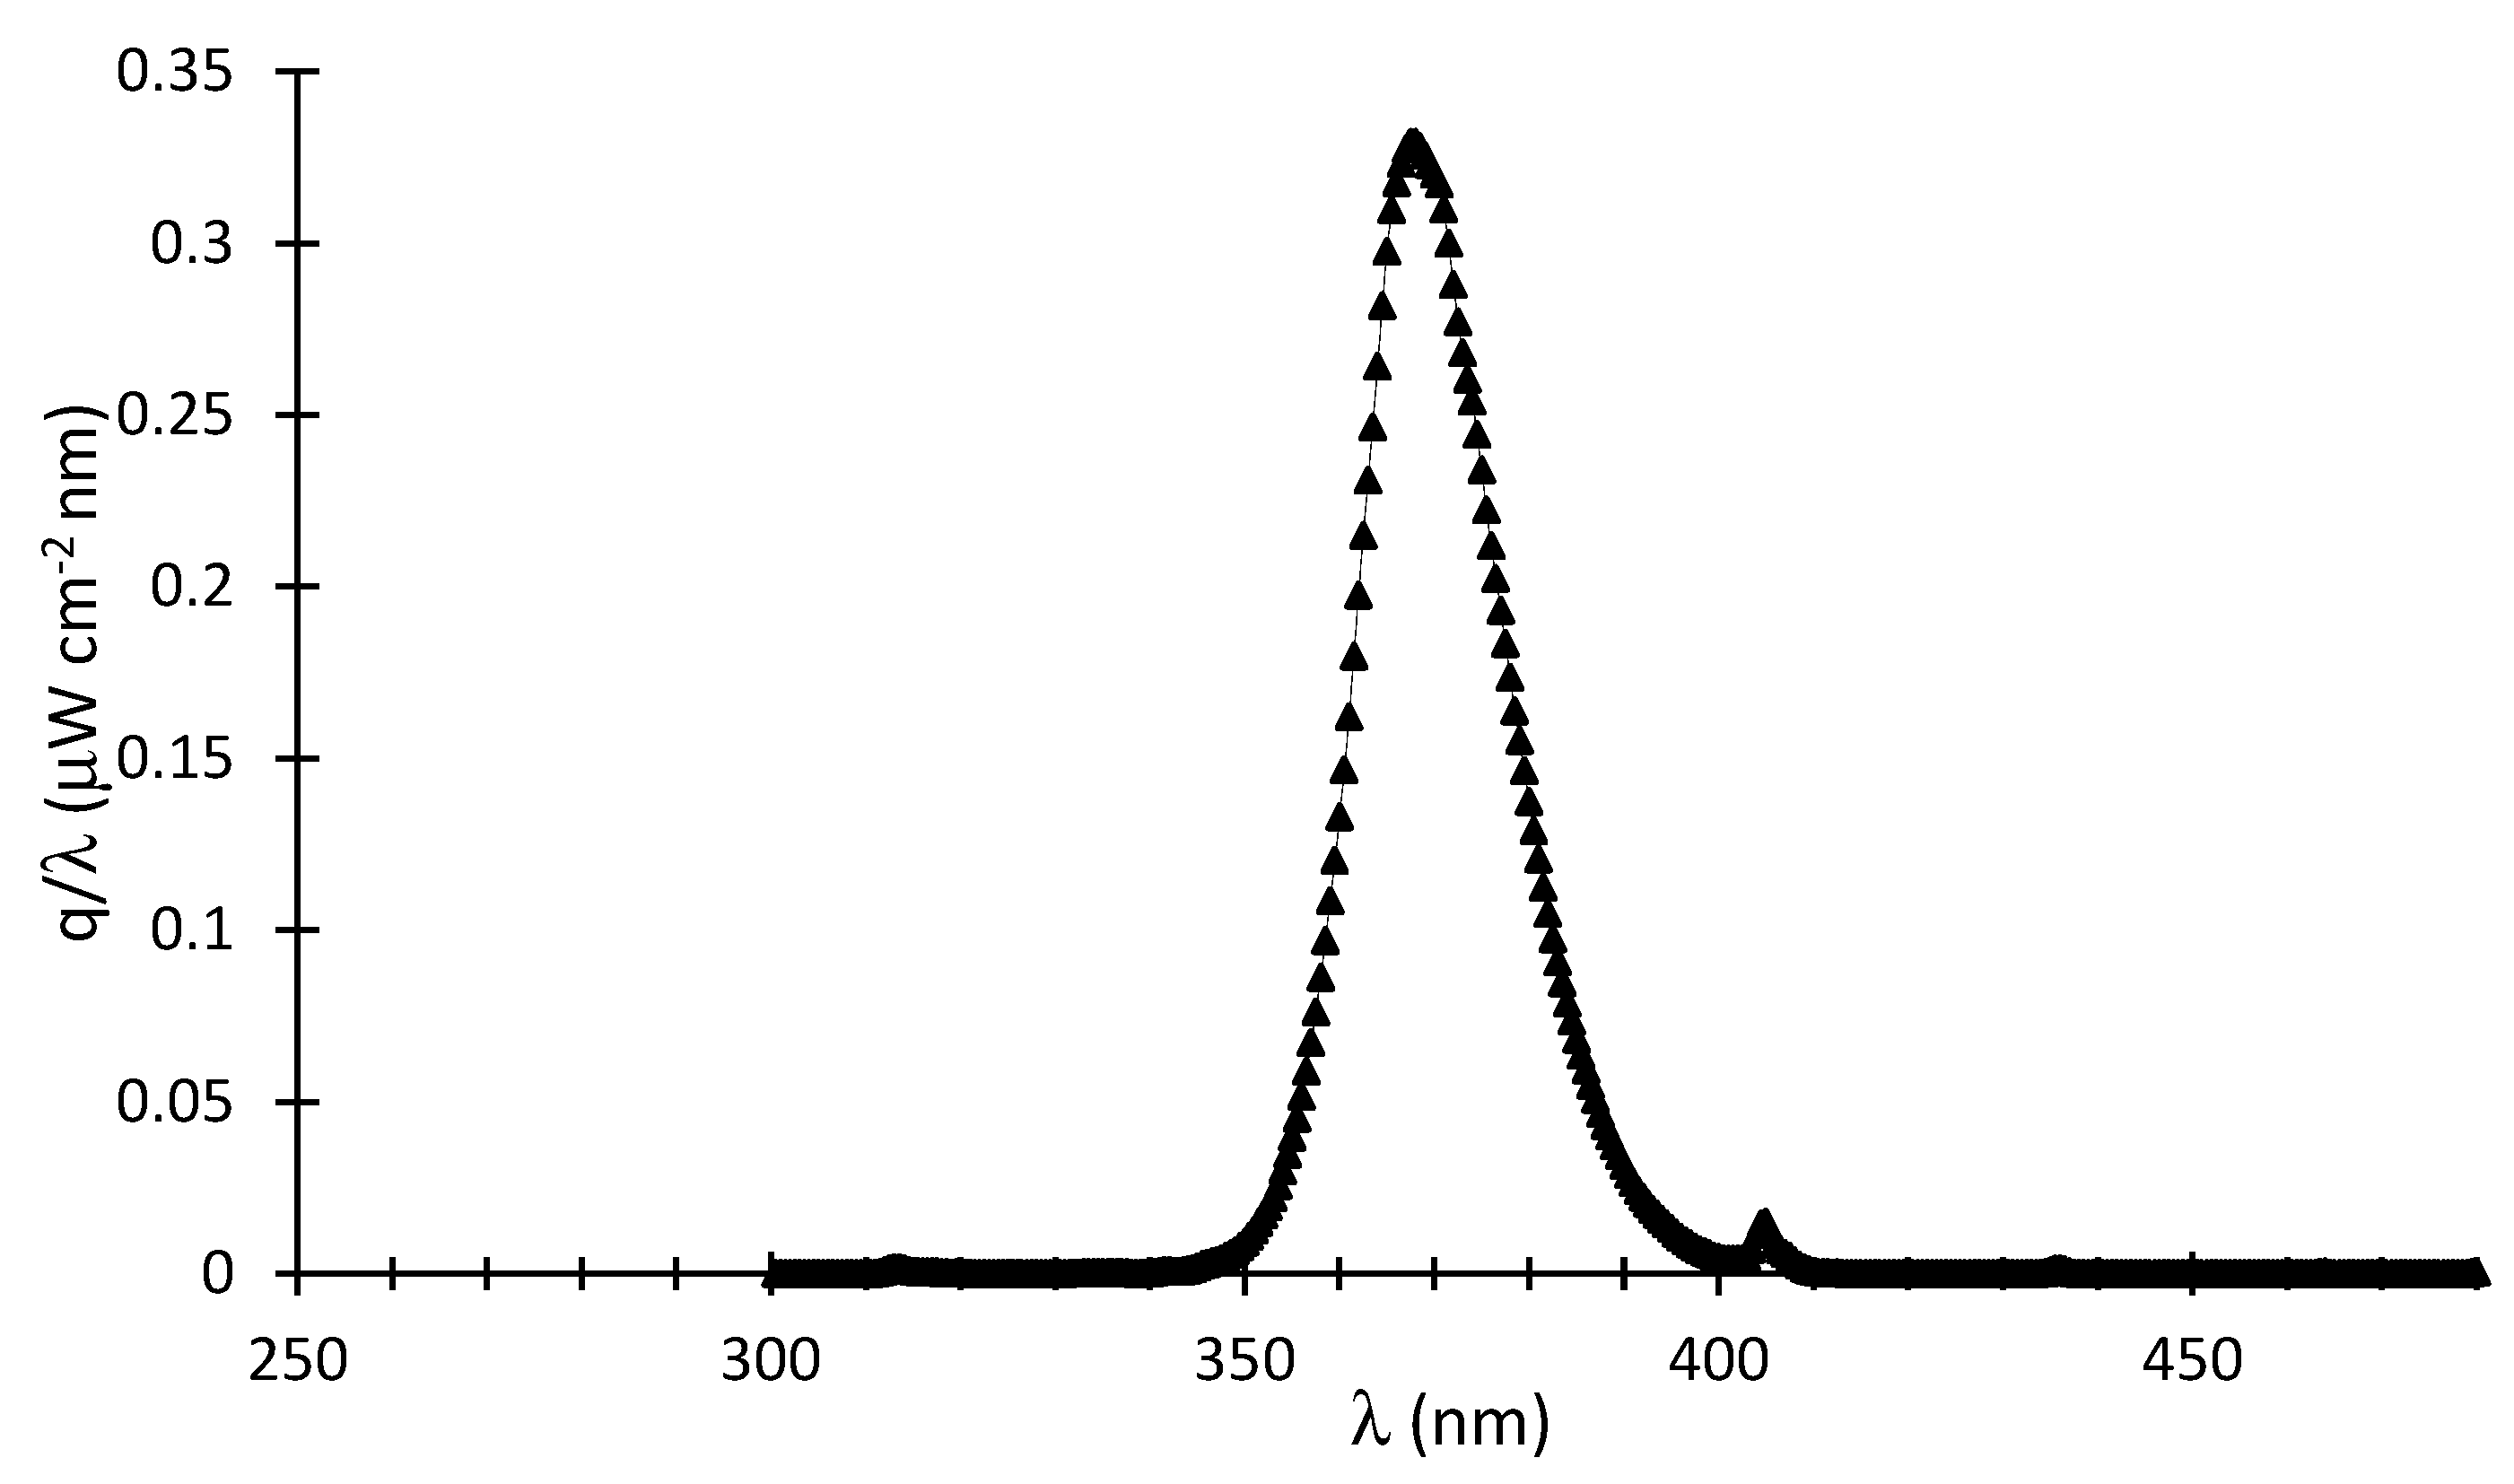
where represents the intensity of the emitted photons in W/cm2, which can be calculated via , with representing the irradiance in W/(cm2 nm) as per in Figure A1.
Figure A1.
q at various wavelengths.
As a result, the average Eav photon energy is as follows:
and
Appendix C. Rate of H● Formation
The rate of formation of H● is described in this appendix for the 1.70 wt % Pt prepared by sol-gel method A. In this case, the H● radical concentrations at 2.5 h and 3.0 h are considered:
Thus, the moles of H● radicals at these two irradiation times are:
Then, the rate of H● formation can be defined as:
Appendix D. Quantum Yield Calculation
Based on the information provided in Appendix A and Appendix C, one can establish the quantum yield for 1.70 wt % Pt prepared by sol-gel method A as:
Appendix E. Carbon Balances
Carbon balances are required to establish the reliability of each of the experiments developed. In order to accomplish this, one has to compare the sum of moles of carbon as found in each of the species detected, with the initial moles of carbon fed to the photocatalytic reactor as ethanol.
An example of a carbon balance calculation is reported for a photocatalyst prepared via incipient impregnation with 1.00 wt % of platinum:
- (a)
- Moles of carbon at irradiation time zero:
- (b)
- Moles of carbon observed at the end of the experiment in both gas and liquid phases following 6 h of irradiation:
- (b.1)
- Moles of ethanol in both liquid and gas phase:
- (b.2)
- Moles of methane in the gas phase:
- (b.3)
- Moles of ethane in the gas phase:
- (b.4)
- Moles of acetaldehyde in the gas phase:
- (b.5)
- Moles of carbon dioxide in both liquid and gas phase:
Thus, the sum of all the moles of carbon contained in various chemical species after six hours of irradiation is:
While this quantity is compared with the moles of ethanol fed, one can see that the percentage error in the carbon balance is as follows:
Thus, a percentage error in the 3% range is assessed. This is acceptable and provides confirmation that all relevant species containing carbon were included in the reaction product analysis.
Appendix F. Ratio of ●OH and H● Consumed
The ratio of ●OH moles and H● moles consumed can be calculated using the following equation:
with 2.
For the 2.50 wt % Pt–TiO2 photocatalyst prepared via sol-gel B, These values were obtained from Figure 12, Figure 13, Figure 14, Figure 15 and Figure 16. The concentration with respect to time for hydrogen peroxide was tracked experimentally using titration with a solution of potassium permanganate (KMnO4) [11], the rate was found. For the value of 39.16 nanomoles/cm3h was assessed using thermodynamic equilibrium calculations, assuming both ideal gas and ideal solution assumptions.
References
- Bahruji, H.; Bowker, M.; Davies, P.R.; Pedrono, F. New insights into the mechanism of photocatalytic reforming on Pd/TiO2. Appl. Catal. B Environ. 2011, 107, 205–209. [Google Scholar] [CrossRef]
- Bahruji, H.; Bowker, M.; Davies, P.R.; Al-Mazroai, L.S.; Dickinson, A.; Greaves, J.; James, D.; Millard, L.; Pedrono, F. Sustainable H2 gas production by photocatalysis. J. Photochem. Photobiol. Chem. 2010, 216, 115–118. [Google Scholar] [CrossRef]
- Kudo, A. Recent progress in the development of visible light-driven powdered photocatalysts for water splitting. Int. J. Hydrogen Energy 2007, 32, 2673–2678. [Google Scholar] [CrossRef]
- Galińska, A.; Walendziewski, J. Photocatalytic Water Splitting over Pt-TiO2 in the Presence of Sacrificial Reagents. Energy Fuels 2005, 19, 1143–1147. [Google Scholar] [CrossRef]
- Escobedo Salas, S.; Serrano Rosales, B.; de Lasa, H. Quantum yield with platinum modified TiO2 photocatalyst for hydrogen production. Appl. Catal. B Environ. 2013, 140–141, 523–536. [Google Scholar] [CrossRef]
- Bahruji, H.; Bowker, M.; Brookes, C.; Davies, P.R.; Wawata, I. The adsorption and reaction of alcohols on TiO2 and Pd/TiO2 catalysts. Appl. Catal. Gen. 2013, 454, 66–73. [Google Scholar] [CrossRef]
- Yoong, L.S.; Chong, F.K.; Dutta, B.K. Development of copper-doped TiO2 photocatalyst for hydrogen production under visible light. Energy 2009, 34, 1652–1661. [Google Scholar] [CrossRef]
- Guayaquil-Sosa, J.F.; Serrano-Rosales, B.; Valadés-Pelayo, P.J.; de Lasa, H. Photocatalytic hydrogen production using mesoporous TiO2 doped with Pt. Appl. Catal. B Environ. 2017, 211, 337–348. [Google Scholar] [CrossRef]
- Cerdá, J.; Marchetti, J.L.; Cassano, A.E. Radiation efficiencies in elliptical photoreactors. Lat. Am. J. Heat Mass Transfer. 1977, 1, 33–63. [Google Scholar]
- Escobedo, S.; Serrano, B.; Calzada, A.; Moreira, J.; de Lasa, H. Hydrogen production using a platinum modified TiO2 photocatalyst and an organic scavenger. Kinetic modeling. Fuel 2016, 181, 438–449. [Google Scholar] [CrossRef]
- Philip, G.K.; Brandhuber, J. Methods for the Detection of Residual Concentrations of Hydrogen Peroxide in Advanced Oxidation Processes; WateReuse Foundation: Alexandria, VA, USA, 2009. [Google Scholar]
Figure 1.
Schematic diagram of a TiO2 photocatalyst with added Pt. Pt sites are shown inside and outside semiconductor particles. Inner sites are dominant electron reservoirs enhancing hydrogen production.
Figure 1.
Schematic diagram of a TiO2 photocatalyst with added Pt. Pt sites are shown inside and outside semiconductor particles. Inner sites are dominant electron reservoirs enhancing hydrogen production.

Figure 2.
Schematic diagrams of the Photo-CREC Water II Reactor with a H2 mixing/storage tank: (a) Longitudinal cross-section of the Photo-CREC Water II unit showing the downflow slurry circulation in the annular channel; (b) overall view of Photo-CREC Water II showing windows and recirculation pump and (c) hydrogen storage tank with its components. Adapted from [10].

Figure 3.
Adsorption–desorption isotherms for Pt- TiO2. Pt was added by wet impregnation.
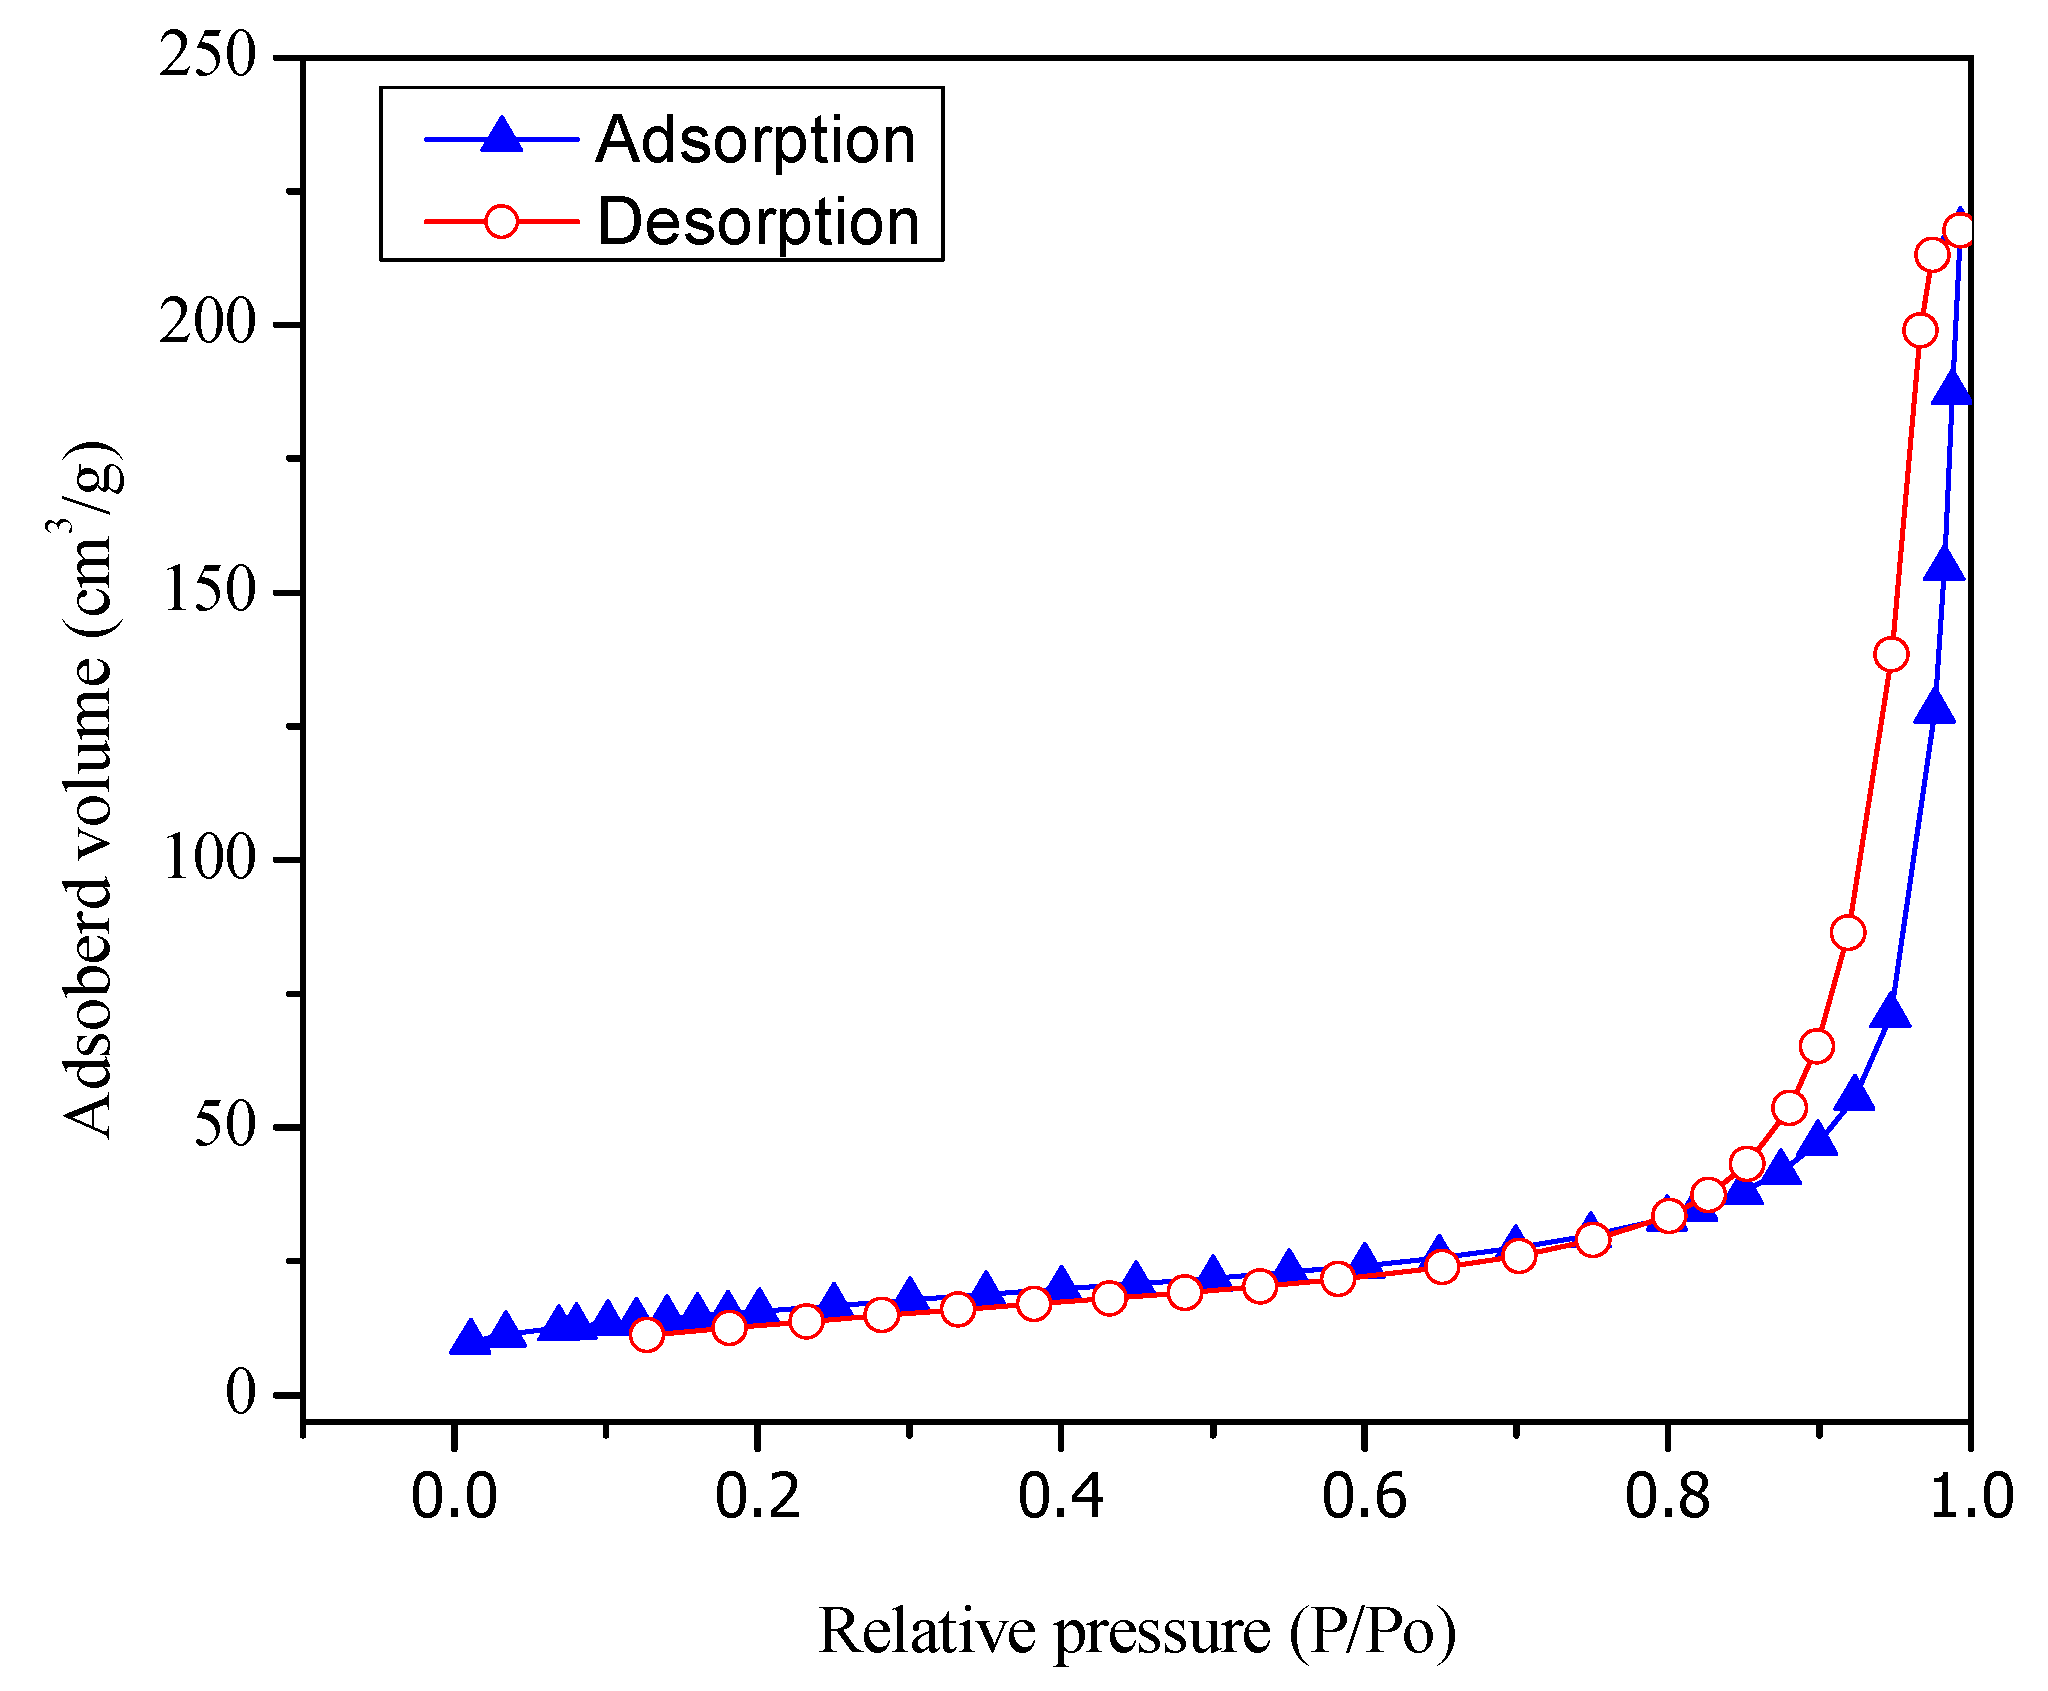
Figure 4.
Adsorption–desorption of N2 on TiO2 with 1.70 wt % Pt prepared via the sol-gel A method.

Figure 5.
Pore size distribution of the Pt–TiO2 prepared via incipient wetness impregnation; (●) mesoporous TiO2 thermally treated at 550 °C (Guayaquil et al. [10] (sol-gel B), (■) mesoporous TiO2 calcined at 450 °C (sol-gel A), (Δ) Degussa P25 impregnated with 1.00 wt % Pt and calcined at 450 °C.
Figure 5.
Pore size distribution of the Pt–TiO2 prepared via incipient wetness impregnation; (●) mesoporous TiO2 thermally treated at 550 °C (Guayaquil et al. [10] (sol-gel B), (■) mesoporous TiO2 calcined at 450 °C (sol-gel A), (Δ) Degussa P25 impregnated with 1.00 wt % Pt and calcined at 450 °C.

Figure 6.
Tauc Plots for sol-gel A based TiO2 photocatalysts calcined at 450 °C: (A) TiO2 sol-gel A; (B) TiO2 sol-gel A with 0.42 wt % Pt; (C) TiO2 sol-gel A with 0.82 wt % Pt; (D) TiO2 sol-gel A with 1.70 wt % Pt. Ebg was calculated using the intersection of Tauc’s line with the abscise axis; ≈ − Ebg. Note: The Tauc plots for sol-gel B were reported in our previous paper [8].

Figure 7.
Influence of platinum loading on the band gap of the photocatalysts: (●) TiO2—Mesoporous, thermally treated at 550 °C (sol-gel B) [8], (■) TiO2—Mesoporous, calcined 450 °C (sol-gel A), (Δ) Degussa P25 impregnated and calcined at 450 °C. Note: The band gap for Degussa P25 without Pt loaded was recorded at 3.20 eV.

Figure 8.
X-ray diffractogram for: (A) TiO2, Degussa P25; (B) wet impregnated with 1.70 wt % Pt on TiO2 Degussa P25; (C) incipiently impregnated with 1.00 wt % Pt on TiO2 Degussa P25.
Figure 8.
X-ray diffractogram for: (A) TiO2, Degussa P25; (B) wet impregnated with 1.70 wt % Pt on TiO2 Degussa P25; (C) incipiently impregnated with 1.00 wt % Pt on TiO2 Degussa P25.
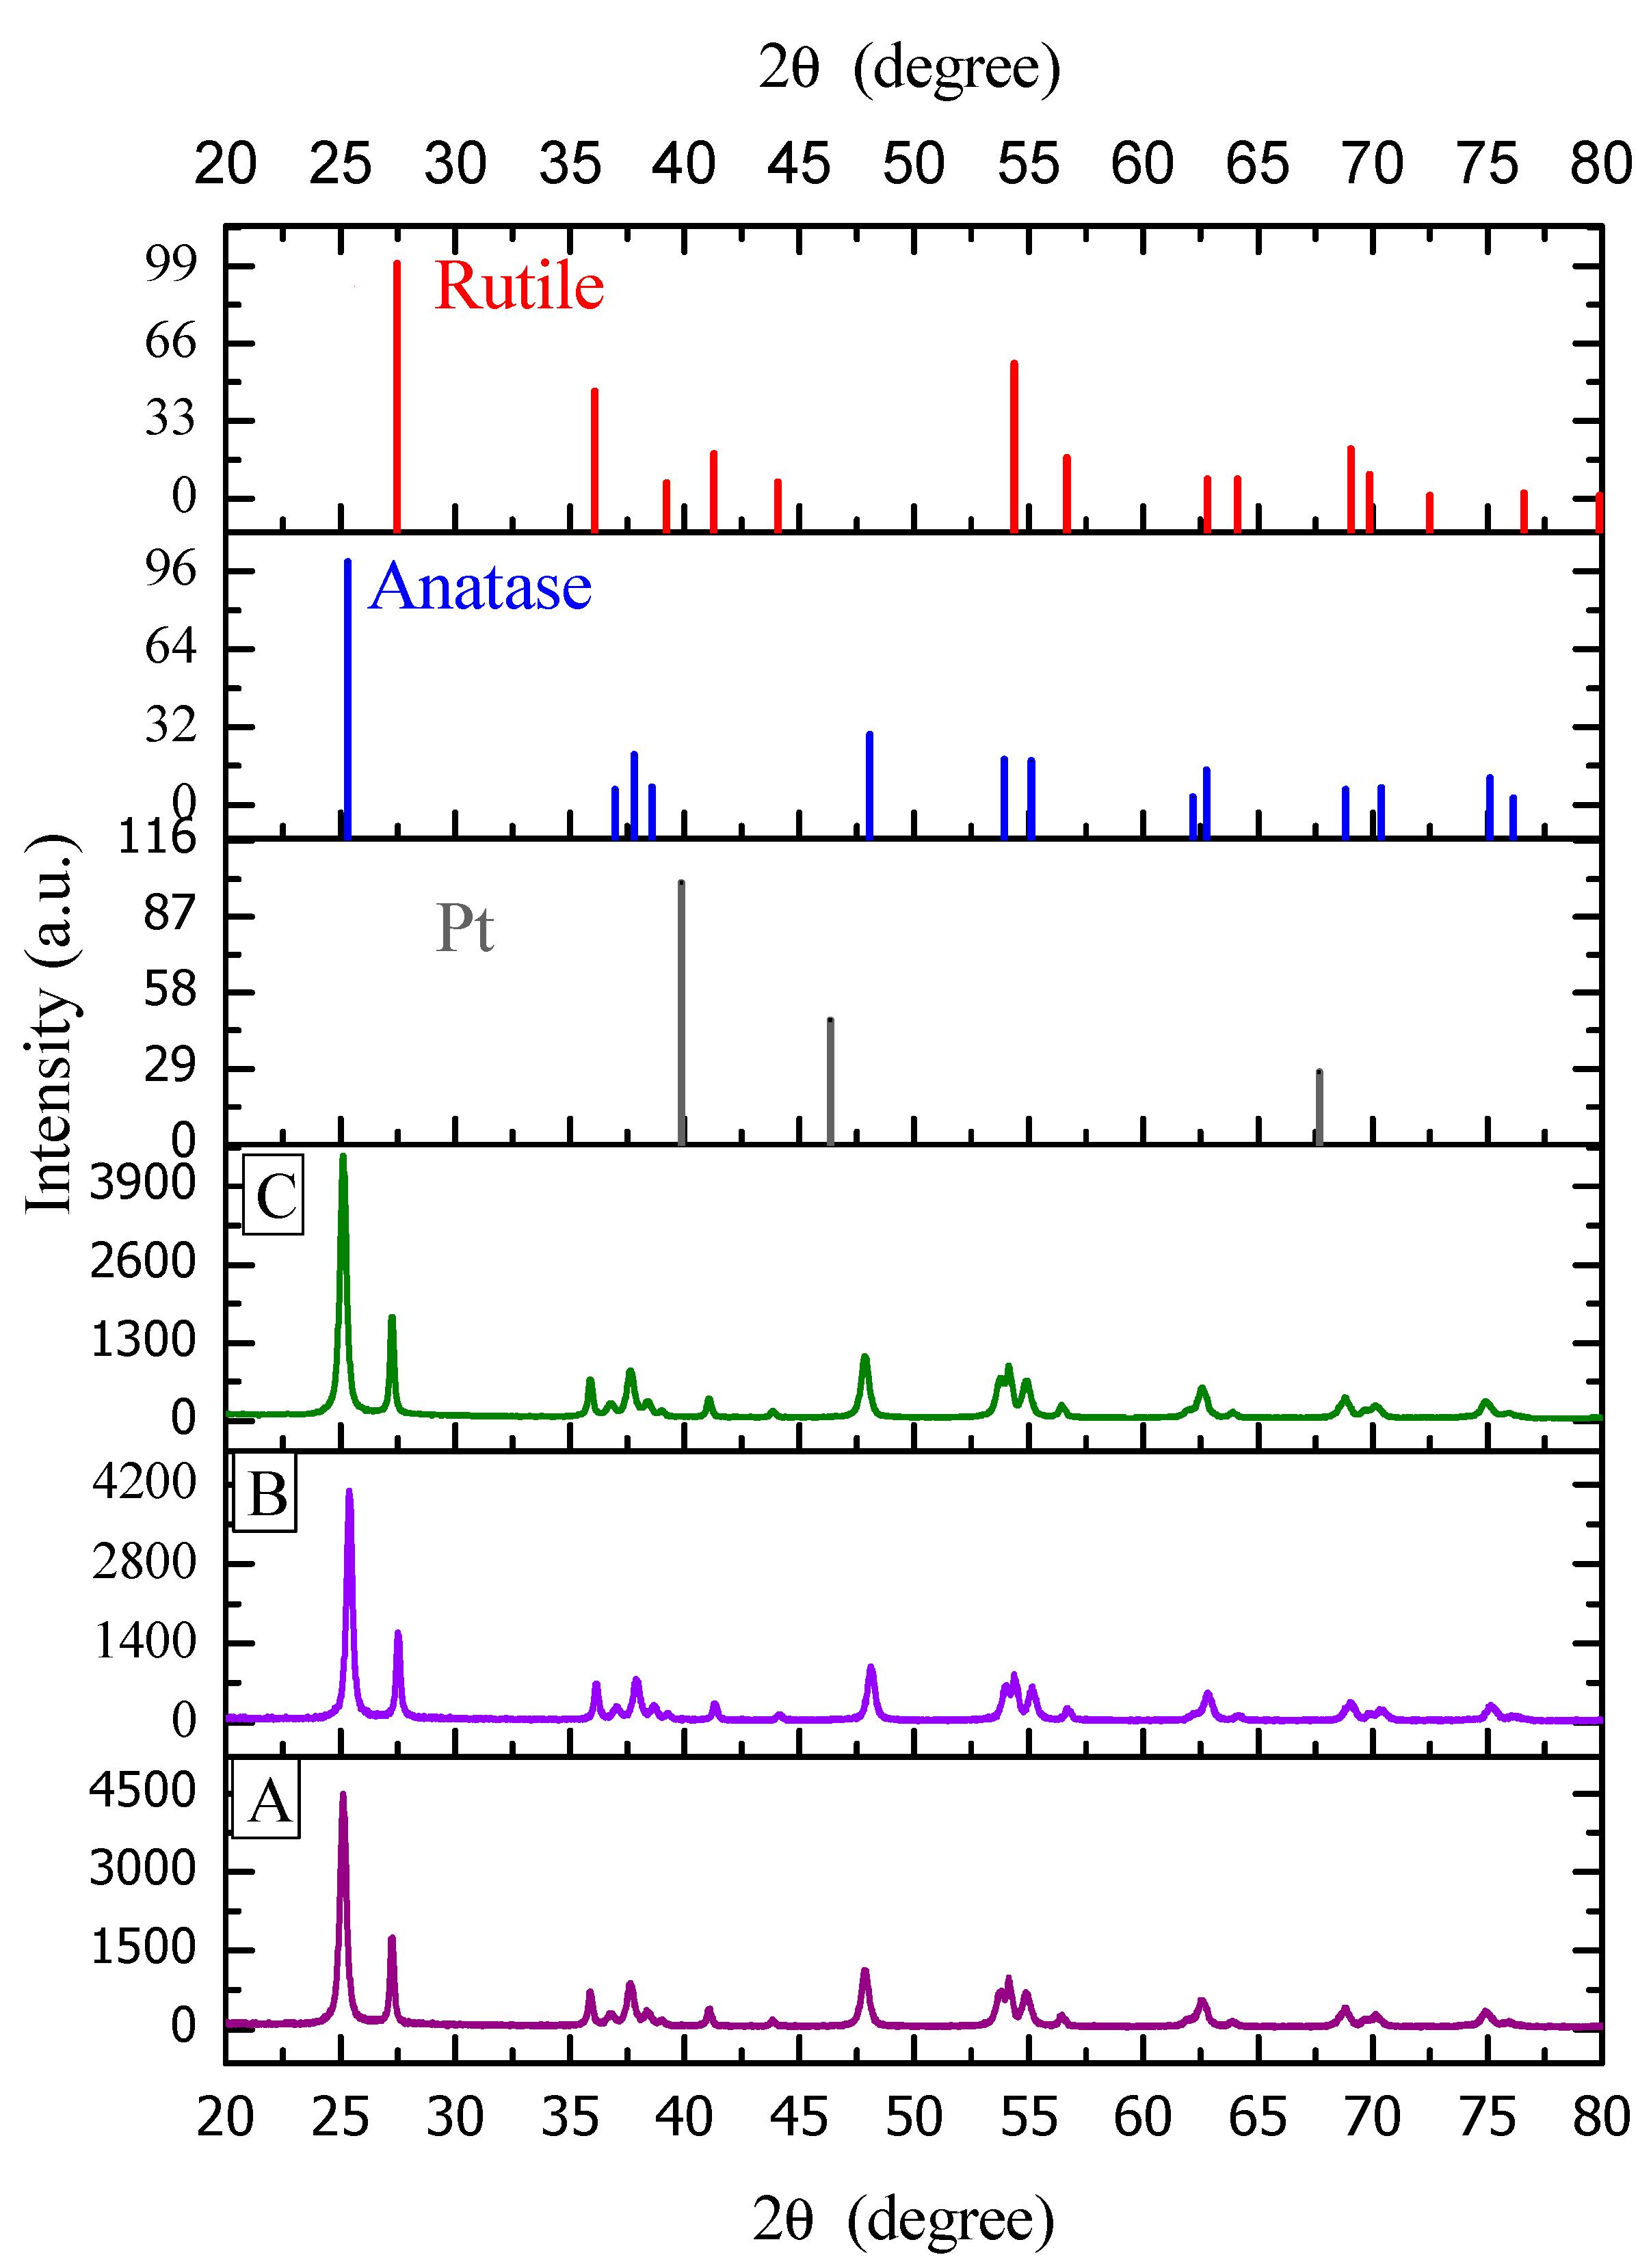
Figure 9.
Cumulative hydrogen formation under an argon atmosphere for various photocatalysts: (♦,◊) Pt–TiO2 prepared via incipient wetness impregnation with 1.70 wt % and 0.82 wt % of Pt loadings on TiO2 Degussa P25, (Δ) Degussa P25 and (+) Blank run [no photocatalyst]. Photoreaction conditions: pH = 4.00 ± 0.05, 2.00% v/v ethanol, photocatalyst loading: 0.15 g/L. Standard deviation for repeats was ±5%.
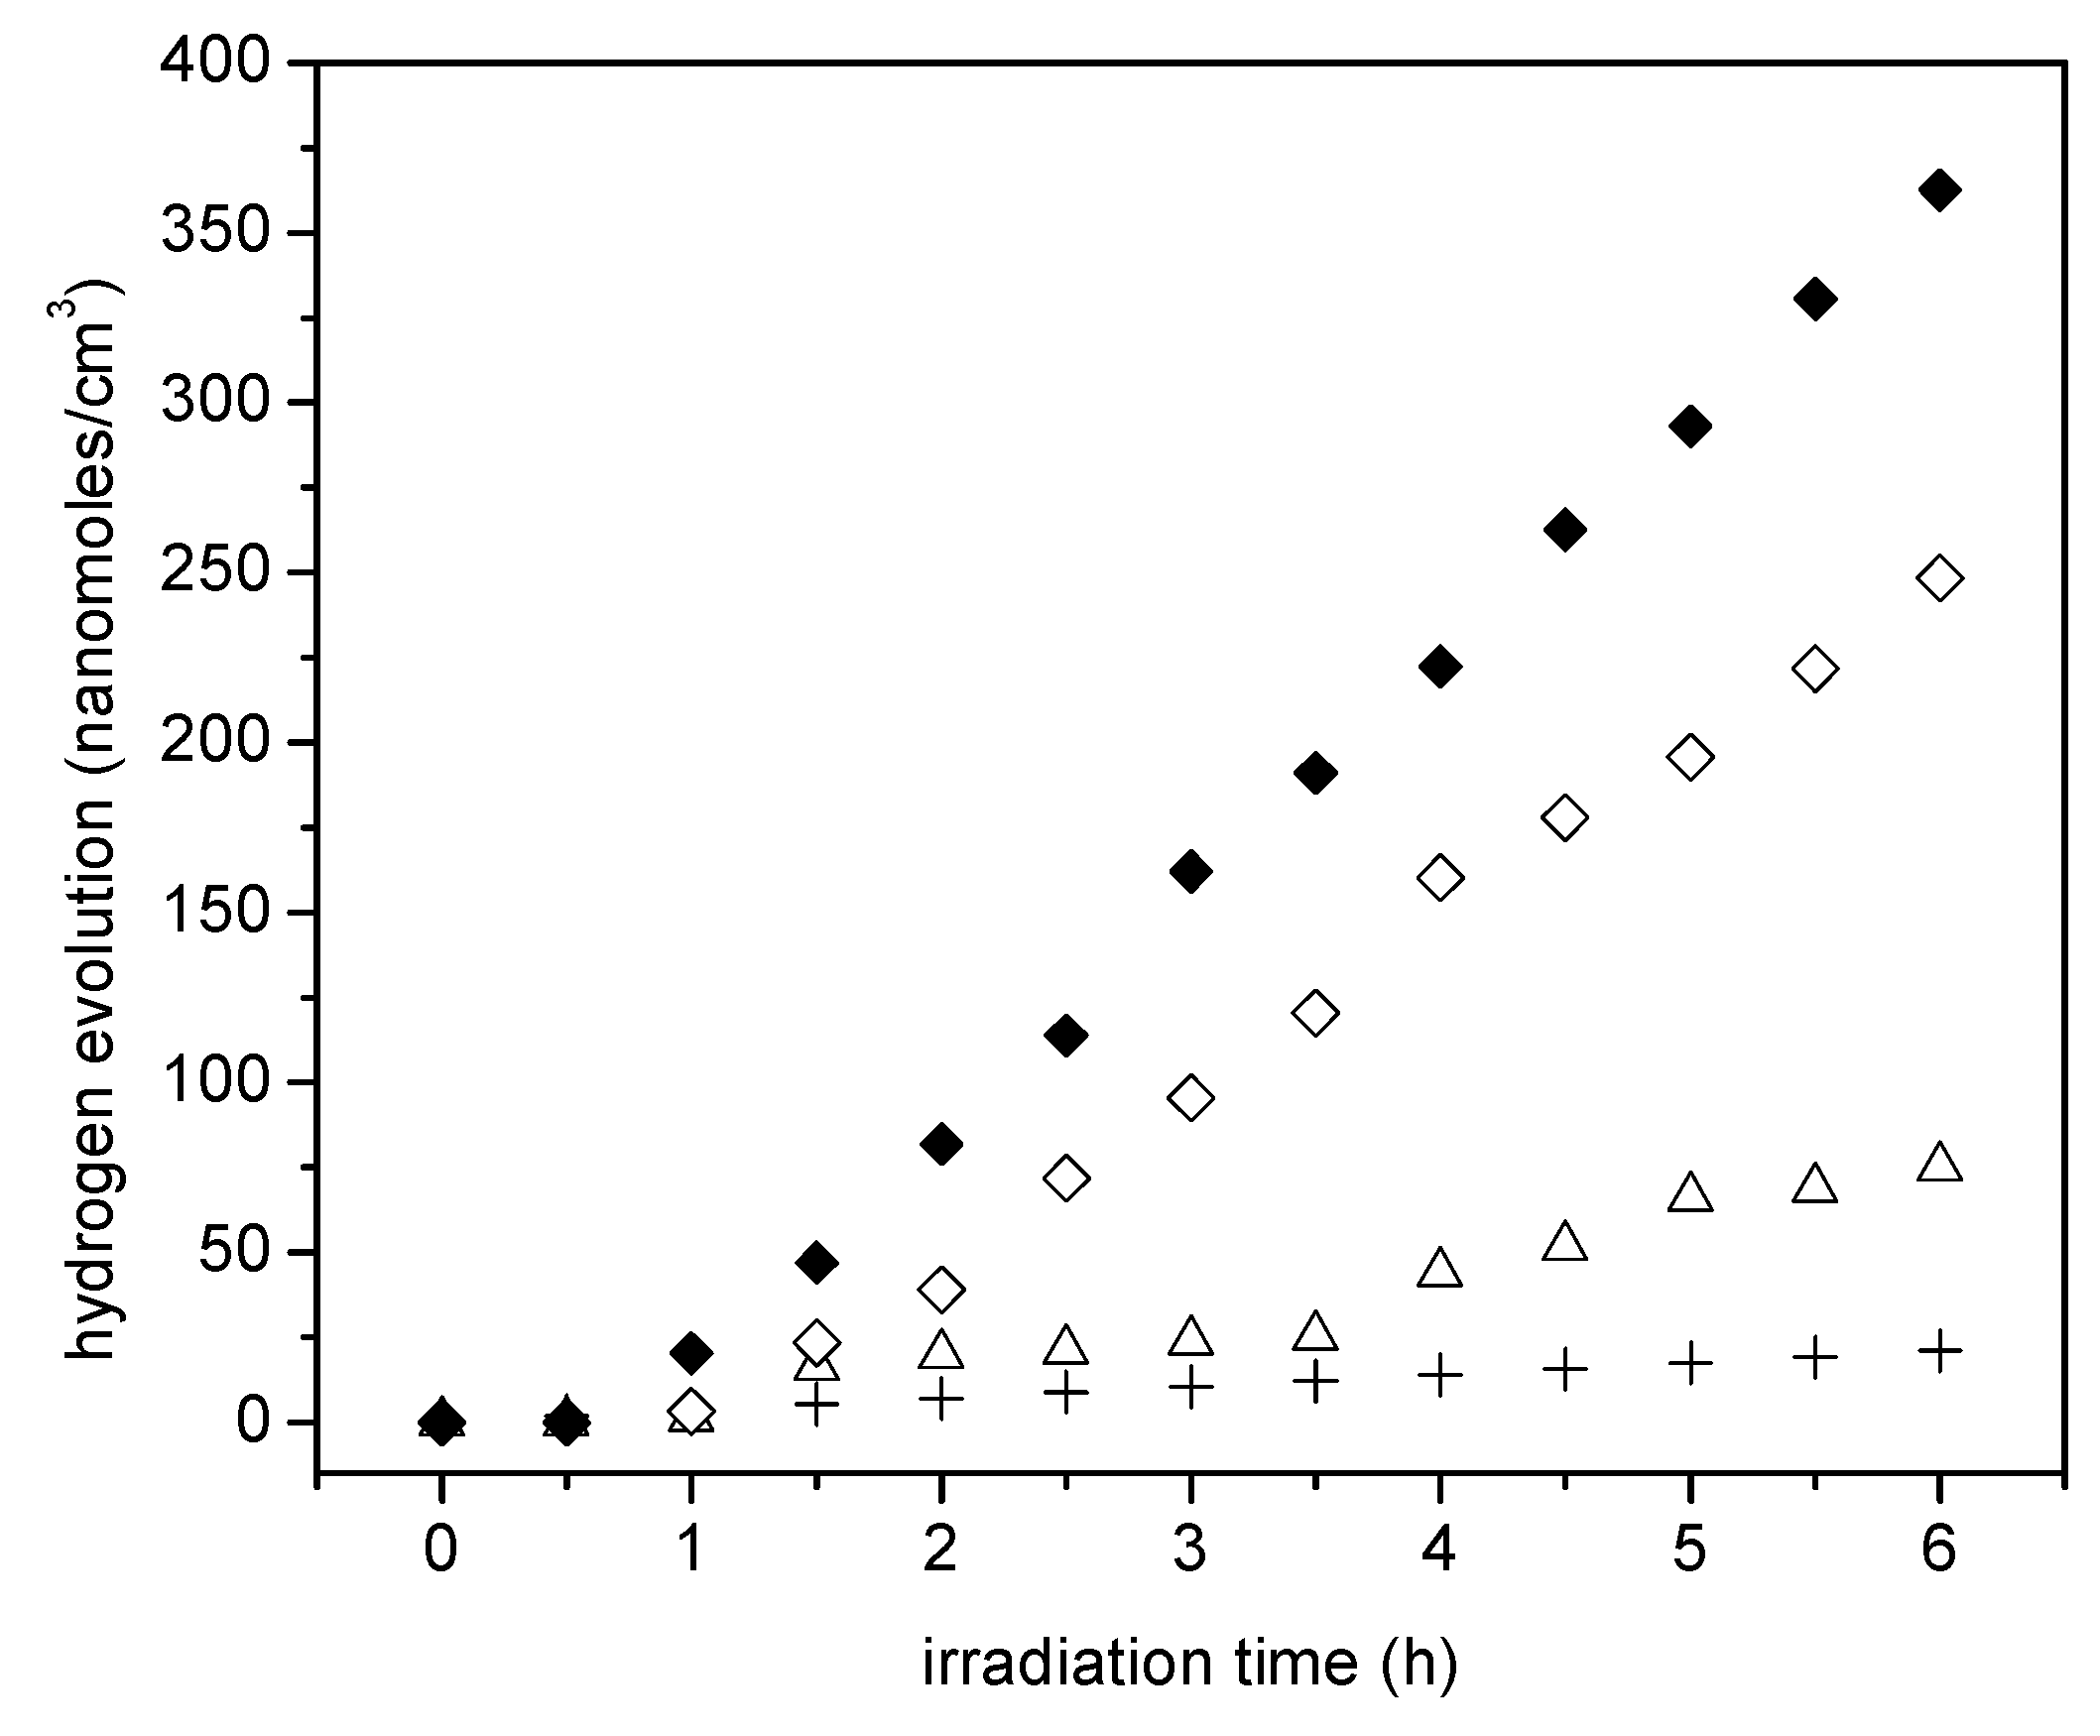
Figure 10.
Cumulative hydrogen formation under an argon atmosphere for various photocatalysts using: (■) Pt–TiO2 prepared via sol-gel A with 1.70 wt % of Pt loadings, (□) TiO2 prepared via sol-gel A and (Δ) Degussa P25, (+) Blank run [no photo catalyst loaded]. Photoreaction conditions: pH = 4.00 ± 0.05, 2.00% v/v ethanol, photocatalyst loading: 0.15 g/L. Standard deviation for repeats was ±5%.

Figure 11.
Cumulative hydrogen formation under an argon atmosphere for various photocatalysts using: (●) () (○) Pt–TiO2 prepared via sol-gel B with 2.50 wt % and 1.00 wt % Pt, (Δ) Degussa P25, (+) Blank run [no photocatalyst]. Photoreaction conditions: pH = 4.00 ± 0.05, 2.00% v/v ethanol, photocatalyst loading: 0.15 g/L. Standard deviation for repeats was ±5%.
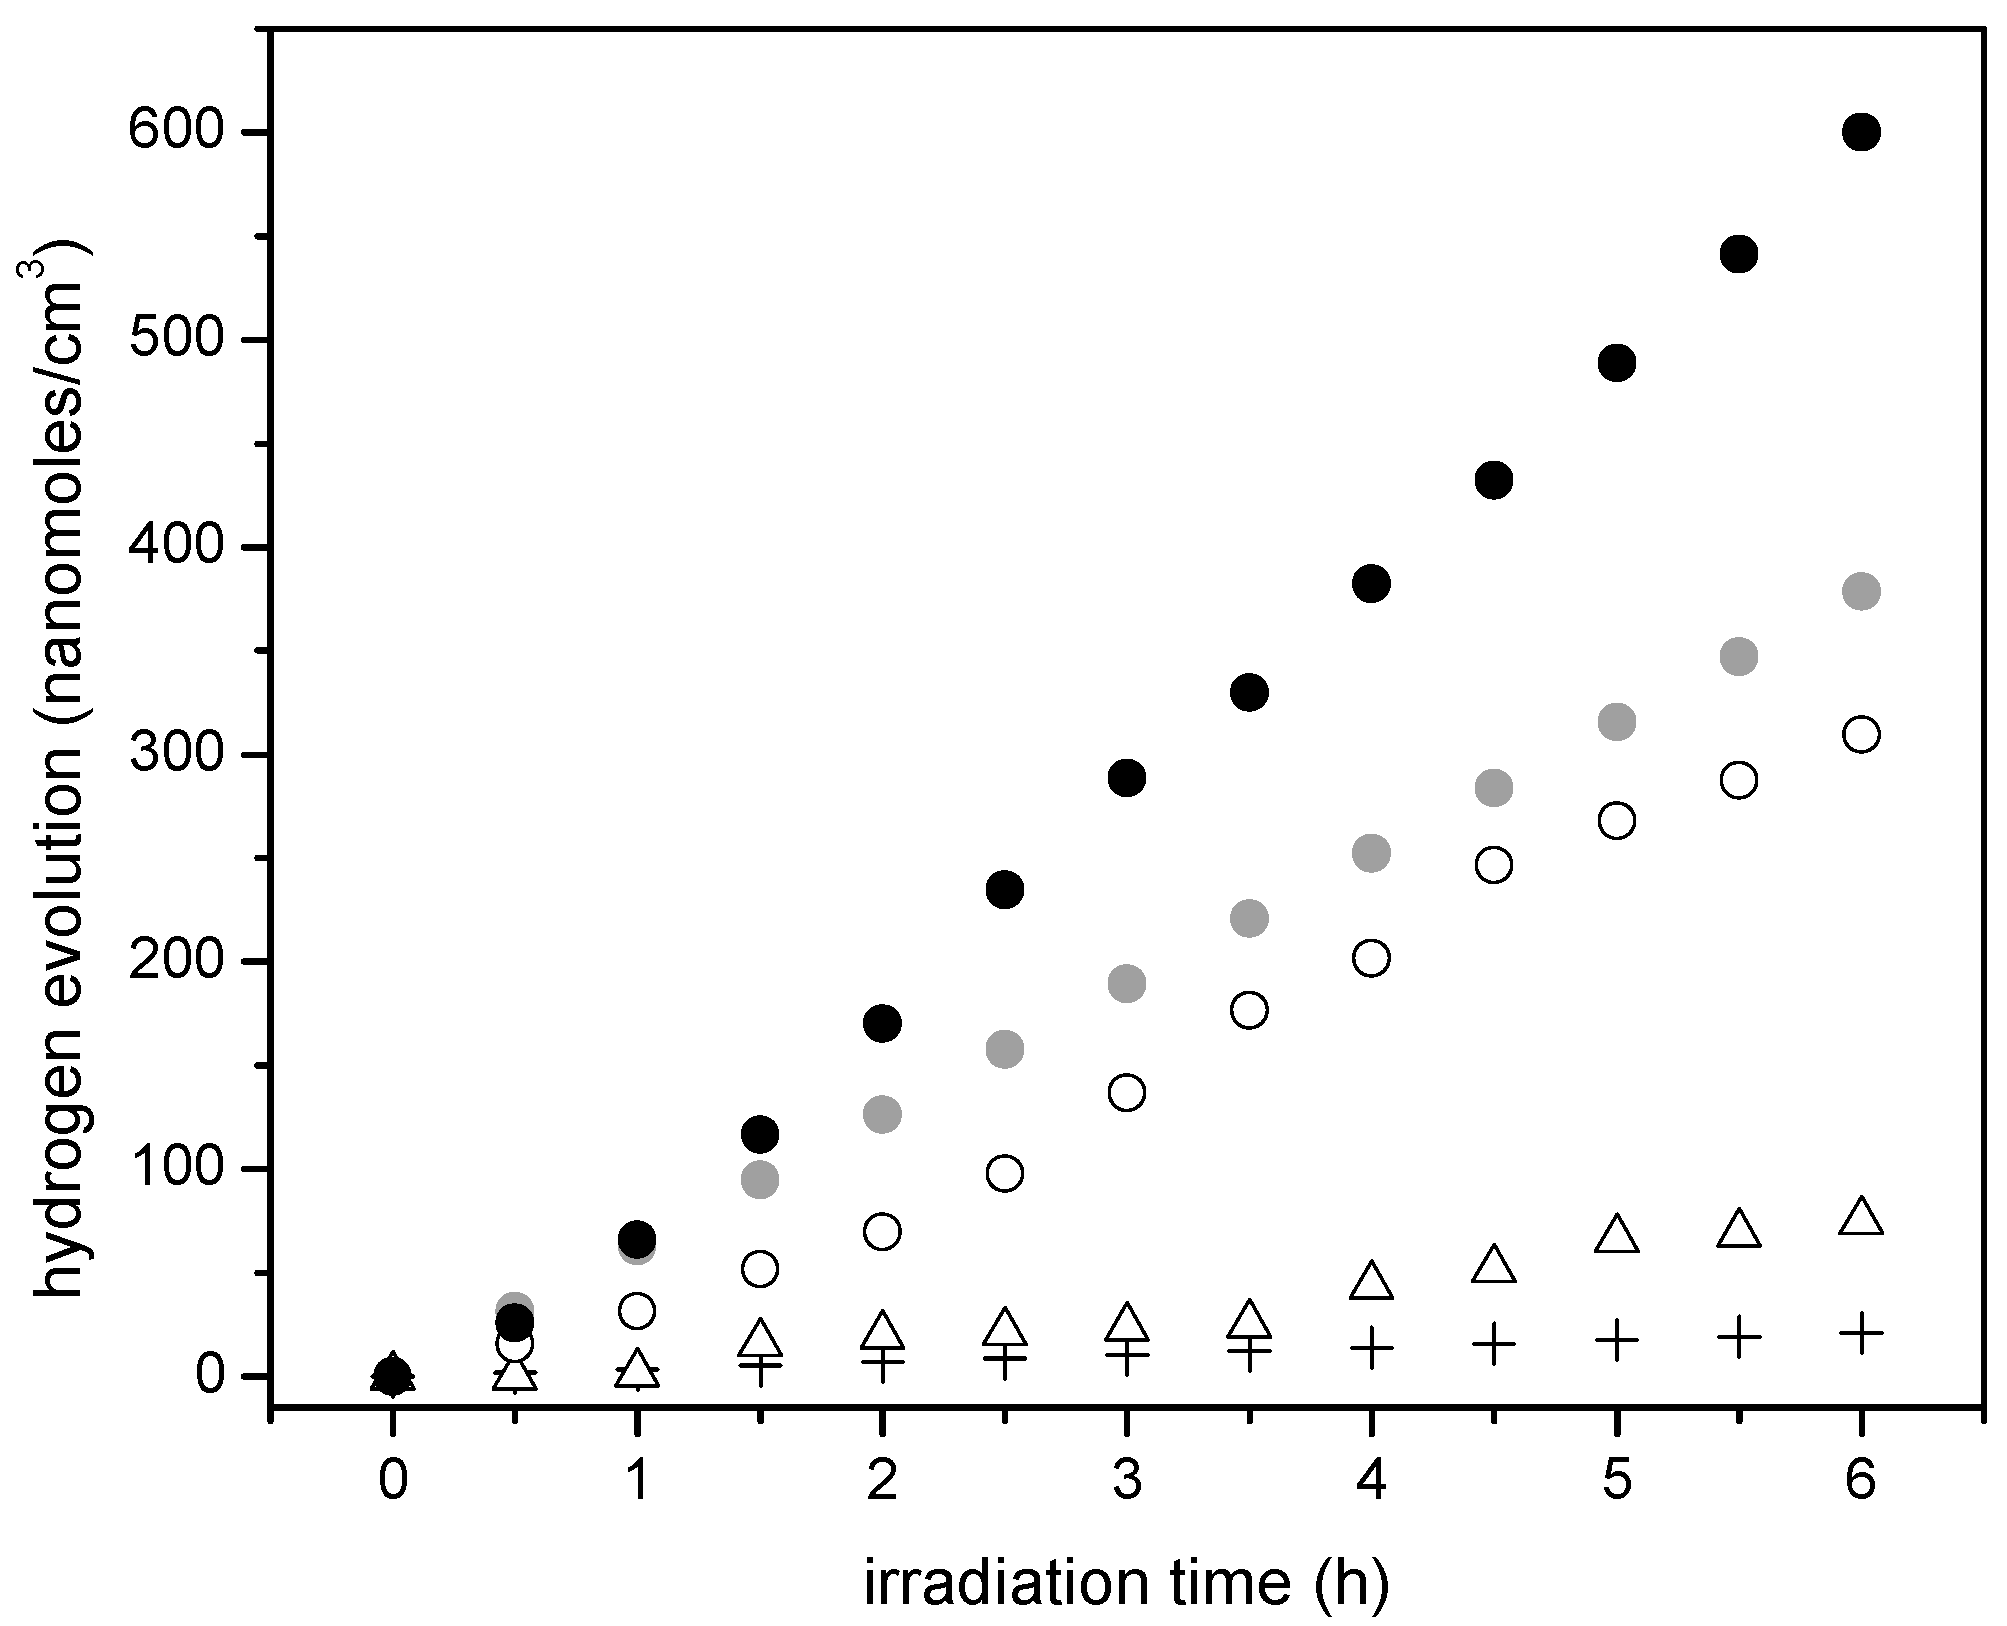
Figure 12.
Oxidation–reduction network promoted by TiO2 and Pt sites in the Pt–TiO2 photocatalysts.
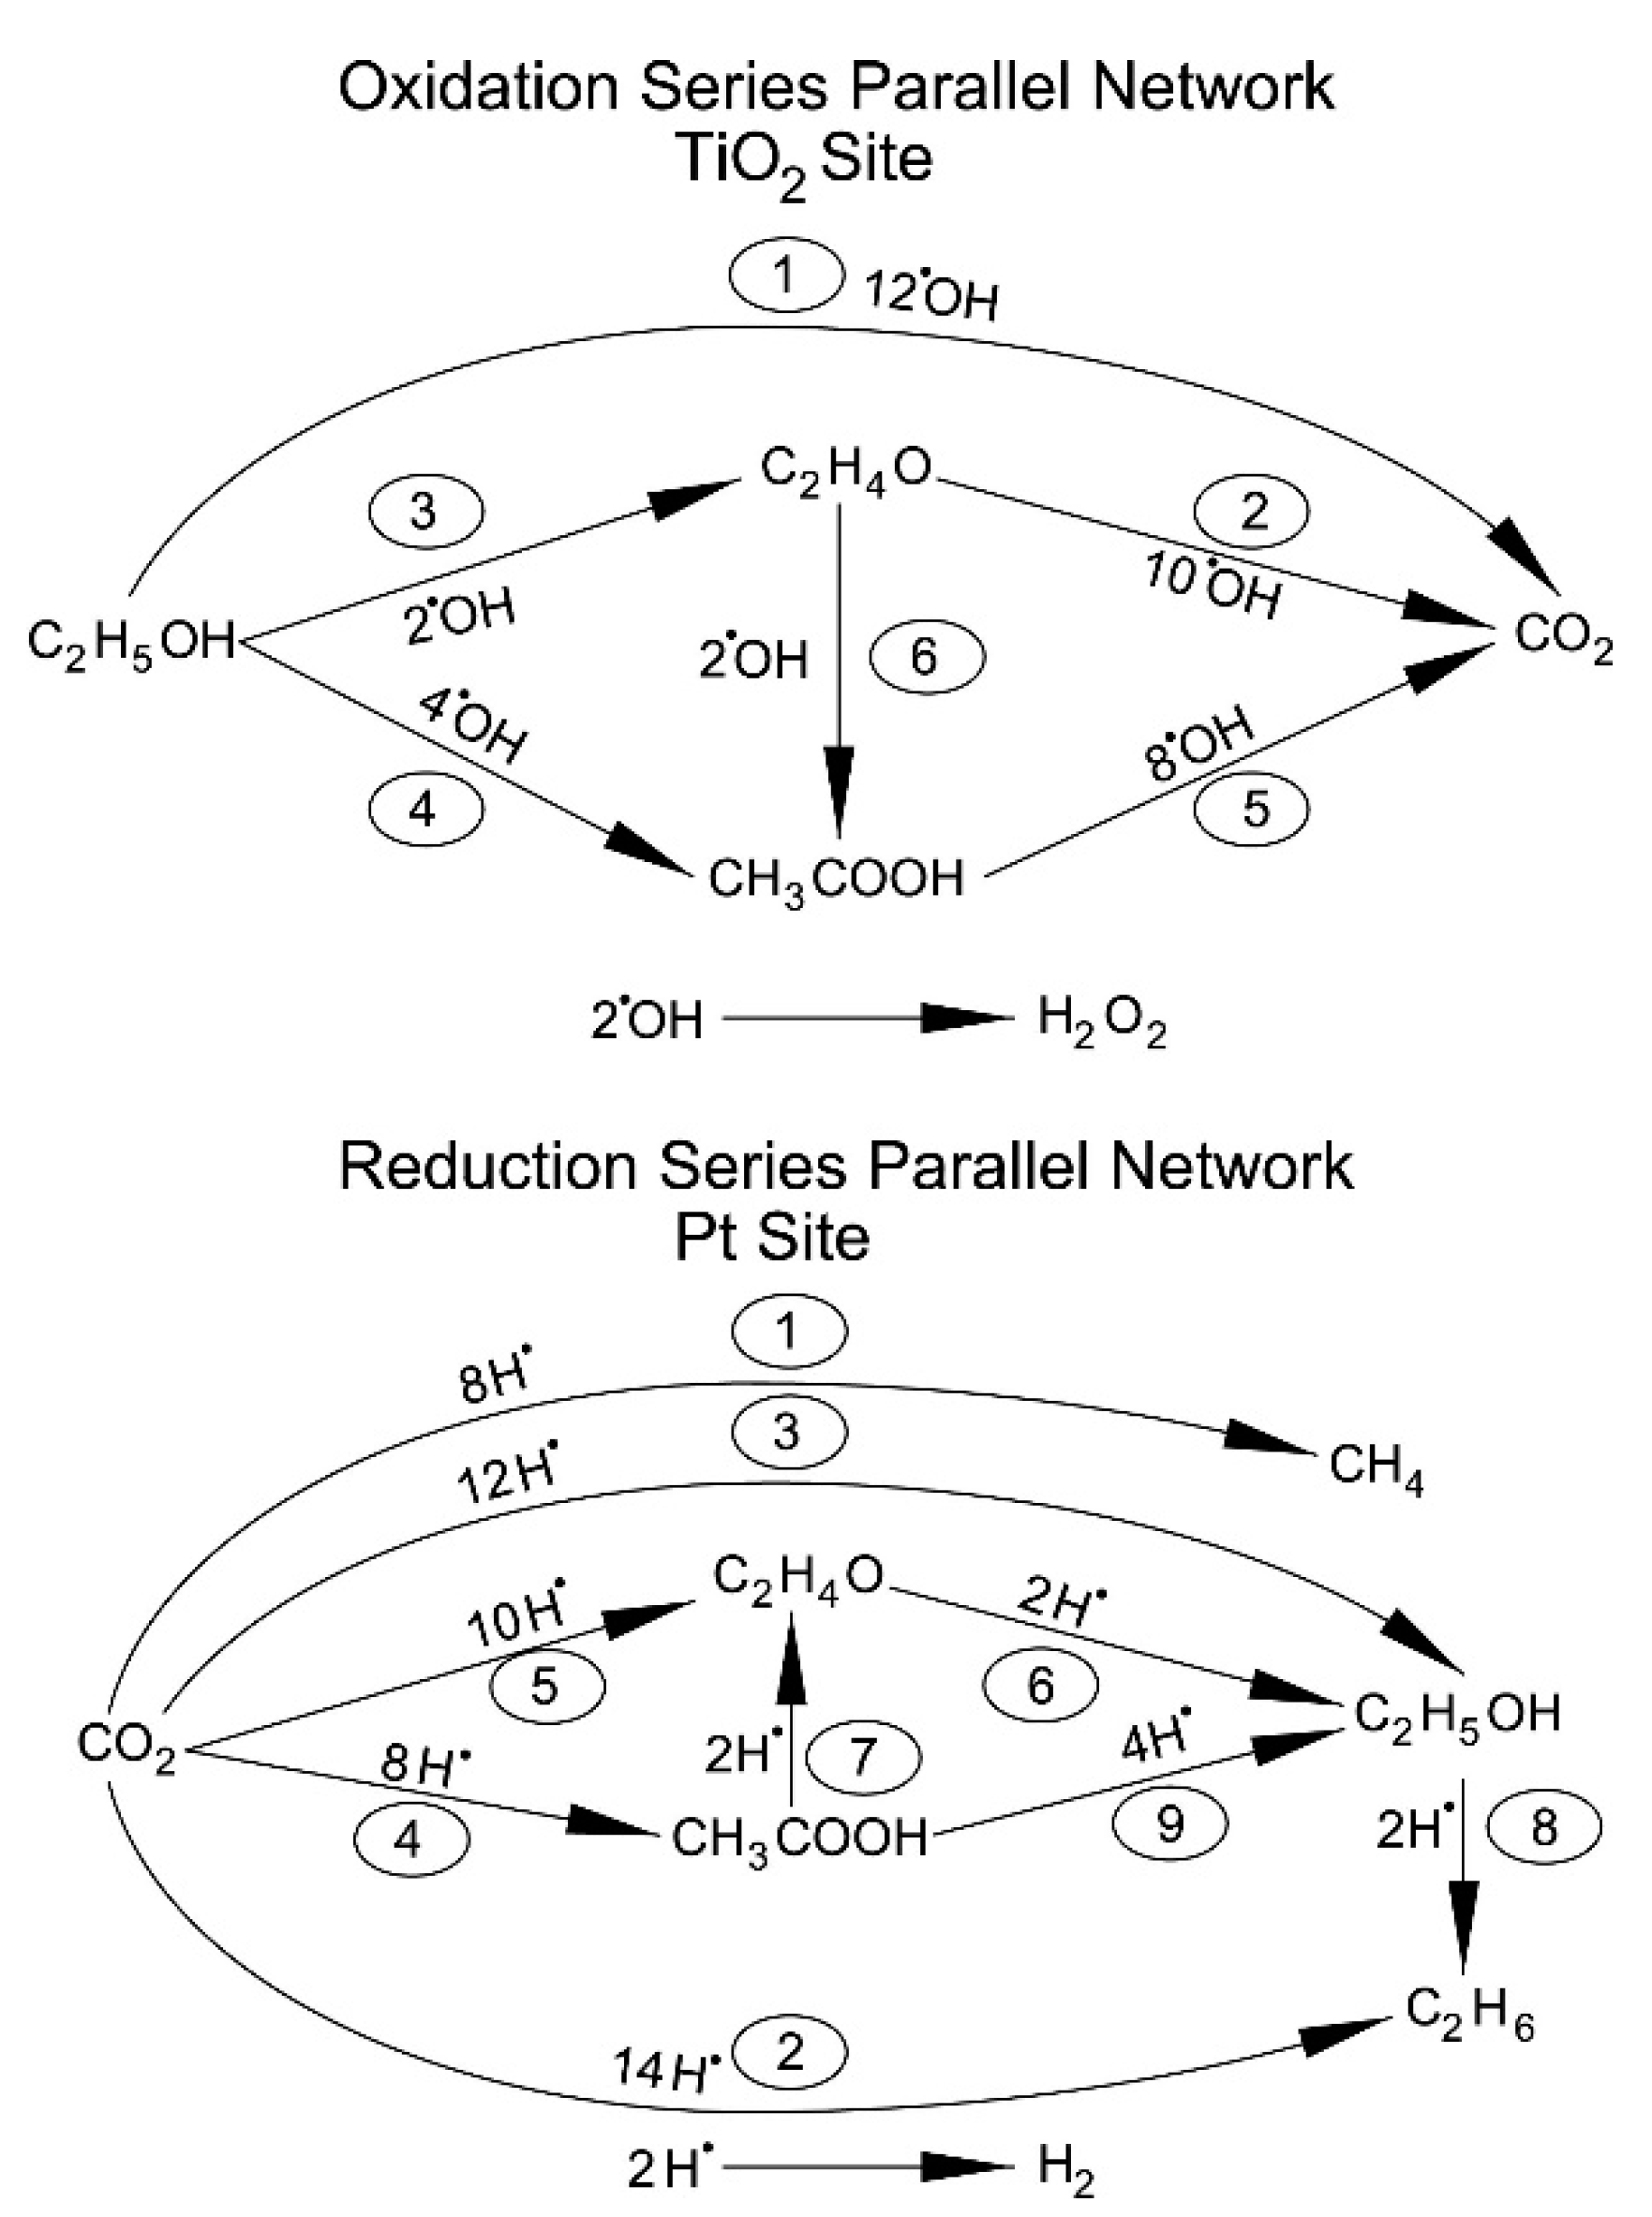
Figure 13.
Methane increase with irradiation time for: (●) 2.50 wt % Pt–TiO2 (sol-gel B), (■) 1.70 wt % Pt–TiO2 (sol-gel A), (♦) 1.70 wt % Pt–TiO2 (wetness impregnation) and (∆) Degussa P25. Standard deviation for repeats is within ±5%.
Figure 13.
Methane increase with irradiation time for: (●) 2.50 wt % Pt–TiO2 (sol-gel B), (■) 1.70 wt % Pt–TiO2 (sol-gel A), (♦) 1.70 wt % Pt–TiO2 (wetness impregnation) and (∆) Degussa P25. Standard deviation for repeats is within ±5%.

Figure 14.
Ethane increase with irradiation time for: (●) 2.50 wt % Pt–TiO2 (sol-gel B), (■) 1.70 wt % Pt–TiO2 (sol-gel A), (♦) 1.70 wt % Pt–TiO2 (wetness impregnation) and (∆) Degussa P25. Standard deviation for repeats is within ±5%.
Figure 14.
Ethane increase with irradiation time for: (●) 2.50 wt % Pt–TiO2 (sol-gel B), (■) 1.70 wt % Pt–TiO2 (sol-gel A), (♦) 1.70 wt % Pt–TiO2 (wetness impregnation) and (∆) Degussa P25. Standard deviation for repeats is within ±5%.

Figure 15.
Acetaldehyde increase with irradiation time: (●) 2.50 wt % Pt–TiO2 (sol-gel B), (■) 1.70 wt % Pt–TiO2 (sol-gel A), (♦) 1.70 wt % Pt–TiO2 (wetness impregnation) and (∆) Degussa P25. Standard deviation for repeats was within ±5%.
Figure 15.
Acetaldehyde increase with irradiation time: (●) 2.50 wt % Pt–TiO2 (sol-gel B), (■) 1.70 wt % Pt–TiO2 (sol-gel A), (♦) 1.70 wt % Pt–TiO2 (wetness impregnation) and (∆) Degussa P25. Standard deviation for repeats was within ±5%.

Figure 16.
CO2 increase with irradiation time for: (●) 2.50 wt % Pt–TiO2 (sol-gel B), (■) 1.70 wt % Pt–TiO2 (sol-gel A), (♦) 1.70 wt % Pt–TiO2 (wetness impregnation) and (∆) Degussa P25. Standard deviation for repeats is within ±5%.
Figure 16.
CO2 increase with irradiation time for: (●) 2.50 wt % Pt–TiO2 (sol-gel B), (■) 1.70 wt % Pt–TiO2 (sol-gel A), (♦) 1.70 wt % Pt–TiO2 (wetness impregnation) and (∆) Degussa P25. Standard deviation for repeats is within ±5%.
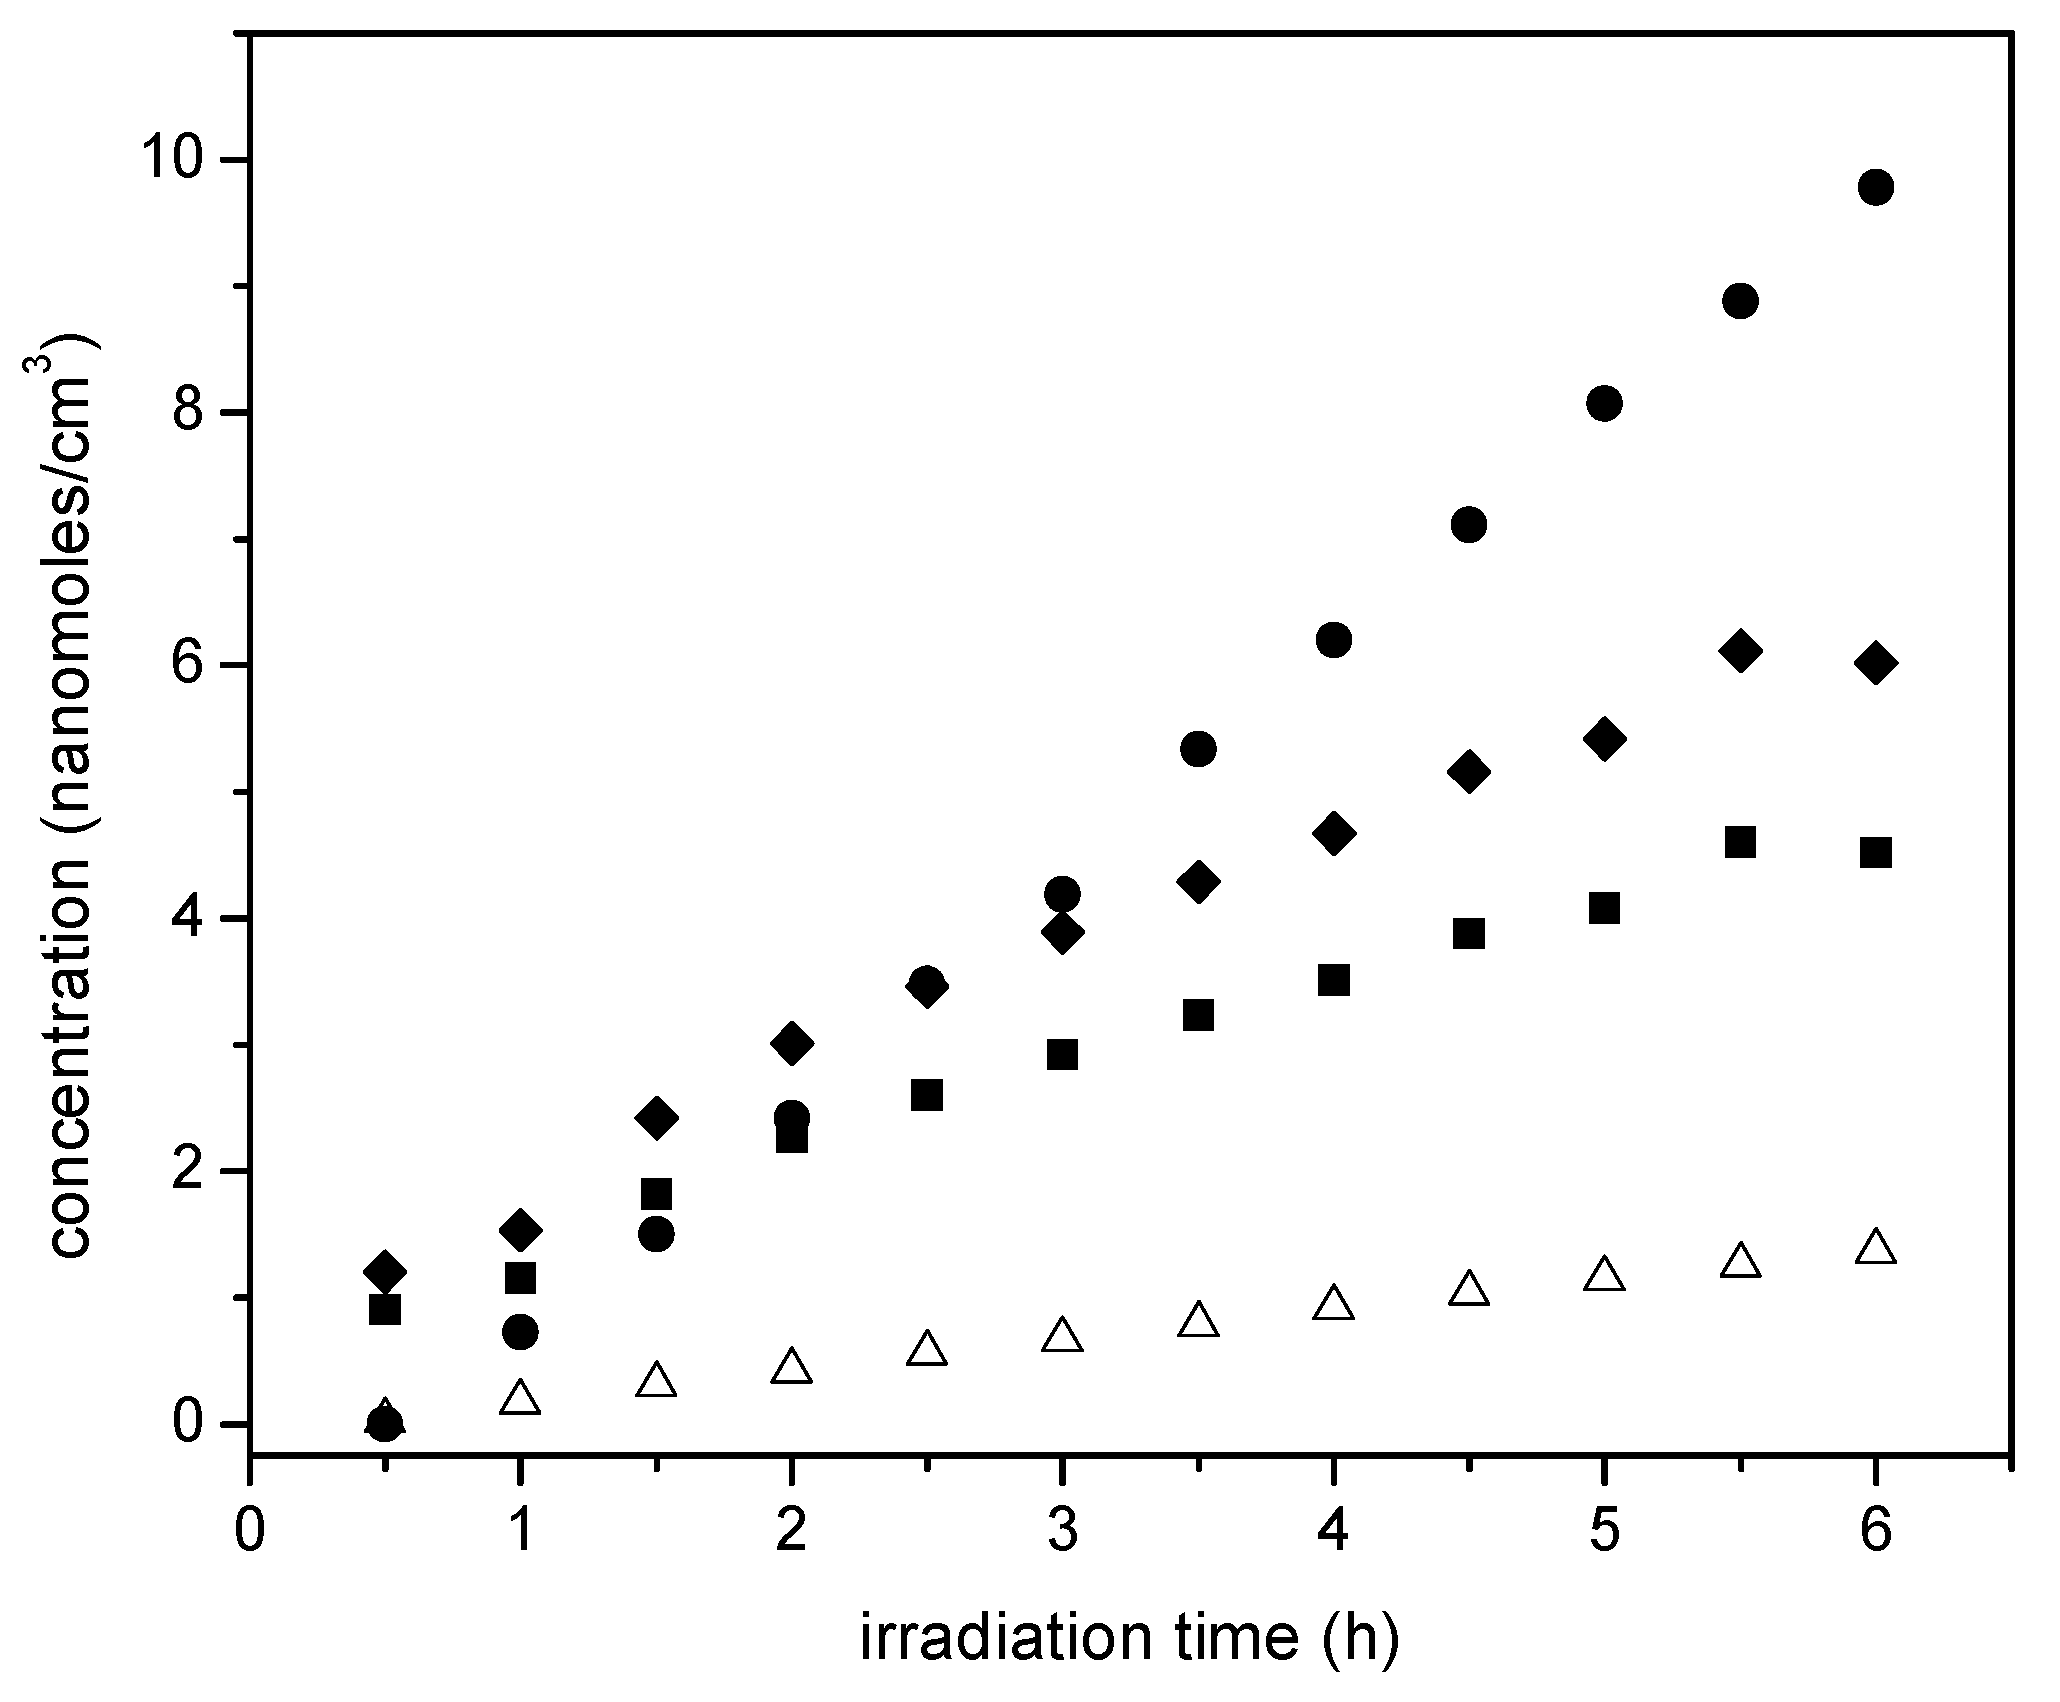
Figure 17.
Ethanol concentration changes with irradiation time for: (●) 2.50 wt % Pt–TiO2 (sol-gel B), (■) 1.70 wt % Pt–TiO2 (sol-gel A), (♦) 1.70 wt % Pt–TiO2 (wetness impregnation) and (∆) Degussa P25. Notes: Initial ethanol concentration: 2.00% v/v or 0.345 mole/L.
Figure 17.
Ethanol concentration changes with irradiation time for: (●) 2.50 wt % Pt–TiO2 (sol-gel B), (■) 1.70 wt % Pt–TiO2 (sol-gel A), (♦) 1.70 wt % Pt–TiO2 (wetness impregnation) and (∆) Degussa P25. Notes: Initial ethanol concentration: 2.00% v/v or 0.345 mole/L.
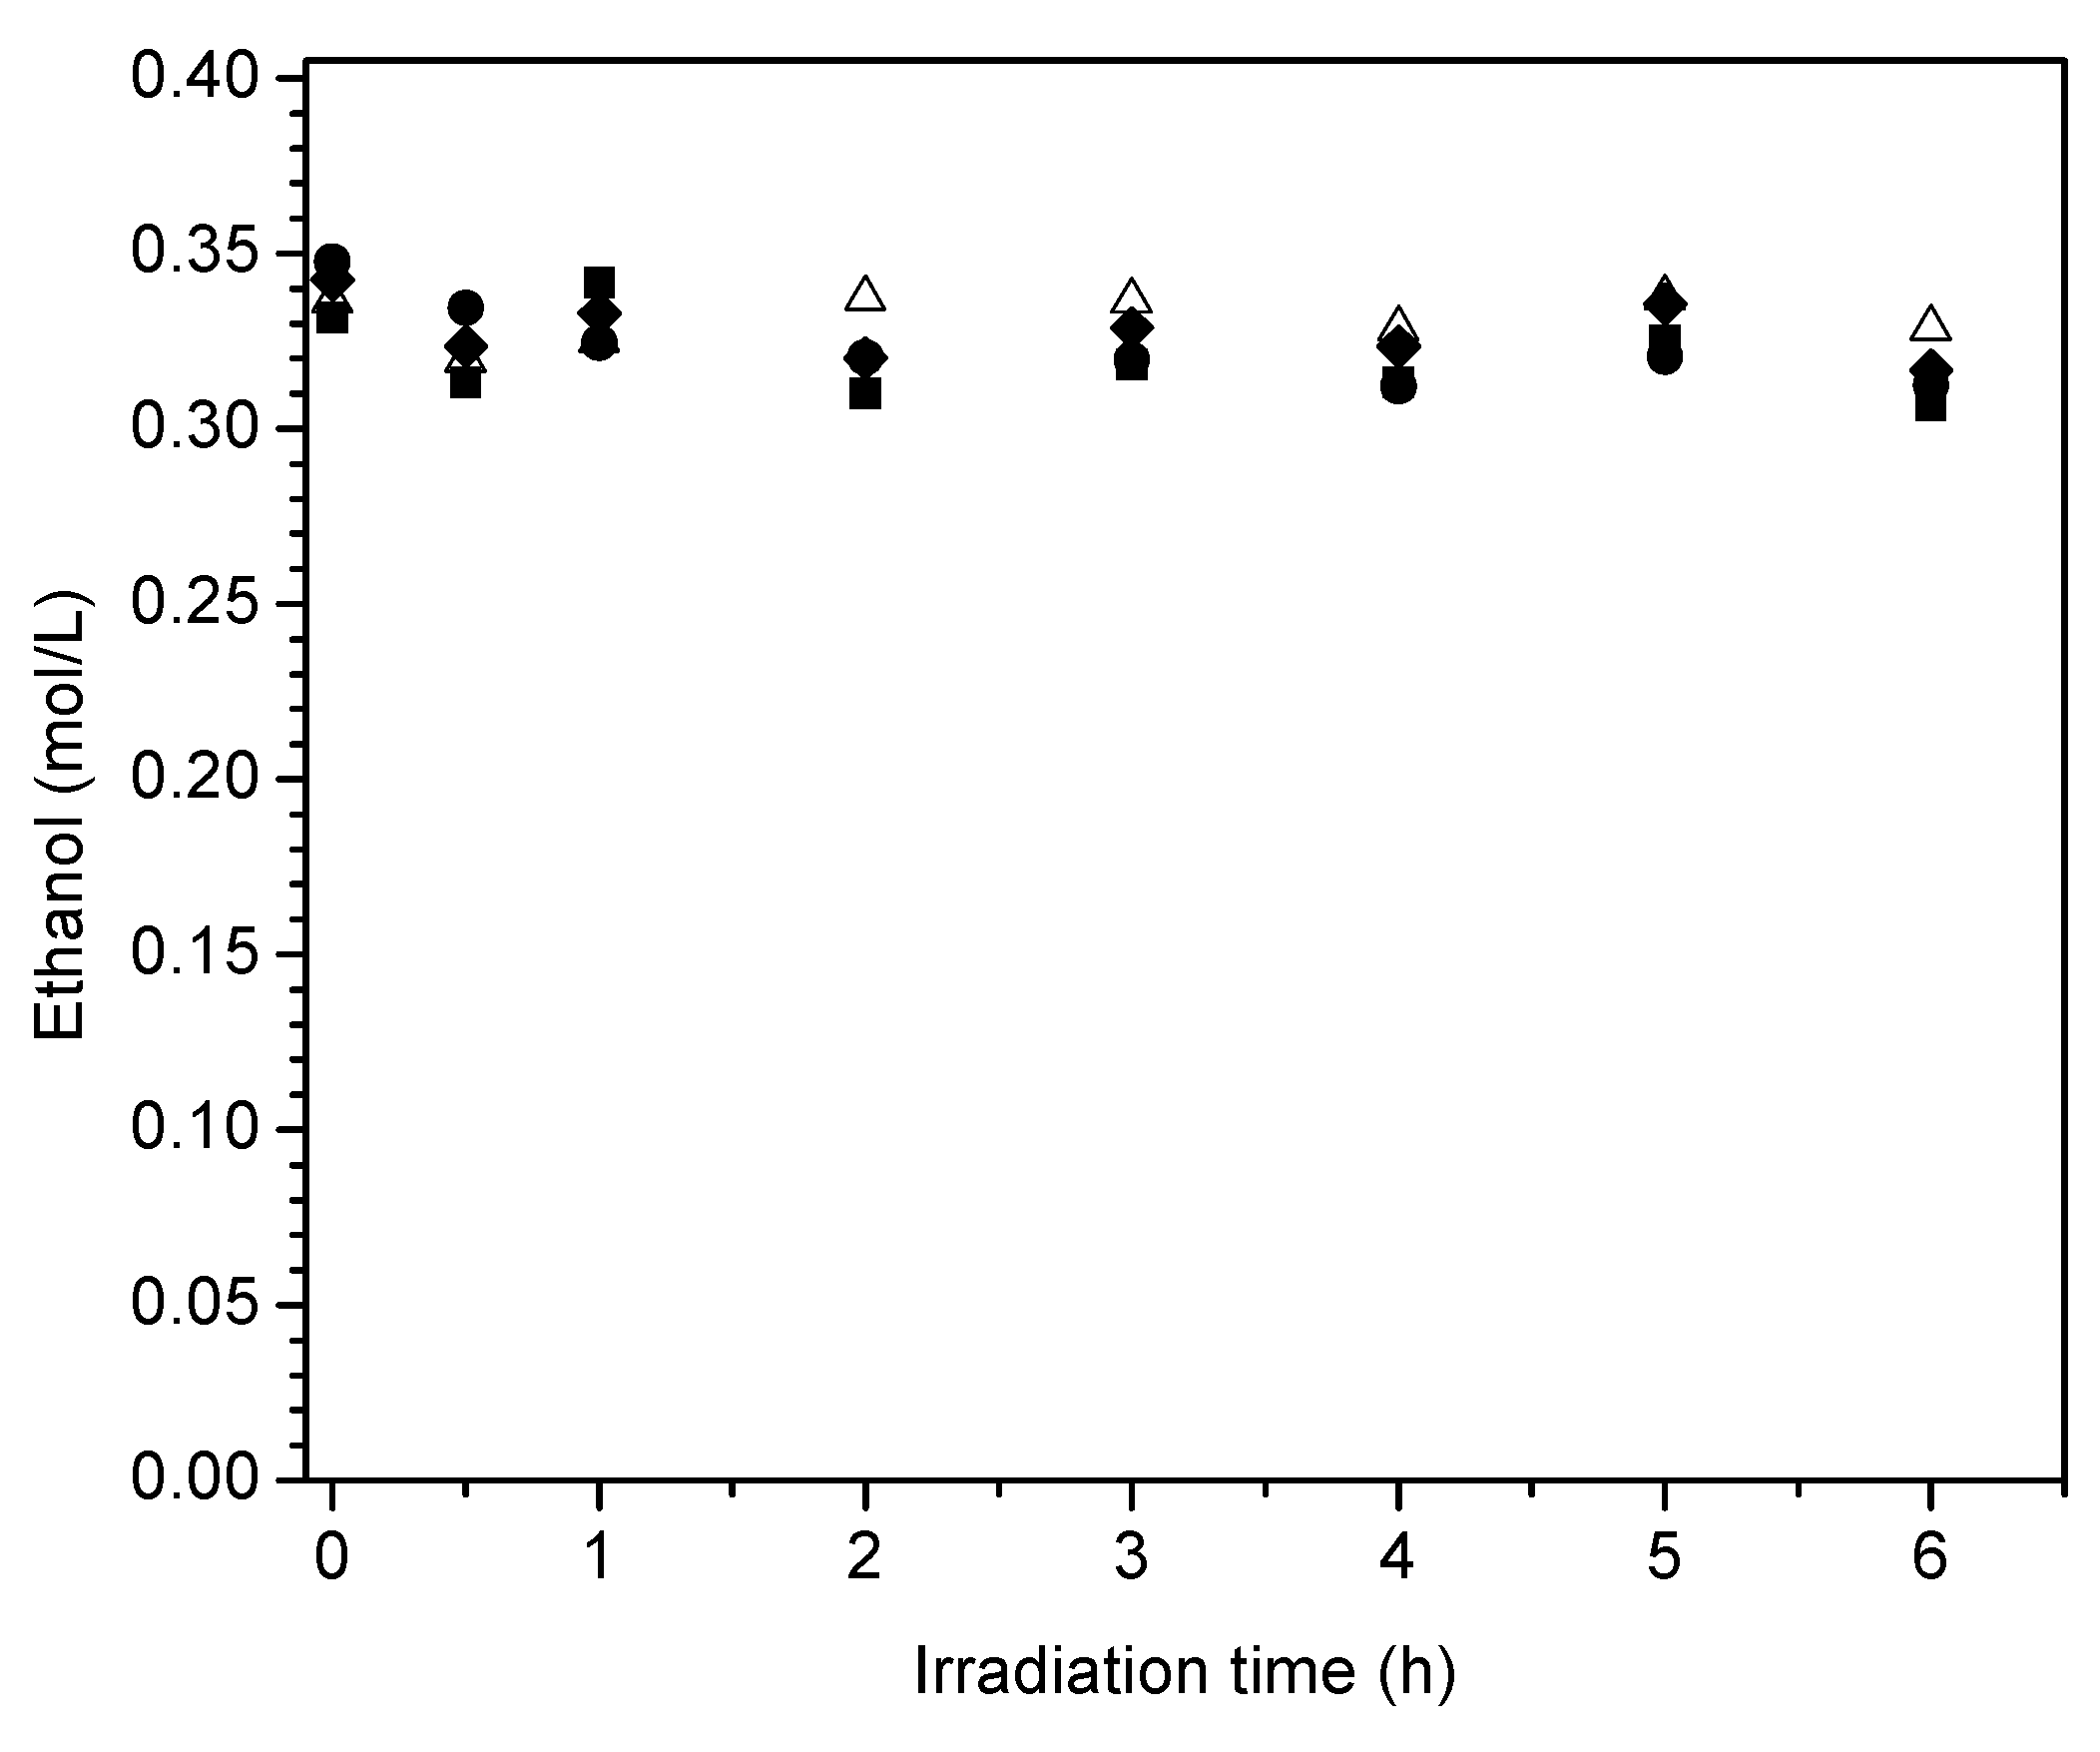
Figure 18.
Quantum yields at various irradiation times for: (●) 2.50 wt % Pt–TiO2 (sol-gel B), (■) 1.70 wt % Pt–TiO2 (sol-gel A), (♦) 1.70 wt % Pt–TiO2 (wetness impregnation) and (∆) Degussa P25. Note: TiO2 (Degussa P25) is reported as a reference.
Figure 18.
Quantum yields at various irradiation times for: (●) 2.50 wt % Pt–TiO2 (sol-gel B), (■) 1.70 wt % Pt–TiO2 (sol-gel A), (♦) 1.70 wt % Pt–TiO2 (wetness impregnation) and (∆) Degussa P25. Note: TiO2 (Degussa P25) is reported as a reference.


Table 1.
Absorbed photon fluxes for the various photocatalysts of the present study. Pi, represents the incident radiation whereas Pt, is the transmitted radiation and Pa is the absorbed radiation.
Table 1.
Absorbed photon fluxes for the various photocatalysts of the present study. Pi, represents the incident radiation whereas Pt, is the transmitted radiation and Pa is the absorbed radiation.
| Photocatalyst Type | Pi (Einstein/h) | Pt (Einstein/h) | Pbs (Einstein/h) | Pa (Einstein/h) | Percent Absorption Efficiency |
|---|---|---|---|---|---|
| Incipient Impregnation, 1.00 wt % Pt | 0.0187 | 0.0023 | 0.0007 | 0.0157 | 84% |
| Wet Impregnation, 1.70 wt % Pt | 0.0180 | 0.0019 | 0.0005 | 0.0156 | 87% |
| Sol-gel, 1.70 wt % Pt | 0.0124 | 0.0013 | 0.0005 | 0.0106 | 85% |
| Sol-gel 2.50 wt % Pt | 0.0107 | 0.0003 | 0.0001 | 0.0103 | 96% |
Table 2.
Specific surface areas for the prepared photocatalysts.
| 1.00 wt % Pt–Degussa P25 (Incipient Wetness Impregnation) | 1.70 wt % Pt-Sol-Gel (Method A) | 2.50 wt % Pt-Sol-Gel (Method B) | |
|---|---|---|---|
| Specific Surface Area (m2/g) | 52 | 116 | 150 |
Table 3.
Relative composition of rutile and anatase in the prepared photocatalysts as assessed using the 25° Bragg angle and the 27° Bragg angle bands in the 2θ scale.
Table 3.
Relative composition of rutile and anatase in the prepared photocatalysts as assessed using the 25° Bragg angle and the 27° Bragg angle bands in the 2θ scale.
| Photocatalyst | Anatase (%) | Rutile (%) | Rutile (110)/Anatase (101) |
|---|---|---|---|
| Degussa P25 | 80 | 20 | 0.25 |
| Incipient Impregnation, 1.00 wt % Pt | 80 | 20 | 0.25 |
| Wet Impregnation, 1.70 wt % Pt | 80 | 20 | 0.25 |
| Sol-gel (Method A), 1.70 wt % Pt | 100 | 0 | 0 |
| Sol-gel (Method B), 2.50 wt % Pt | 100 | 0 | 0 |
Table 4.
Proposed oxidation reactions over TiO2 sites.
| Step | Reaction |
|---|---|
| I.1 | |
| I.2 | |
| I.3 | |
| I.4 | |
| I.5 | |
| I.6 |
Table 5.
Proposed reduction reactions on Pt sites.
| Step | Reaction |
|---|---|
| II.1 | |
| II.2 | |
| II.3 | |
| II.4 | |
| II.5 | |
| II.6 | |
| II.7 | |
| II.8 | |
| II.9 |
© 2017 by the authors. Licensee MDPI, Basel, Switzerland. This article is an open access article distributed under the terms and conditions of the Creative Commons Attribution (CC BY) license (http://creativecommons.org/licenses/by/4.0/).
Share and Cite
MDPI and ACS Style
Guayaquil-Sosa, J.F.; Calzada, A.; Serrano, B.; Escobedo, S.; De Lasa, H. Hydrogen Production via Water Dissociation Using Pt–TiO2 Photocatalysts: An Oxidation–Reduction Network. Catalysts 2017, 7, 324. https://doi.org/10.3390/catal7110324
AMA Style
Guayaquil-Sosa JF, Calzada A, Serrano B, Escobedo S, De Lasa H. Hydrogen Production via Water Dissociation Using Pt–TiO2 Photocatalysts: An Oxidation–Reduction Network. Catalysts. 2017; 7(11):324. https://doi.org/10.3390/catal7110324
Chicago/Turabian StyleGuayaquil-Sosa, J. F., Alan Calzada, Benito Serrano, Salvador Escobedo, and Hugo De Lasa. 2017. "Hydrogen Production via Water Dissociation Using Pt–TiO2 Photocatalysts: An Oxidation–Reduction Network" Catalysts 7, no. 11: 324. https://doi.org/10.3390/catal7110324
Note that from the first issue of 2016, this journal uses article numbers instead of page numbers. See further details here.