Development of an Efficient Methanol Production Process for Direct CO2 Hydrogenation over a Cu/ZnO/Al2O3 Catalyst

1
Department of Chemical Engineering, School of Chemical and Petroleum Engineering, Shiraz University, Shiraz 71345, Iran
2
Department of Chemical Engineering, University of California, Davis, 1 Shields Avenue, Davis, CA 95616, USA
*
Author to whom correspondence should be addressed.
Catalysts 2017, 7(11), 332; https://doi.org/10.3390/catal7110332
Submission received: 25 September 2017
/
Revised: 1 November 2017
/
Accepted: 4 November 2017
/
Published: 8 November 2017
(This article belongs to the Special Issue C1 Chemistry—C1-Platform Chemicals as Cornerstone for a Sustainable Energy)
Abstract
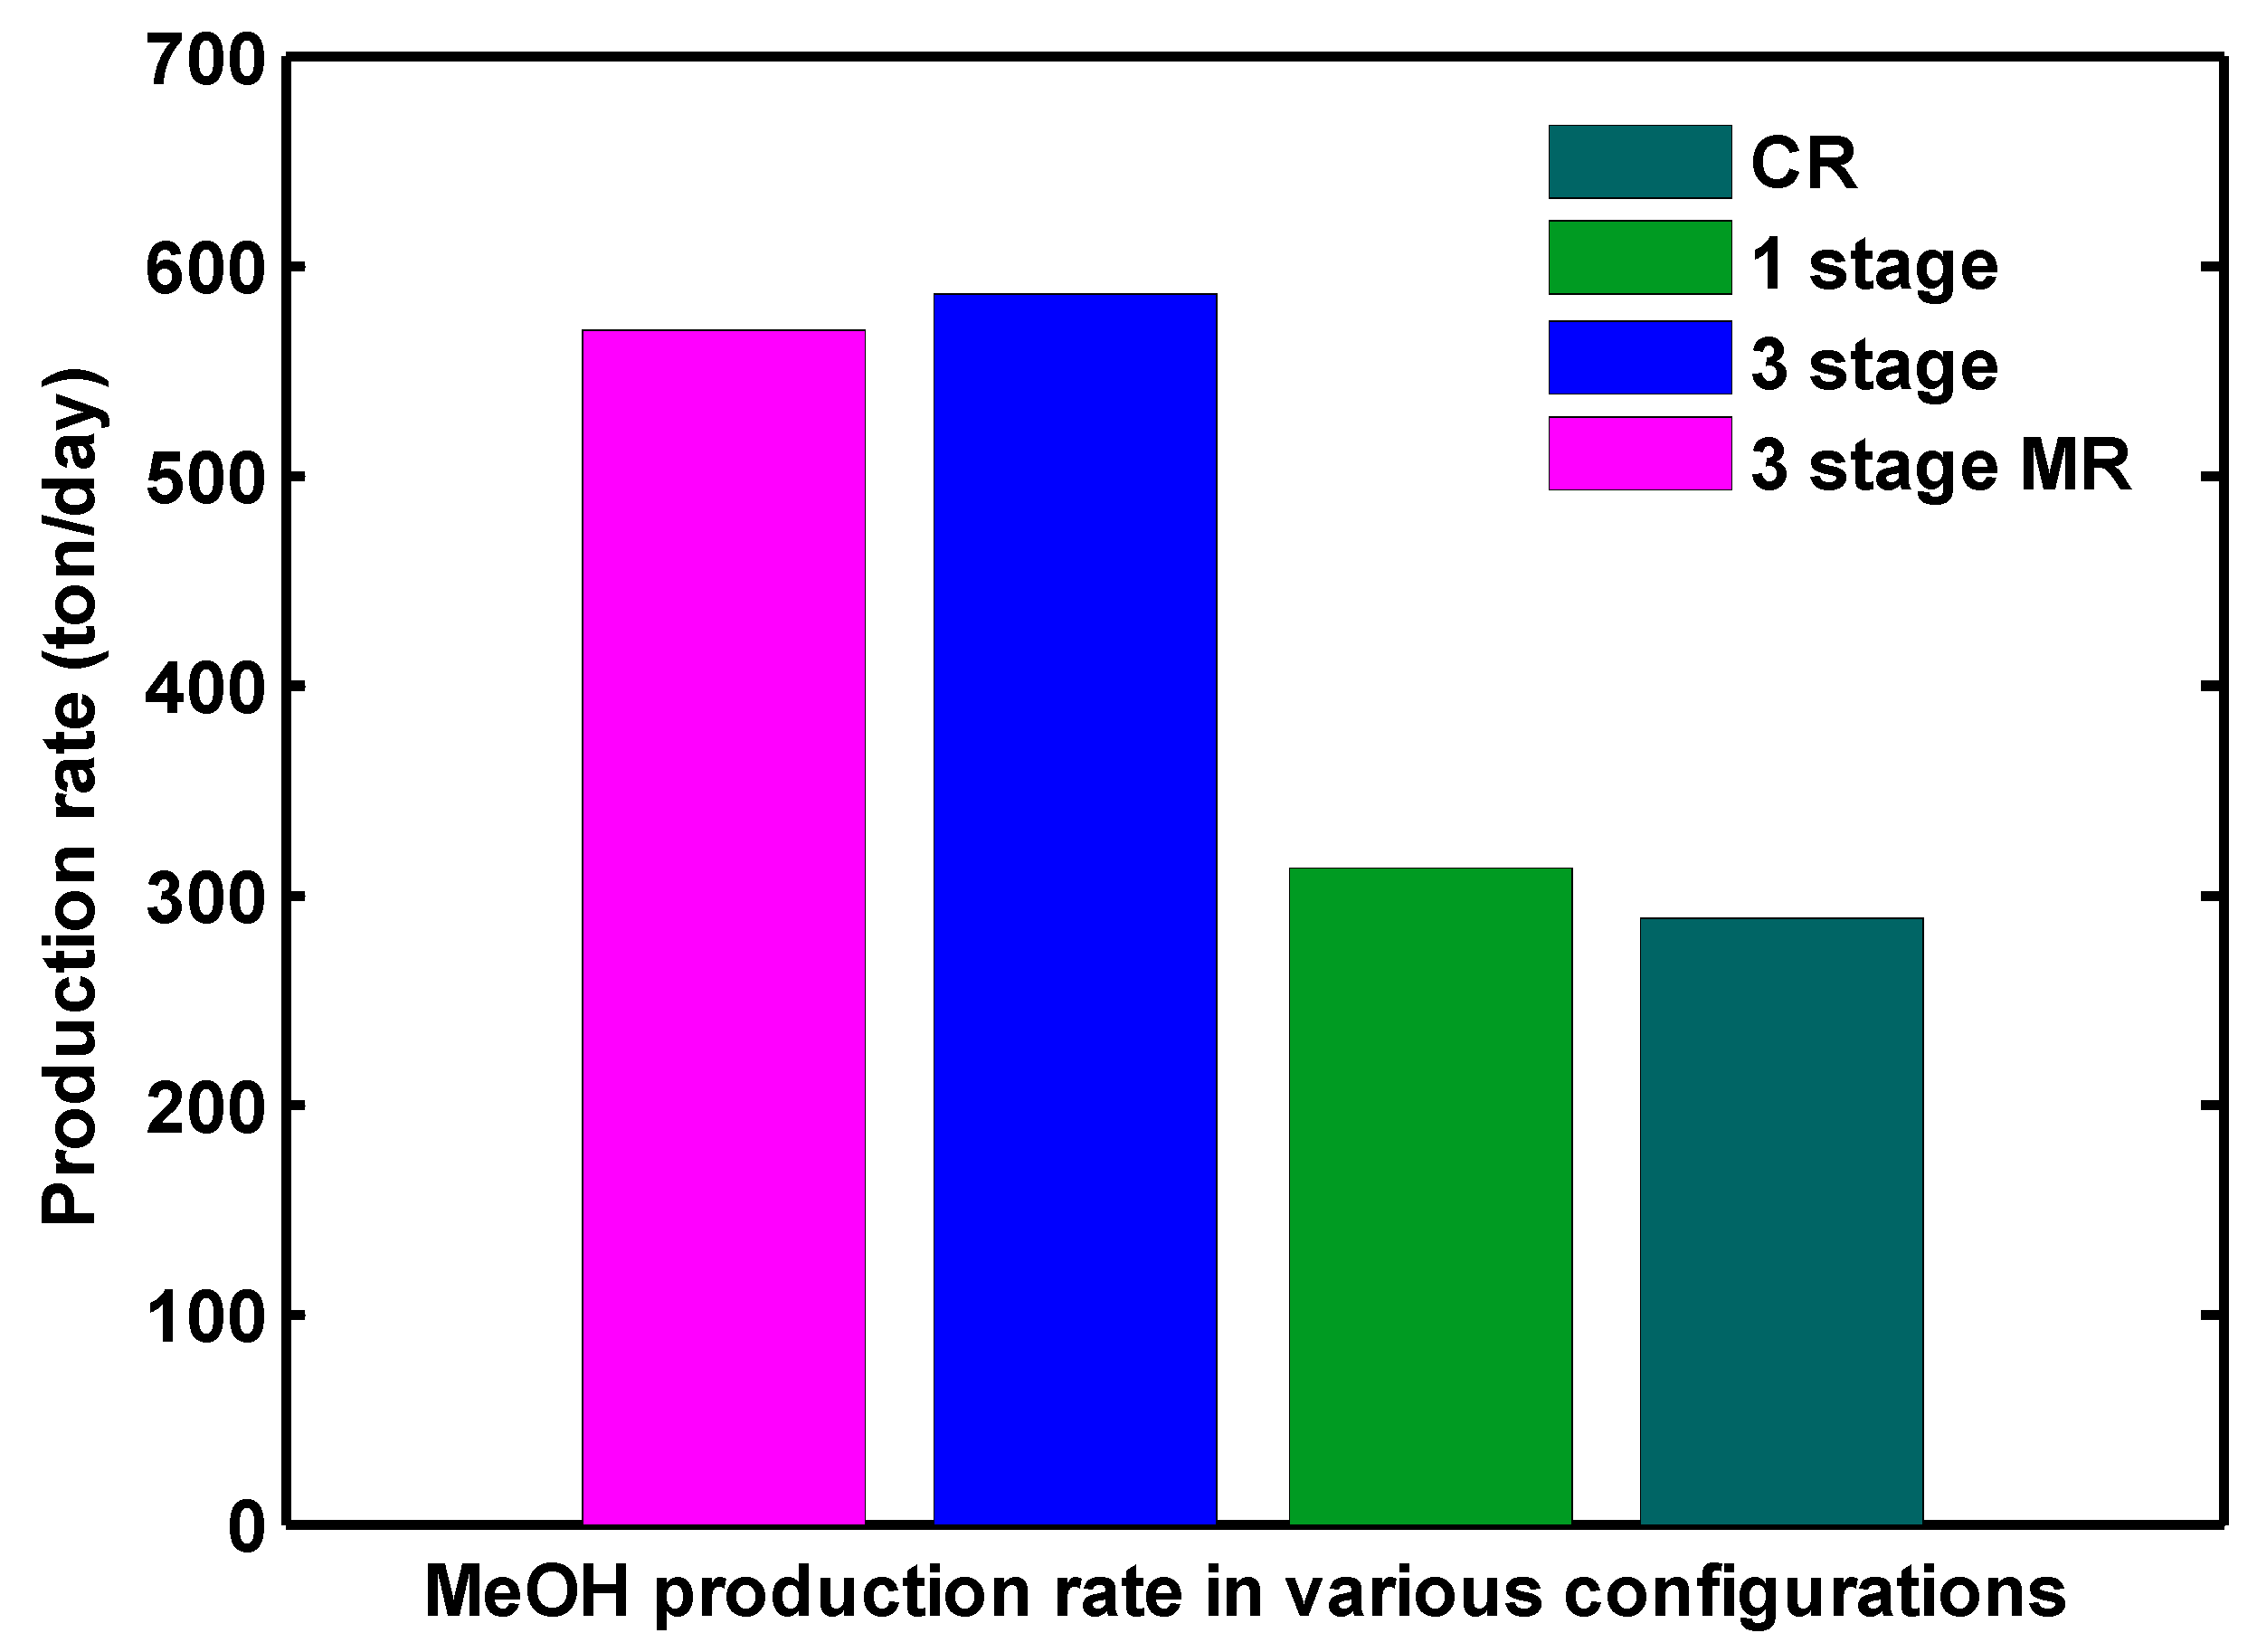
:Carbon capture and utilization as a raw material for methanol production are options for addressing energy problems and global warming. However, the commercial methanol synthesis catalyst offers a poor efficiency in CO2 feedstock because of a low conversion of CO2 and its deactivation resulting from high water production during the process. To overcome these barriers, an efficient process consisting of three stage heat exchanger reactors was proposed for CO2 hydrogenation. The catalyst volume in the conventional methanol reactor (CR) is divided into three sections to load reactors. The product stream of each reactor is conveyed to a flash drum to remove methanol and water from the unreacted gases (H2, CO and CO2). Then, the gaseous stream enters the top of the next reactor as the inlet feed. This novel configuration increases CO2 conversion almost twice compared to one stage reactor. Also to reduce water production, a water permselective membrane was assisted in each reactor to remove water from the reaction side. The proposed process was compared with one stage reactor and CR from coal and natural gas. Methanol is produced 288, 305, 586 and 569 ton/day in CR, one-stage, three-stage and three-stage membrane reactors (MR), respectively. Although methanol production rate in three-stage MR is a bit lower than three stage reactors, the produced water, as the cause of catalyst poisoning, is notably reduced in this configuration. Results show that the proposed process is a strongly feasible way to produce methanol that can competitive with a traditional synthesis process.
1. Introduction
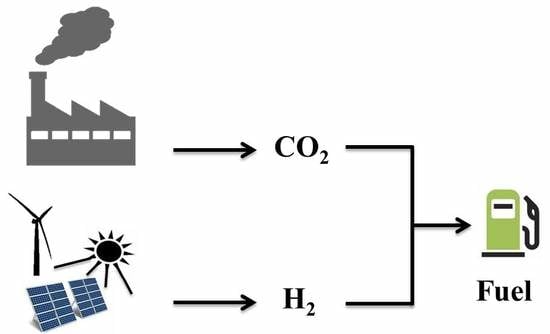
Anthropogenic emission of CO2 is closely linked to serious global warming issues. The large contribution in total CO2 emission originates from coal or natural gas power plants [1,2,3,4,5,6]. To reducing CO2 concentrations, two proposed methods have been developed and implemented: carbon capture and storage (CCS) and carbon capture and utilization (CCU) [7,8,9,10]. Converting CO2 into valuable intermediate chemicals and products (such as methanol, carbonates, formic acid, methane or kerosene) is economically of interest as can potentially recoups the costs of CO2 capture and conversion [10,11,12]. Methanol is one of the possible fuel candidates that can be made by CO2 hydrogenation [13,14,15]. Methanol production and demands have shown a substantial increasing trend in the coming years. It is regarded as an excellent alternative energy resource due to its excellent combustion properties [16,17,18,19,20]. Methanol is also a very important primary raw material for production of various chemicals such as acetic acid, dimethyl ether (DME), methyl tert-butyl ether (MTBE) and formaldehyde [21,22,23,24].
To reduce the life cycle CO2 emissions in methanol production process, hydrogen must be provided in a sustainable way. There are various technologies for H2 production from renewable raw materials such as water, biomass or biogas [25]. Water electrolysis by a renewable source of electricity (solar radiation, biomass and wind) is one of the simplest technologies for hydrogen production without any by-products [26,27]. Although extremely pure hydrogen can be produced through water electrolysis technology, the cost of electricity is relatively high and plays a significant role in the price of hydrogen yield [28]. In the current electrolytic processes, the applied electrodes are usually coated with precious platinum, which makes commercialization of the technology much further away [29]. However, the eco-friendly source of the feedstock makes the methanol production emerge as an attractive green process [27,30,31]. There are two different synthesis routes for methanol production from CO2 and H2: direct and indirect routes. In the first route, methanol is directly produced from CO2 and hydrogen, while, in the second, CO2 is first converted into CO via reverse water-gas shift (RWGS) reaction to produce syngas and then the syngas is transported to a reactor to convert into methanol [32].
As the environmental concerns have been becoming more serious, numerous studies regarding catalyst development for methanol production from CO2 have been conducted. Fujita et al. conducted an experimental study on CuO/ZnO catalyst for the reaction of CO2 dehydrogenation to methanol. They investigated different structures and a wide range of Cu/Zn ratios and concluded that this type of catalyst exhibited an acceptable performance [33]. Subsequently, Arena et al. synthesized CuO/ZnO/ZrO2 catalyst by means of co-precipitation under ultrasound irradiation and evaluated its impact on the reaction rate and conversion [34]. Newly, some researchers have been focusing on the impact of active metals like Pd, Au, Ag on various catalysts to improve CO2 hydrogenation reactions. Hartadi et al. [35] investigated the methanol formation rate on Au/ZnO catalysts and found that the activity of this catalyst for CO2 hydrogenation in CO2/H2 is remarkably higher than that for CO hydrogenation in CO/H2 synthesis gas. Rodriguez et al. [36] conducted an experimental investigation on CO2 hydrogenation on Au/TiC, Cu/TiC, and Ni/TiC catalysts. It was concluded that, although the major product over these catalysts was CO, a substantial amount of methanol was also produced over Au/TiC and Cu/TiC catalysts. Different Pd:Cu:Zn molar compositions in PdCuZn/SiC catalysts were examined by Ramírez et al. The Pd active sites favored carbon monoxide synthesis via reverse water–gas–shift, whereas the PdZn alloys catalyzed methanol formation. In their work, 37.5:12.5:50 Pd:Cu:Zn (mol %) was chosen as the most active catalyst for methanol production [37]. The effect of adding Ag to CuO-ZrO2 catalysts was studied by Tada et al. The addition of Ag to a CuO-ZrO2 catalyst offered higher methanol selectivity than CuO-ZrO2 and Ag/ZrO2 catalysts. This contributed to the fact that the Ag/CuO-ZrO2 catalysts contained special active sites for CO2 conversion to methanol [38].
More recently, Pontzen et al. [39] researched the feasibility of methanol production over the commercial catalyst, CuO/ZnO/Al2O3. Their study proved the stability of the conventional catalyst. Afterwards, Meyer and coworkers [40] modeled methanol synthesis process on the commercial catalyst and compared Graaf and Bussche and Froment kinetic models for CO2 hydrogenation reactions. Fortes et al. [27] evaluated carbon capture and utilization as raw material in the methanol production process. The cost of production as well as the net reduction of CO2 emissions were compared with the conventional synthesis process.
However, low conversion of carbon dioxide over the commercial catalyst [32] and its deactivation due to water production during the reaction [41,42] are the main concerns of the researchers for industrial development of this process. It was proved that the conventional catalyst (CuO/ZnO/Al2O3) results in a high conversion in a process with a syngas feedstock (containing CO, CO2, and H2); however, if pure CO2 is substituted, it does not offer a good efficiency [43,44]. To overcome these obstacles, an efficient process consists of three stage heat exchanger reactors connected in series was proposed for direct CO2 hydrogenation. This novel configuration increases CO2 conversion remarkably compared to one stage reactor. Also to reduce water production, a hydroxy sodalite (H-SOD) membrane was assisted in each reactor for separation of water from the reaction side. H-SOD as a zeolite-like material has high selectivity of H2O on the basis of molecular sieving in hybrid processes. The maximum water permeation of this membrane is reported 10−6 mol/(s m2 Pa) for an ideal case [45,46,47,48,49]. The permeated water is swept with a sweep gas at low pressure to create a high driving force across the membrane. Then, this process was compared with one-stage reactor and conventional methanol synthesis reactor from coal and natural gas.
2. Reaction Scheme and Kinetics
Methanol synthesis reaction from syngas consists of hydrogenation of CO2 and CO accompanied with the reverse water gas shift (RWGS) reaction. This triple reaction network is shown as follows:
In this study, the kinetic model presented by Graaf et al. [50] over the commercial CuO/ZnO/Al2O3 catalyst was applied. They assumed that both CO and CO2, existing in the feedstock, underwent the hydrogenation reactions. The reaction kinetics are shown as follows:
where f is the fugacity of the corresponding component. The rate, adsorption equilibrium, and equilibrium constants are tabulated in Table 1.
3. Process Description
3.1. One-Stage Reactor
A common process for direct CO2 hydrogenation to produce methanol was demonstrated in Figure 1. As can be observed, the feedstock of the unit; containing H2 and CO2; is combined with a recycle stream in a mixer. After passing through a heat exchanger and reaching the desired temperature, this stream is fed to the top of a shell and tube heat exchanger reactor. The exothermic methanol synthesis reactions take place in the catalytic zone, surrounded by cooling water, which adsorbs the generated heat. The effluent stream energy is used to heat the feed. Afterwards, the effluent stream passes through a cooler followed by an air cooler and then enters a flash drum, where it is separated into two streams: methanol/water-enriched stream and light components-enriched stream, containing mainly H2, CO, and CO2. The latter is recycled to the process to provide a higher reactor yield. It is noteworthy to mention that the CO content in the recycle stream compensates a portion of the absence effects of this component in the initial feedstock. The operating conditions and reactor specifications are the same as the conventional methanol synthesis reactor from coal and natural gas and are summarized in Table 2.
3.2. Three-Stage Reactors
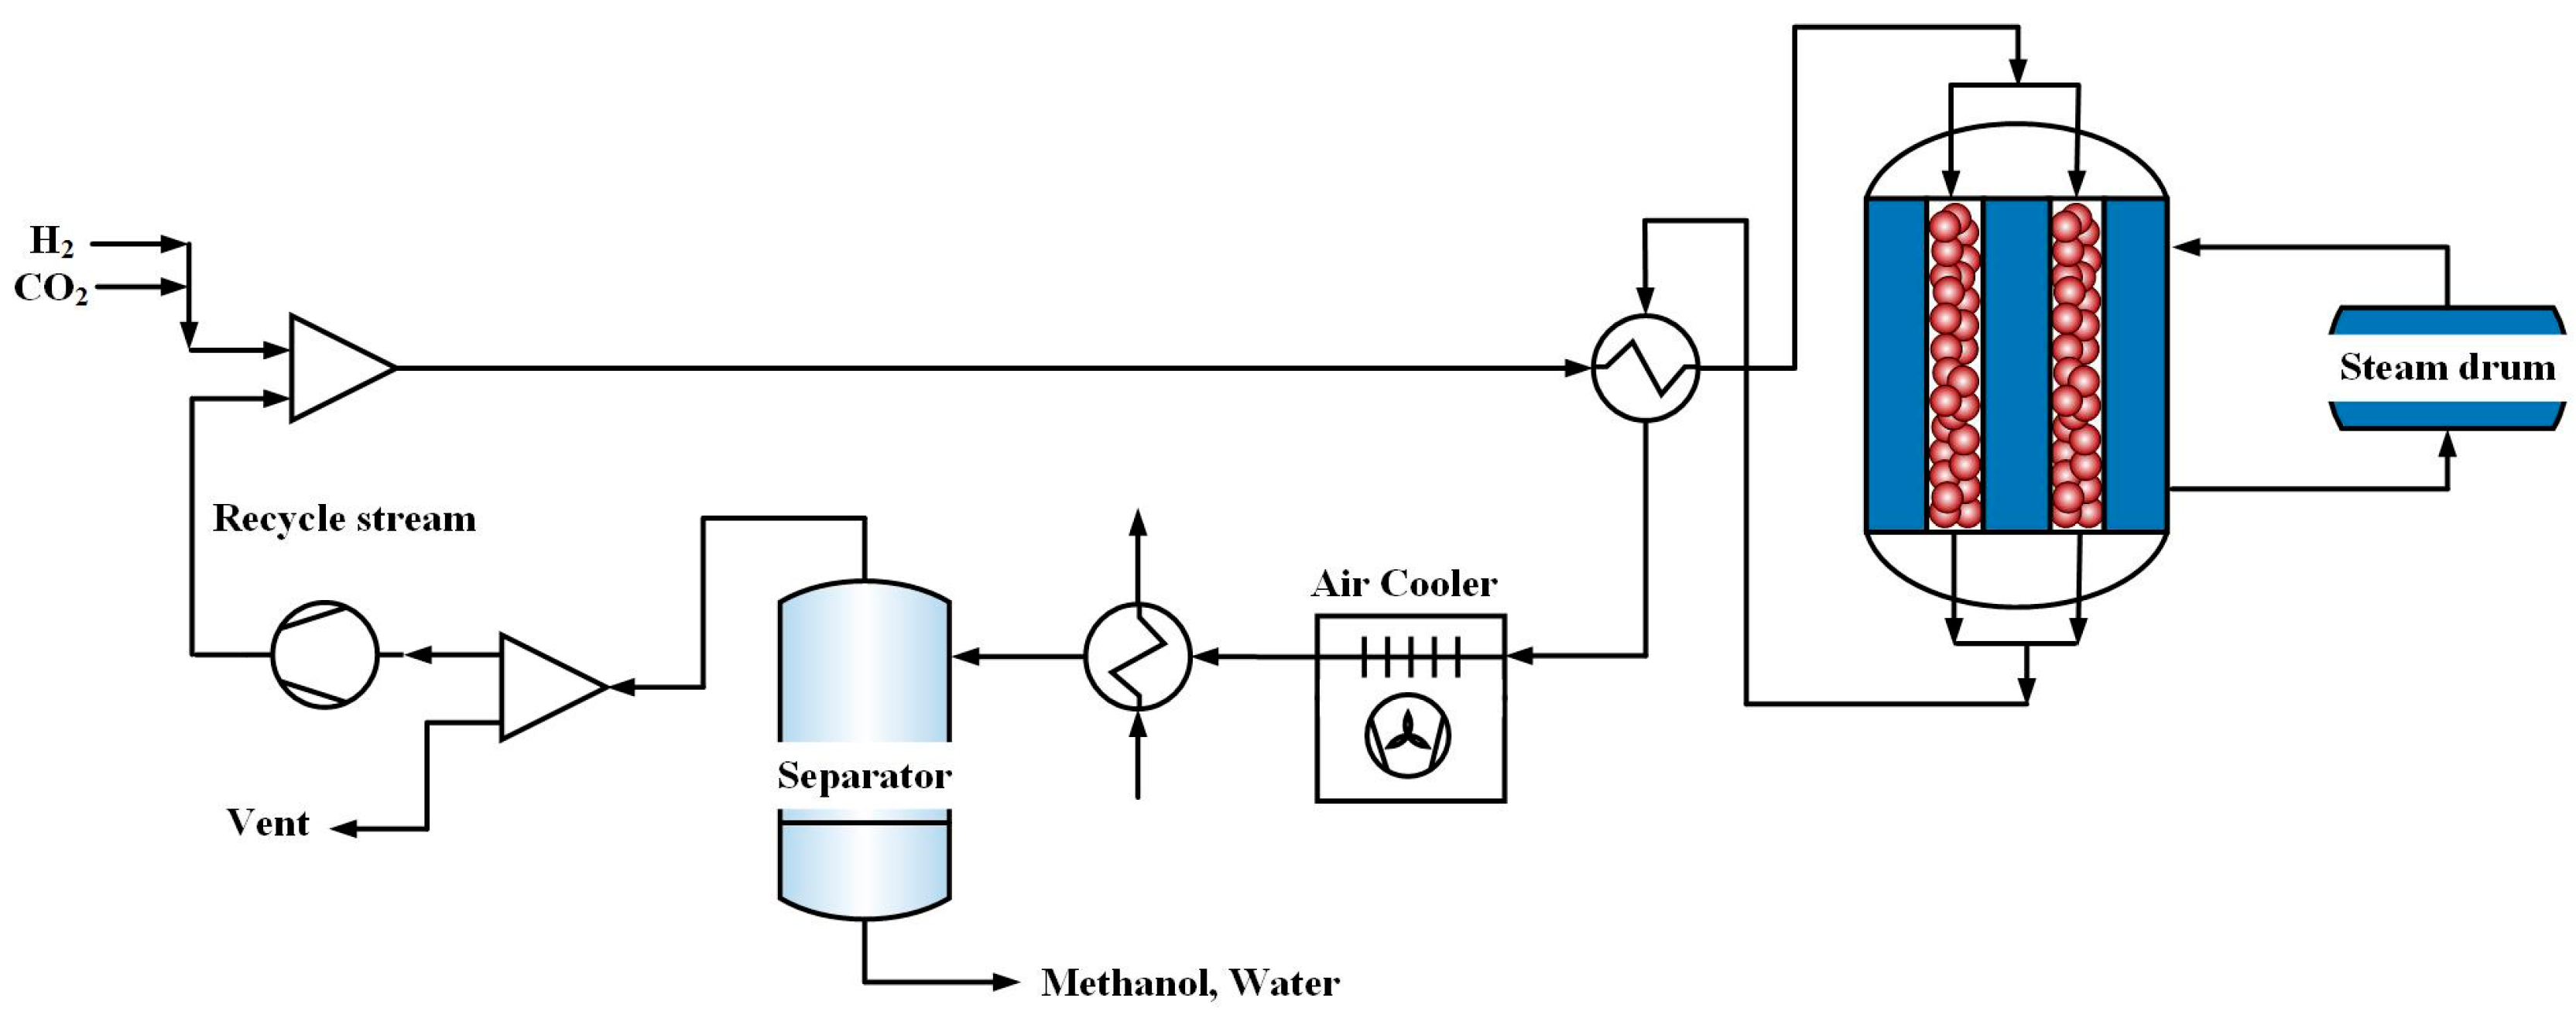
Figure 2 shows the proposed process, which consists of three-stage shell and tube heat exchanger reactors connected in series for CO2 hydrogenation. The catalyst volume in the conventional methanol synthesis reactor (CR) was divided into three sections to pack reactors. The product stream of the first reactor is conveyed to a flash drum to remove methanol and water from the unreacted gases (H2, CO and CO2). It is also necessary to purify the stream from the water because it is a poison for the commercial methanol synthesis catalyst. The gaseous stream enters top of the second reactor as the inlet feed after passing through a compressor and a heat exchanger to reach to a desire pressure and temperature. The outlet stream of the second reactor also passes through a flash drum, a compressor and a heat exchanger and then fed to the third reactor. In these reactors, the exothermic methanol synthesis reactions take place in the catalytic zone, surrounded by cooling water. Afterwards, the outlet stream of the third reactor is separated to methanol/water- enriched stream and light components-enriched stream, containing mainly H2, CO and CO2 by a flash drum. Some part of the latter is recycled to the process to provide a higher reactor yield. In fact, in this study, the catalyst volume in the conventional reactor is used efficiently in three reactors to gain a more methanol production rate by applying of the unreacted gases. The related operating conditions and the catalyst distribution were presented in Table 3.
3.3. Three-Stage Membrane Reactors
This process is the same as the above-mentioned process, except that water perm-selective membranes (H-SOD membrane) are applied in all three reactors. Each reactor consists of three concentric tubes for the permeation side, the reaction side and the cooling water side, respectively. The produced water can go through the H-SOD membrane layer to the permeation side. Sweeping gas flowing through the penetration side conveys the permeated water. N2 (from an air separation unit) was used as the sweep gas. The related operating conditions are the same as three-stage configuration. The other specifications were tabulated in Table 4.
4. Mathematical Model
4.1. Reactor Model
There are some assumptions considered in the proposed process model, as follows: a steady state model was considered, due to the high flow velocity, a homogeneous model was developed, and diffusion of heat and mass were ignored in the flow direction, because of the negligible heat loss, the temperature gradient in the r-direction is not significant, leading to a one-dimensional reactor model, a supported membrane layer was used.
In the case of membrane reactor, a differential element with the length of Δz in the axial direction was considered as shown in Figure 3. Based on the abovementioned assumptions, the material balance for the reaction side is expressed as below:
where subscripts i and j stand for the component and reaction indices, respectively, Fi represents the component’s molar flow, ρB denotes the bulk density of catalyst, νij is the stoichiometric coefficient of the reactant i in the reaction j, and ri is the reaction rate. β equals to 0 and 1 in the absence and presence of water perm-selective membrane respectively. is water permeation rate in the membrane.
The energy balance equation for the reaction side is written as follows:
where T is the reaction side temperature, Cp denotes the gas phase heat capacity and ΔHi represents the heat change of the reaction, and Tc and Tperm are cooling water and permeation side temperatures. β equals 0 and 1 in the absence and presence of water perm-selective membrane, respectively.
The material balance for the permeation side is as below:
The energy balance equation for the permeation side is described as below:
Water permeation in H-SOD membrane is:
is the maximum H2O permeation of the H-SOD membrane reported 10−7–10−6 mol/(s m2 Pa) for an ideal case. In this work, the value of 10−7 mol/(s m2 Pa) was considered for [47].
Ergun equation is used for the calculation of pressure drop:
The initial conditions to solve the above equations are expressed as below:
The auxiliary correlations coupled with the differential equations describing mass and energy balances were presented in Table 5.
There are a set of ordinary differential equations that are coupled with algebraic equations consisting of ideal gas assumptions, reaction rates, heat and mass transfer coefficient correlations and physical properties of fluids. These equations form a set of nonlinear algebraic equations using backward finite difference and solved by Gauss–Newton method in the MATLAB programming environment
4.2. Flash Calculation
As noted, in this study, the separator was also modeled. Flash calculation is considered for developing a mathematical model for the separator, in which pressure and inlet temperature of the feed are known. This approach assumes that each component is at the vapor–liquid thermodynamic equilibrium state, and estimates the portion of vapor to liquid, as well as the composition of each phase.
The phase equilibrium concept expresses that the fugacity of each component in the vapor and liquid phases are equal:
where f and represent the fugacity and fugacity coefficient, repectively. The subscrib j and superscripts V and L denote the component numerator, vapor, and liquid phase, respectively. x and y are the mole fraction in liquid and vapor phases, respectively.
For each component, a K-value is defined as the ratio of its mole fraction in vapor to liquid, expressed by the following equation:
The fugacity coefficients are calculated using the modified Soave–Redlich–Kwong (SRK) equation of state, shown as follows:
where Z and R demonstrate compressibility factor, and gas constant, respectively. a and b represent the pure gas parameters (adopted from [51,52]), and kij is the binary interaction coefficient (taken from [53]).
The phase equilibrium condition; i.e., the equal fugacity in the vapor and liquid phases; is formulized as Equation (14). Afterwards, the summation of quadratic error is minimized to estimate the ratio of the fugacity of each component in the both phases:
Biegler et al. [54] comprehensively discussed the governing equations for a flash problem (e.g., mass balance and the Rachford–Rice equation). In order to ensure the physical feasibility of the results, these equations (listed as follows) are incorporated as constraint in the optimization procedure:
5. Model Validation
6. Results and Discussion
In this work, CO2 hydrogenation over the commercial catalyst (CuO/ZnO/Al2O3) was investigated. Because of low conversion of carbon dioxide over this catalyst, a three-stage heat exchanger reactors connected in series was proposed for direct CO2 hydrogenation. Stoichiometric number (SN) and H2O concentration of feedstock to the methanol production process are the two main specifications that should be considered. The desired stoichiometric number in a process consisting of CO, CO2, and H2 in the feedstock is equal to 2. Stoichiometric number higher than 2 shows an excess value of H2 in the feedstock, while a lower value indicates an excess value of carbon. As illustrated in Figure 1 and Figure 2, the feedstock of the unit; containing H2 and CO2; is combined with a recycle stream in a mixer. Therefore, H2/CO2 ratio equal to 3, guarantees that SN = 2.
H2O concentration in the feedstock should also be lower than 1% vol because it is a poison for the commercial methanol synthesis catalyst. To ensure this requirement, the water produced in each reactor is removed by a flash drum and then the syngas free of water is fed to the next reactor.
6.1. The Effect of Operating Conditions on the Performance of Three-Stage Reactors
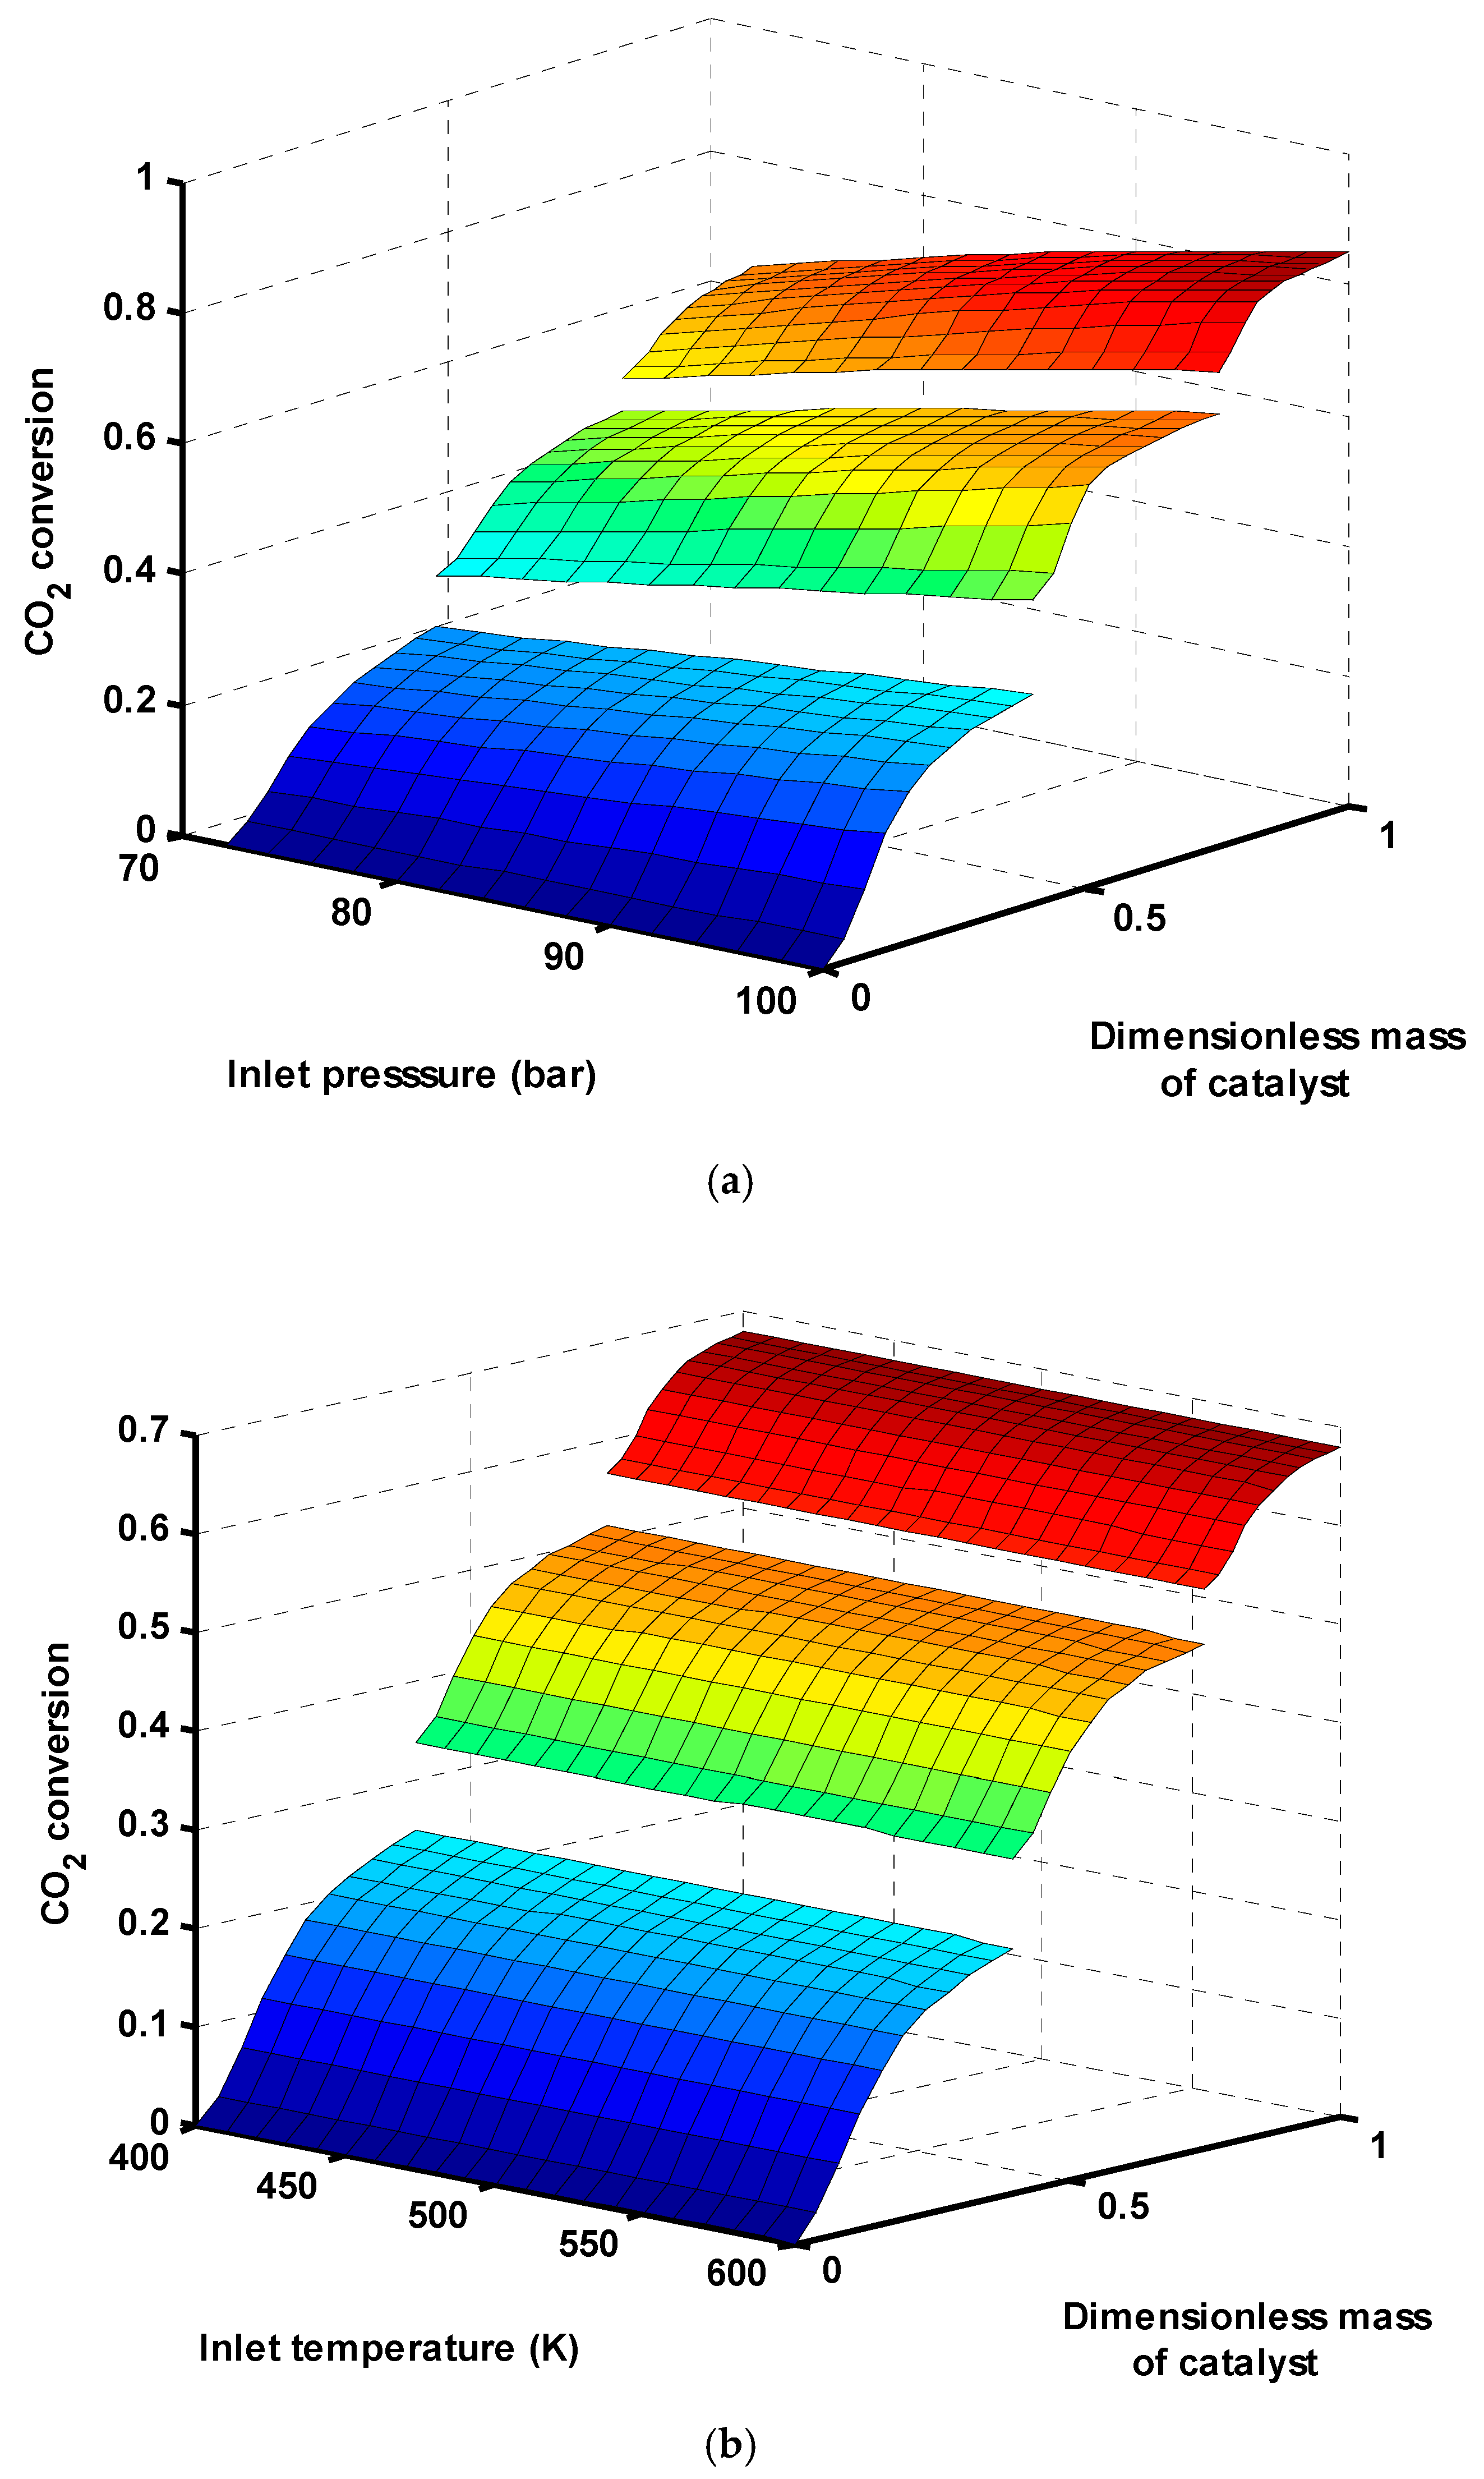
CO2 conversion in three-stage reactors as a function of inlet pressure and temperature of the first reactor was depicted in Figure 4a,b, respectively. CO2 conversion is defined as Equation (30). At a fixed inlet temperature (T0 = 503 K), CO2 conversion increases in all three reactors as the inlet pressure is increased. This is attributed to the fact that, in CO2 hydrogenation, reactions (2) and (3) occur predominantly in the reactor (the feedstock contains mainly H2 and CO2) and reaction (1) is performed at a much lower rate because of CO content in the recycle stream. Since the number of total moles is reduced in reaction (3), thus it is thermodynamically favored operating at high pressures. As shown in Figure 4b, there is no considerable difference in CO2 conversion by inlet temperature changing:
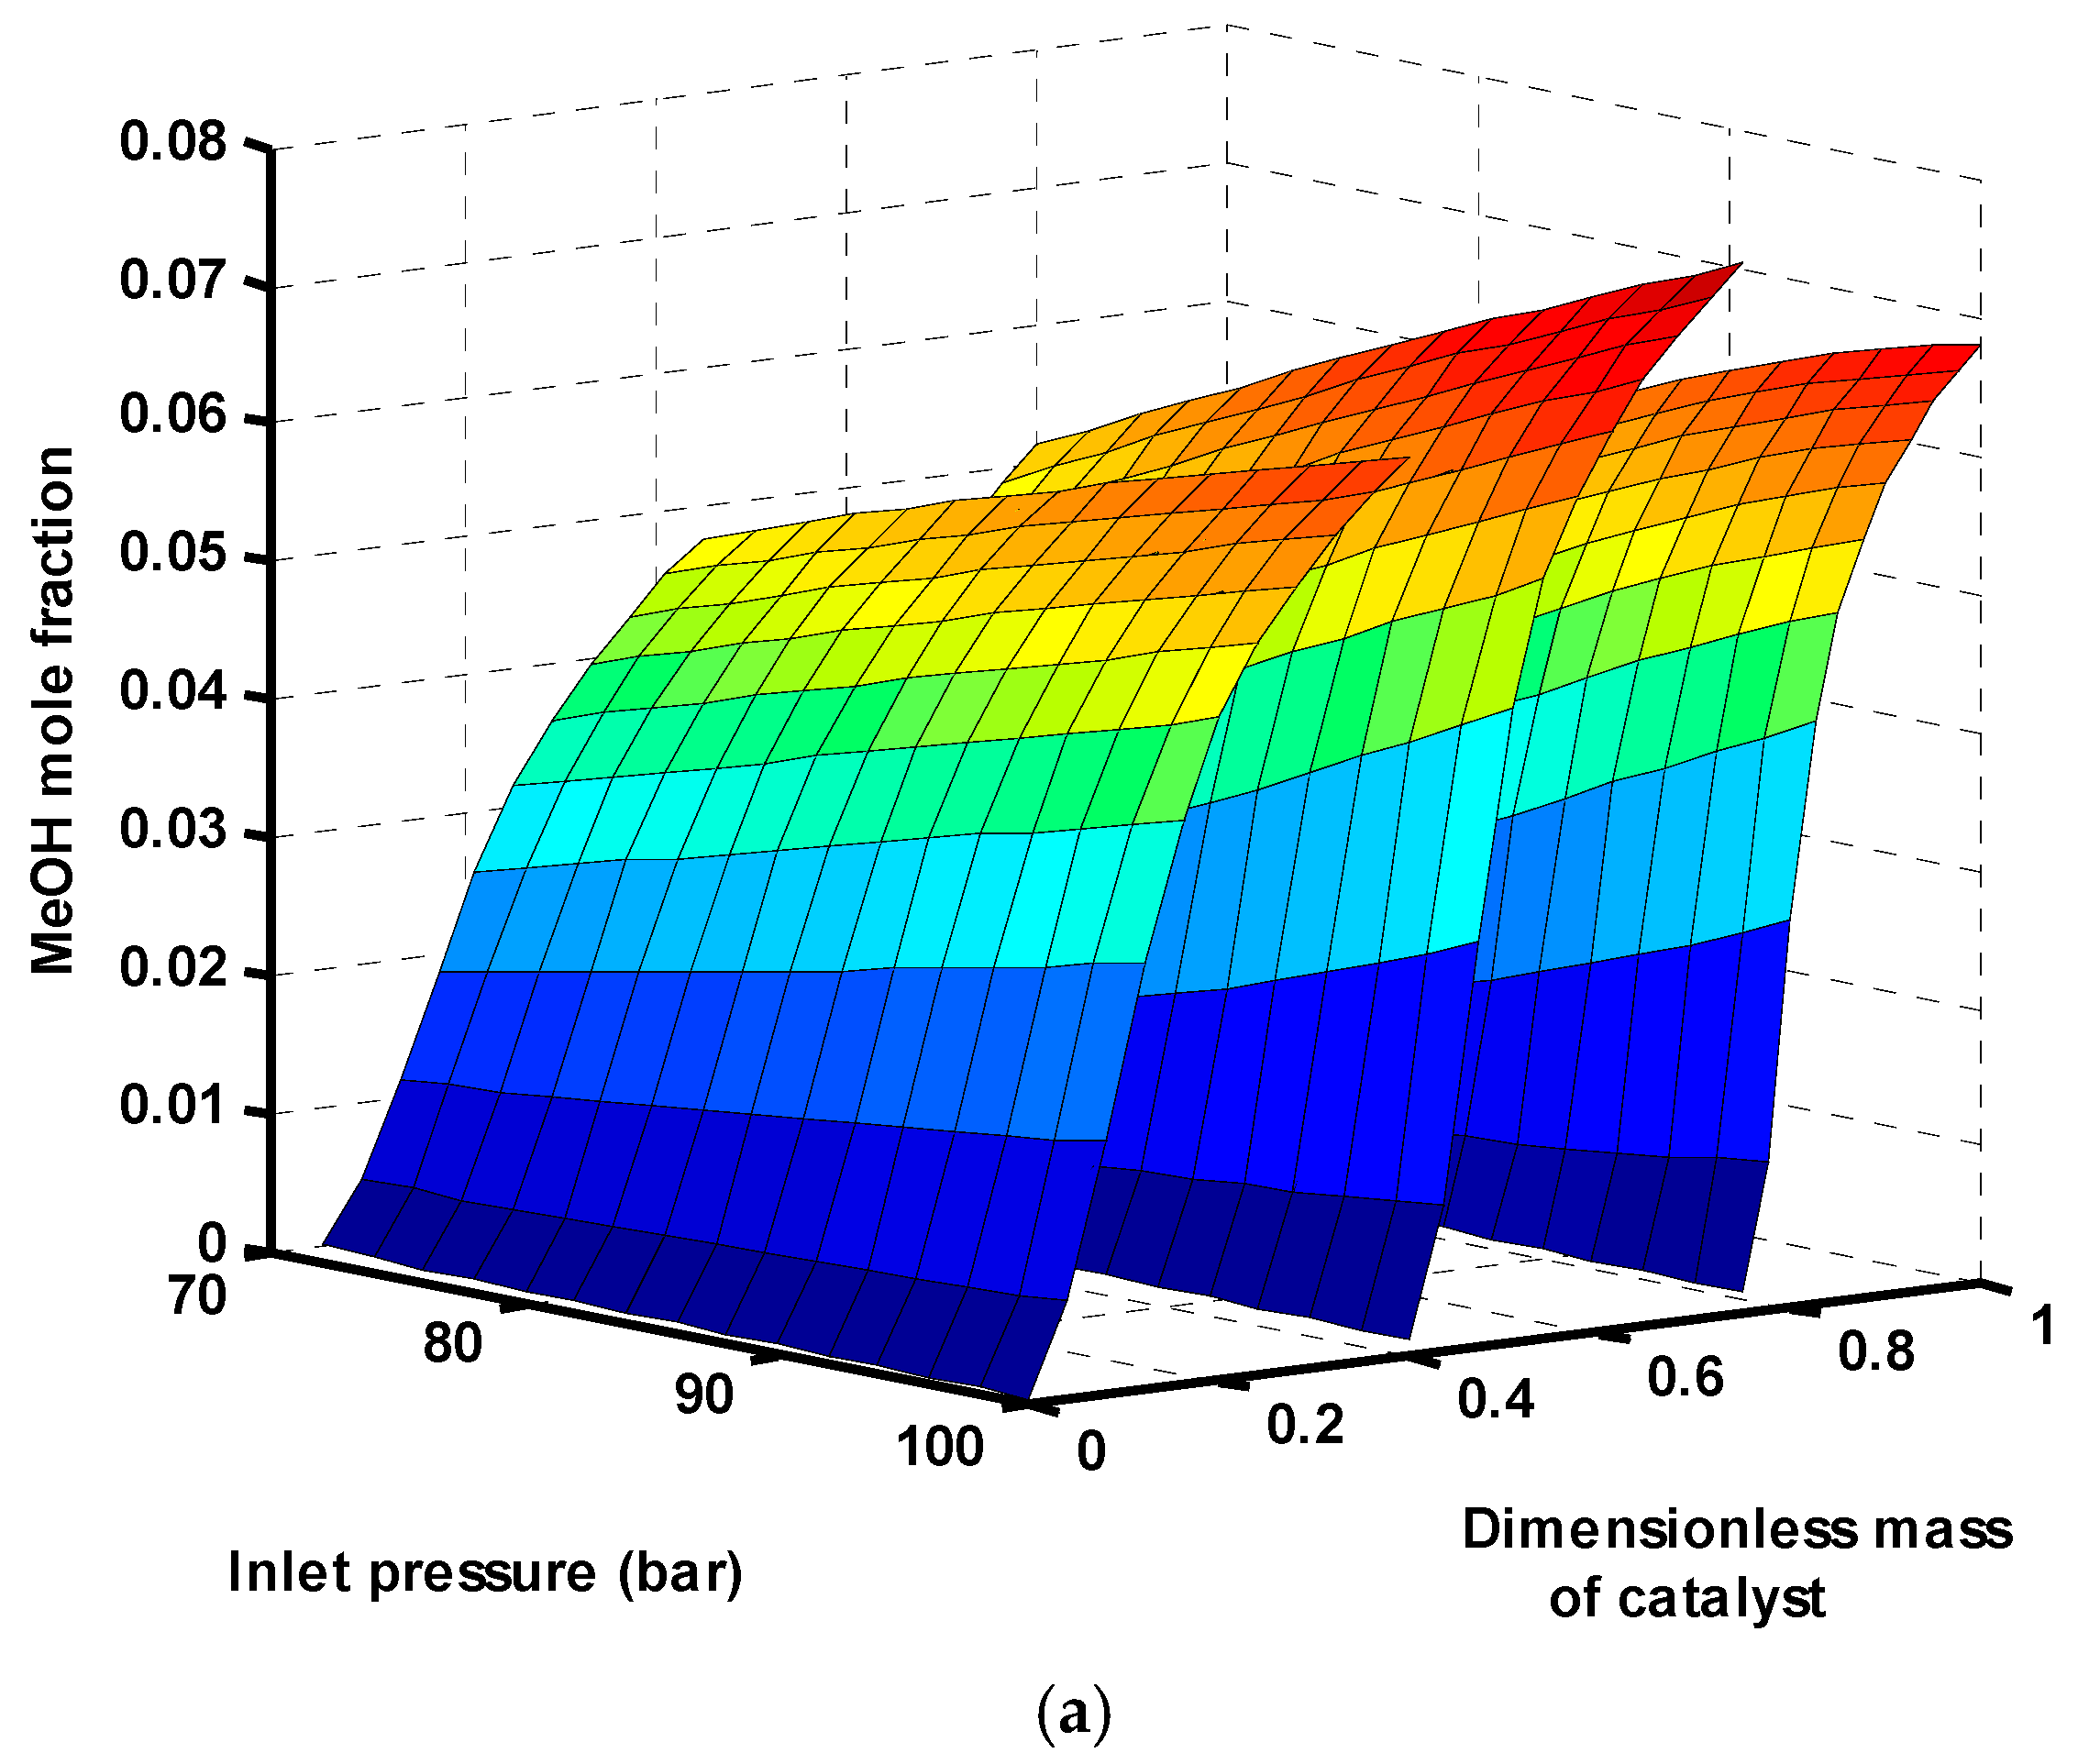
Since the inlet temperature plays a more significant role in adiabatic or isothermal reactors, only the effect of inlet pressure was investigated on the performance of this heat exchanger reactor. Figure 5 demonstrates the changes in the mole fractions of different components of the three-stage reactors as a function of inlet pressure of the first reactor. Methanol is produced along the reactors through reaction (3) and also reaction (1). Both these reactions are accompanied with a reduction of total moles; thus, based on the Le Chatelier principle, the reactions are shifted towards the production side at higher pressures. The produced methanol from the first reactor is mainly separated from the unreacted gases in a flash drum and in the second and third reactors is produced again. The changes in mole fraction of water as the unwanted product are depicted in Figure 5b. Water is produced by both CO2 hydrogenation (Equation (3)) and reverse water gas shift (RWGS) reactions (Equation (2)). More water is produced in higher pressures, which is not desirable. This is because, in the commercial methanol synthesis catalyst (CuO/ZnO/Al2O3), alumina is a very hydrophilic substance and consequently adsorbs the generated water. This phenomenon causes catalyst deactivation [56,57], and, therefore, it reduces the methanol yield over the time. Therefore, lower pressures are favored for reduction of water.
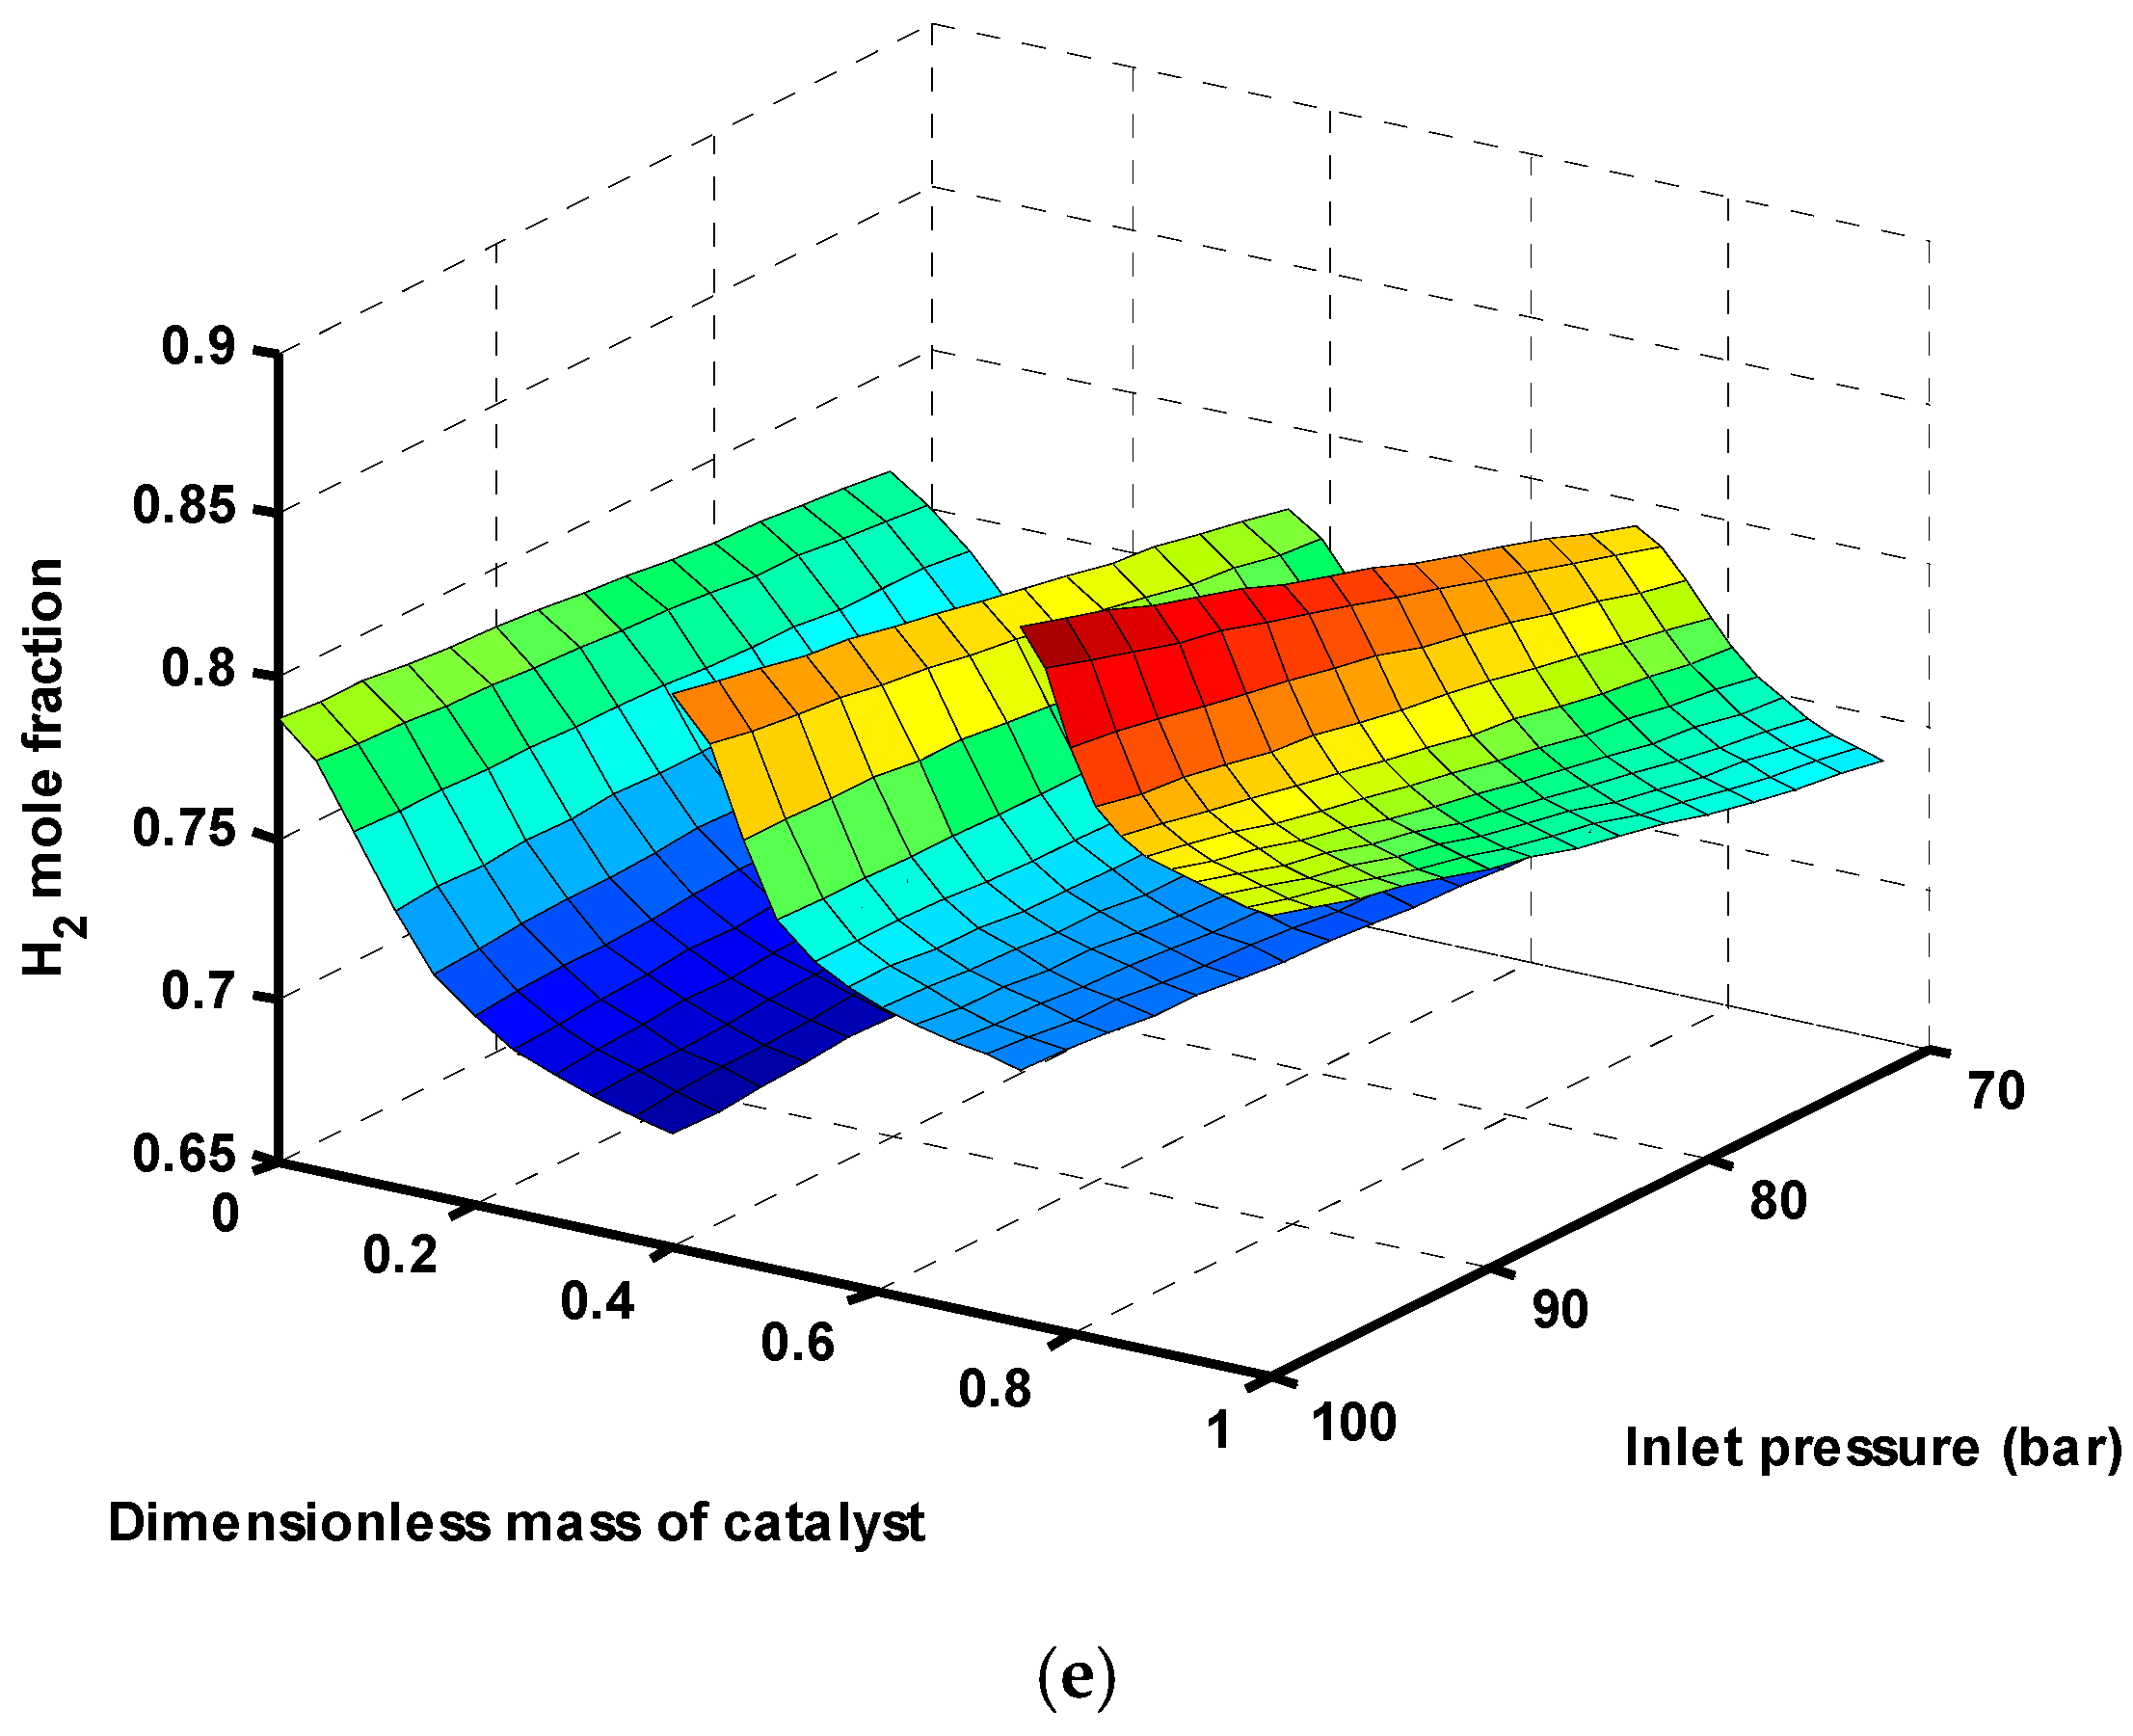
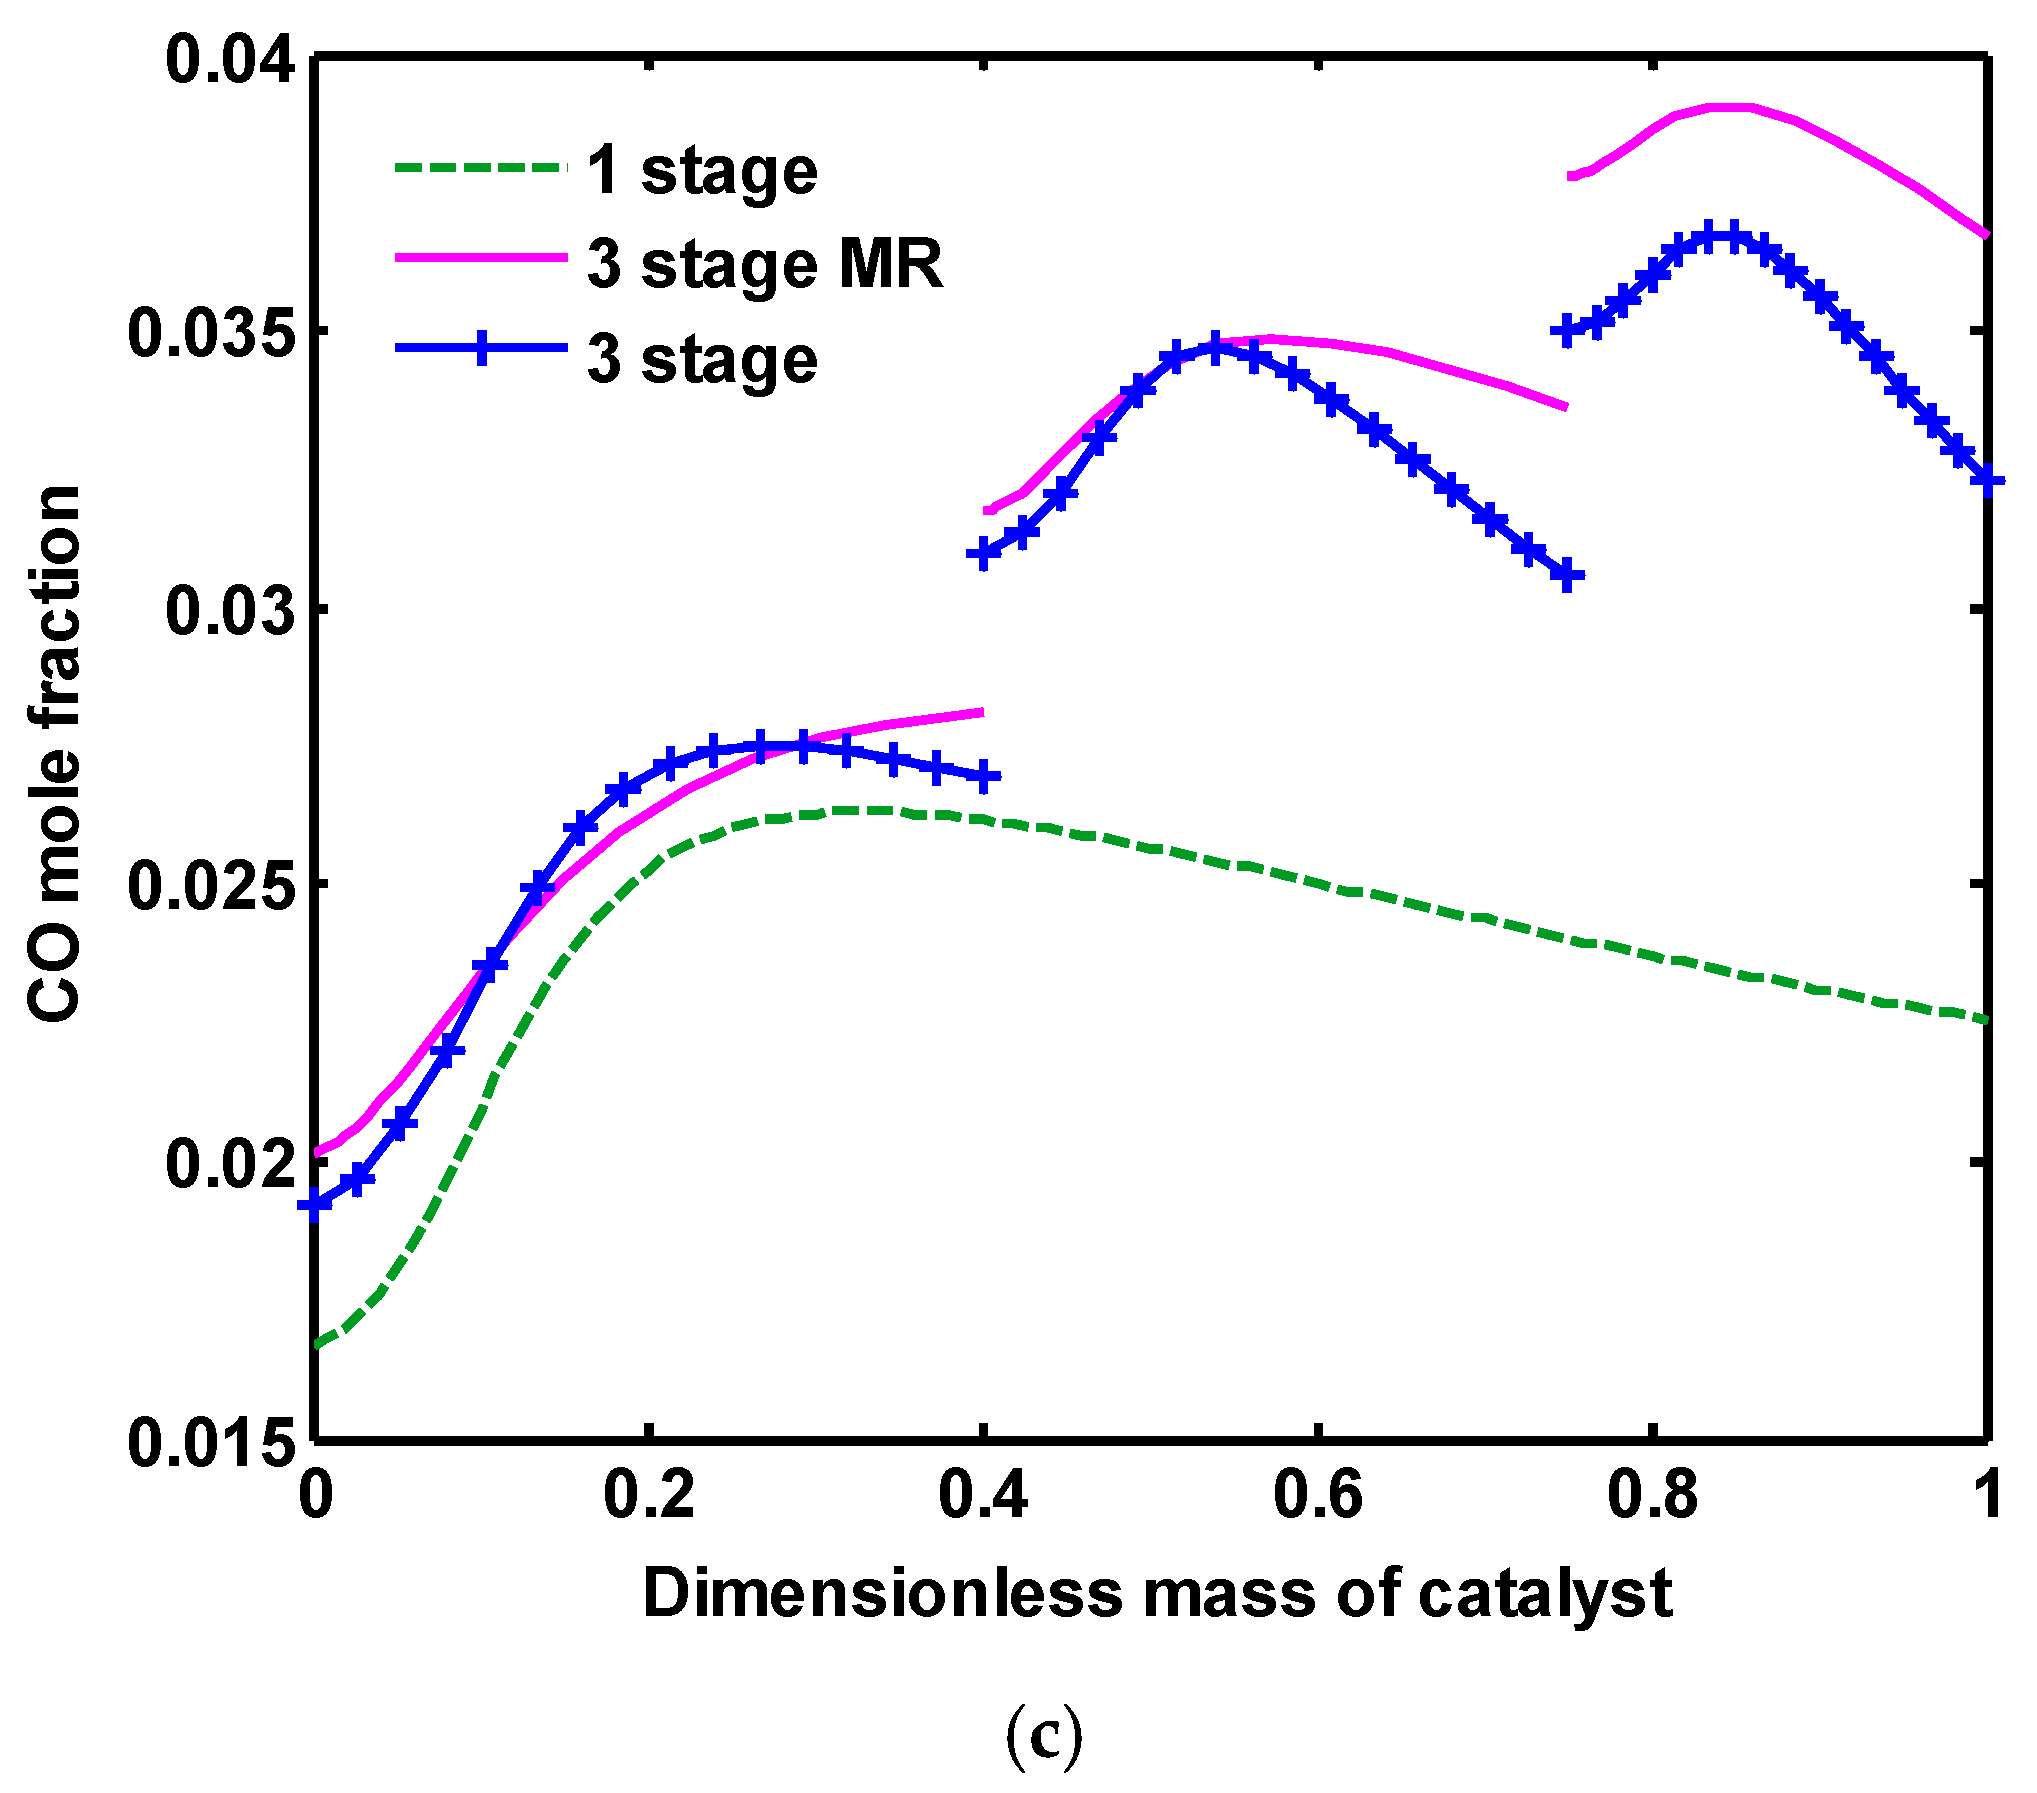
The profile of CO mole fraction was shown in Figure 5c. In low pressures, CO increases along the reactor, because of RWGS reaction (Equation (2)), while, in high pressures, reaction (3) is favored and more H2O is produced. Augmentation of H2O in the reactor shifts the RWGS reaction toward the consumption of CO and H2O (known as WGS reaction). Thus, in higher pressures, a maximum is observed for CO mole fraction, and, after that, CO is reduced along the reactor. In addition, it can be deduced from the figure that, in high inlet pressures, a lower concentration of CO results in the feedstock of each reactor. This is because, in high pressures, CO consumes considerably in each reactor and then, with lower concentration in the reactor outlet, is fed to the next reactor. Figure 5d,e show that CO2 and H2 are consumed more in high pressures (reactions (1) and (3) are favored at high pressures), which confirms Figure 4a.
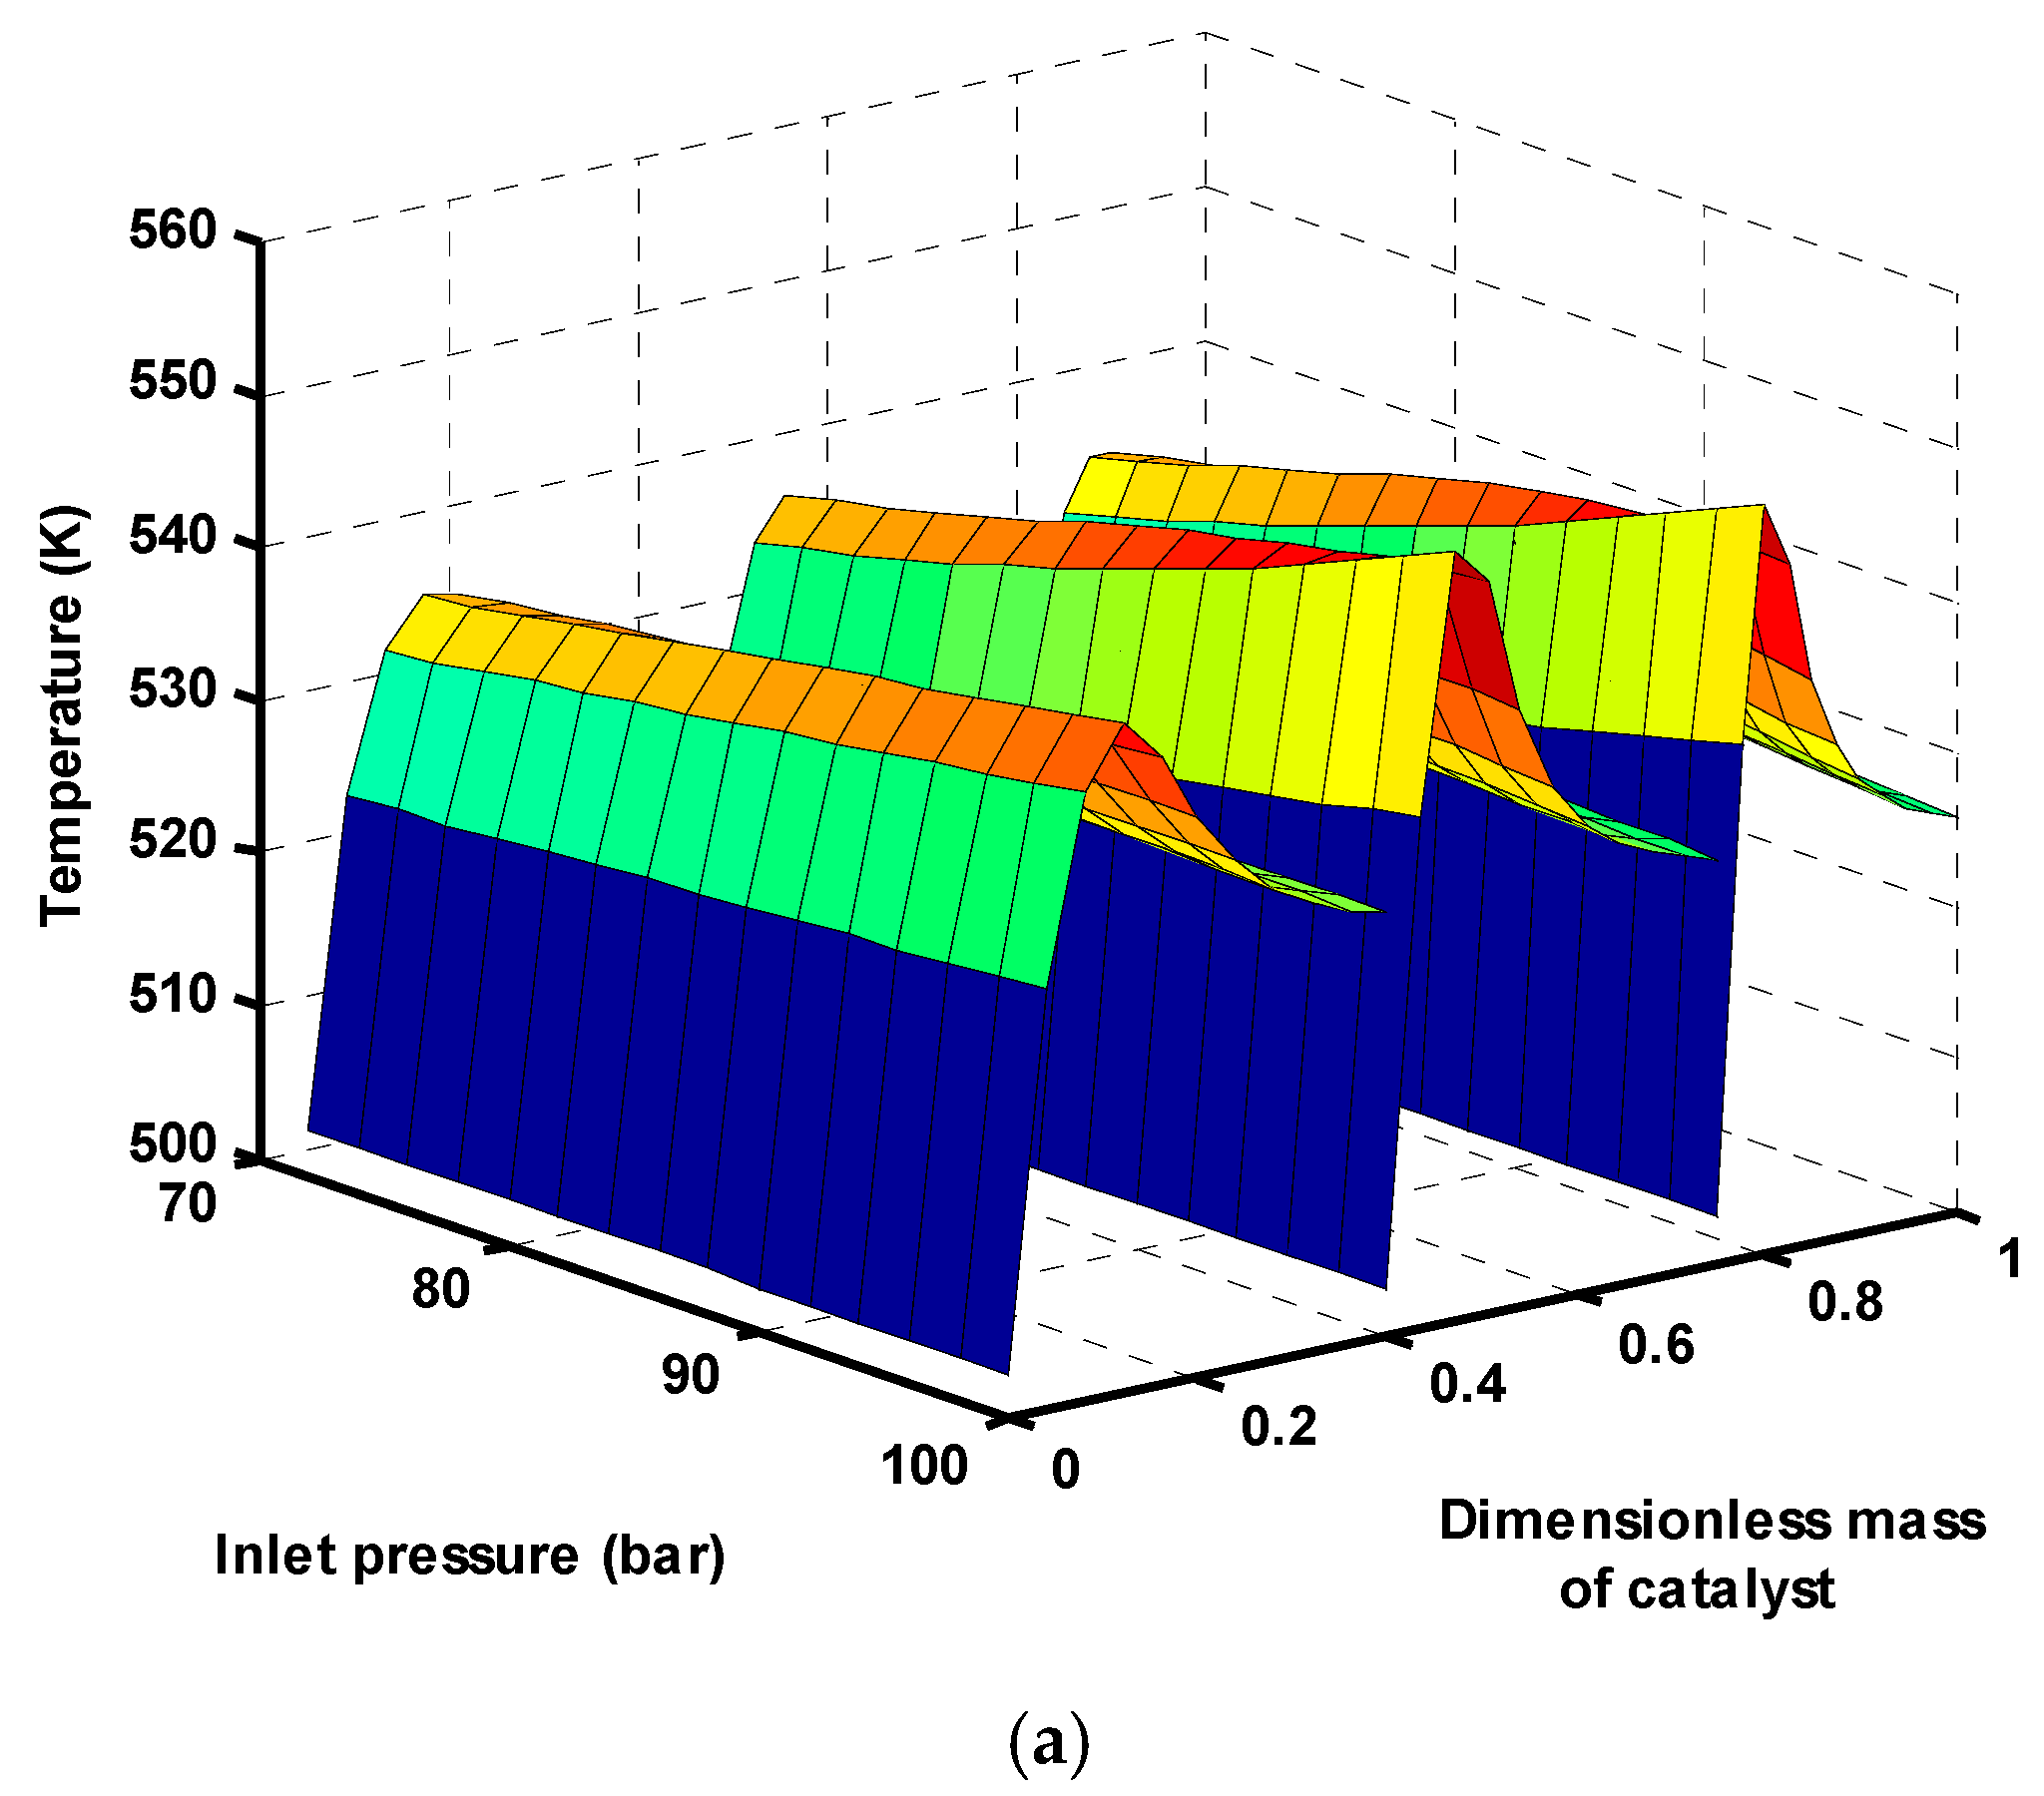
Figure 6a displays the profile of temperature along the reactor. As seen, there is a hot spot in the beginning of the reactors because of the occurrence of the exothermic reactions, which causes temperature to increase. As the fluid goes through the reactor, the influence of cooling water becomes more significant, and it dominates the released heat, and, as a result, the temperature diminishes. This figure also reflects that a rise in the inlet pressure contributes to higher temperature in the reactor. This phenomenon can be attributed to two reasons; first, the augmentation of inlet pressure favors the exothermic reactions (Equations (1) and (3)), contributing to more heat generation and higher temperature in the reactor. Second, increasing the H2O concentration leads to occurrence of the exothermic WGS reaction (the reverse of Equation (2)), and, consequently, more heat is generated by the reactions. Therefore, higher inlet pressures make the reactions highly exothermic and, thus, controlling the reactor temperature becomes difficult.
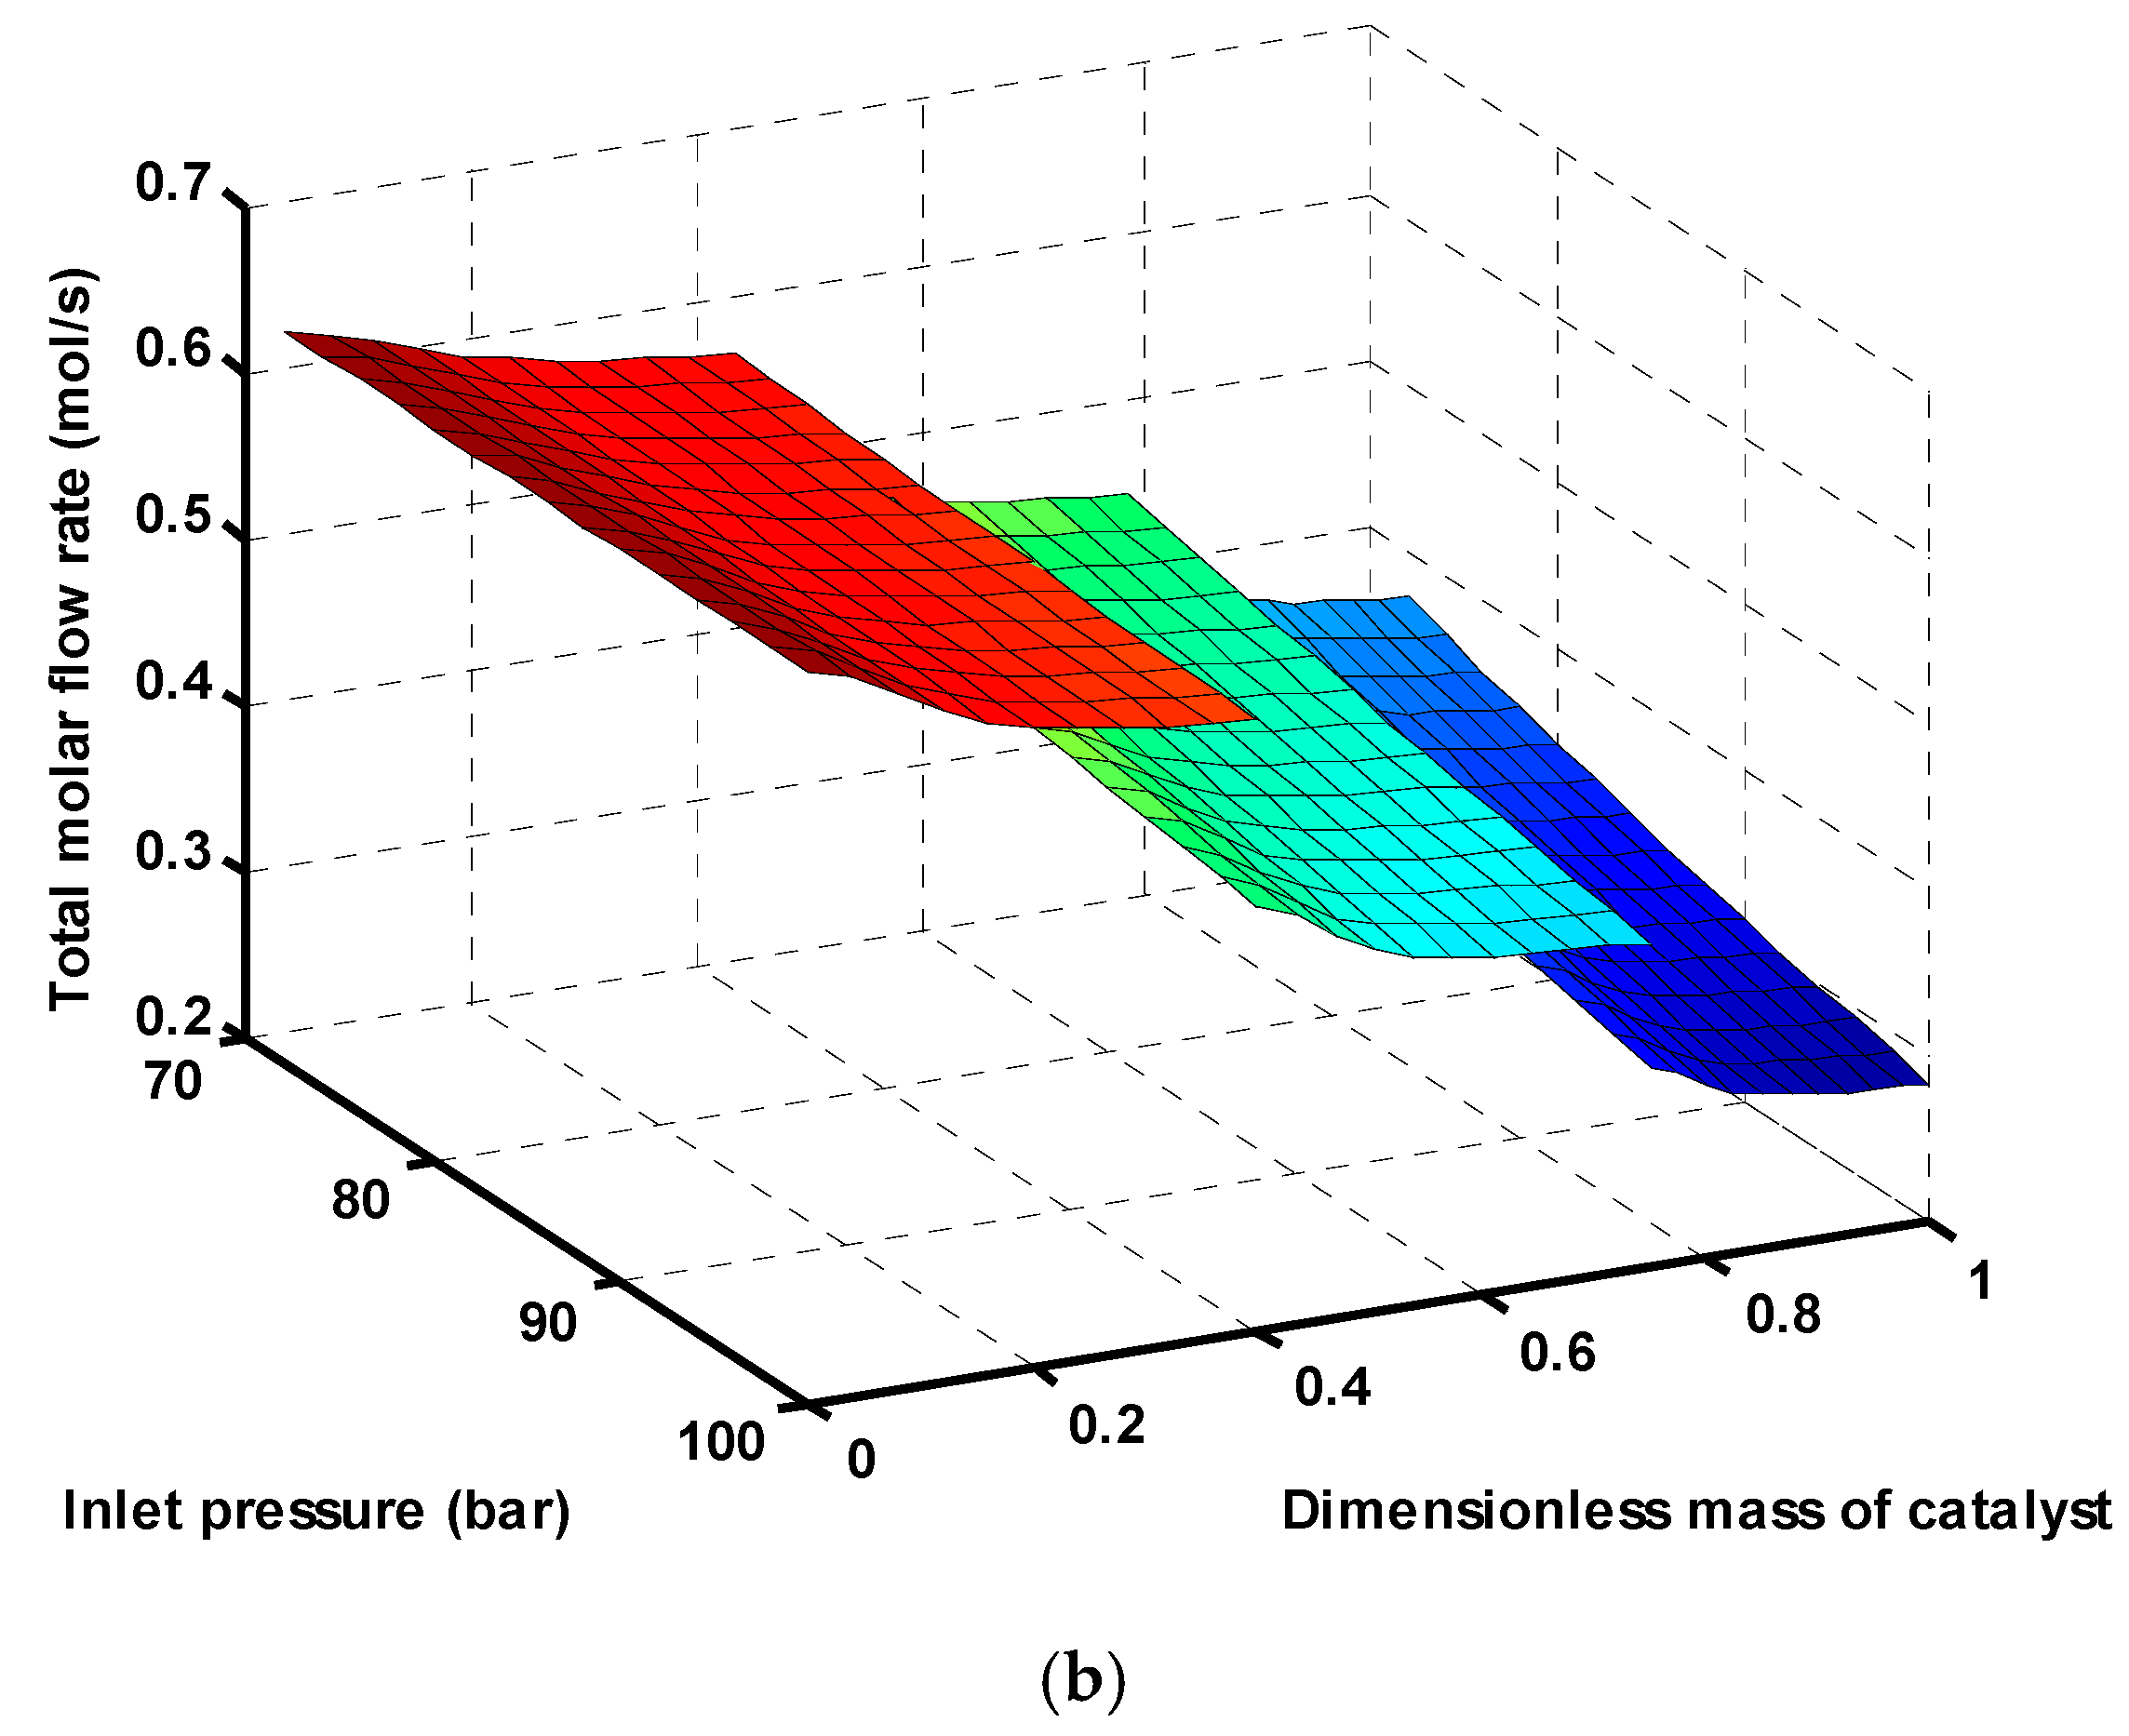
Figure 6b demonstrates reduction of total molar flow rate in all three reactors by increasing the inlet pressure. As mentioned before, in reactions (1) and (3), the total moles are reduced, so, based on the Le Chatelier principle, the reactions are shifted toward the right side at higher pressures, and, subsequently, the total molar flow rate decreases.
Although methanol production favors high inlet pressures, high amounts of water as the catalyst poisoning is also produced during the reaction. In addition, the pressure should be kept as low as possible to reduce capital costs. Moreover, higher inlet pressures result in a higher hot spot in methanol synthesis reactor, which may lead to catalyst sintering and increasing the risk of coke deposition. Thus, it seems to be necessary operating at a pressure in which high methanol yield with a reasonable amount of water and hot spot along the reactor result. In this work, the inlet pressure equals to 76.98 bar as the designed pressure of conventional methanol synthesis reactor is considered in the proposed process model.
6.2. A Comparison between One-Stage, Three-Stage and Three-Stage Membrane Reactors (MR)
As mentioned, low conversion of carbon dioxide over the commercial catalyst and its deactivation due to water production during the reaction are the two main concerns in CO2 hydrogenation process. To overcome low conversion of carbon dioxide, a three-stage heat exchanger reactors connected in series was proposed for direct CO2 hydrogenation and the results in the previous section indicate significant augmentation in CO2 conversion. To solve the latter problem, an H-SOD membrane was applied in each reactor of the proposed process for separation of water from the reaction side. In this section, the performance of these three-stage membrane reactors (MR) was compared with one-stage and three-stage reactors.
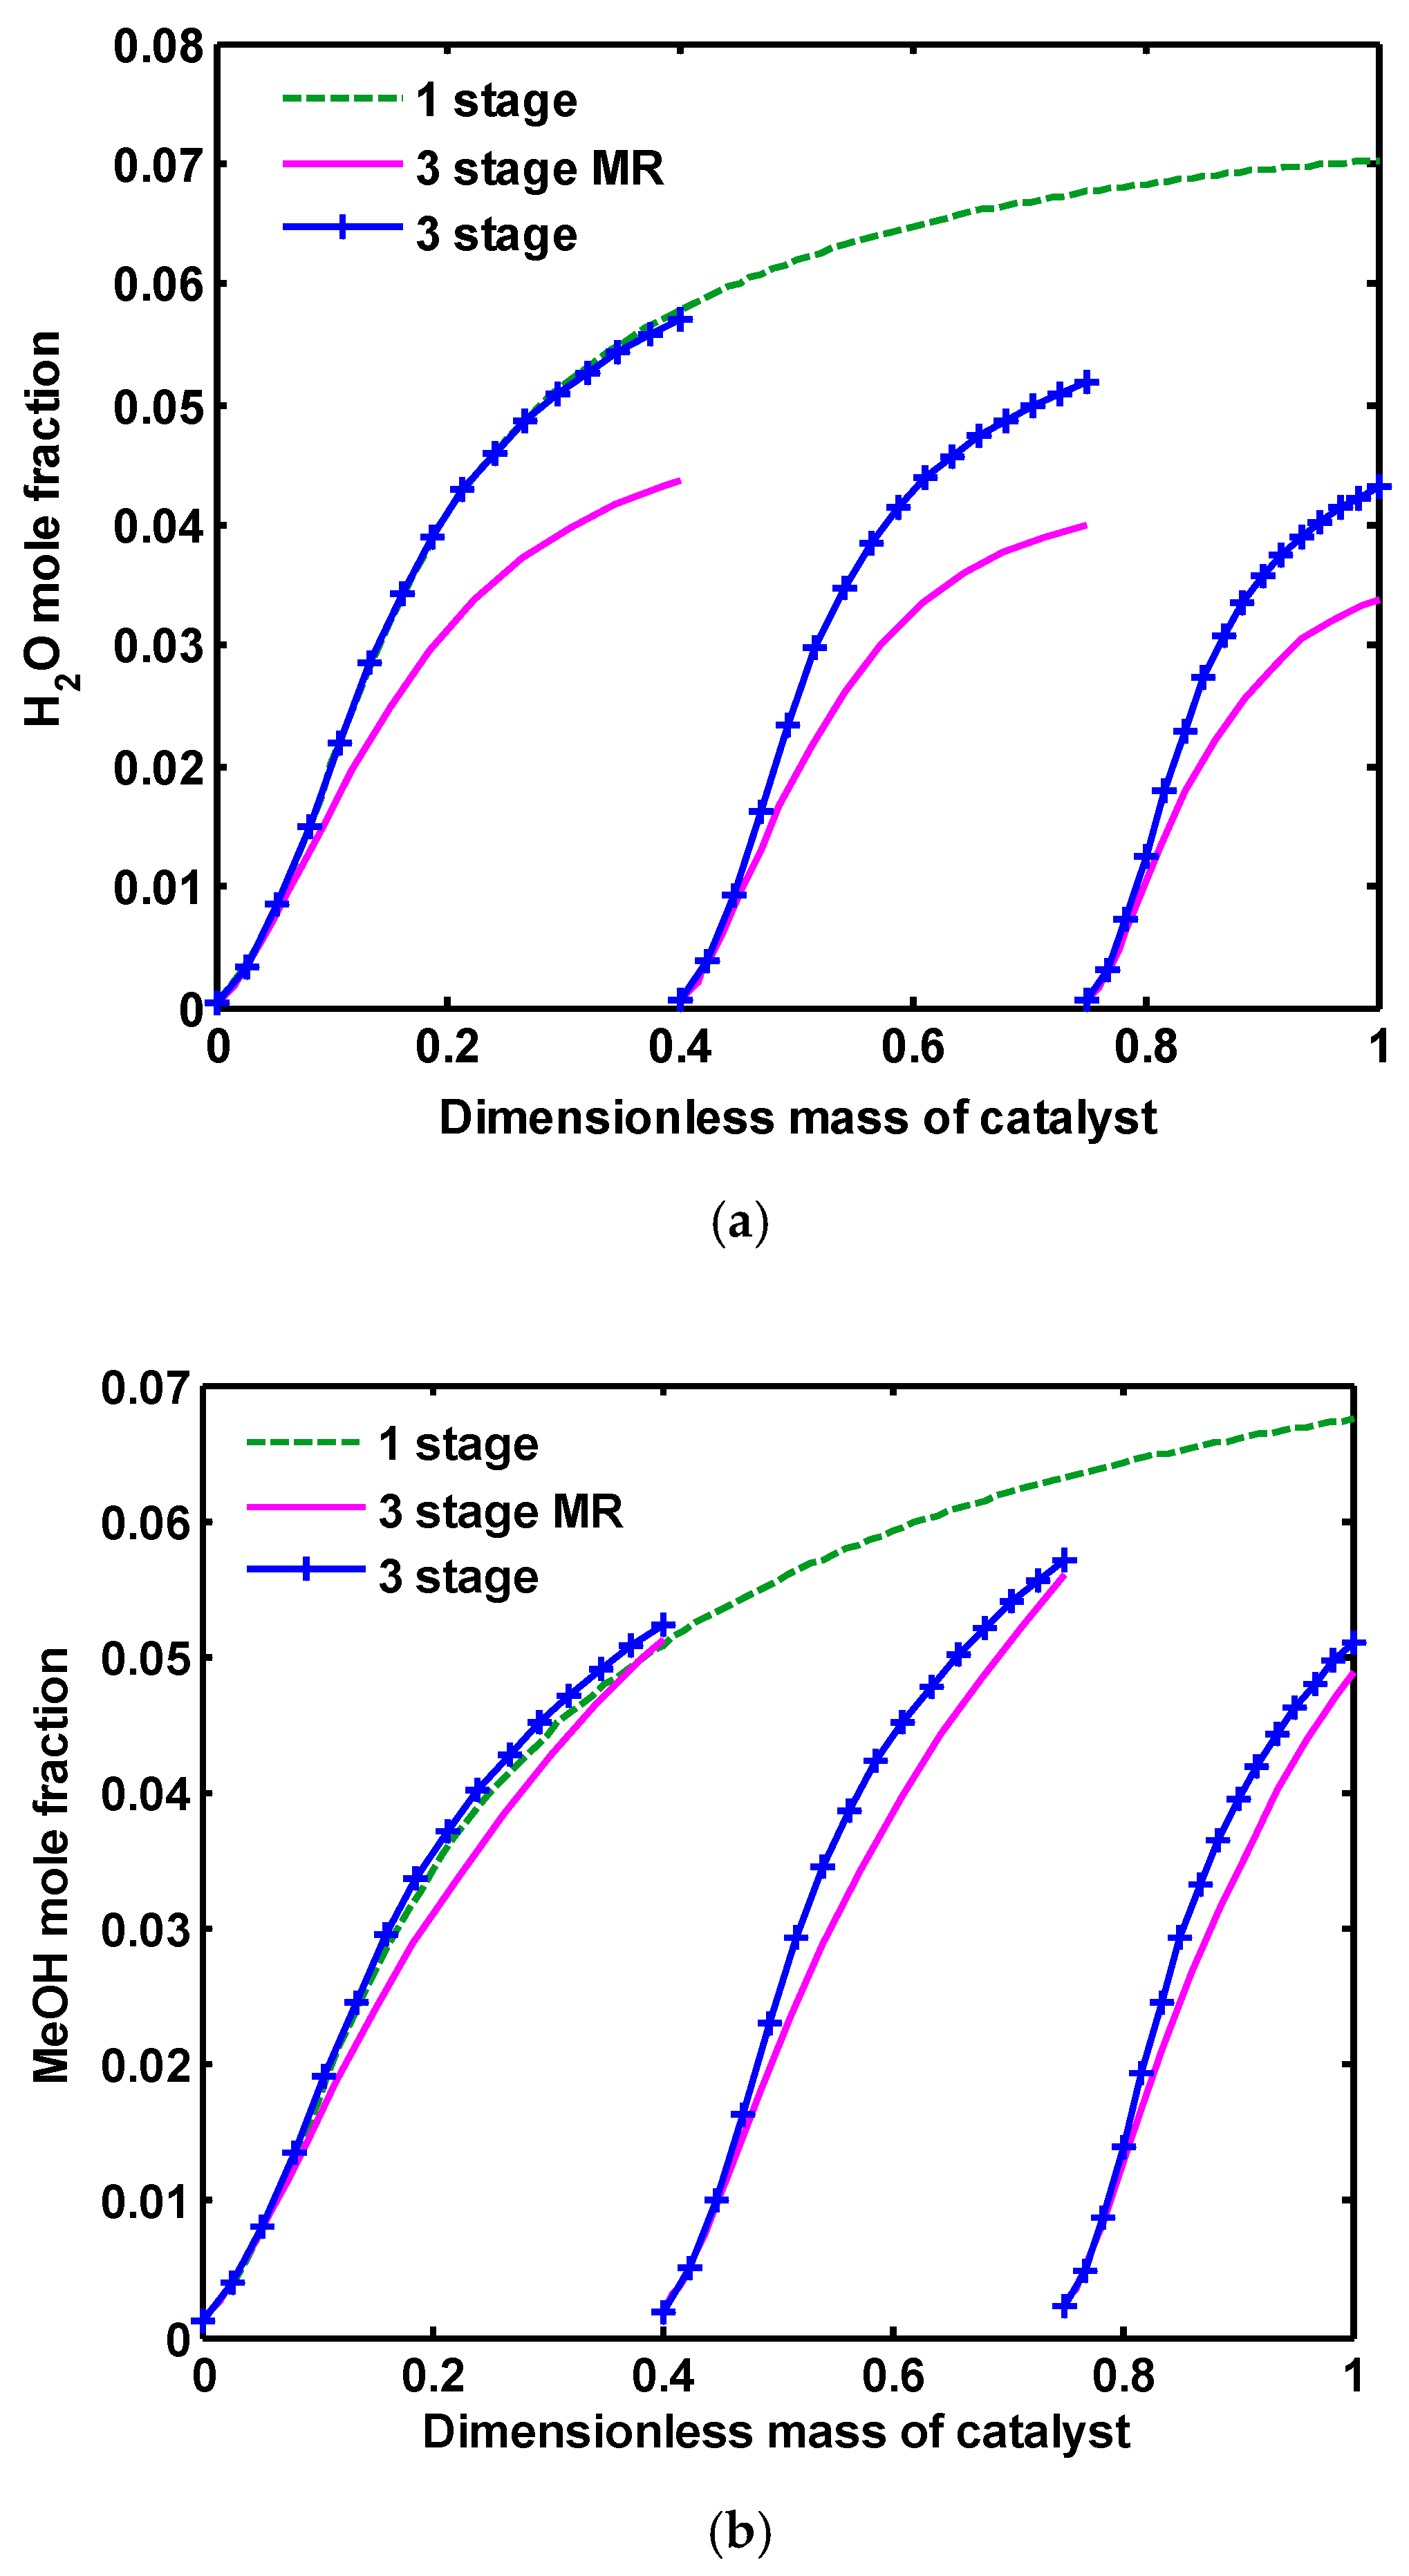
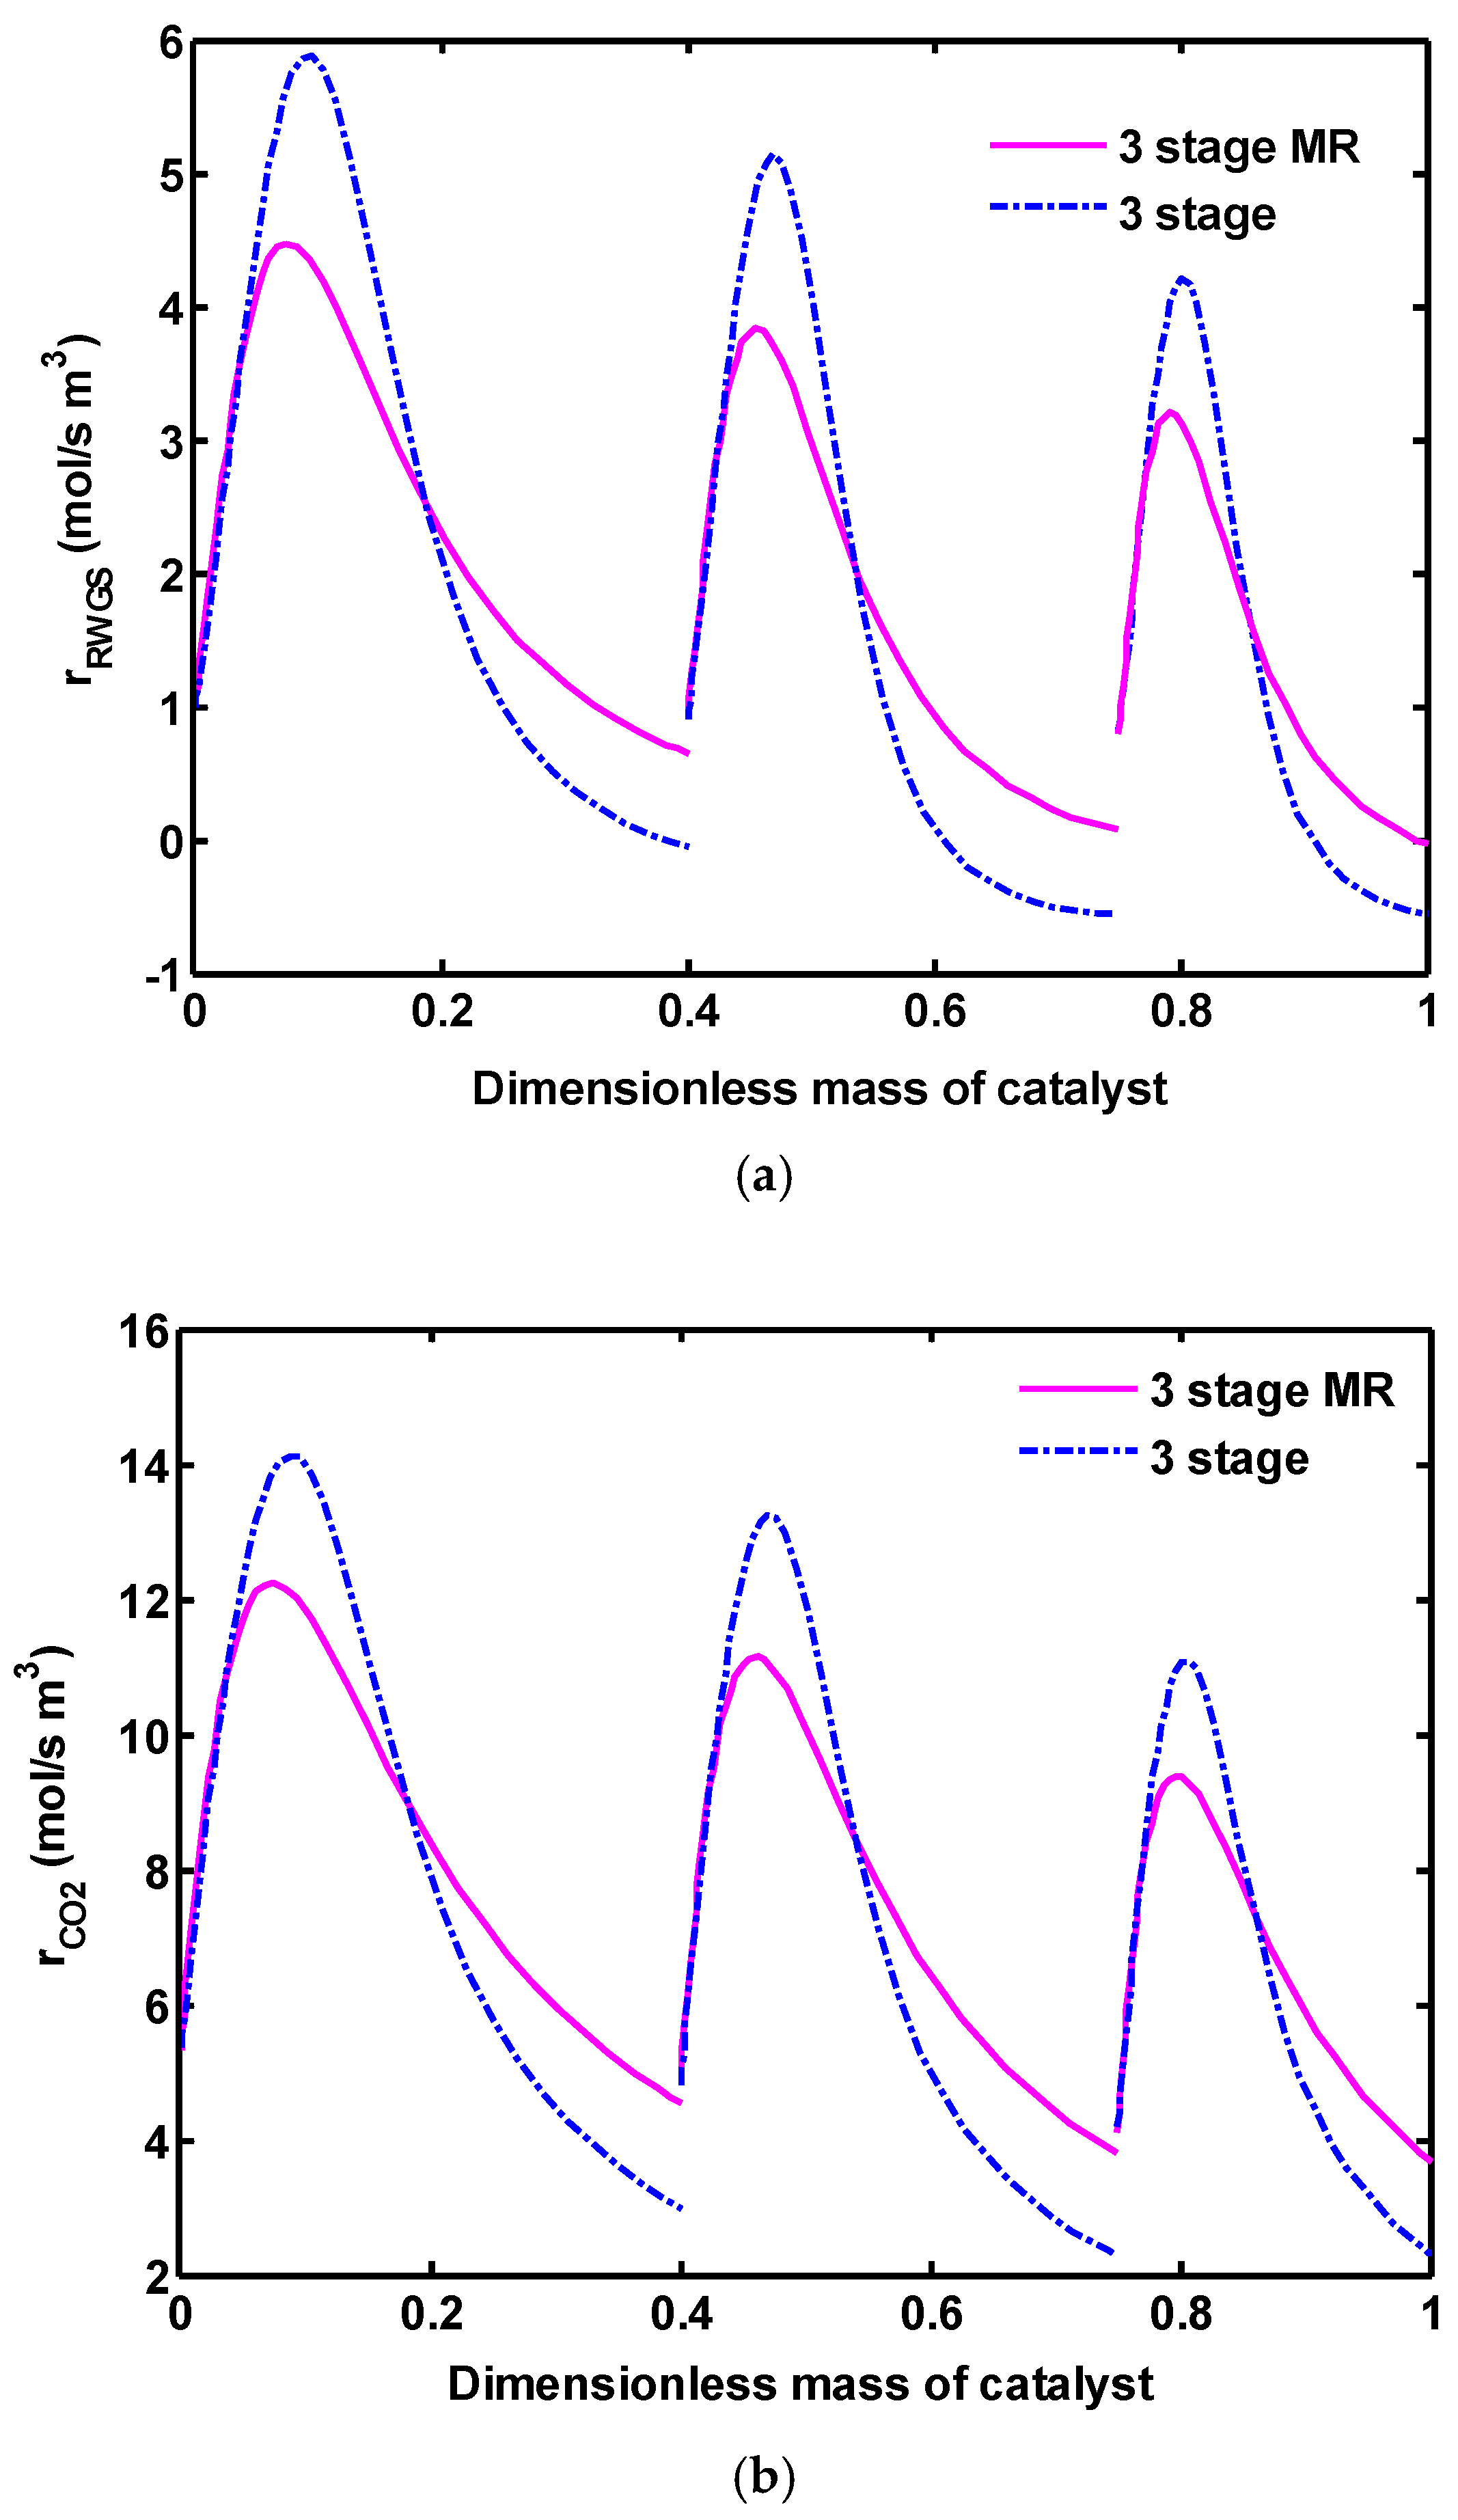
In Figure 7, the profiles of H2O, MeOH and CO mole fractions are compared for these three configurations. Water produced during RWGS reaction (Equation (2)) greatly reduces the methanol production rate by suppressing reaction (3). Furthermore, the produced water accelerates the crystallization of Cu and ZnO contained in the commercial catalyst, leading to the catalyst deactivation [41,42]. In addition, alumina presented in the catalyst is a very hydrophilic substance and consequently adsorbs the generated water, resulting in catalyst poisoning. Therefore, to improve the CO2 hydrogenation process, in situ removal of water during the reaction is crucial. In, a one-stage reactor, as the common process for CO2 hydrogenation, a remarkable amount of H2O is produced during RWGS and CO2 hydrogenation reactions (Equations (2) and (3)). In a three-stage configuration where the volume of catalysts is divided into three reactors connected in series, lower amounts of water are produced compared to one-stage because of lower catalyst volume in each reactor. By applying water perm-selective membrane, the concentration of water as the undesirable product is reduced considerably in all three reactors. In the membrane concept, water vapor is withdrawn from the reaction to the permeation side by a water perm-selective membrane. In Figure 7b, methanol mole fraction distribution along the reactors was demonstrated. Because of lower catalyst volume in each reactor of three-stage and three-stage MR, lower amounts of methanol are produced compared to one-stage. The produced methanol from each reactor is mainly separated from the unreacted gases in a flash drum and is produced again in the next reactor. Thus, the total methanol production rate increases extremely in this novel configuration. There is no significant difference in the methanol concentration in three-stage and three-stage MR. Although more methanol is expected to be produced by eliminating water from the reaction side (according to the Le Chatelier principle, see Equation (3)), a lower amount of methanol was produced in three-stage MR compared with three-stage. This observation can be justified by taking a close look at the reaction rates profiles as seen in Figure 8a–c. These figures reveals that all reaction rates have lower values in three-stage MR, consequently the conversion of CO2 and H2 (see Figure 9) is decreased and finally less methanol is produced. The reason of reduction of all reaction rates in three-stage MR is that, in this configuration, a lower temperature profile is observed during the reaction, due to further heat transferring with the permeation side and, as it is quite clear, lower reactor bed temperature results in lower reaction rate. In one-stage reactor, CO is first produced during RWGS reaction, and then, by increasing water production, the RWGS reaction is shifted towards CO consumption (WGS reaction occurs). This trend is exactly repeated in three-stage reactors, while in three-stage MR, by removing H2O from the reaction side, based on the Le Chatelier principle, RWGS reaction is shifted towards more CO production. Therefore, the profile of CO mole fraction is slightly different in this configuration.
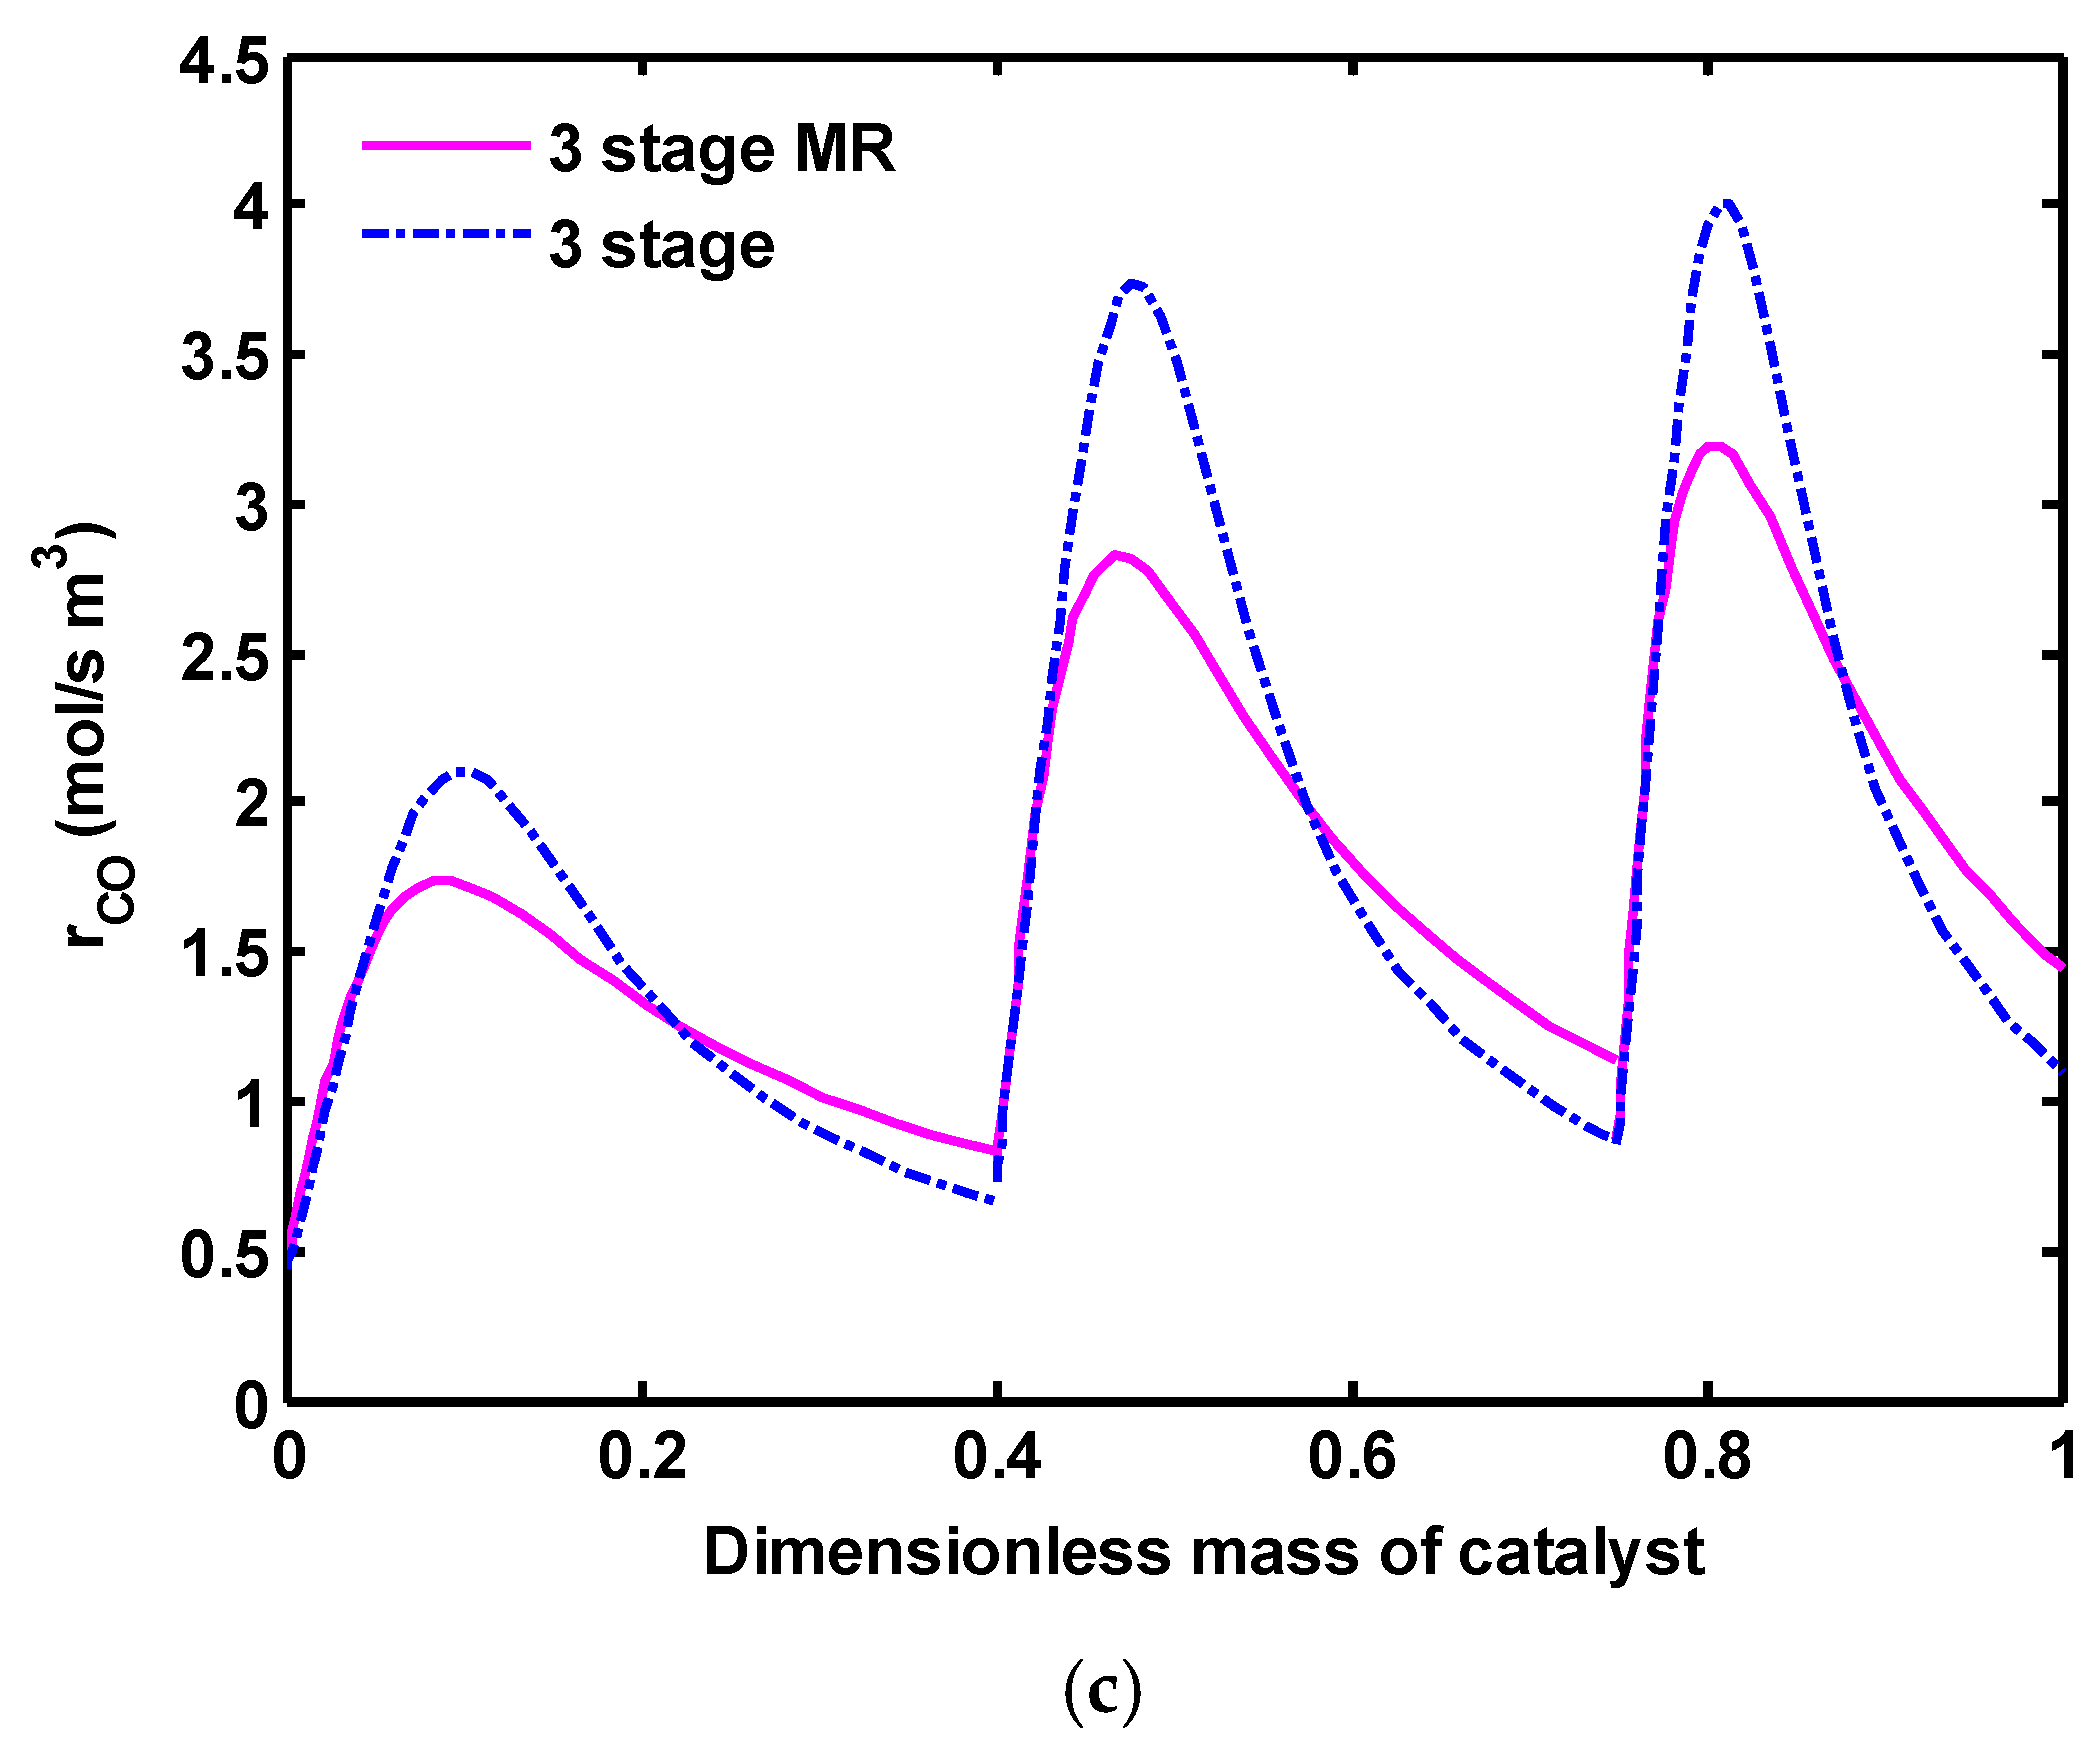
RWGS reaction rate profile was shown in Figure 8a. A close look reveals that the RWGS reaction in three-stage configuration is shifted towards the left side (WGS reaction) at the end of each reactor, while in three-stage MR, only the forward reaction takes place. As mentioned, this is because of the fact that, in the membrane concepts, H2O removal pushes the RWGS reaction to the right side. Although CO and CO2 hydrogenation reaction rates follow a similar trend in both configurations (see Figure 8b,c), three-stage MR predicts lower values compared to the other one, because of its slightly lower reactor bed temperature profiles.
Figure 9 shows considerably higher CO2 and H2 conversion in three-stage reactor compared to 1 one stage reactor. CO2 and H2 conversions are approximately increases twice higher than the common process. This is due to using the unreacted gases in the second and third reactor. In three-stage MR, the rates of CO, CO2 hydrogenation and RWGS reactions are reduced in the presence of H-SOD membrane, consequently H2 and CO2 conversions have lower values in comparison to three-stage reactors. Figure 10 demonstrates MeOH yield along all configurations, which has a similar trend to the MeOH mole fraction. MeOH yield is described as Equation (31). Water to MeOH ratio is also shown in Figure 11. As clearly shown, H2O/MeOH ratio increases in all configurations, even reaching more than one. This can be attributed to the fact that, in the CO2 hydrogenation process, water is produced through reactions (2) and (3), while MeOH is mainly produced by reaction (3) and a little by reaction (3). However, from the middle to the end of the each reactor in one-stage and three-stage configurations, this ratio follows a constant trend, due to thermodynamic limitations, while in three-stage MR, this ratio diminishes up to the end of the reactor because of H2O permeation during the reaction. Figure 12 depicts MeOH to CO ratio for all configurations. This ratio increases as the gas flowing through the reactor. The reason is that methanol is produced by reactions (1) and (3), while CO is formed through reaction (2) and consumed by reaction (1). Consequently, more MeOH will be gainedcompared to CO:
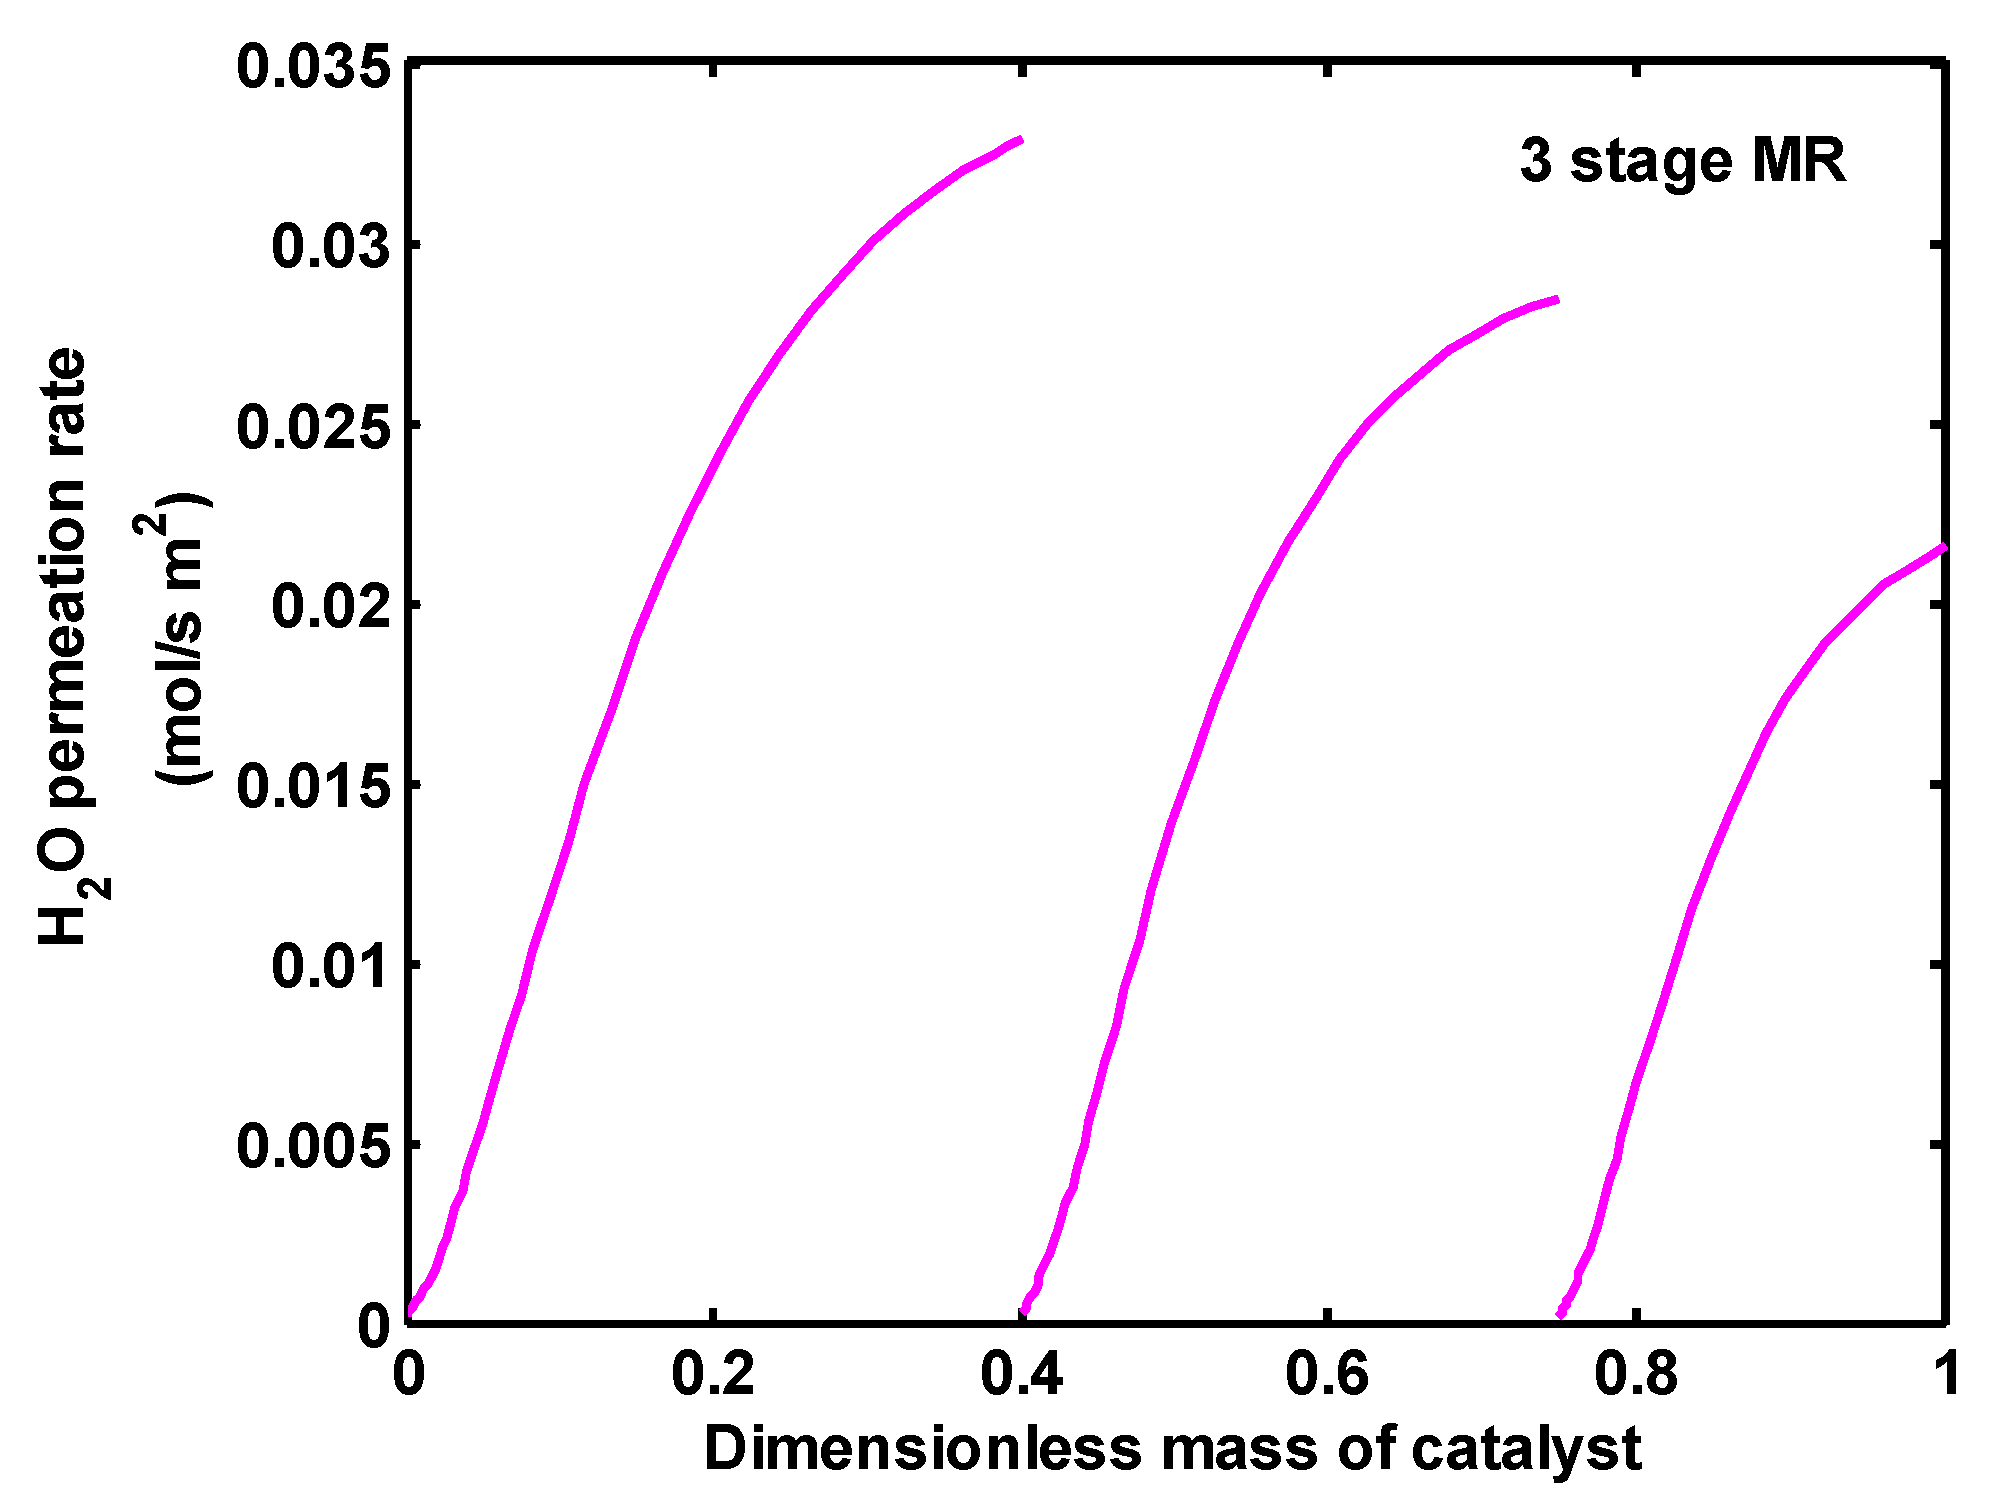
The temperature distribution along the reactors is depicted in Figure 13a. The temperature profile in the first reactor of three-stage configuration has the same trend as one-stage reactors. This is due to the same conditions of these two reactors, except in their catalyst volume and a small difference in their inlet compositions. The temperature profile in the second and third reactors in three-stage configuration are accompanied with a higher hot spot because of higher concentrations of CO in the inlet of these two reactors, which results in CO hydrogenation being a highly exothermic reaction. In three-stage MR configuration, a more favorable profile of temperature is observed because of the heat transfer between the reaction and the permeation sides in this configuration (see Figure 13b, the inlet temperature of the permeation side of each reactor is 475 K, while the inlet temperature of the reaction side is 503 K). Figure 14 shows H2O permeation rate in the permeation sides of three-stage MR configuration.
Pressure distribution along one-stage, three-stage and three-stage membrane reactors are presented in Figure 15. In one-stage configuration, 0.46 bar pressure drop occurs for the gas flowing through the reactor, while in multi stage configurations, approximately, 0.18 bar pressure drop takes places for each of reactors. It should be noted that a total of 4 bar pressure drop was considered between the reactors of multi stage configurations, which means that the inlet pressure of the second and third reactors are 4 bar lower than that of the previous one.
6.3. A Comparison between Three-Stage Membrane Reactors (MR) and the Conventional Methanol Synthesis Reactor (CR)
As proved in the previous sections, the problems of low conversion of CO2 and a high amount of water production in direct CO2 hydrogenation can be solved in three-stage MR configuration. To investigate the plausibility of methanol production from a mixture of CO2 and H2, a comparison was performed between this novel configuration and the traditional process from coal and natural gas.
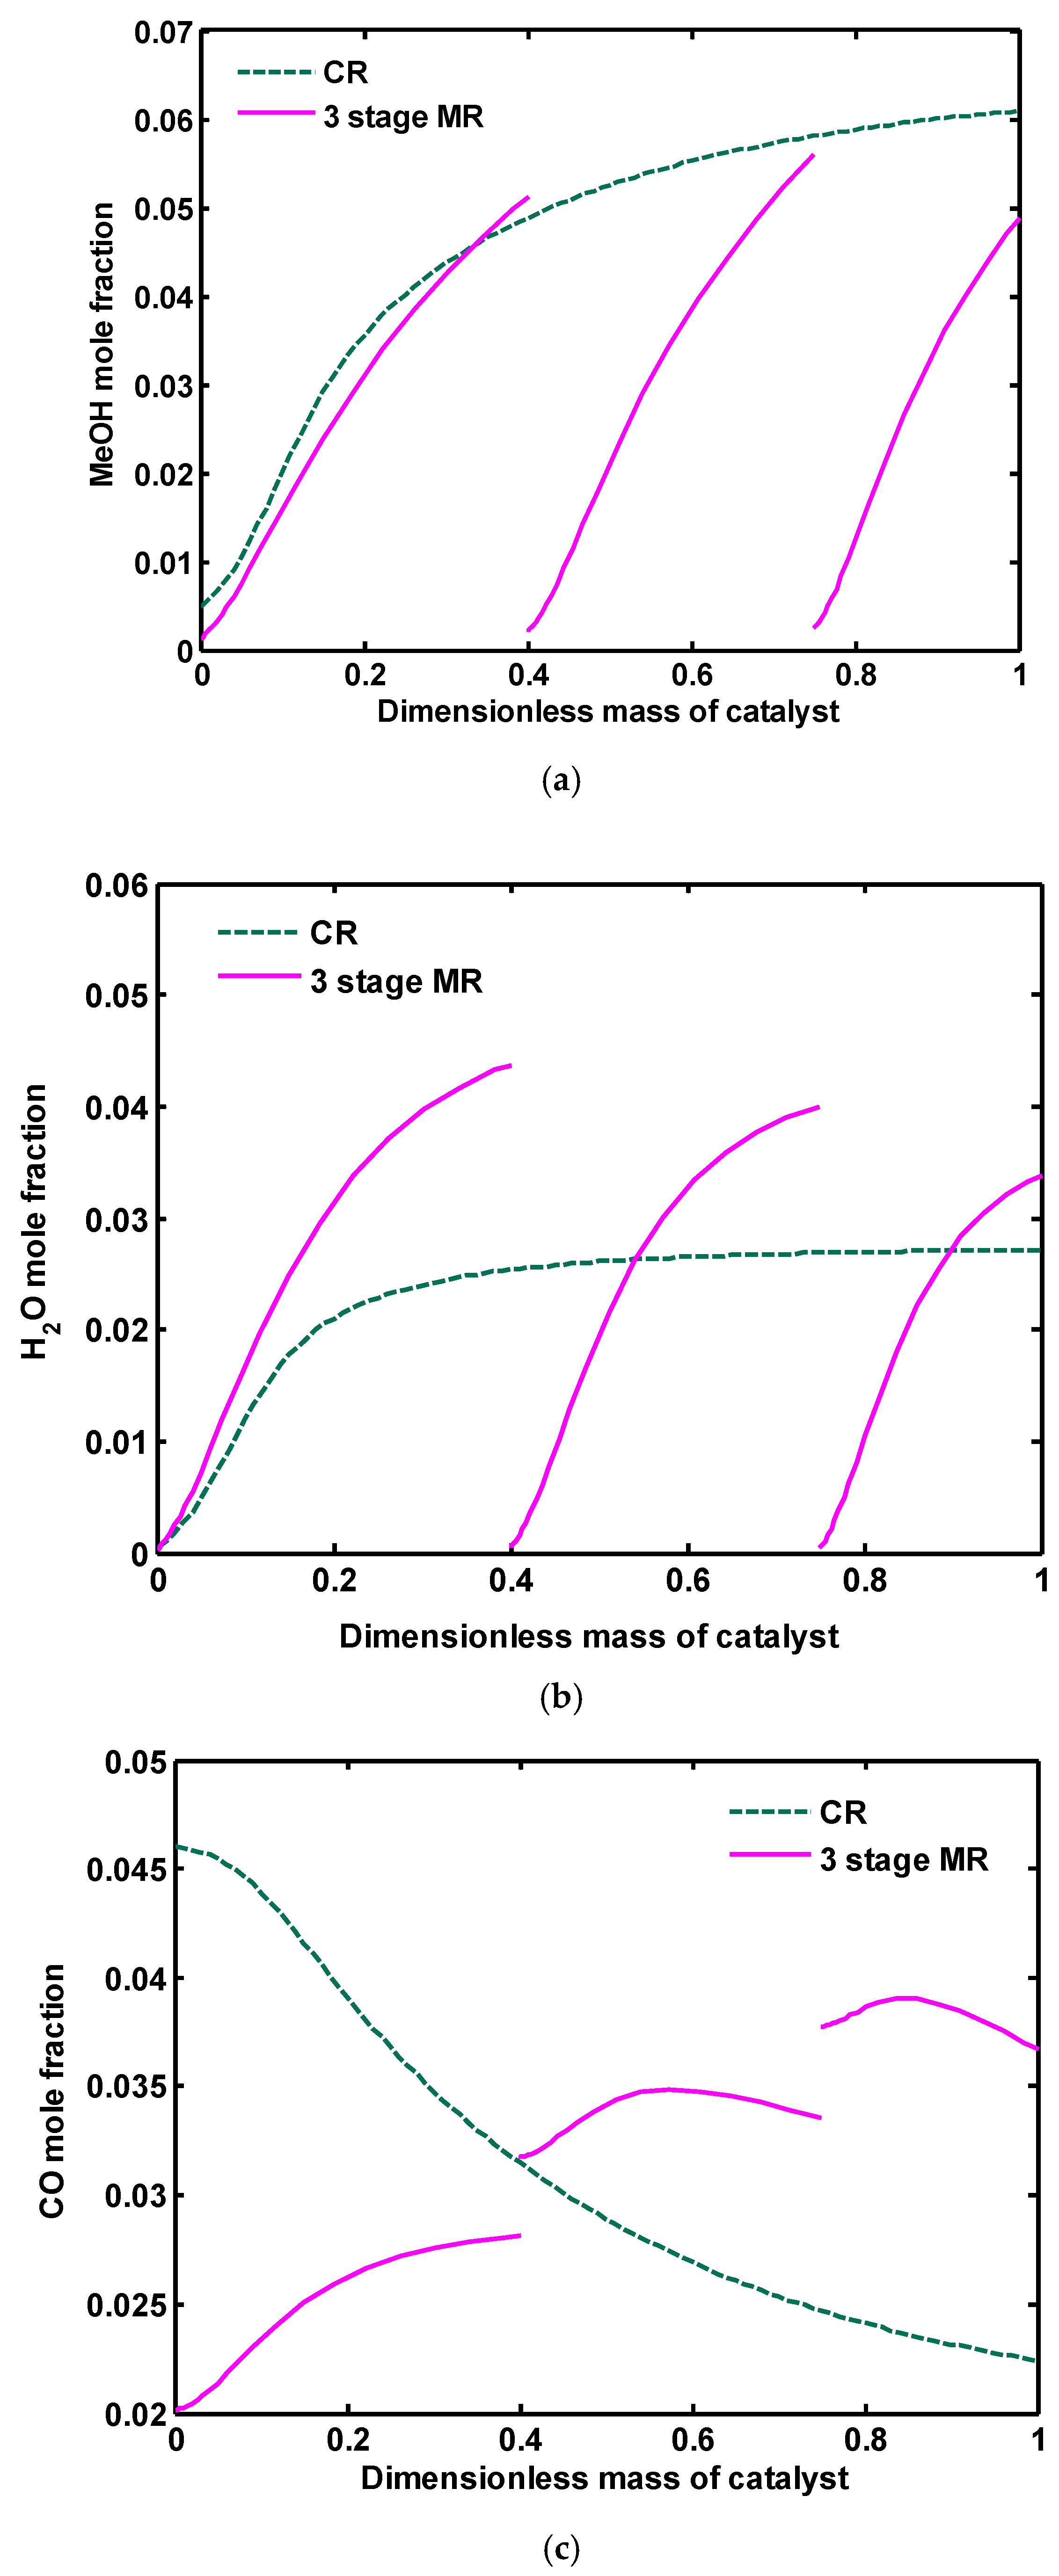
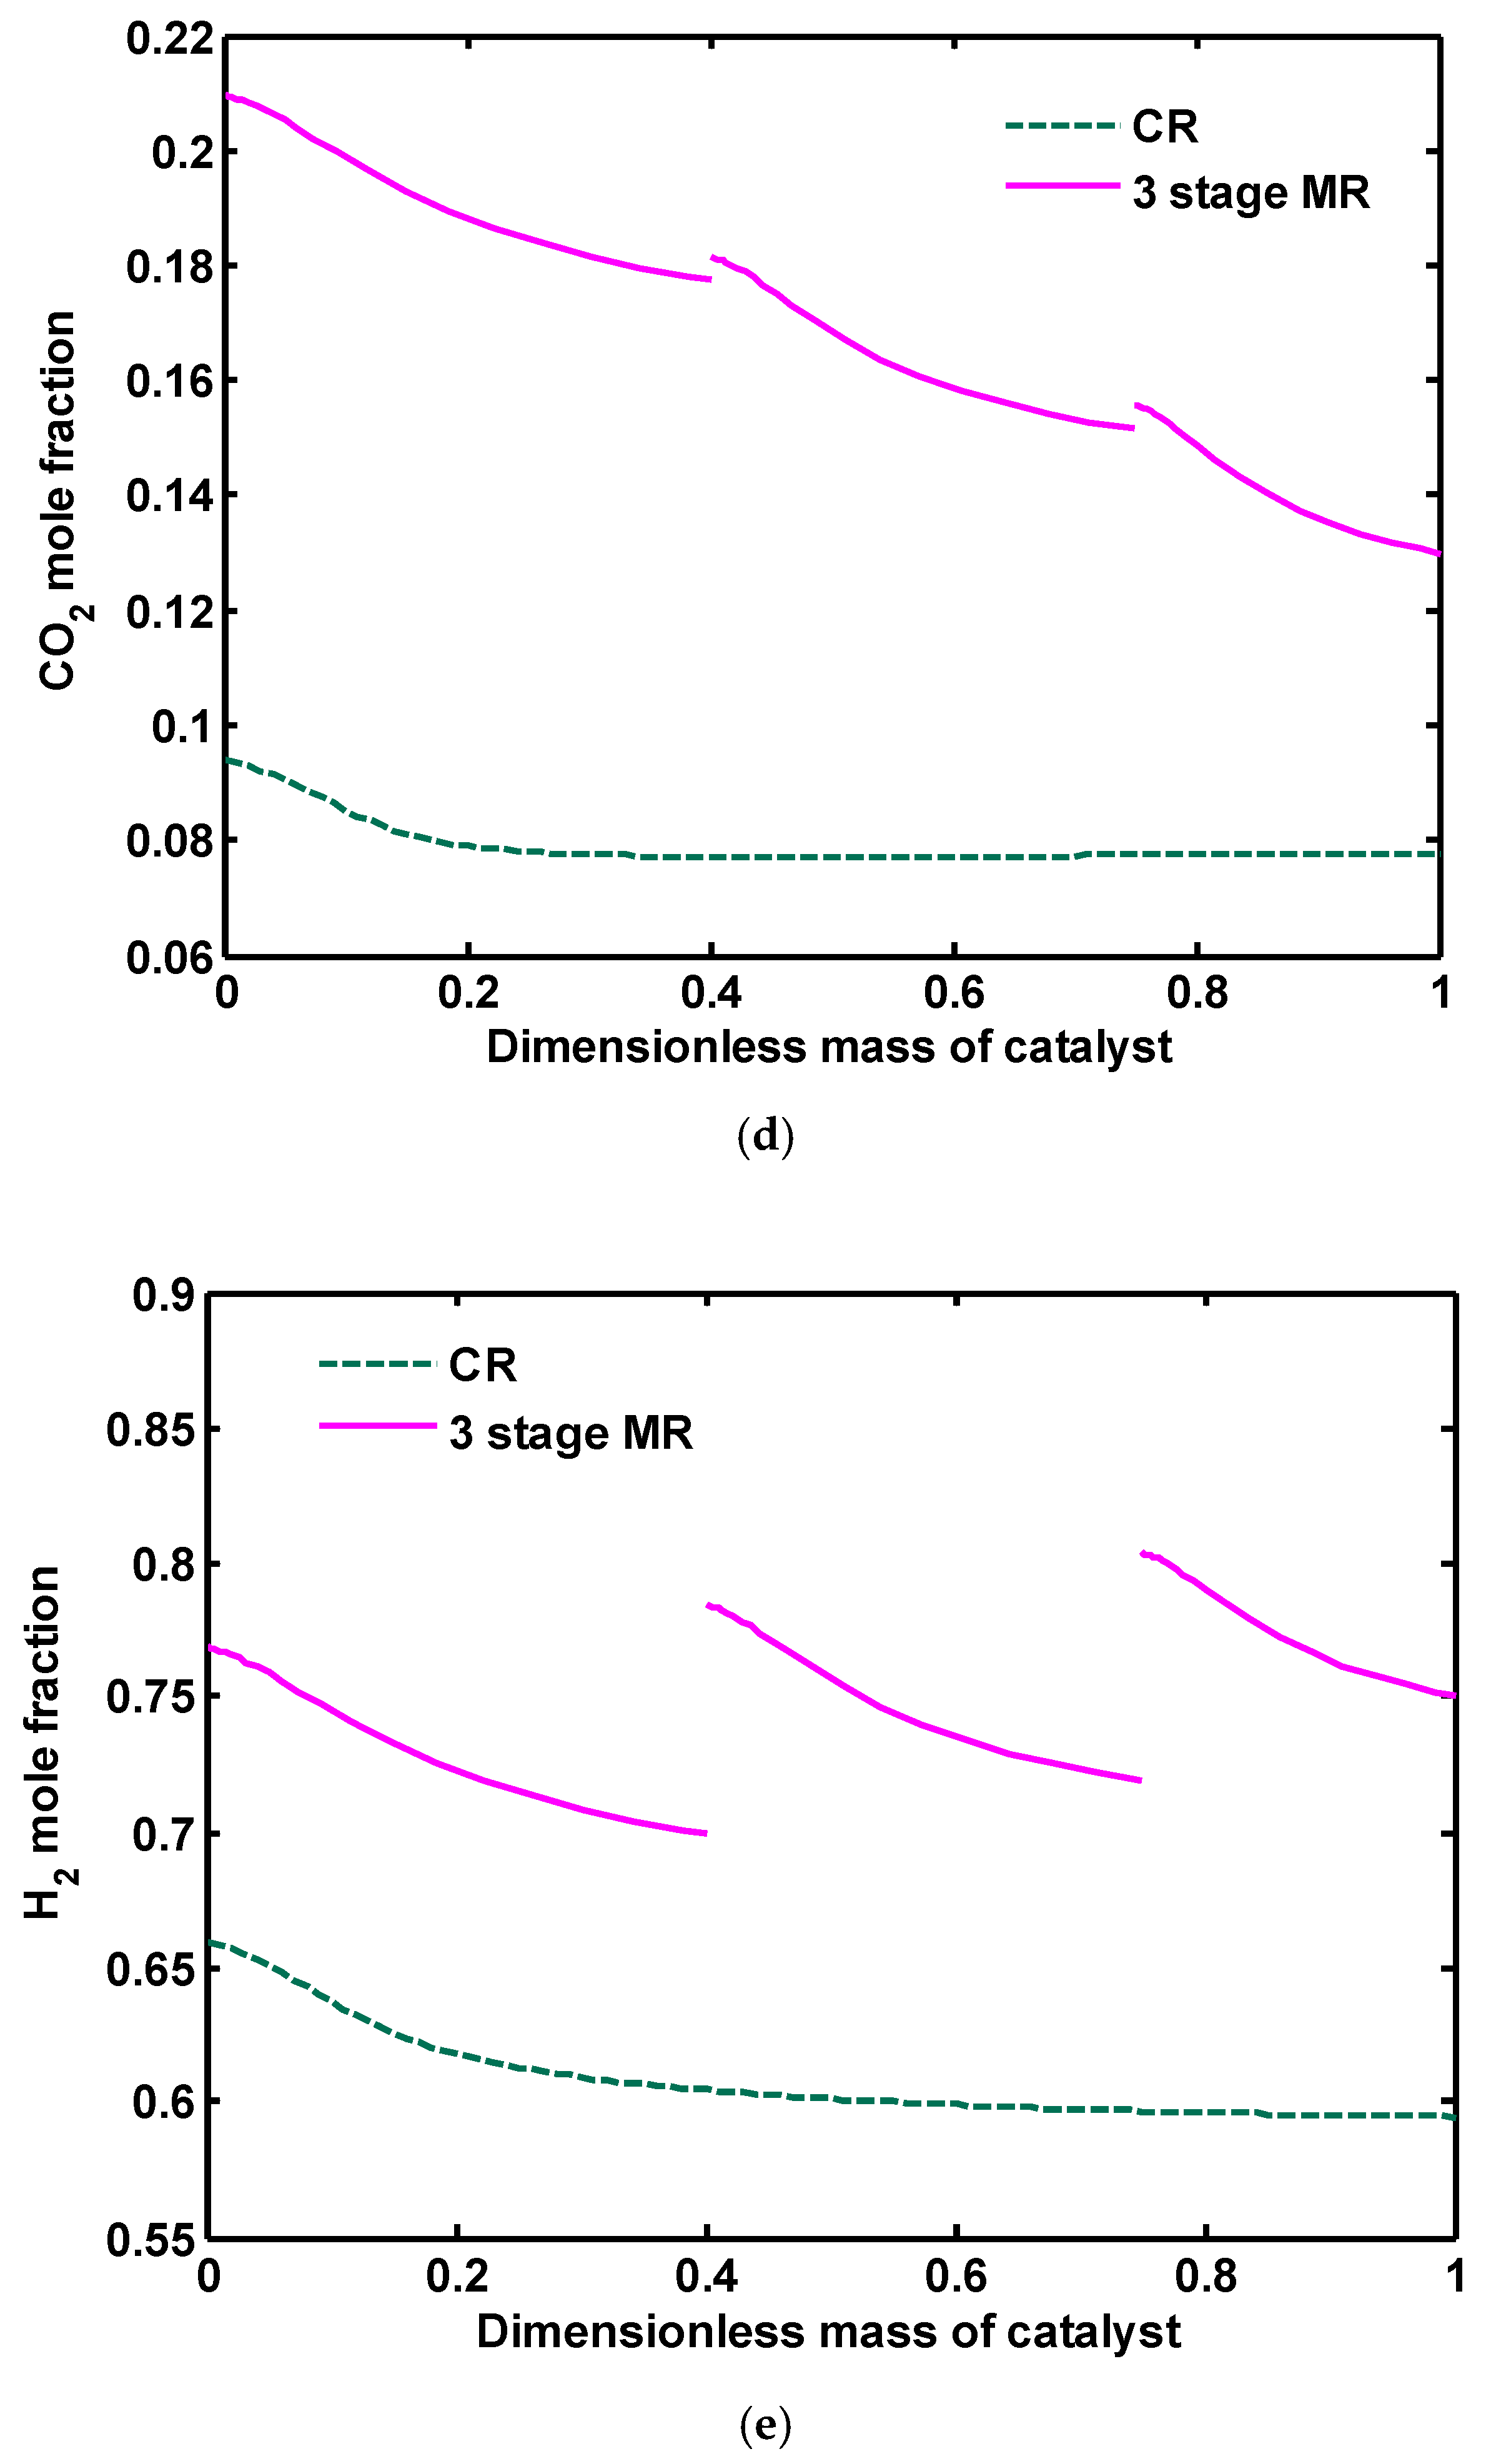
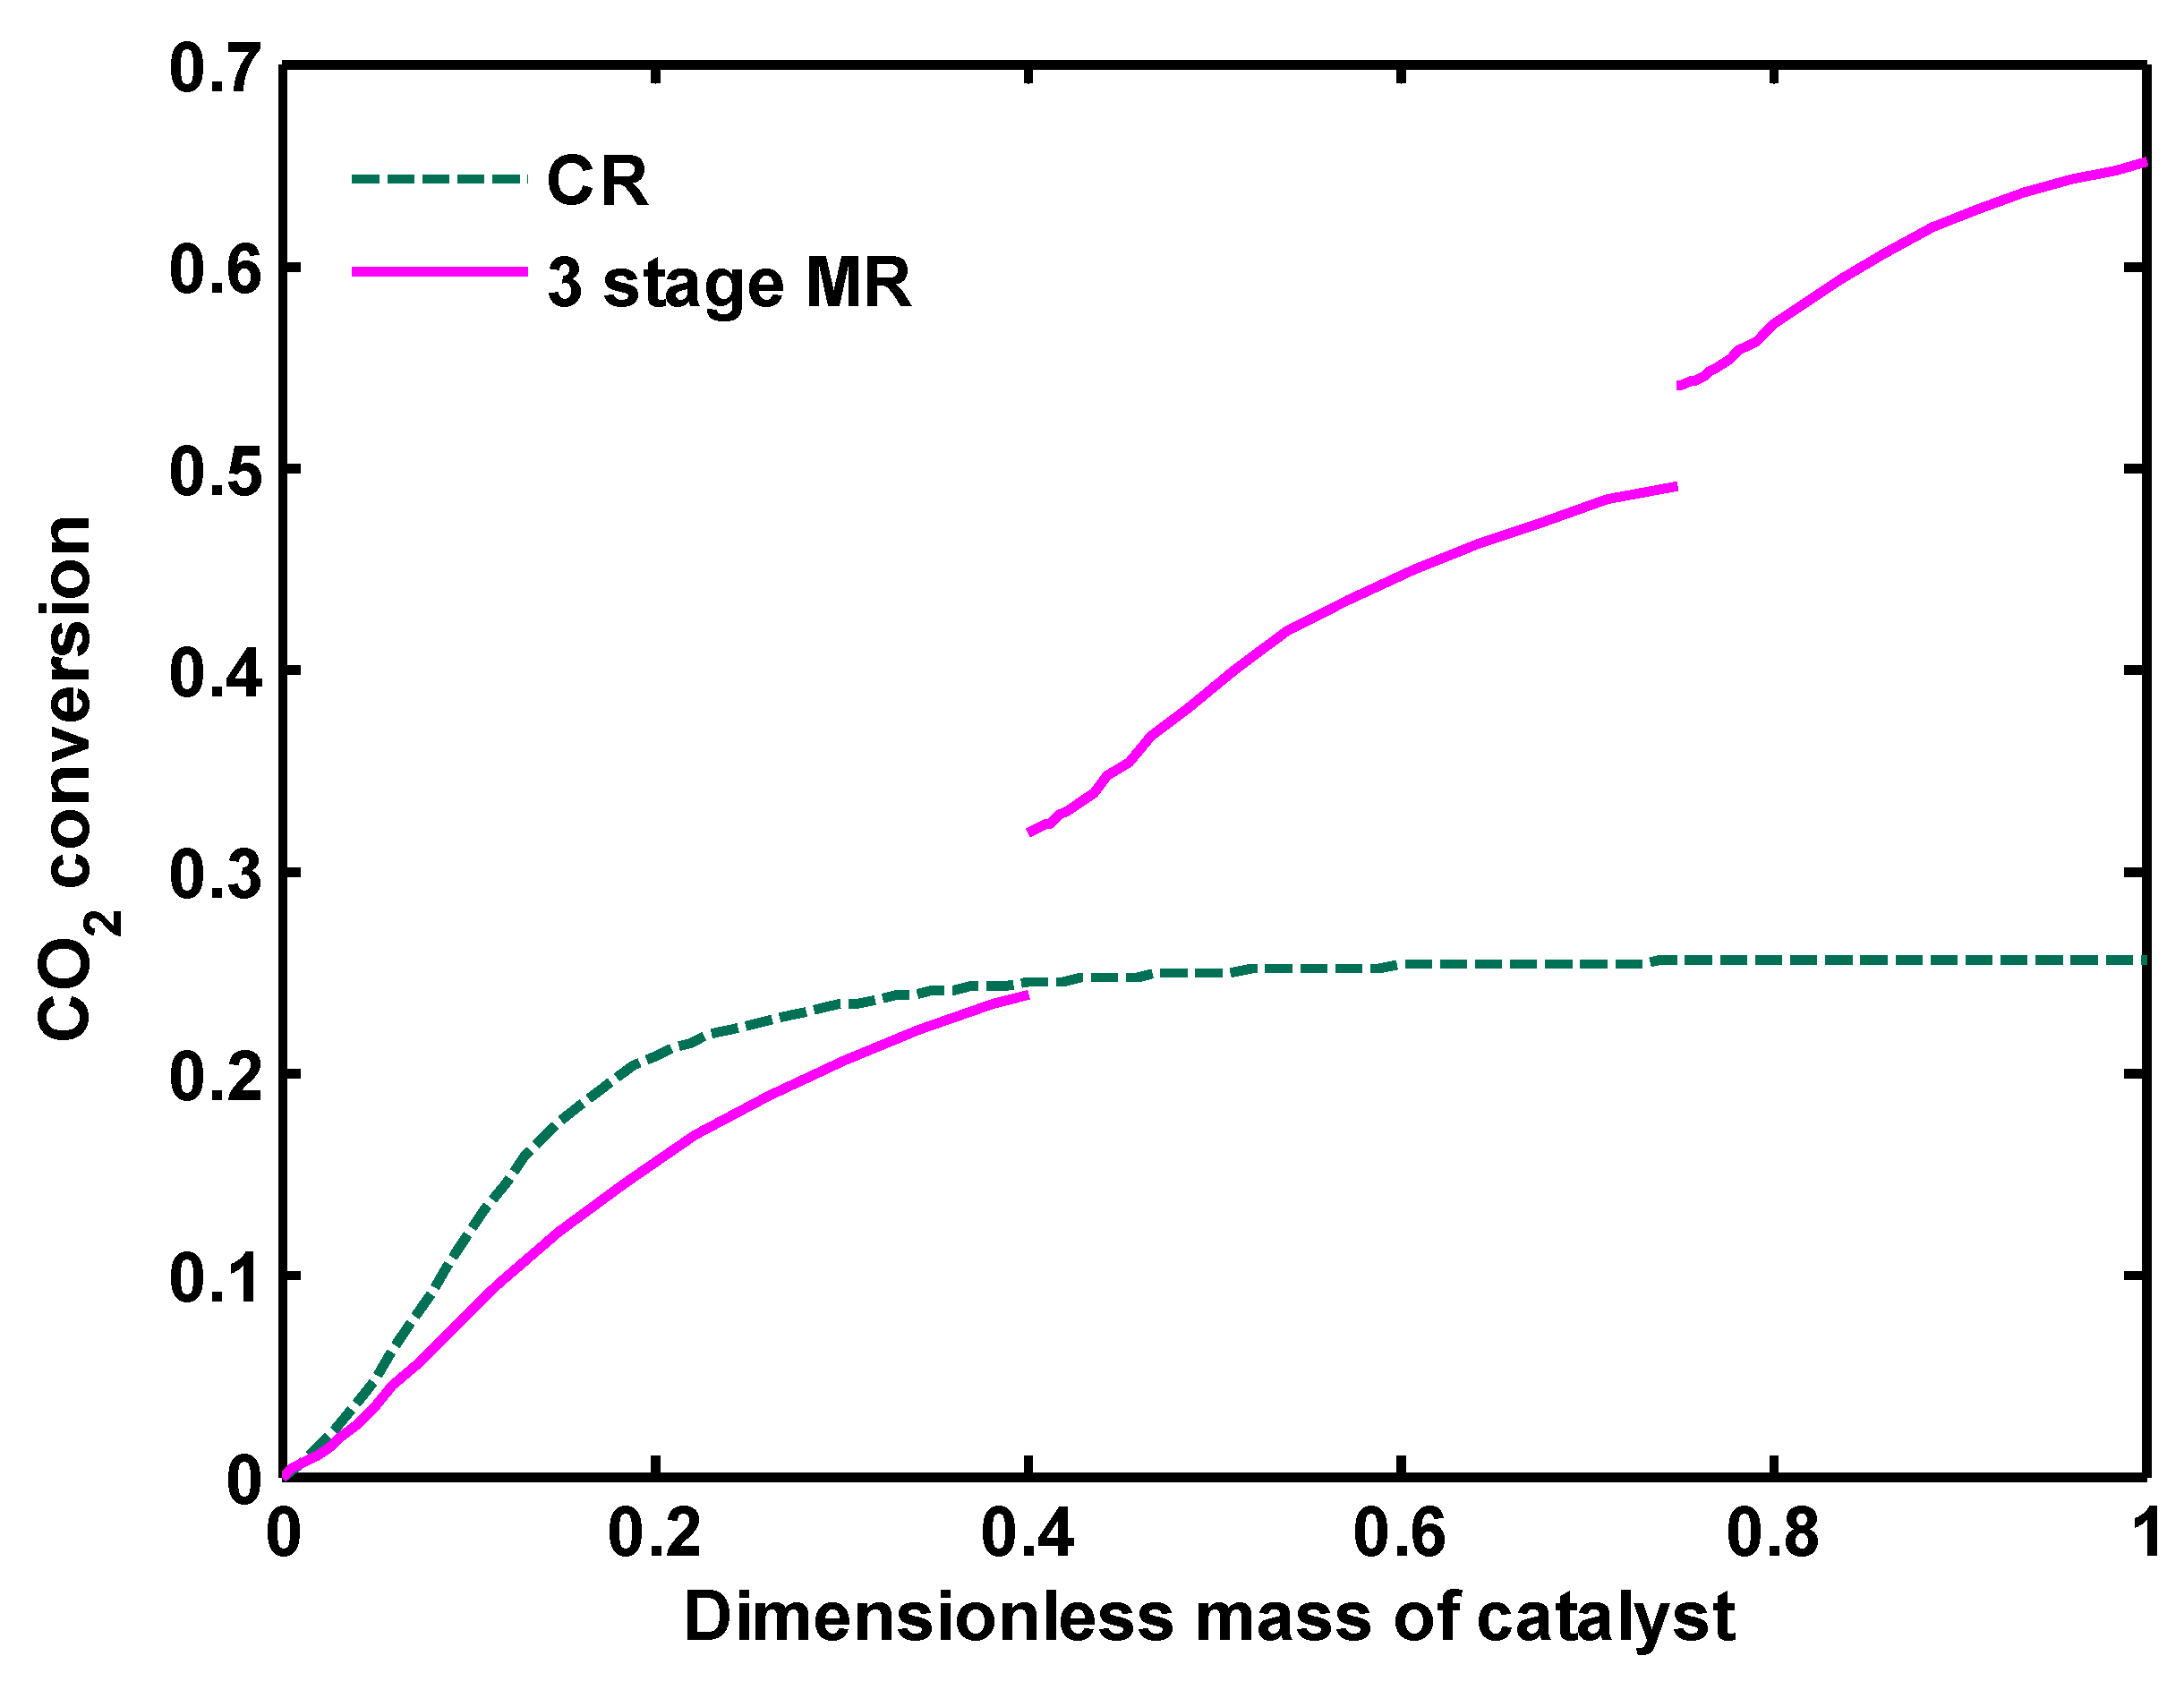
Figure 16a reflects that, although conventional reactor (CR) results in a higher methanol mole fraction compared to each rector in three-stage MR, the total methanol production rate is remarkably higher than CR. It can be deduced from Figure 16b that, in the green methanol synthesis process, H2O production is increased because more CO2 content in the feedstock favors the RWGS reaction, and, therefore, more H2O is produced compared to CR. In CR, WGS reaction (the reverse of Equation (2)) consumes the produced water during the reaction, thus the water mole fraction reaches its equilibrium and then follows a constant trend. As discussed in the previous section, in three-stage MR, the rate of water production is reduced significantly compared to one-stage and three-stage reactors. However, the amount of water is still higher compared to CR but is fairly acceptable. There is a clear difference in the profile of CO mole fraction as seen in Figure 16c. In CR, CO is consumed through CO hydrogenation and WGS reaction, and so follows a decreasing trend along the reactor. In the green methanol production process, there is a lower CO content in the feedstock resulting from the recycle stream, and, as demonstrated, this component is produced as a result of the RWGS reaction. As the amount of CO increases, its generation rate in the reactor reduces. By further increasing of the CO level in the feed, CO is consumed through WGS reaction and its hydrogenation to methanol. Consequently, it shows a decreasing trend in the second and third reactors. CO2 and H2 mole fractions have the same increasing trend. In CR, CO2 and H2 mole fractions are reduced at the beginning of the reactor and then it shows a monotonous profile, indicating the fact that the reactions approach their equilibrium state. The WGS reaction is shifted towards H2 and CO2 production, and CO and CO2 hydrogenation reactions consume H2 and CO2. This competing effect results in an approximately constant trend in CR. CO2 conversion is also compared in both configurations in Figure 17. As depicted, CO2 conversion increases 50% in three-stage MR compared to CR.
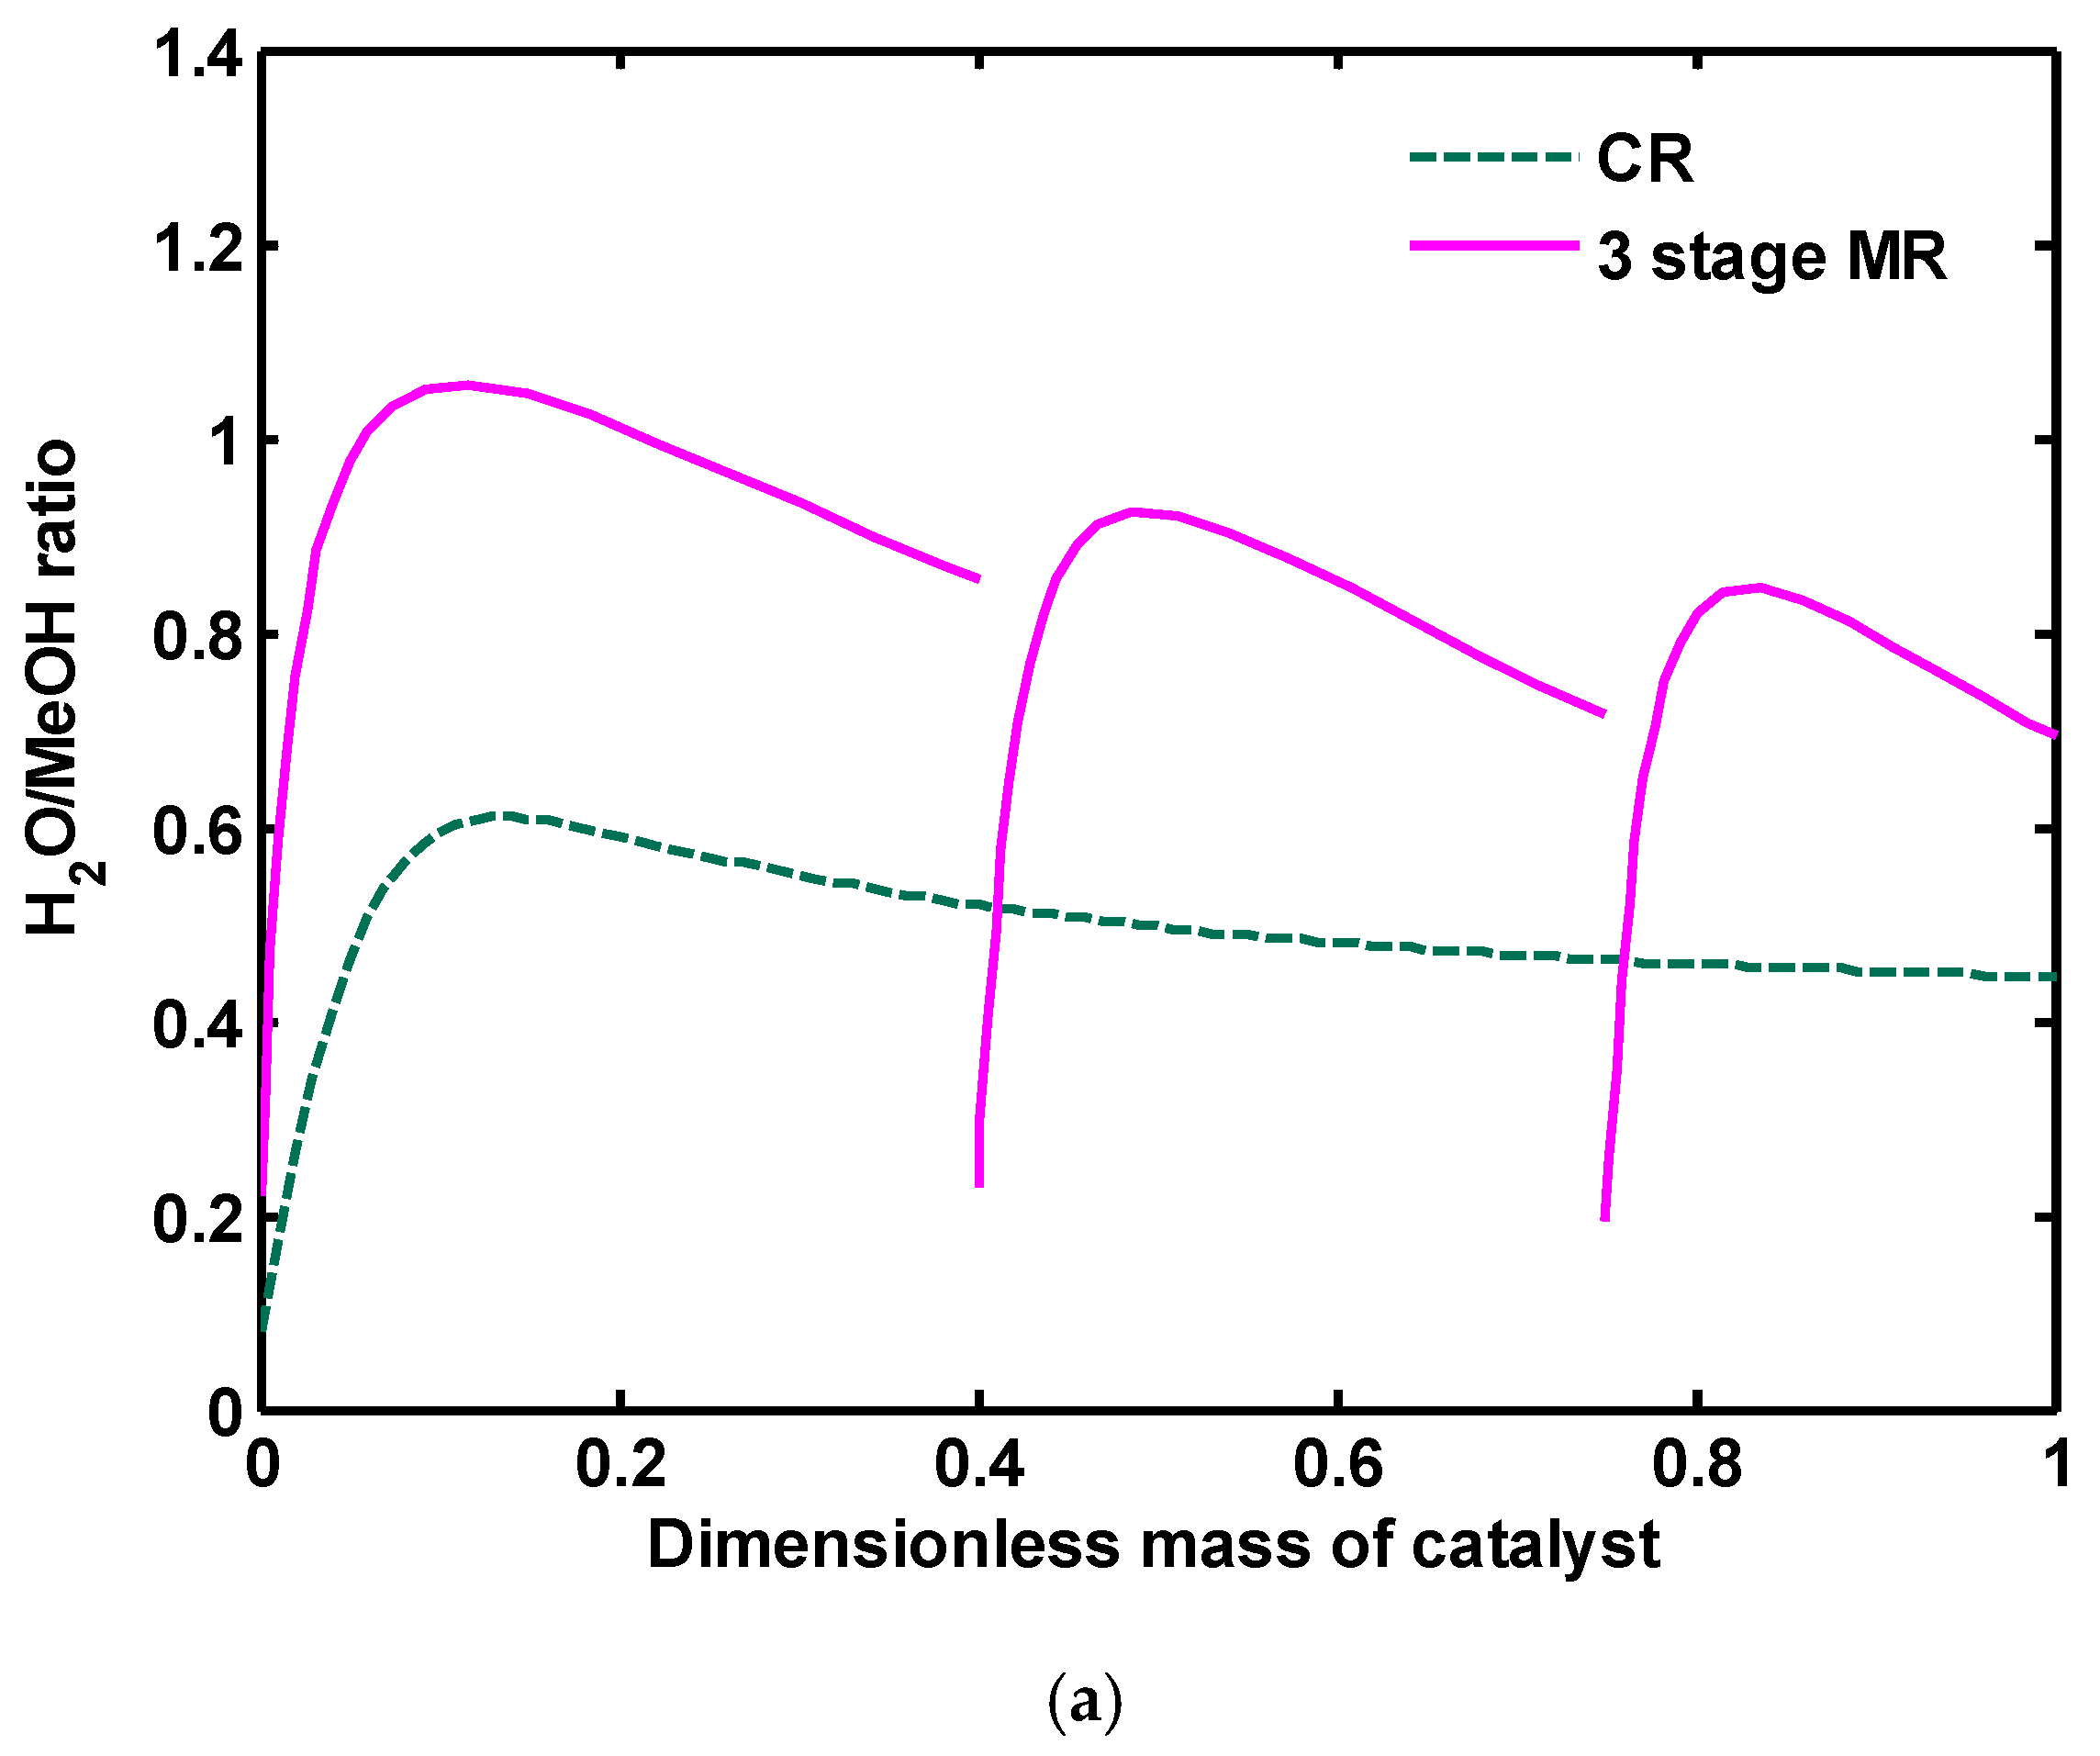
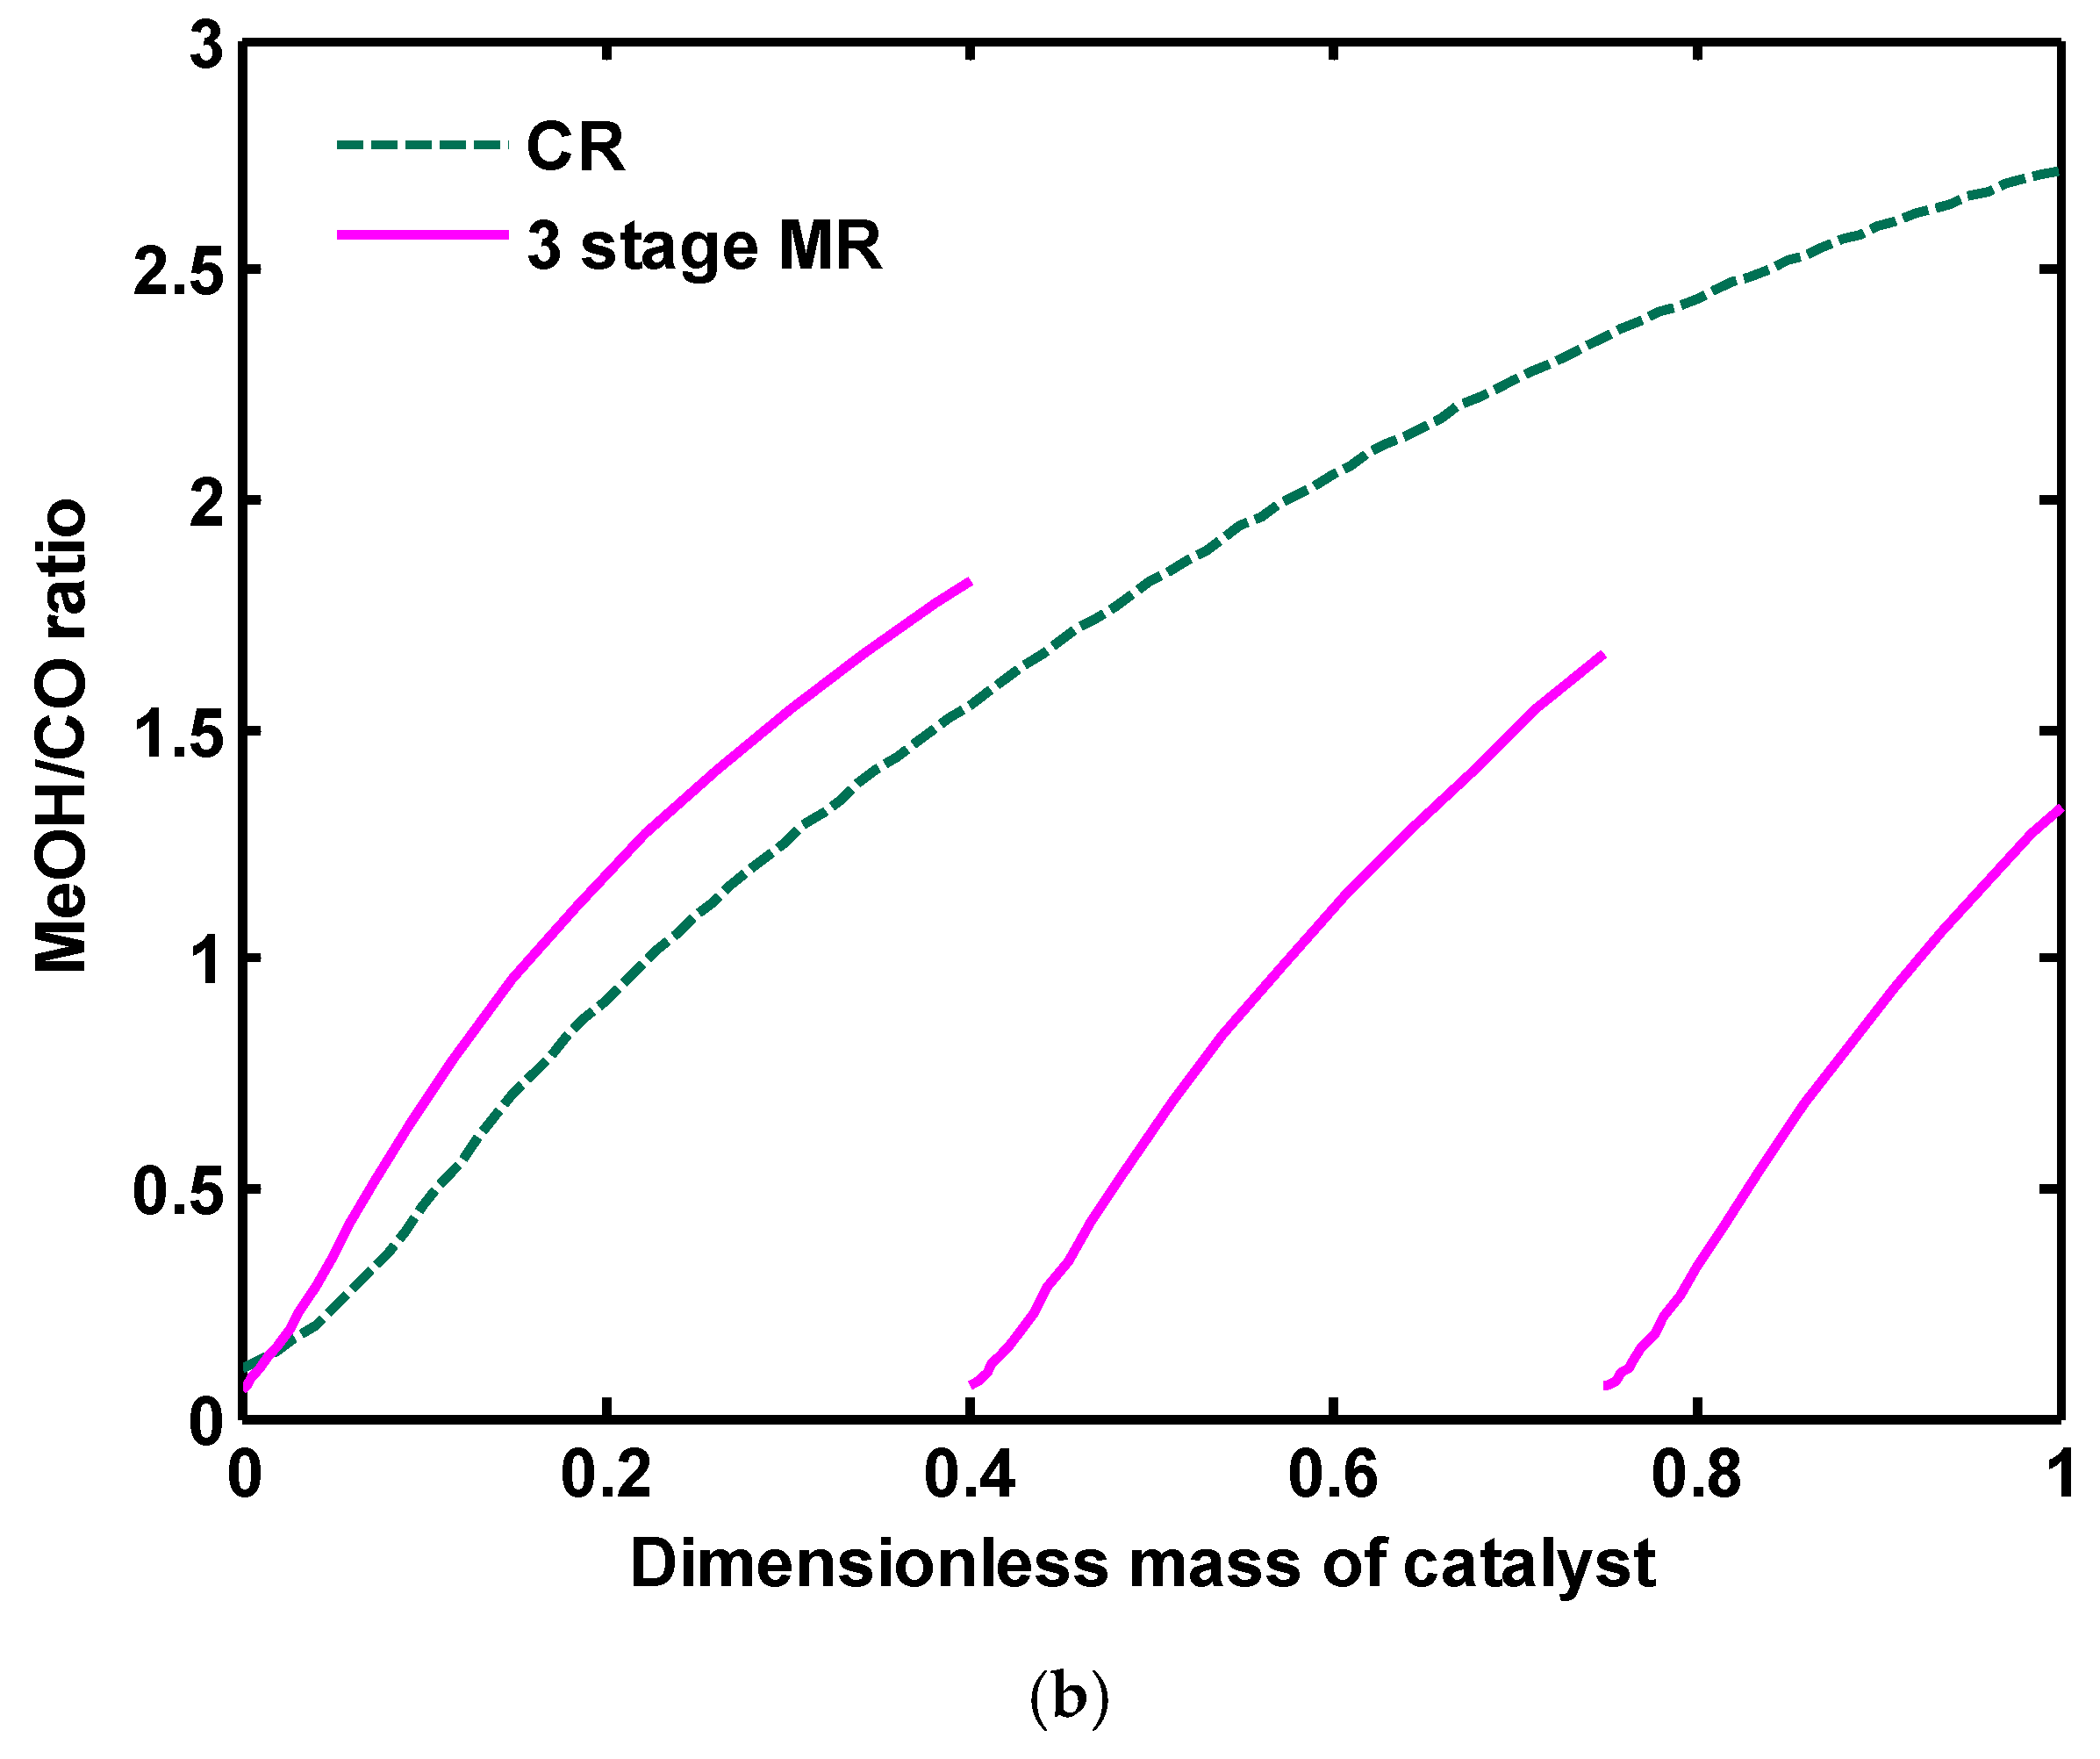
Figure 18a,b show H2O/MeOH ratio and MeOH/CO ratio along CR and three-stage MR, respectively. Water to MeOH ratio in CR configuration increases up to 0.6 and then a little is reduced, after that, becomes constant up to end of the reactor. Because in methanol production by synthesis gas feedstock, reaction (2) is shifted to the left side and some parts of the produced water is consumed through this reaction. Thus, the volume of produced water is much lower than when CO2 is used as the reactor feedstock. MeOH to CO ratio is increased along the reactor for both configurations. In CR, methanol is predominantly produced by reactions (1) and (3), while CO is consumed by reaction (1) and WGS reaction.
Methanol production rates are compared in CR and direct CO2 hydrogenation (one-stage, three-stage and three-stage MR). Methanol is produced 288, 305, 586 and 569 ton/day in CR, one-stage, three-stage and three-stage MR, respectively, as presented in Figure 19. Methanol production rate in CO2 hydrogenation process is higher than the conventional route from syngas. This can be attributed to two reasons: first, in methanol production by CO2 hydrogenation, the feedstock considered in this study only contains CO2 and H2, without any inert gas, while, in the conventional process from synthesis gas, approximately 20% of the feedstock consists of CH4 and N2 as the inert gases. The presence of the inert gases in the feed stream reduces the partial pressure of the reactants and consequently the reaction rates are decreased, resulting in a lower production rate. Second, in the CO2 hydrogenation process considered here, the unreacted gases are recycled to the reactor to provide a higher reactor yield. It is noteworthy to mention that the CO content in the recycle stream compensates a portion of the absence effects of this component in the initial feedstock. In a three-stage reactor configuration, the methanol production rate increases 281 ton/day (92% increasing) compared to a one-stage reactor. To reduce the water content in the reactor, three-stage MR was suggested, although methanol production rate in this configuration is a bit less than three-stage reactors, the produced water as the cause of catalyst poisoning is notably reduced. The results show that the proposed process is feasible and beneficial for CO2 hydrogenation to produce green methanol and can be competitive with a traditional methanol synthesis process.
7. Conclusions
Because of low conversion of CO2 over the commercial CuO/ZnO/Al2O3 catalyst, three-stage reactors connected in series were proposed for green methanol production. The conventional catalyst volume was divided into three sections to load the reactors. The results show that, in this configuration, conversion of CO2 and methanol production rate increase about 50% and 103% compared to one-stage reactor, respectively. Since high amounts of water as the catalyst poisoning are also produced in a CO2 hydrogenation process, H-SOD membranes were assisted in all three reactors of three-stage configuration. By applying water perm-selective membrane, the concentration of water as the undesirable product is reduced considerably in all three reactors. In comparison with the conventional methanol synthesis route from coal and natural gas, the methanol production rate increases 281 ton/day in three-stage membrane reactors. Although the work presented is still theoretical in nature and does not provide an economic assessment, it shows some potential for application and the results provide a good starting point for future research.
Author Contributions
F. S. and M. R. R. conceived and designed the process; F. S. performed the model; M. R. R. and A. S. participated in the analysis and interpretation of the results; F. S. wrote the paper.
Conflicts of Interest
The authors declare no conflict of interest.
Nomenclatures
| Ac | cross-section area of reactor (m2) |
| Ap | perimeter of reactor (m) |
| CP | specific heat capacity (kJ kmol−1 K−1) |
| dp | catalyst particle diameter (m) |
| Ei | activation energy for ith reaction (kJ kmol−1) |
| Fi | the component’s molar flow (mol s−1) |
| FT | total molar flow (mol s−1) |
| fj | fugacity of jth component (Pa) |
| water permeation rate in the membrane | |
| h | heat transfer coefficient (W m−2 K−1) |
| ki | rate constants for the ith reaction |
| Ki | adsorption equilibrium constant |
| Kpi | equilibrium constants |
| P | total pressure (Pa) |
| Pj | partial pressure of jth component (Pa) |
| Q | volumetric flow rate (m3 s−1) |
| maximum H2O permeation of the membrane (mol s−1 m−2 Pa−1) | |
| R | gas constant (kJ kmol−1 K−1) |
| ri | rate of reaction for ith reaction (mol kgcat−1s−1) |
| T | temperature of gas phase (K) |
| Tc | cooling water temperature (K) |
| U | overall heat transfer coefficient (W m−2 K) |
| u | gas velocity (m/s) |
| Vfrac | vapor fraction |
| xj | mol fraction of jth component in liquid phase |
| yj | mol fraction of jth component in vapor phase |
| z | reactor length |
| Z | compressibility factor |
| Greek letter | |
| stoichiometric coefficient of component i in reaction j | |
| viscosity (Pa s) | |
| fugacity coefficient | |
| sphericity | |
| bed void fraction | |
| reactor bulk density (kg m−3) | |
| density of gas phase (kg m−3) | |
| heat of reaction (kJ kmol−1) | |
| Superscripts and subscripts | |
| i | numerator for reaction |
| j | numerator for component |
| L | liquid phase |
| perm | permeation side |
| V | vapor phase |
| 0 | reactor inlet |
| Abbreviations | |
| CR | conventional methanol reactor |
| H-SOD | hydroxy sodalite |
| MeOH | methanol |
| MR | membrane reactors |
| RWGSR | reverse water gas shift reaction |
| SN | stoichiometric number |
| WGSR | water gas shift reaction |
References
- Soltanieh, M.; Azar, K.M.; Saber, M. Development of a zero emission integrated system for co-production of electricity and methanol through renewable hydrogen and CO2 capture. Int. J. Greenh. Gas Control 2012, 7, 145–152. [Google Scholar] [CrossRef]
- Luu, M.T.; Milani, D.; Abbas, A. Analysis of CO2 utilization for methanol synthesis integrated with enhanced gas recovery. J. Clean. Prod. 2016, 112, 3540–3554. [Google Scholar] [CrossRef]
- Milani, D.; Khalilpour, R.; Zahedi, G.; Abbas, A. A model-based analysis of CO2 utilization in methanol synthesis plant. J. CO2 Util. 2015, 10, 12–22. [Google Scholar] [CrossRef]
- Zhang, Y.; Zhou, T.; Louis, B.; Yu, F.; Dan, J.; Wang, Q. Environmental benign synthesis of lithium silicates and Mg-Al layered double hydroxide from vermiculite mineral for CO2 capture. Catalysts 2017, 7, 105. [Google Scholar] [CrossRef]
- Rahimpour, M.; Rahmani, F.; Bayat, M. Contribution to emission reduction of CO2 by a fluidized-bed membrane dual-type reactor in methanol synthesis process. Chem. Eng. Process. Process Intensif. 2010, 49, 589–598. [Google Scholar] [CrossRef]
- Rahimpour, M.; Alizadehhesari, K. Enhancement of carbon dioxide removal in a hydrogen-permselective methanol synthesis reactor. Int. J. Hydrogen Energy 2009, 34, 1349–1362. [Google Scholar] [CrossRef]
- Saeidi, S.; Amin, N.A.S.; Rahimpour, M.R. Hydrogenation of CO2 to value-added products—A review and potential future developments. J. CO2 Util. 2014, 5, 66–81. [Google Scholar] [CrossRef]
- Matzen, M.; Demirel, Y. Methanol and dimethyl ether from renewable hydrogen and carbon dioxide: Alternative fuels production and life-cycle assessment. J. Clean. Prod. 2016, 139, 1068–1077. [Google Scholar] [CrossRef]
- Zhang, C.; Jun, K.-W.; Kwak, G.; Lee, Y.-J.; Park, H.-G. Efficient utilization of carbon dioxide in a gas-to-methanol process composed of CO2/steam–mixed reforming and methanol synthesis. J. CO2 Util. 2016, 16, 1–7. [Google Scholar] [CrossRef]
- Liu, X.; Song, Y.; Geng, W.; Li, H.; Xiao, L.; Wu, W. Cu-Mo2C/MCM-41: An efficient catalyst for the selective synthesis of methanol from CO2. Catalysts 2016, 6, 75. [Google Scholar] [CrossRef]
- Styring, P.; Jansen, D.; De Coninck, H.; Reith, H.; Armstrong, K. Carbon Capture and Utilisation in the Green Economy; The University of Sheffield: Sheffield, UK, 2011. [Google Scholar]
- Meylan, F.D.; Moreau, V.; Erkman, S. CO2 utilization in the perspective of industrial ecology, an overview. J. CO2 Util. 2015, 12, 101–108. [Google Scholar] [CrossRef]
- Tremel, A.; Wasserscheid, P.; Baldauf, M.; Hammer, T. Techno-economic analysis for the synthesis of liquid and gaseous fuels based on hydrogen production via electrolysis. Int. J. Hydrogen Energy 2015, 40, 11457–11464. [Google Scholar] [CrossRef]
- Almahdi, M.; Dincer, I.; Rosen, M. Analysis and assessment of methanol production by integration of carbon capture and photocatalytic hydrogen production. Int. J. Greenh. Gas Control 2016, 51, 56–70. [Google Scholar] [CrossRef]
- Xu, X.; Shuai, K.; Xu, B. Review on copper and palladium based catalysts for methanol steam reforming to produce hydrogen. Catalysts 2017, 7, 183. [Google Scholar] [CrossRef]
- Park, N.; Park, M.-J.; Ha, K.-S.; Lee, Y.-J.; Jun, K.-W. Modeling and analysis of a methanol synthesis process using a mixed reforming reactor: Perspective on methanol production and CO2 utilization. Fuel 2014, 129, 163–172. [Google Scholar] [CrossRef]
- Chen, Z.; Yao, M.; Zheng, Z.; Zhang, Q. Experimental and numerical study of methanol/dimethyl ether dual-fuel compound combustion. Energy Fuels 2009, 23, 2719–2730. [Google Scholar] [CrossRef]
- Samimi, F.; Kabiri, S.; Mirvakili, A.; Rahimpour, M. The concept of integrated thermally double coupled reactor for simultaneous production of methanol, hydrogen and gasoline via differential evolution method. J. Nat. Gas Sci. Eng. 2013, 14, 144–157. [Google Scholar] [CrossRef]
- Samimi, F.; Kabiri, S.; Rahimpour, M.R. The optimal operating conditions of a thermally double coupled, dual membrane reactor for simultaneous methanol synthesis, methanol dehydration and methyl cyclohexane dehydrogenation. J. Nat. Gas Sci. Eng. 2014, 19, 175–189. [Google Scholar] [CrossRef]
- Rahimpour, M.; Mostafazadeh, A.K.; Barmaki, M. Application of hydrogen-permselective pd-based membrane in an industrial single-type methanol reactor in the presence of catalyst deactivation. Fuel Process. Technol. 2008, 89, 1396–1408. [Google Scholar] [CrossRef]
- Van-Dal, É.S.; Bouallou, C. Design and simulation of a methanol production plant from CO2 hydrogenation. J. Clean. Prod. 2013, 57, 38–45. [Google Scholar] [CrossRef]
- Iyer, S.S.; Renganathan, T.; Pushpavanam, S.; Kumar, M.V.; Kaisare, N. Generalized thermodynamic analysis of methanol synthesis: Effect of feed composition. J. CO2 Util. 2015, 10, 95–104. [Google Scholar] [CrossRef]
- Rahimpour, M.; Bayat, M.; Rahmani, F. Dynamic simulation of a cascade fluidized-bed membrane reactor in the presence of long-term catalyst deactivation for methanol synthesis. Chem. Eng. Sci. 2010, 65, 4239–4249. [Google Scholar] [CrossRef]
- Rahimpour, M.; Bayat, M.; Rahmani, F. Enhancement of methanol production in a novel cascading fluidized-bed hydrogen permselective membrane methanol reactor. Chem. Eng. J. 2010, 157, 520–529. [Google Scholar] [CrossRef]
- Demirci, U.B.; Miele, P. Overview of the relative greenness of the main hydrogen production processes. J. Clean. Prod. 2013, 52, 1–10. [Google Scholar] [CrossRef]
- Bičáková, O.; Straka, P. Production of hydrogen from renewable resources and its effectiveness. Int. J. Hydrogen Energy 2012, 37, 11563–11578. [Google Scholar] [CrossRef]
- Pérez-Fortes, M.; Schöneberger, J.C.; Boulamanti, A.; Tzimas, E. Methanol synthesis using captured CO2 as raw material: Techno-economic and environmental assessment. Appl. Energy 2016, 161, 718–732. [Google Scholar] [CrossRef]
- Hosseini, S.E.; Wahid, M.A. Hydrogen production from renewable and sustainable energy resources: Promising green energy carrier for clean development. Renew. Sustain. Energy Rev. 2016, 57, 850–866. [Google Scholar] [CrossRef]
- Nikolaidis, P.; Poullikkas, A. A comparative overview of hydrogen production processes. Renew. Sustain. Energy Rev. 2017, 67, 597–611. [Google Scholar] [CrossRef]
- Jadhav, S.G.; Vaidya, P.D.; Bhanage, B.M.; Joshi, J.B. Catalytic carbon dioxide hydrogenation to methanol: A review of recent studies. Chem. Eng. Res. Des. 2014, 92, 2557–2567. [Google Scholar] [CrossRef]
- Kiss, A.A.; Pragt, J.; Vos, H.; Bargeman, G.; de Groot, M. Novel efficient process for methanol synthesis by CO2 hydrogenation. Chem. Eng. J. 2016, 284, 260–269. [Google Scholar] [CrossRef]
- Anicic, B.; Trop, P.; Goricanec, D. Comparison between two methods of methanol production from carbon dioxide. Energy 2014, 77, 279–289. [Google Scholar] [CrossRef]
- Fujita, S.-I.; Kanamori, Y.; Satriyo, A.M.; Takezawa, N. Methanol synthesis from CO2 over Cu/ZnO catalysts prepared from various coprecipitated precursors. Catal. Today 1998, 45, 241–244. [Google Scholar] [CrossRef]
- Arena, F.; Barbera, K.; Italiano, G.; Bonura, G.; Spadaro, L.; Frusteri, F. Synthesis, characterization and activity pattern of Cu–ZnO/ZrO2 catalysts in the hydrogenation of carbon dioxide to methanol. J. Catal. 2007, 249, 185–194. [Google Scholar] [CrossRef]
- Hartadi, Y.; Widmann, D.; Behm, R.J. Methanol synthesis via CO2 hydrogenation over a Au/ZnO catalyst: An isotope labelling study on the role of CO in the reaction process. Phys. Chem. Chem. Phys. 2016, 18, 10781–10791. [Google Scholar] [CrossRef] [PubMed]
- Rodriguez, J.A.; Evans, J.; Feria, L.; Vidal, A.B.; Liu, P.; Nakamura, K.; Illas, F. CO2 hydrogenation on Au/TiC, Cu/TiC, and Ni/TiC catalysts: Production of CO, methanol, and methane. J. Catal. 2013, 307, 162–169. [Google Scholar] [CrossRef]
- Díez-Ramírez, J.; Díaz, J.; Sánchez, P.; Dorado, F. Optimization of the Pd/Cu ratio in Pd-Cu-Zn/SiC catalysts for the CO2 hydrogenation to methanol at atmospheric pressure. J. CO2 Util. 2017, 22, 71–80. [Google Scholar] [CrossRef]
- Tada, S.; Watanabe, F.; Kiyota, K.; Shimoda, N.; Hayashi, R.; Takahashi, M.; Nariyuki, A.; Igarashi, A.; Satokawa, S. Ag addition to CuO-ZrO2 catalysts promotes methanol synthesis via CO2 hydrogenation. J. Catal. 2017, 351, 107–118. [Google Scholar] [CrossRef]
- Pontzen, F.; Liebner, W.; Gronemann, V.; Rothaemel, M.; Ahlers, B. CO2-based methanol and dme–efficient technologies for industrial scale production. Catal. Today 2011, 171, 242–250. [Google Scholar] [CrossRef]
- Meyer, J.J.; Tan, P.; Apfelbacher, A.; Daschner, R.; Hornung, A. Modeling of a methanol synthesis reactor for storage of renewable energy and conversion of CO2–comparison of two kinetic models. Chem. Eng. Technol. 2016, 39, 233–245. [Google Scholar] [CrossRef]
- Wu, J.; Saito, M.; Takeuchi, M.; Watanabe, T. The stability of Cu/ZnO-based catalysts in methanol synthesis from a CO2-rich feed and from a CO-rich feed. Appl. Catal. A Gen. 2001, 218, 235–240. [Google Scholar] [CrossRef]
- Rahimpour, M.R.; Fathikalajahi, J.; Jahanmiri, A. Selective kinetic deactivation model for methanol synthesis from simultaneous reaction of CO2 and co with H2 on a commercial Copper/Zinc oxide catalyst. Can. J. Chem. Eng. 1998, 76, 753–761. [Google Scholar] [CrossRef]
- Inui, T.; Hara, H.; Takeguchi, T.; Kim, J.-B. Structure and function of Cu-based composite catalysts for highly effective synthesis of methanol by hydrogenation of CO2 and CO. Catal. Today 1997, 36, 25–32. [Google Scholar] [CrossRef]
- Ma, Y.; Sun, Q.; Wu, D.; Fan, W.-H.; Zhang, Y.-L.; Deng, J.-F. A practical approach for the preparation of high activity Cu/ZnO/ZrO2 catalyst for methanol synthesis from CO2 hydrogenation. Appl. Catal. A Gen. 1998, 171, 45–55. [Google Scholar] [CrossRef]
- Bercic, G.; Levec, J. Intrinsic and global reaction rate of methanol dehydration over. Gamma.-alumina pellets. Ind. Eng. Chem. Res. 1992, 31, 1035–1040. [Google Scholar] [CrossRef]
- Khajavi, S.; Jansen, J.C.; Kapteijn, F. Application of a sodalite membrane reactor in esterification—Coupling reaction and separation. Catal. Today 2010, 156, 132–139. [Google Scholar] [CrossRef]
- Rohde, M.; Schaub, G.; Khajavi, S.; Jansen, J.; Kapteijn, F. Fischer–tropsch synthesis with in situ H2O removal–directions of membrane development. Microporous Mesoporous Mater. 2008, 115, 123–136. [Google Scholar] [CrossRef]
- David, M.-O.; Nguyen, T.; Neel, J. Pervaporation-esterification coupling. II: Modelling of the influence of different operating parameters. Chem. Eng. Res. Des. 1991, 69, 341–346. [Google Scholar]
- Khajavi, S.; Jansen, J.C.; Kapteijn, F. Application of hydroxy sodalite films as novel water selective membranes. J. Membr. Sci. 2009, 326, 153–160. [Google Scholar] [CrossRef]
- Graaf, G.; Stamhuis, E.; Beenackers, A. Kinetics of low-pressure methanol synthesis. Chem. Eng. Sci. 1988, 43, 3185–3195. [Google Scholar] [CrossRef]
- Hartig, F.; Keil, F.J. Large-scale spherical fixed bed reactors: Modeling and optimization. Ind. Eng. Chem. Res. 1993, 32, 424–437. [Google Scholar] [CrossRef]
- Bennekom, J.G.V.; Winkelman, J.G.; Venderbosch, R.H.; Nieland, S.D.; Heeres, H.J. Modeling and experimental studies on phase and chemical equilibria in high-pressure methanol synthesis. Ind. Eng. Chem. Res. 2012, 51, 12233–12243. [Google Scholar] [CrossRef]
- Løvik, I. Modelling, Estimation and Optimization of the Methanol Synthesis with Catalyst Deactivation; Ph.D. Thesis, Norwegian Universityof Scienceand Technolog, Trondheim, Norway, 2001. [Google Scholar]
- Biegler, L.T.; Grossmann, I.E.; Westerberg, A.W. Systematic Methods for Chemical Process Design; Prentice Hall: Old Tappan, NJ, USA, 1997. [Google Scholar]
- Complex, D.P. Operating Data Sheets of Methanol Plant; Shiraz Petrochemical Complex: Shiraz, Iran, 2000; Volume 2003. [Google Scholar]
- Arena, F.; Mezzatesta, G.; Zafarana, G.; Trunfio, G.; Frusteri, F.; Spadaro, L. Effects of oxide carriers on surface functionality and process performance of the Cu–ZnO system in the synthesis of methanol via CO2 hydrogenation. J. Catal. 2013, 300, 141–151. [Google Scholar] [CrossRef]
- Saito, M.; Fujitani, T.; Takeuchi, M.; Watanabe, T. Development of Copper/Zinc oxide-based multicomponent catalysts for methanol synthesis from carbon dioxide and hydrogen. Appl. Catal. A Gen. 1996, 138, 311–318. [Google Scholar] [CrossRef]
Figure 1.
A schematic diagram of a common process for direct CO2 hydrogenation.

Figure 2.
A schematic diagram of three stage rectors for direct CO2 hydrogenation.
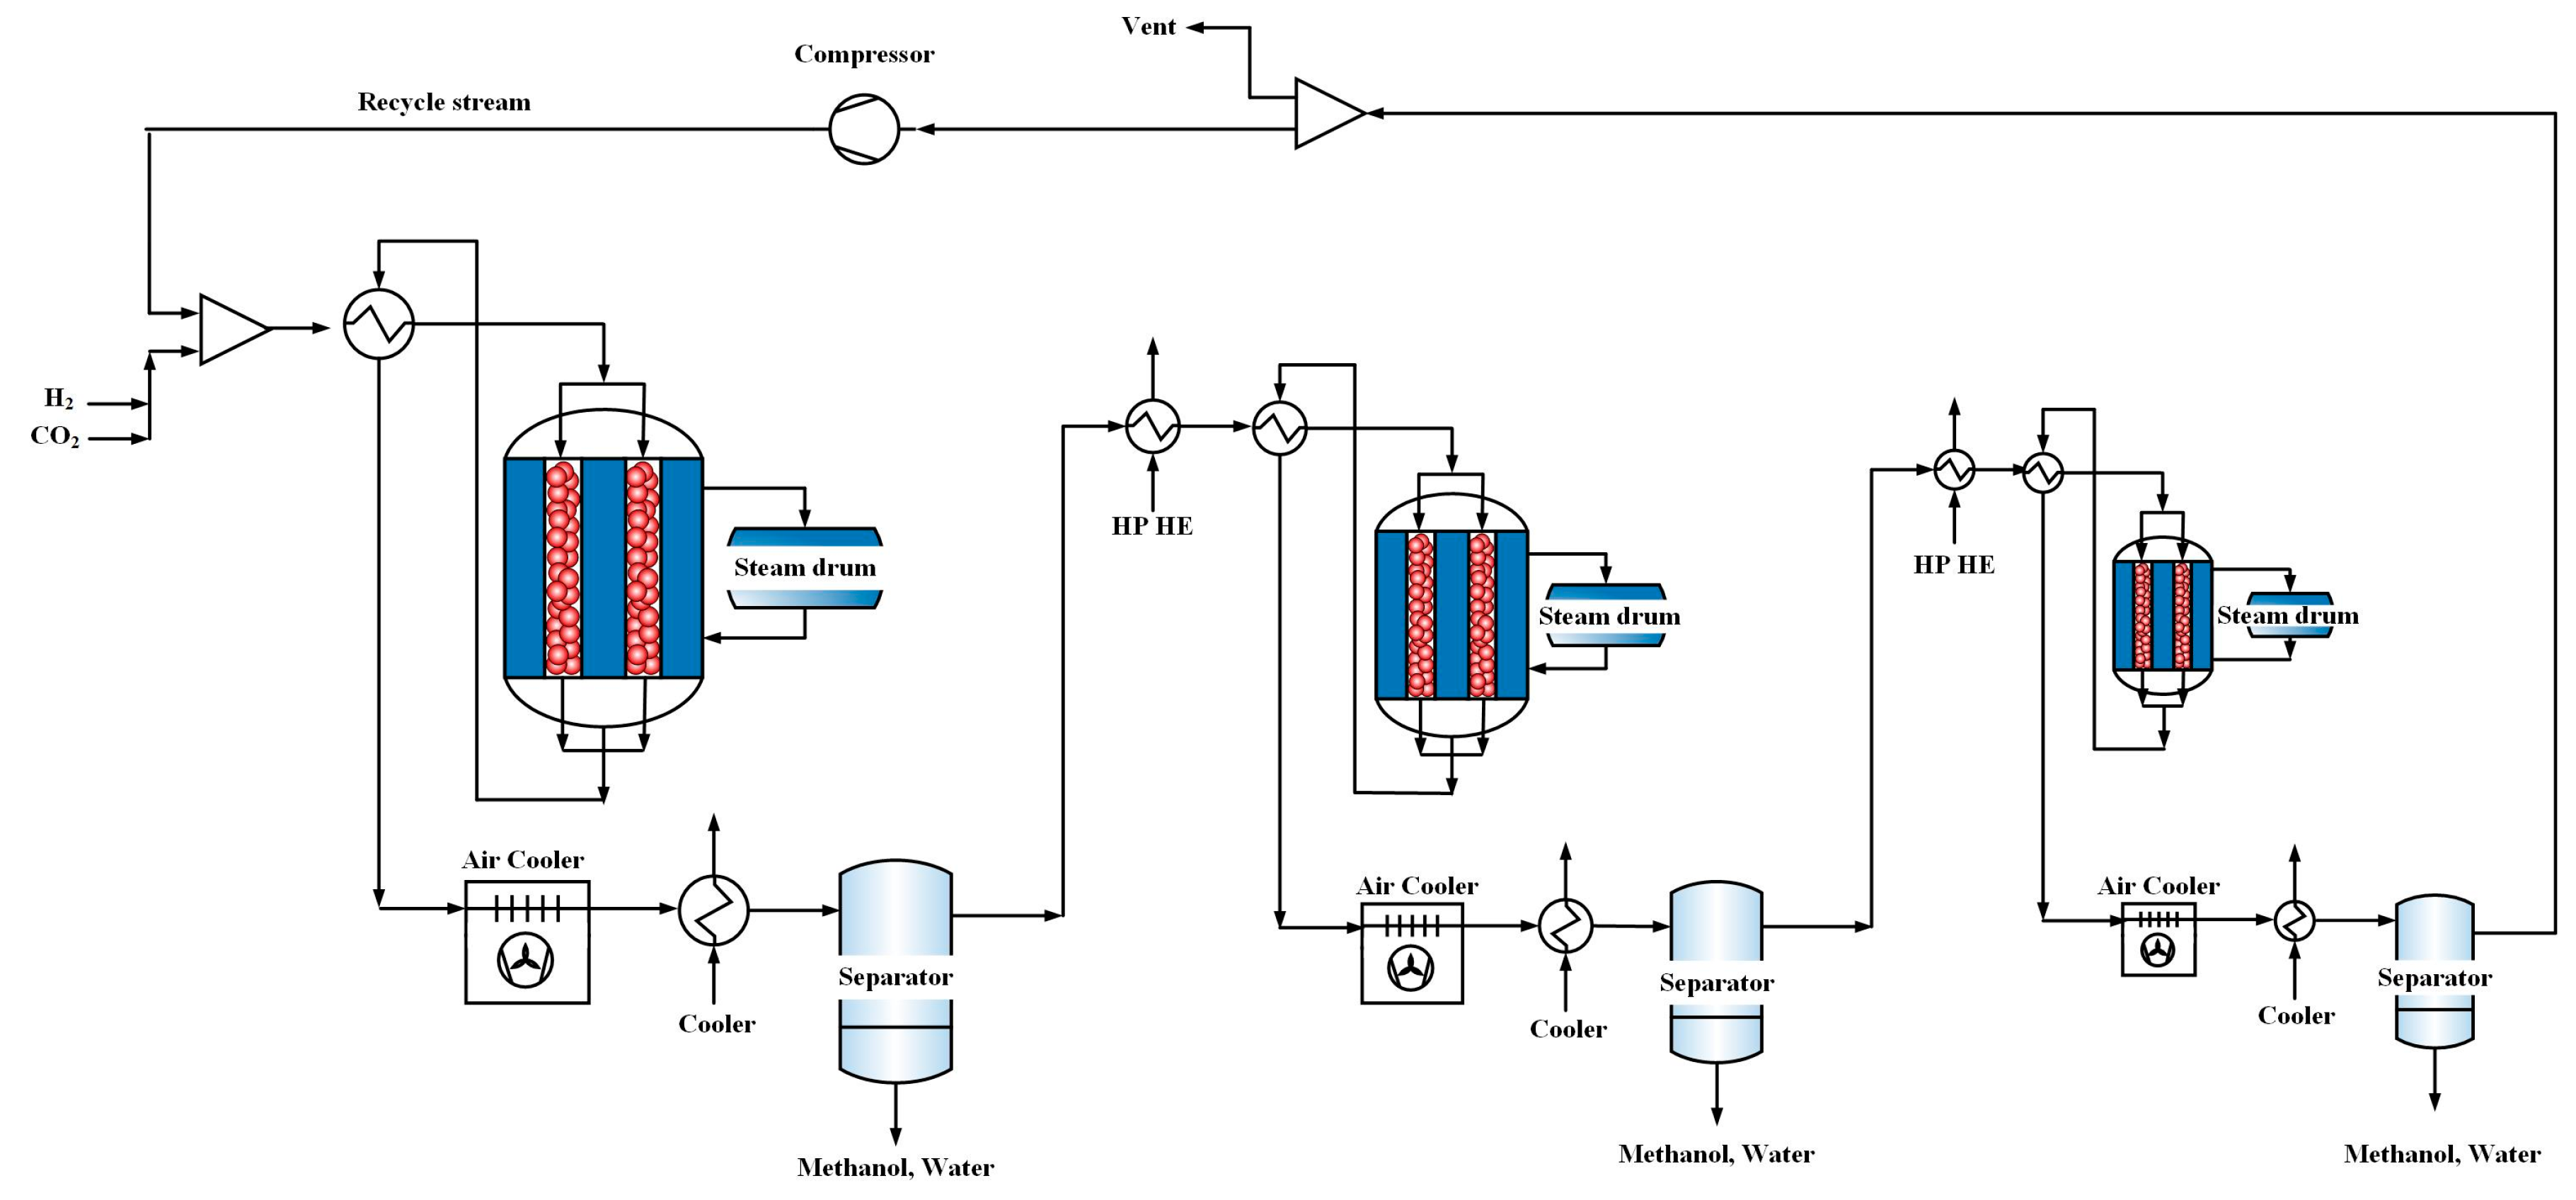
Figure 3.
A differential element in the axial direction of direct CO2 hydrogenation membrane reactors.
Figure 3.
A differential element in the axial direction of direct CO2 hydrogenation membrane reactors.
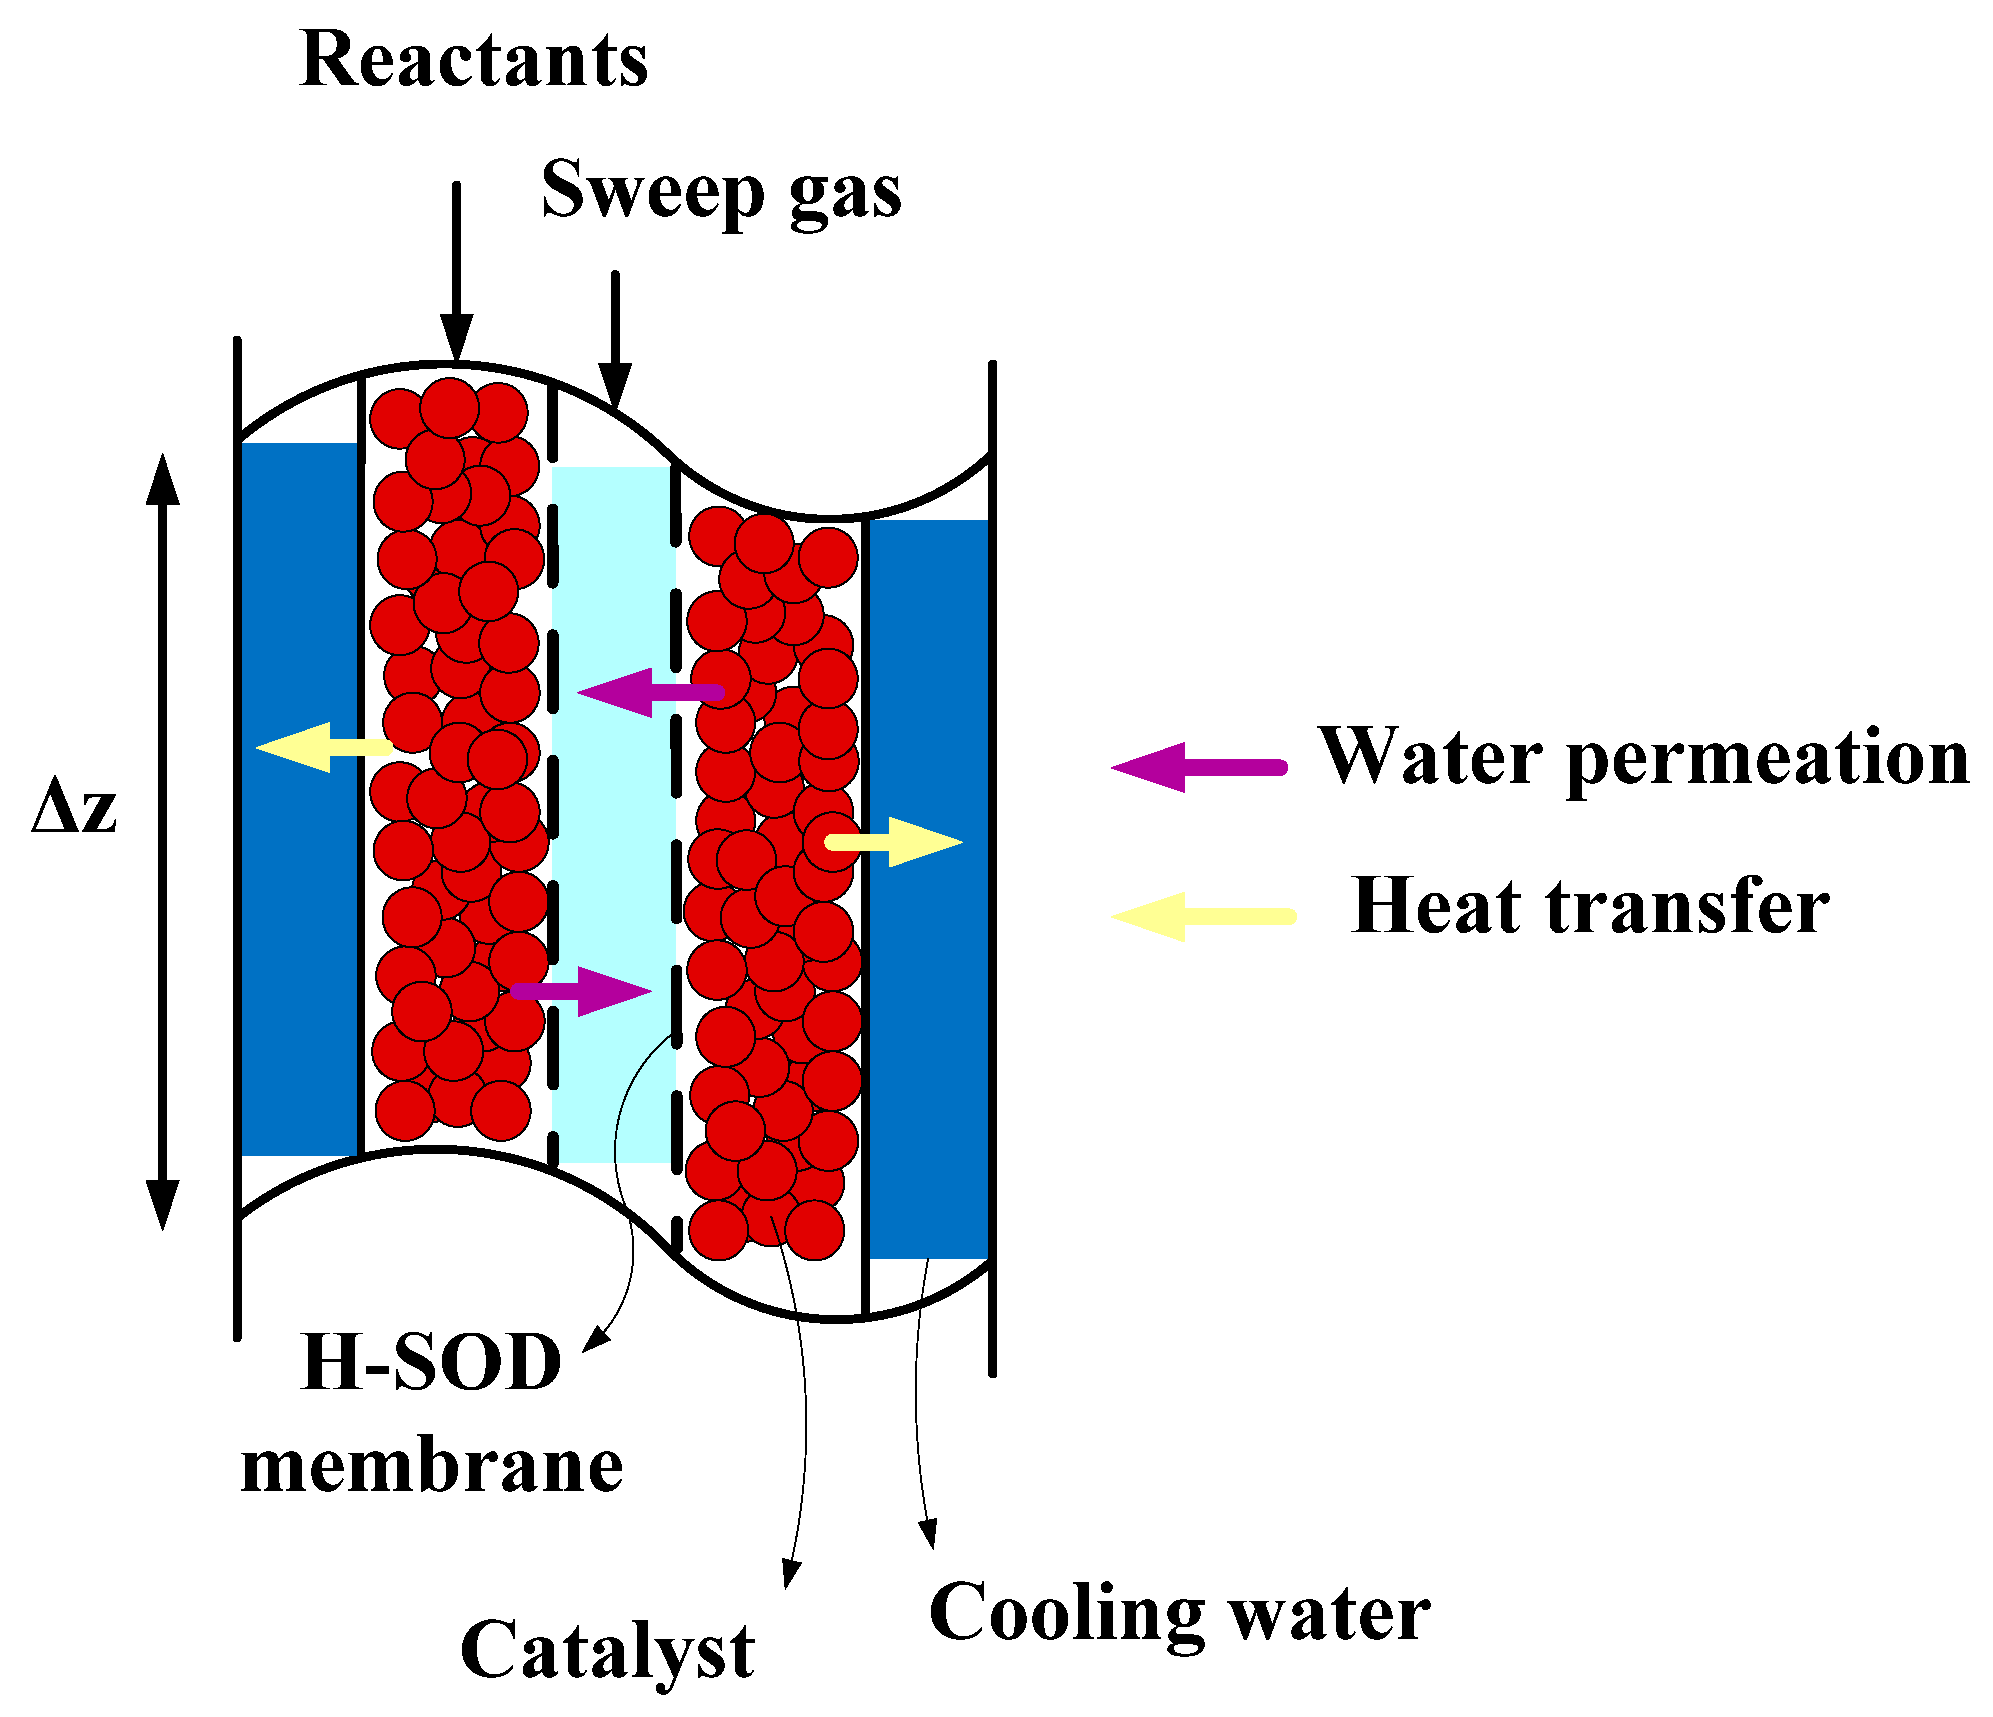
Figure 4.
CO2 conversion in three-stage reactors as a function of operating conditions of the first reactor (a) inlet pressure at 503 K and (b) inlet temperature at 76.98 bar.
Figure 4.
CO2 conversion in three-stage reactors as a function of operating conditions of the first reactor (a) inlet pressure at 503 K and (b) inlet temperature at 76.98 bar.

Figure 5.
The effect of inlet pressure on the mole fraction of (a) MeOH; (b) H2O; (c) CO; (d) CO2; (e) H2.
Figure 5.
The effect of inlet pressure on the mole fraction of (a) MeOH; (b) H2O; (c) CO; (d) CO2; (e) H2.


Figure 6.
(a) temperature and (b) total molar flow rate along the reactors as a function of the first reactor inlet pressure.
Figure 6.
(a) temperature and (b) total molar flow rate along the reactors as a function of the first reactor inlet pressure.


Figure 7.
(a) H2O; (b) MeOH; and (c) CO mole fractions along one-stage, three-stage and three-stage membrane reactors.
Figure 7.
(a) H2O; (b) MeOH; and (c) CO mole fractions along one-stage, three-stage and three-stage membrane reactors.


Figure 8.
The profiles of (a) RWGS reaction; (b) CO hydrogenation; and (c) CO2 hydrogenation reaction rates along three-stage and three-stage membrane reactors.
Figure 8.
The profiles of (a) RWGS reaction; (b) CO hydrogenation; and (c) CO2 hydrogenation reaction rates along three-stage and three-stage membrane reactors.


Figure 9.
(a) CO2 and (b) H2 conversions along one-stage, three-stage and three-stage membrane reactors.
Figure 9.
(a) CO2 and (b) H2 conversions along one-stage, three-stage and three-stage membrane reactors.
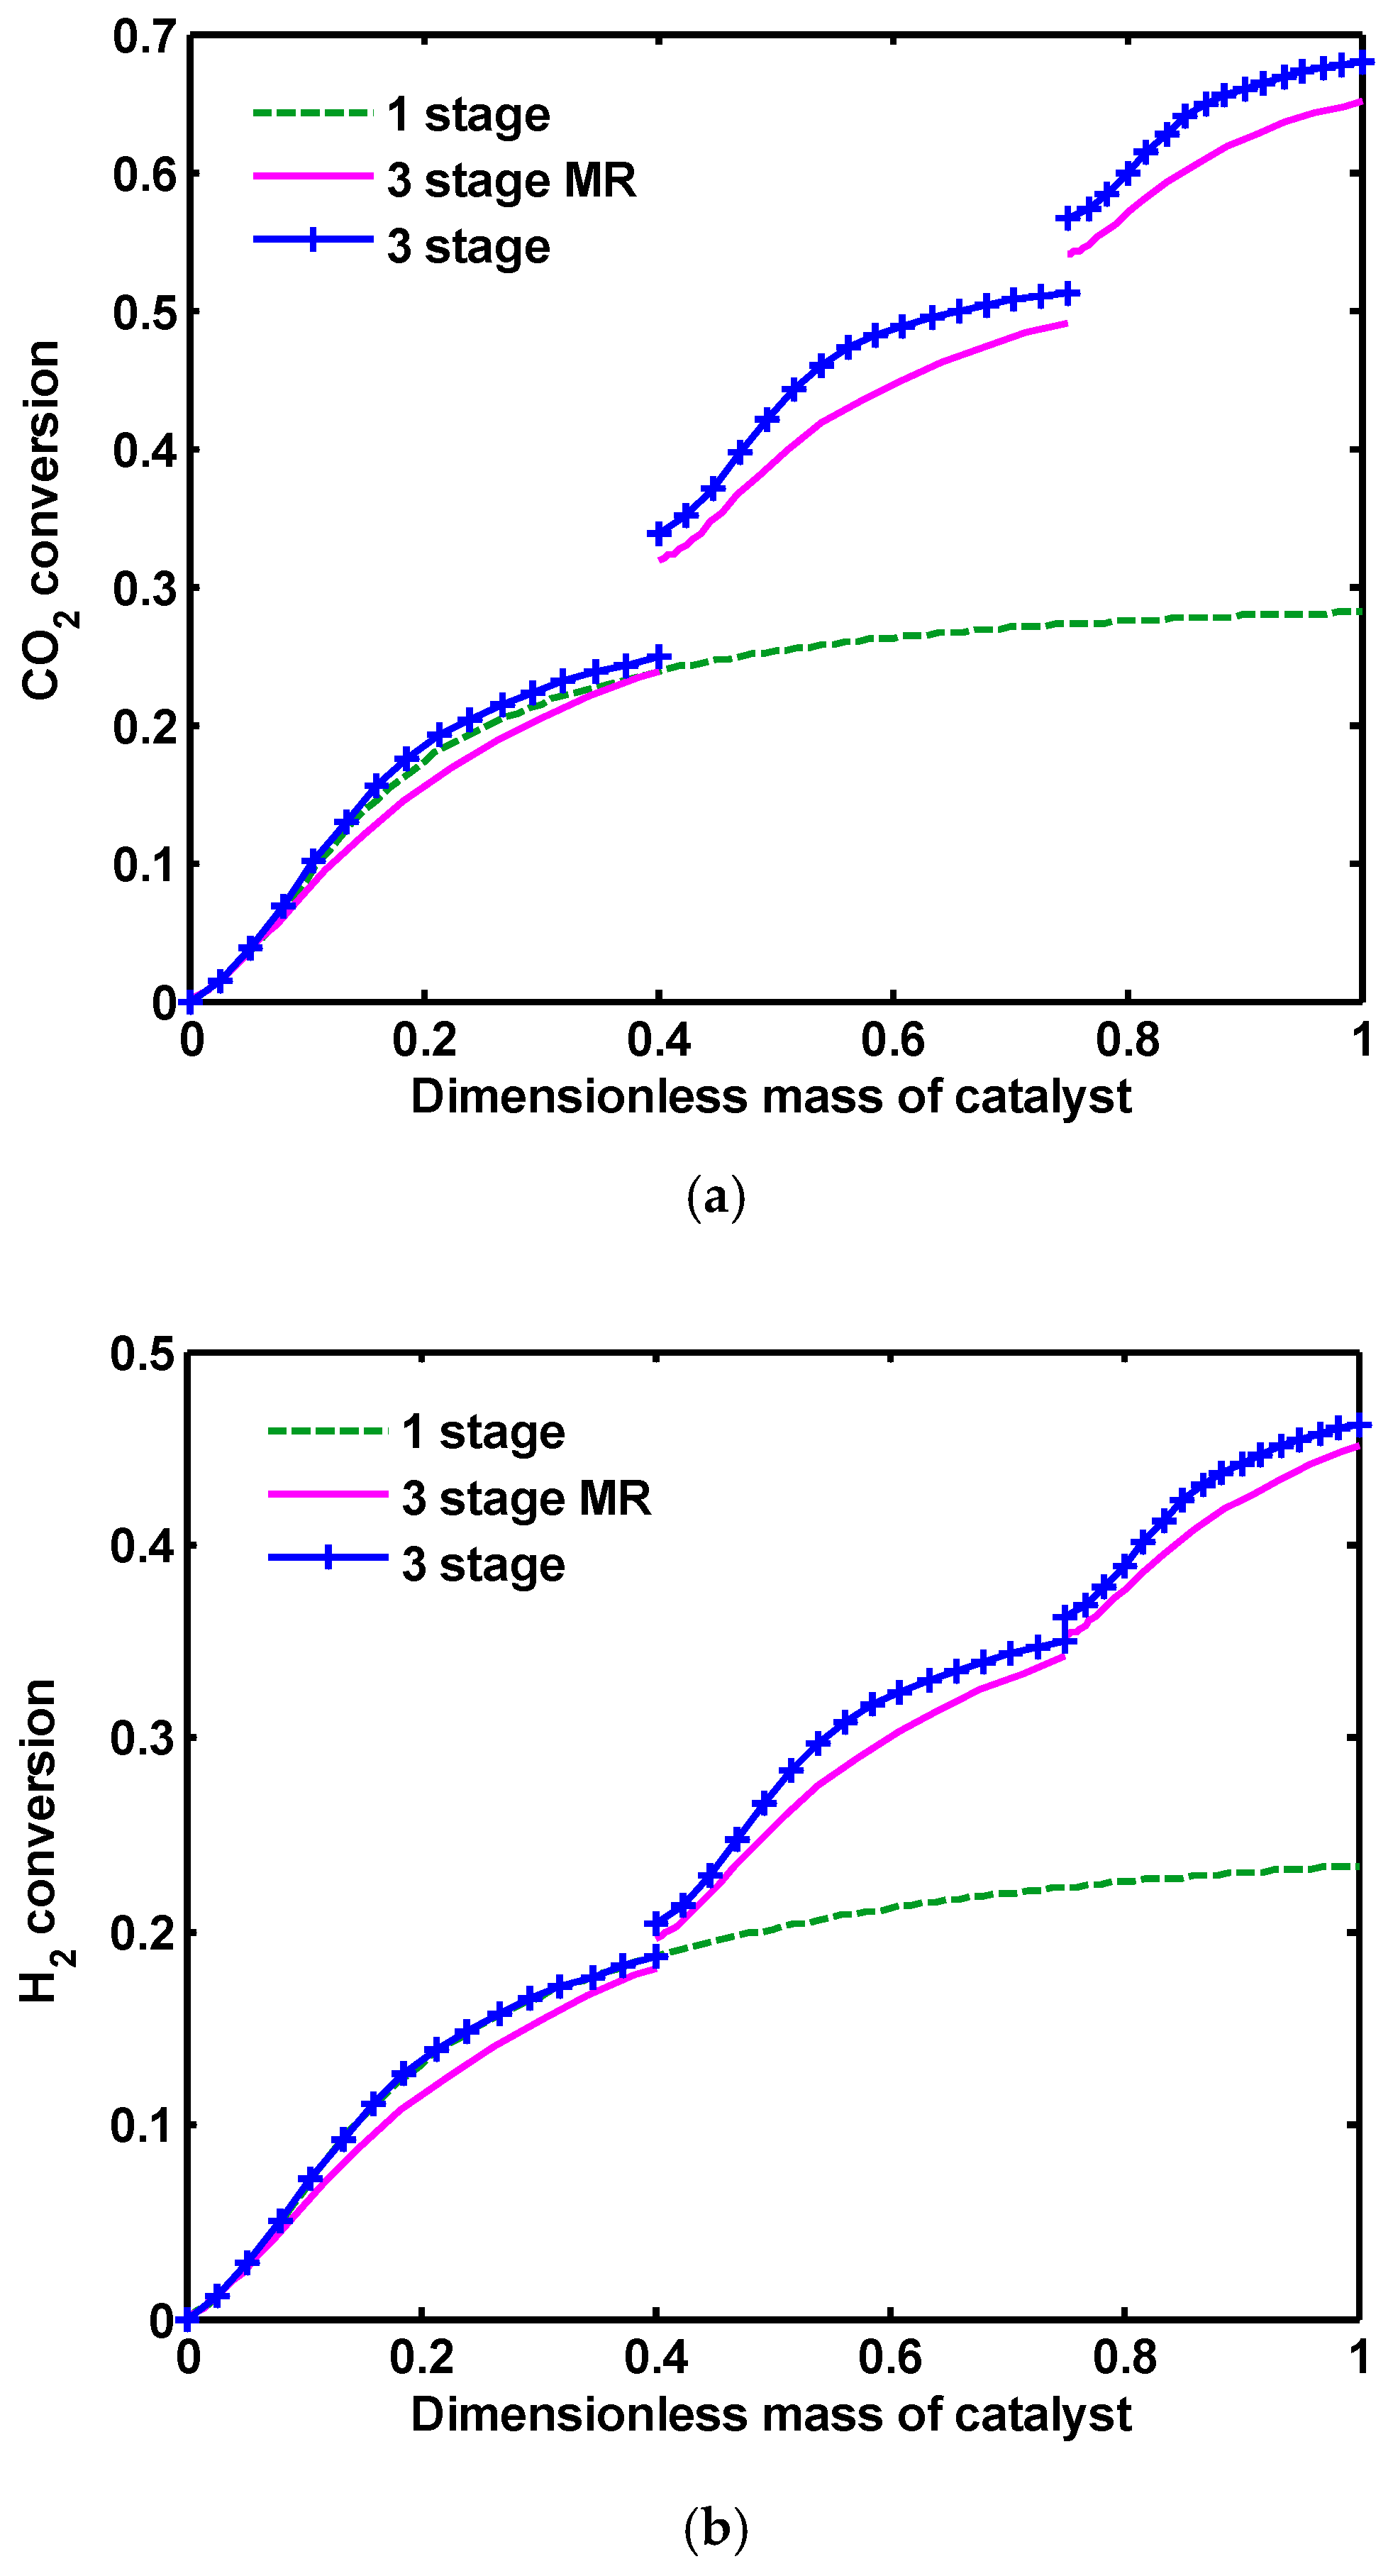
Figure 10.
MeOH yield along one-stage, three-stage and three-stage membrane reactors.
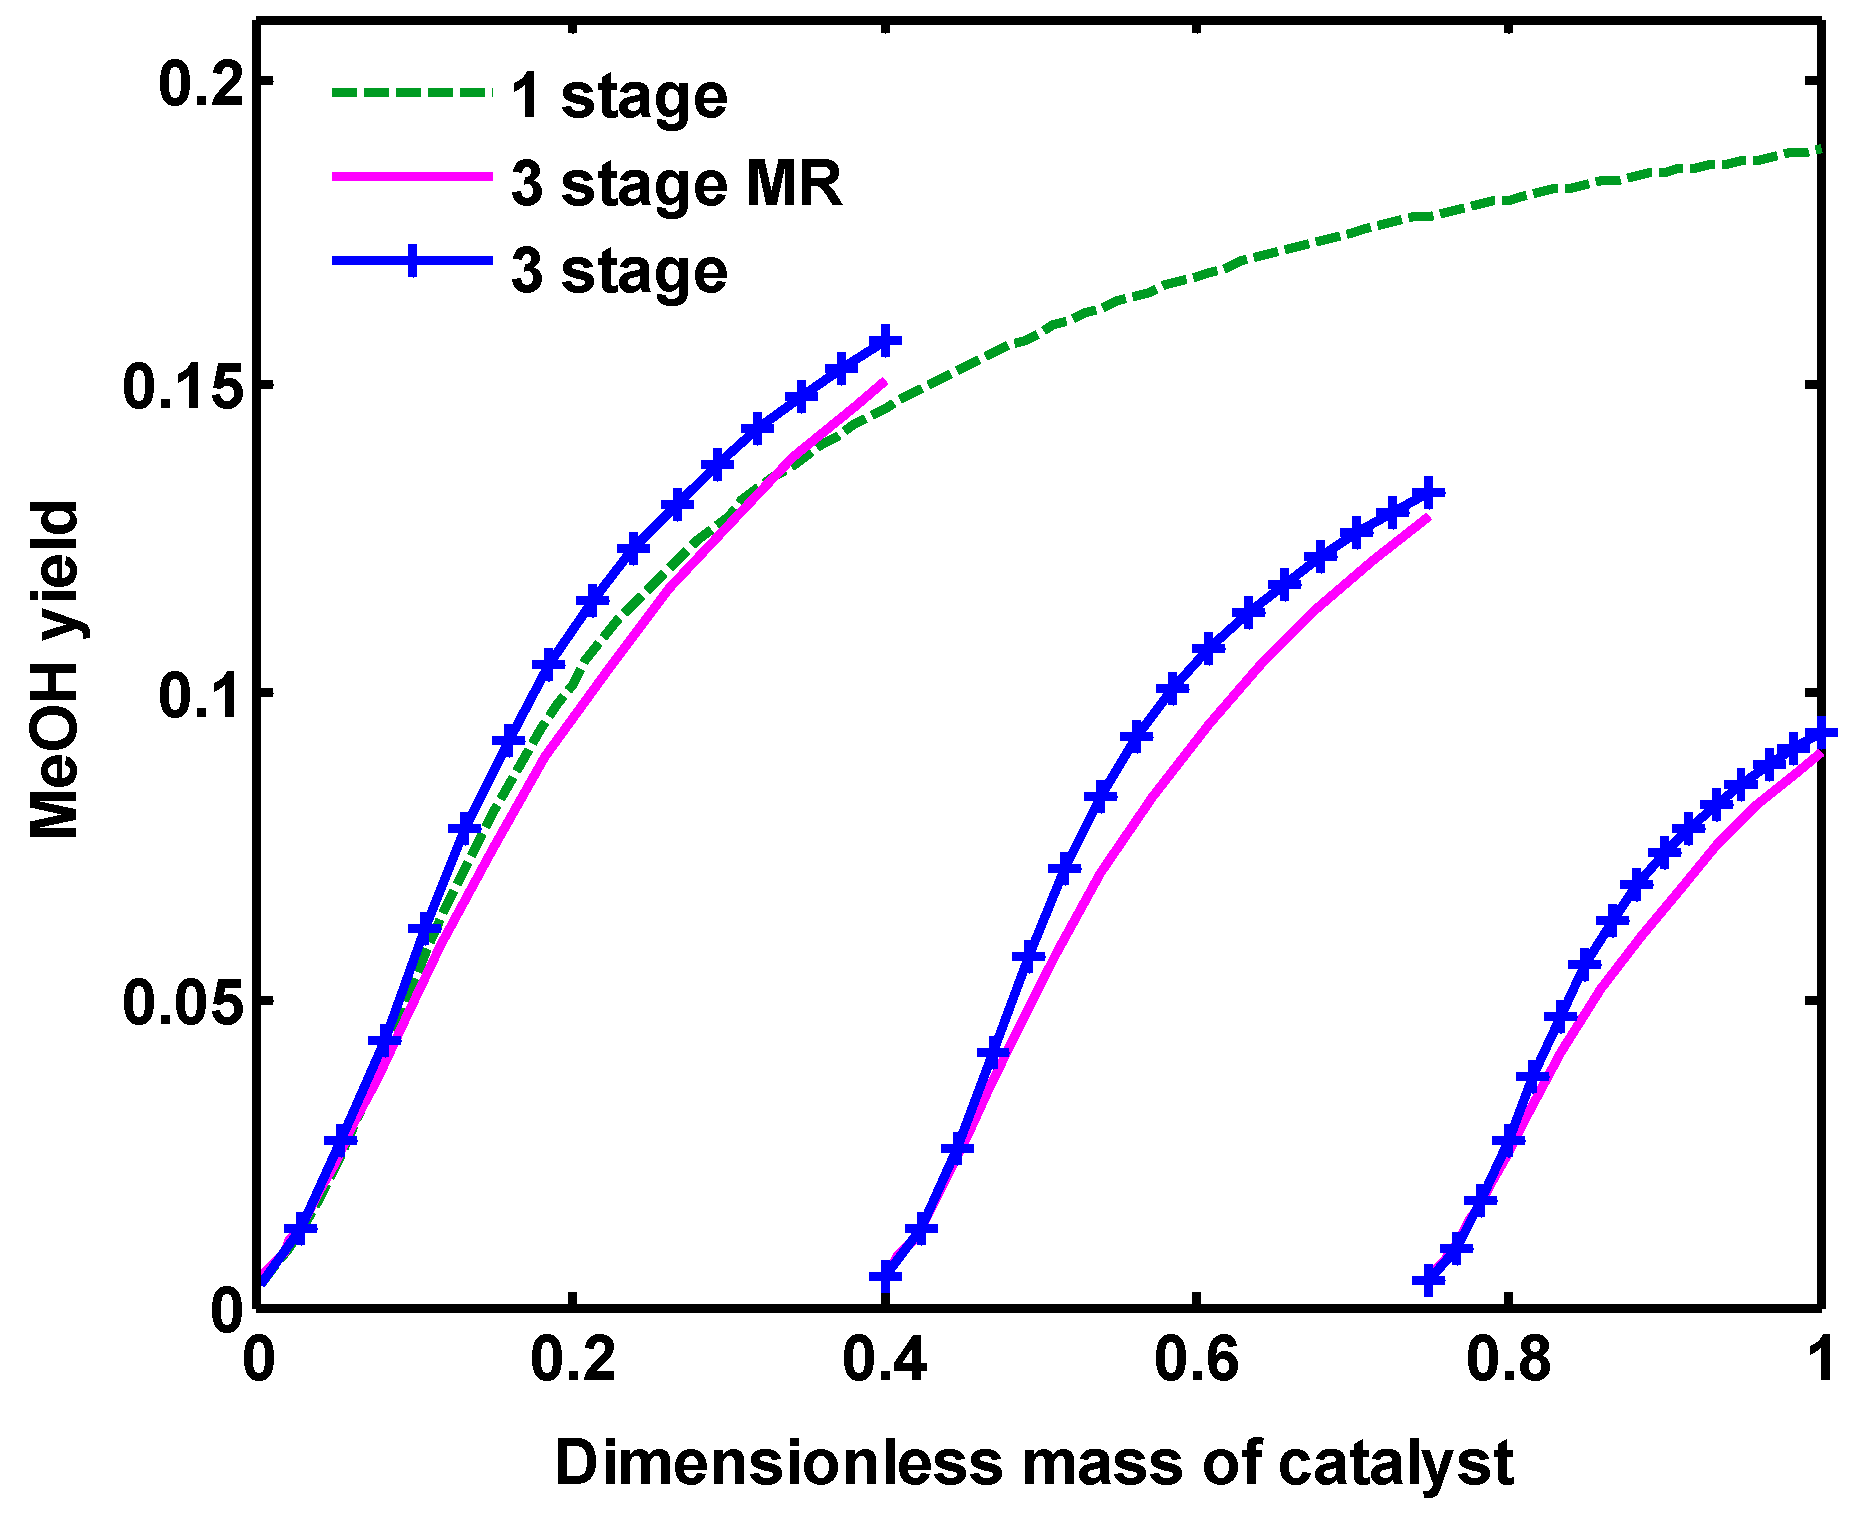
Figure 11.
Water/MeOH ratio along one-stage, three-stage and three-stage membrane reactors.
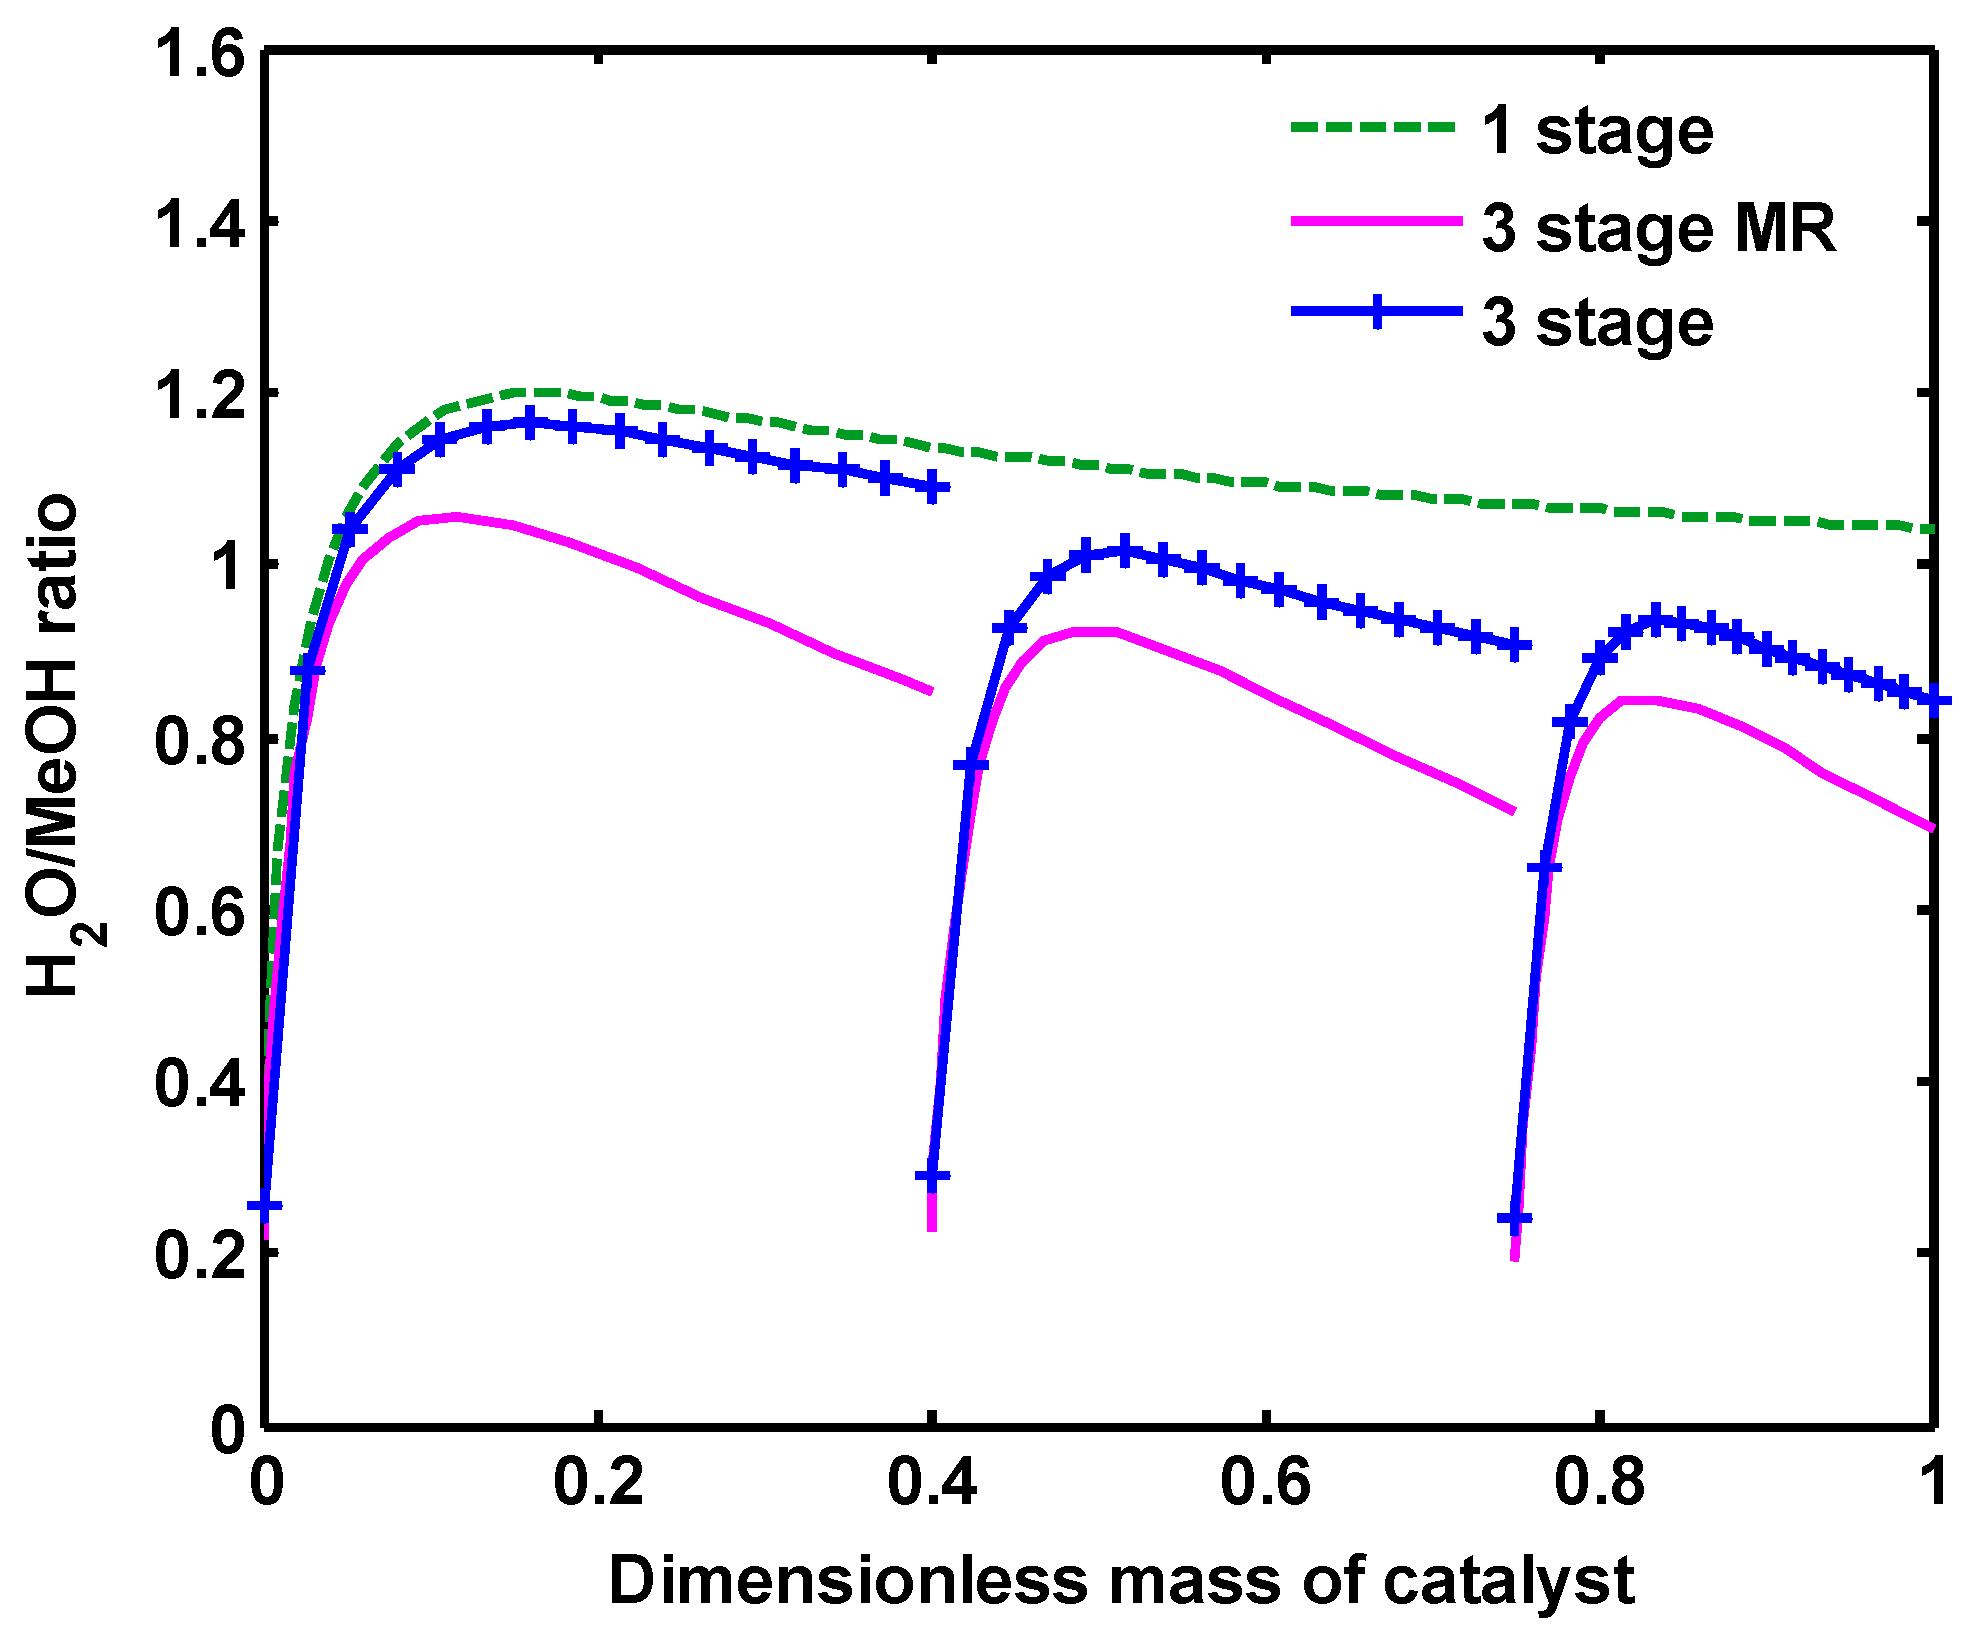
Figure 12.
MeOH/CO ratio along one-stage, three-stage and three-stage membrane reactors.
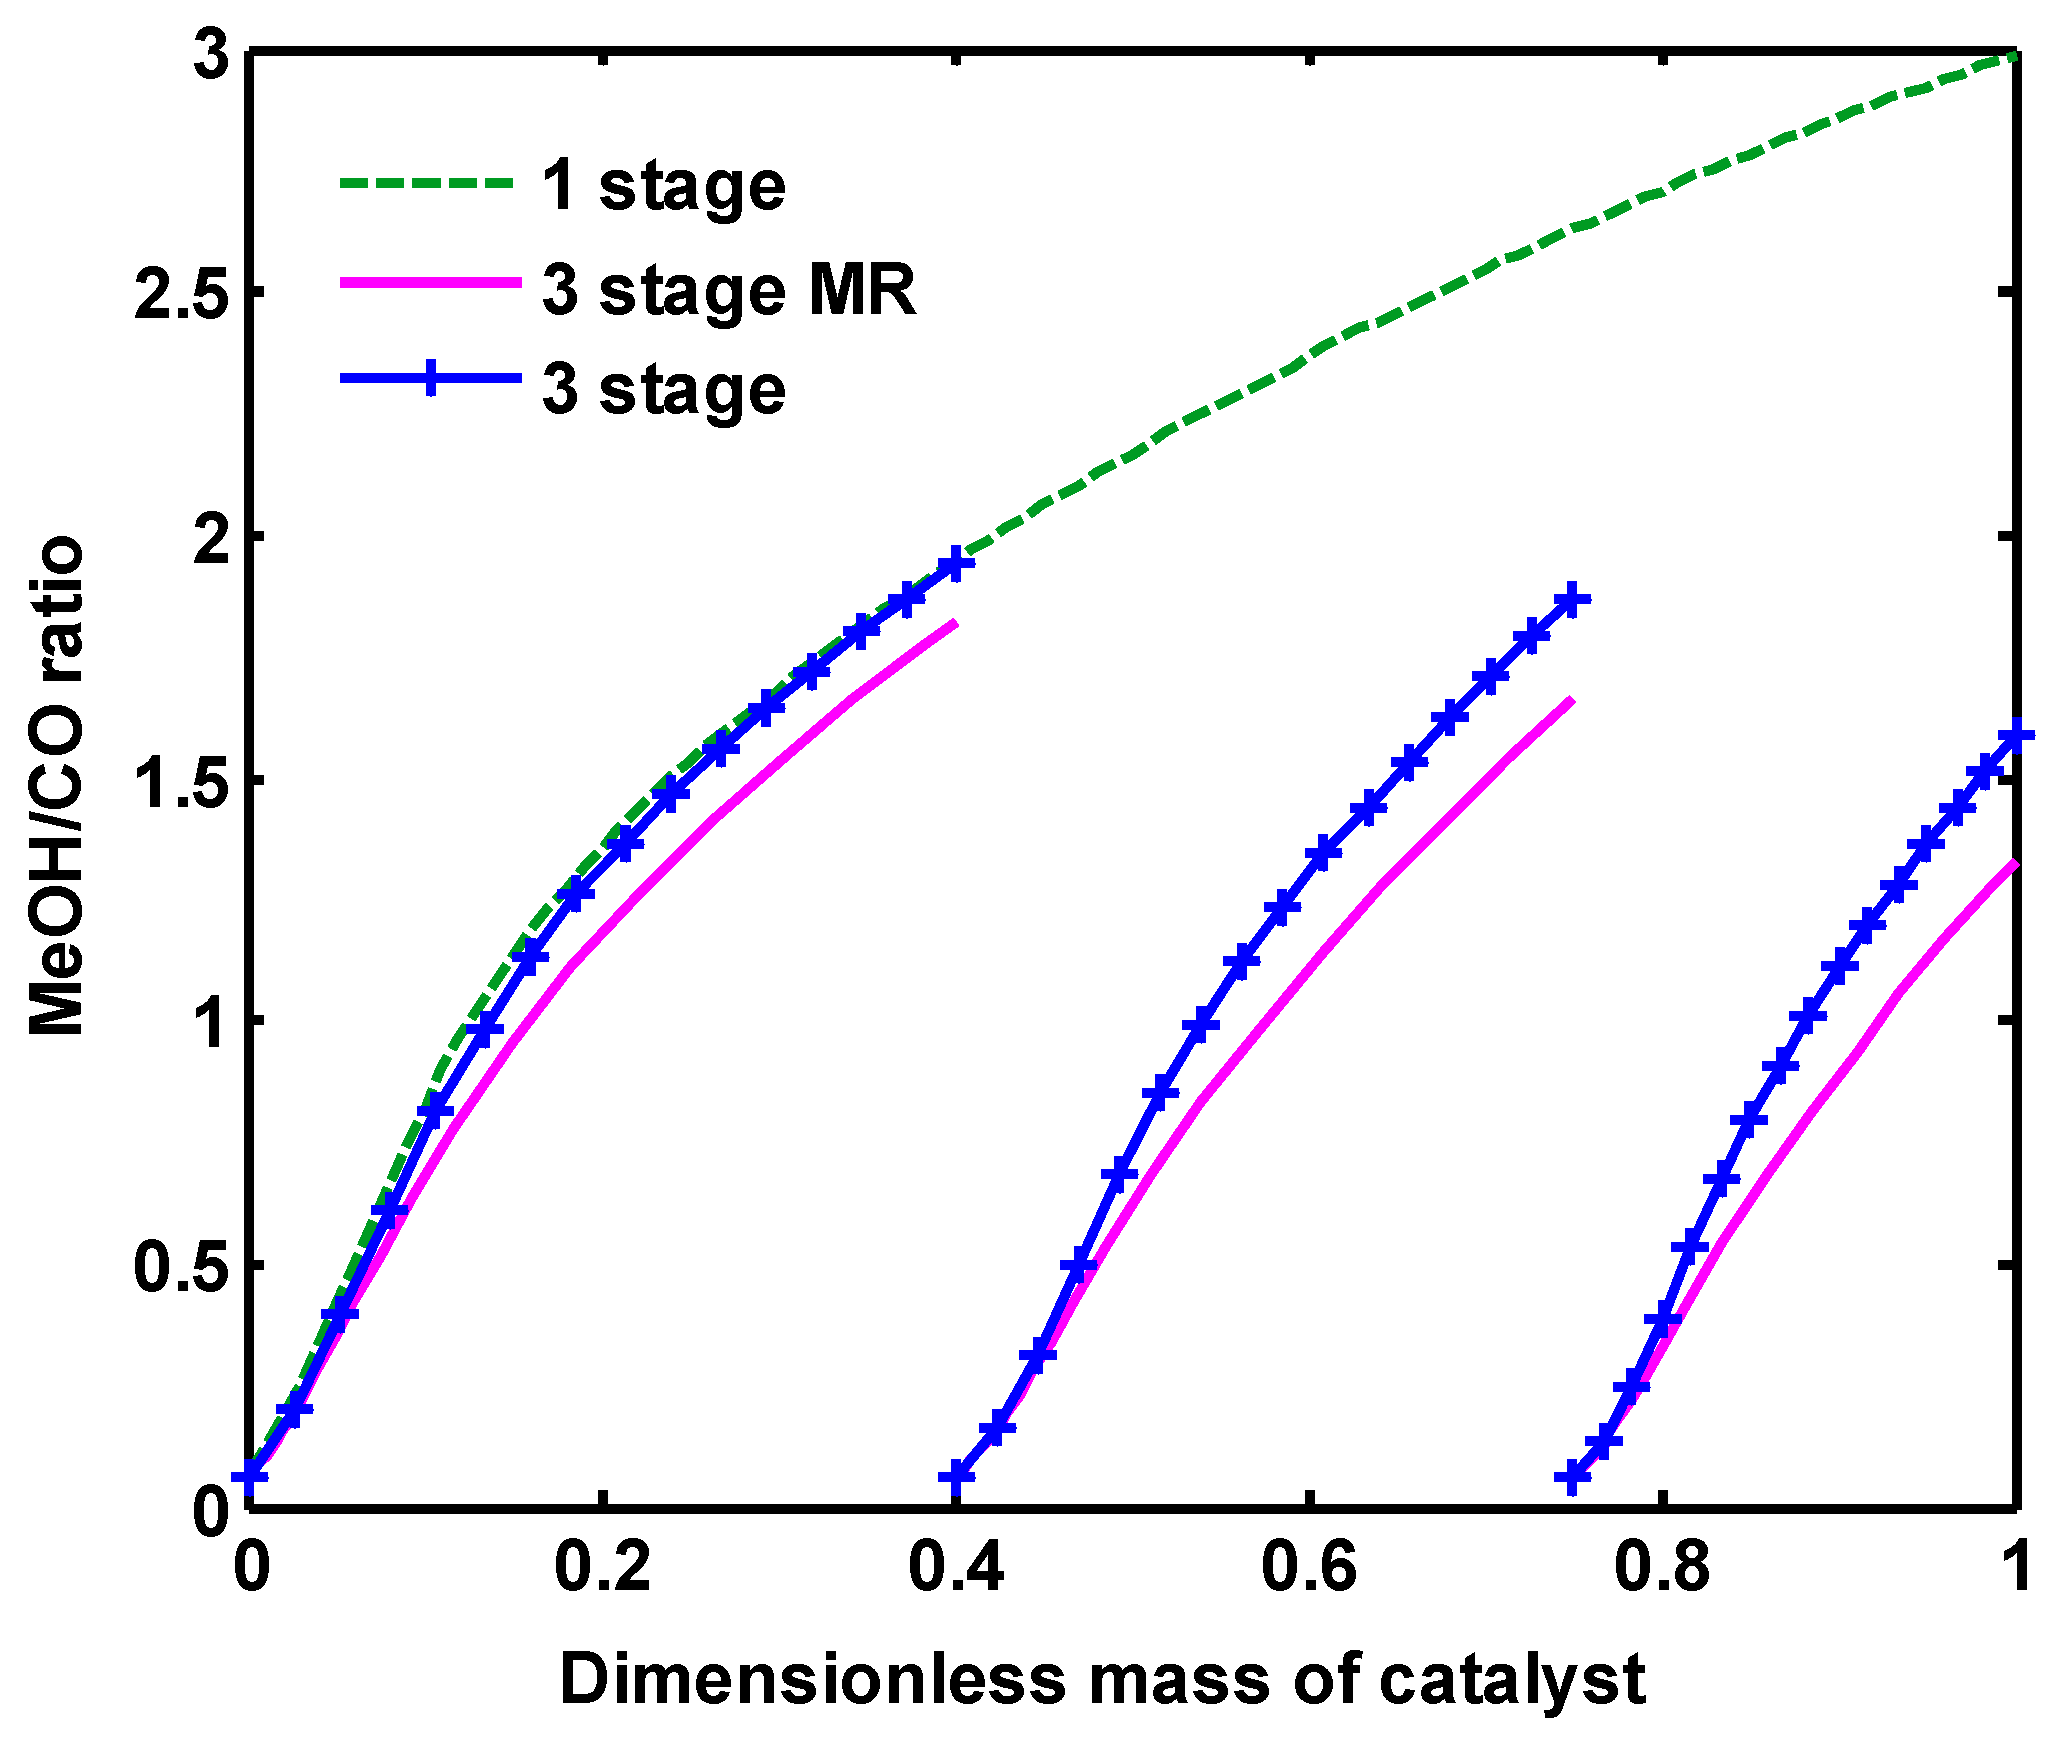
Figure 13.
(a) temperature distribution along one-stage, three-stage and three-stage membrane reactors, (b) temperature distribution in the reaction and permeation sides of three-stage MR.
Figure 13.
(a) temperature distribution along one-stage, three-stage and three-stage membrane reactors, (b) temperature distribution in the reaction and permeation sides of three-stage MR.
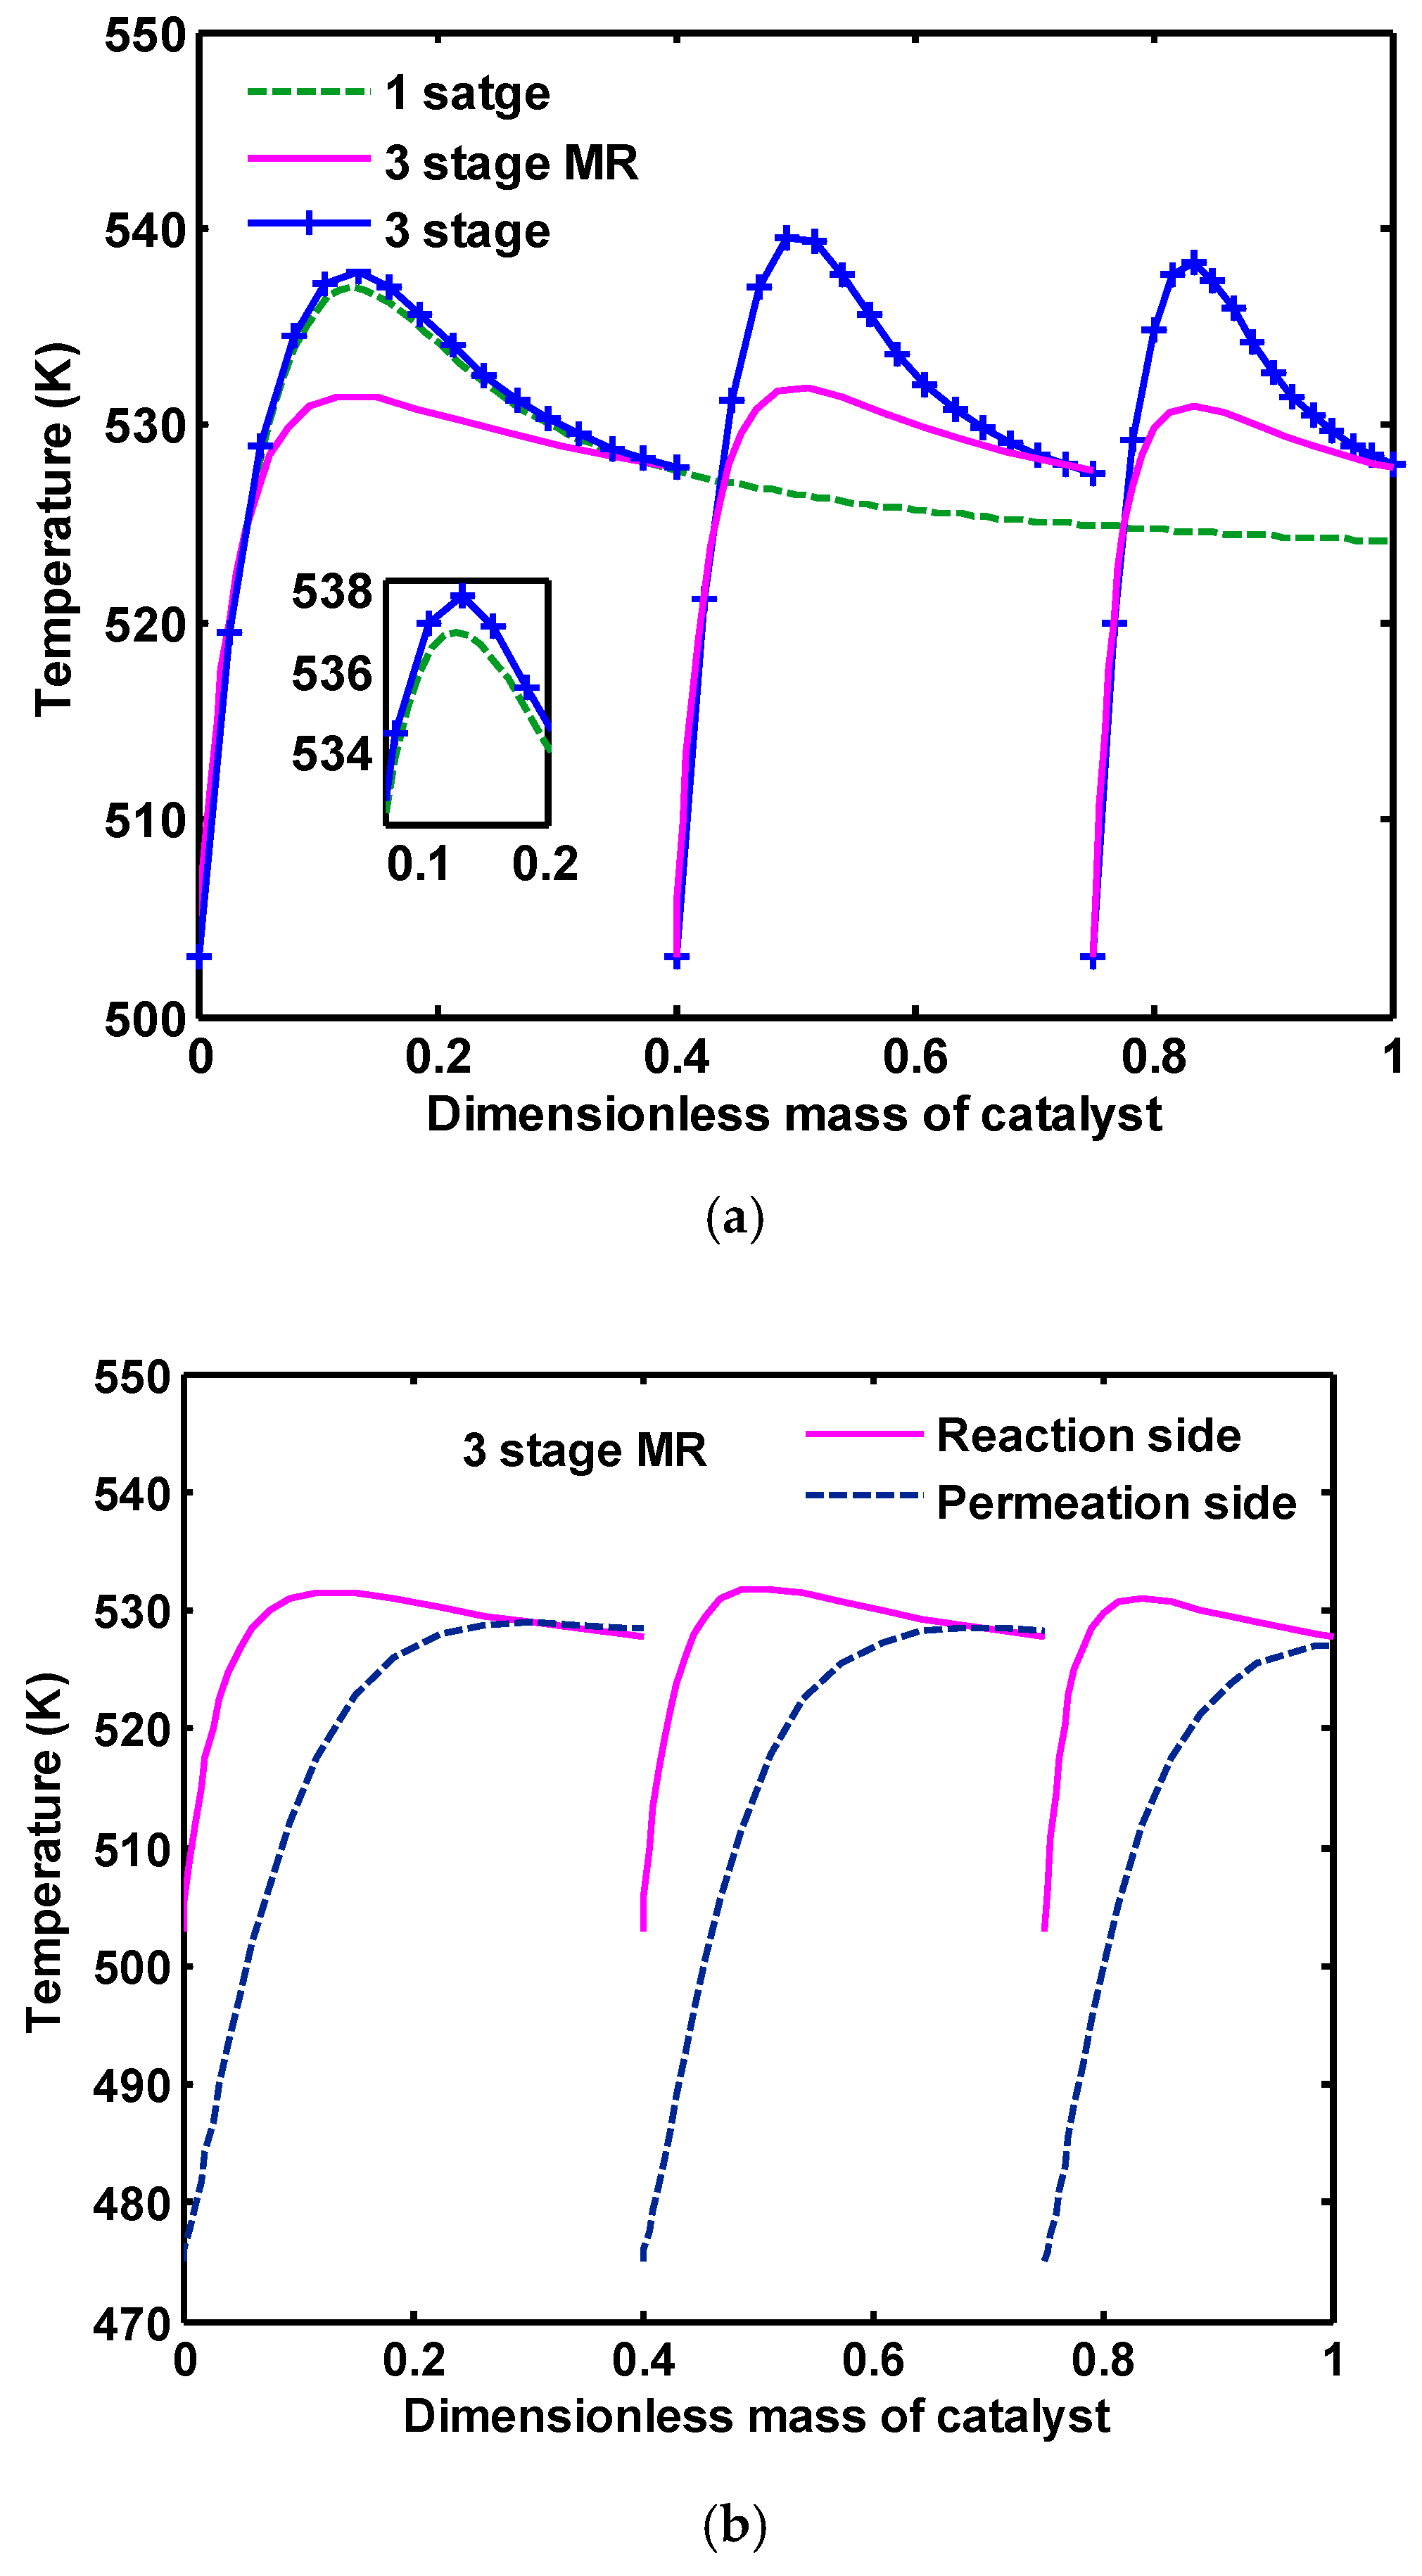
Figure 14.
H2O permeation rate in the membrane.

Figure 15.
Pressure distribution along one-stage, three-stage and three-stage membrane reactors.
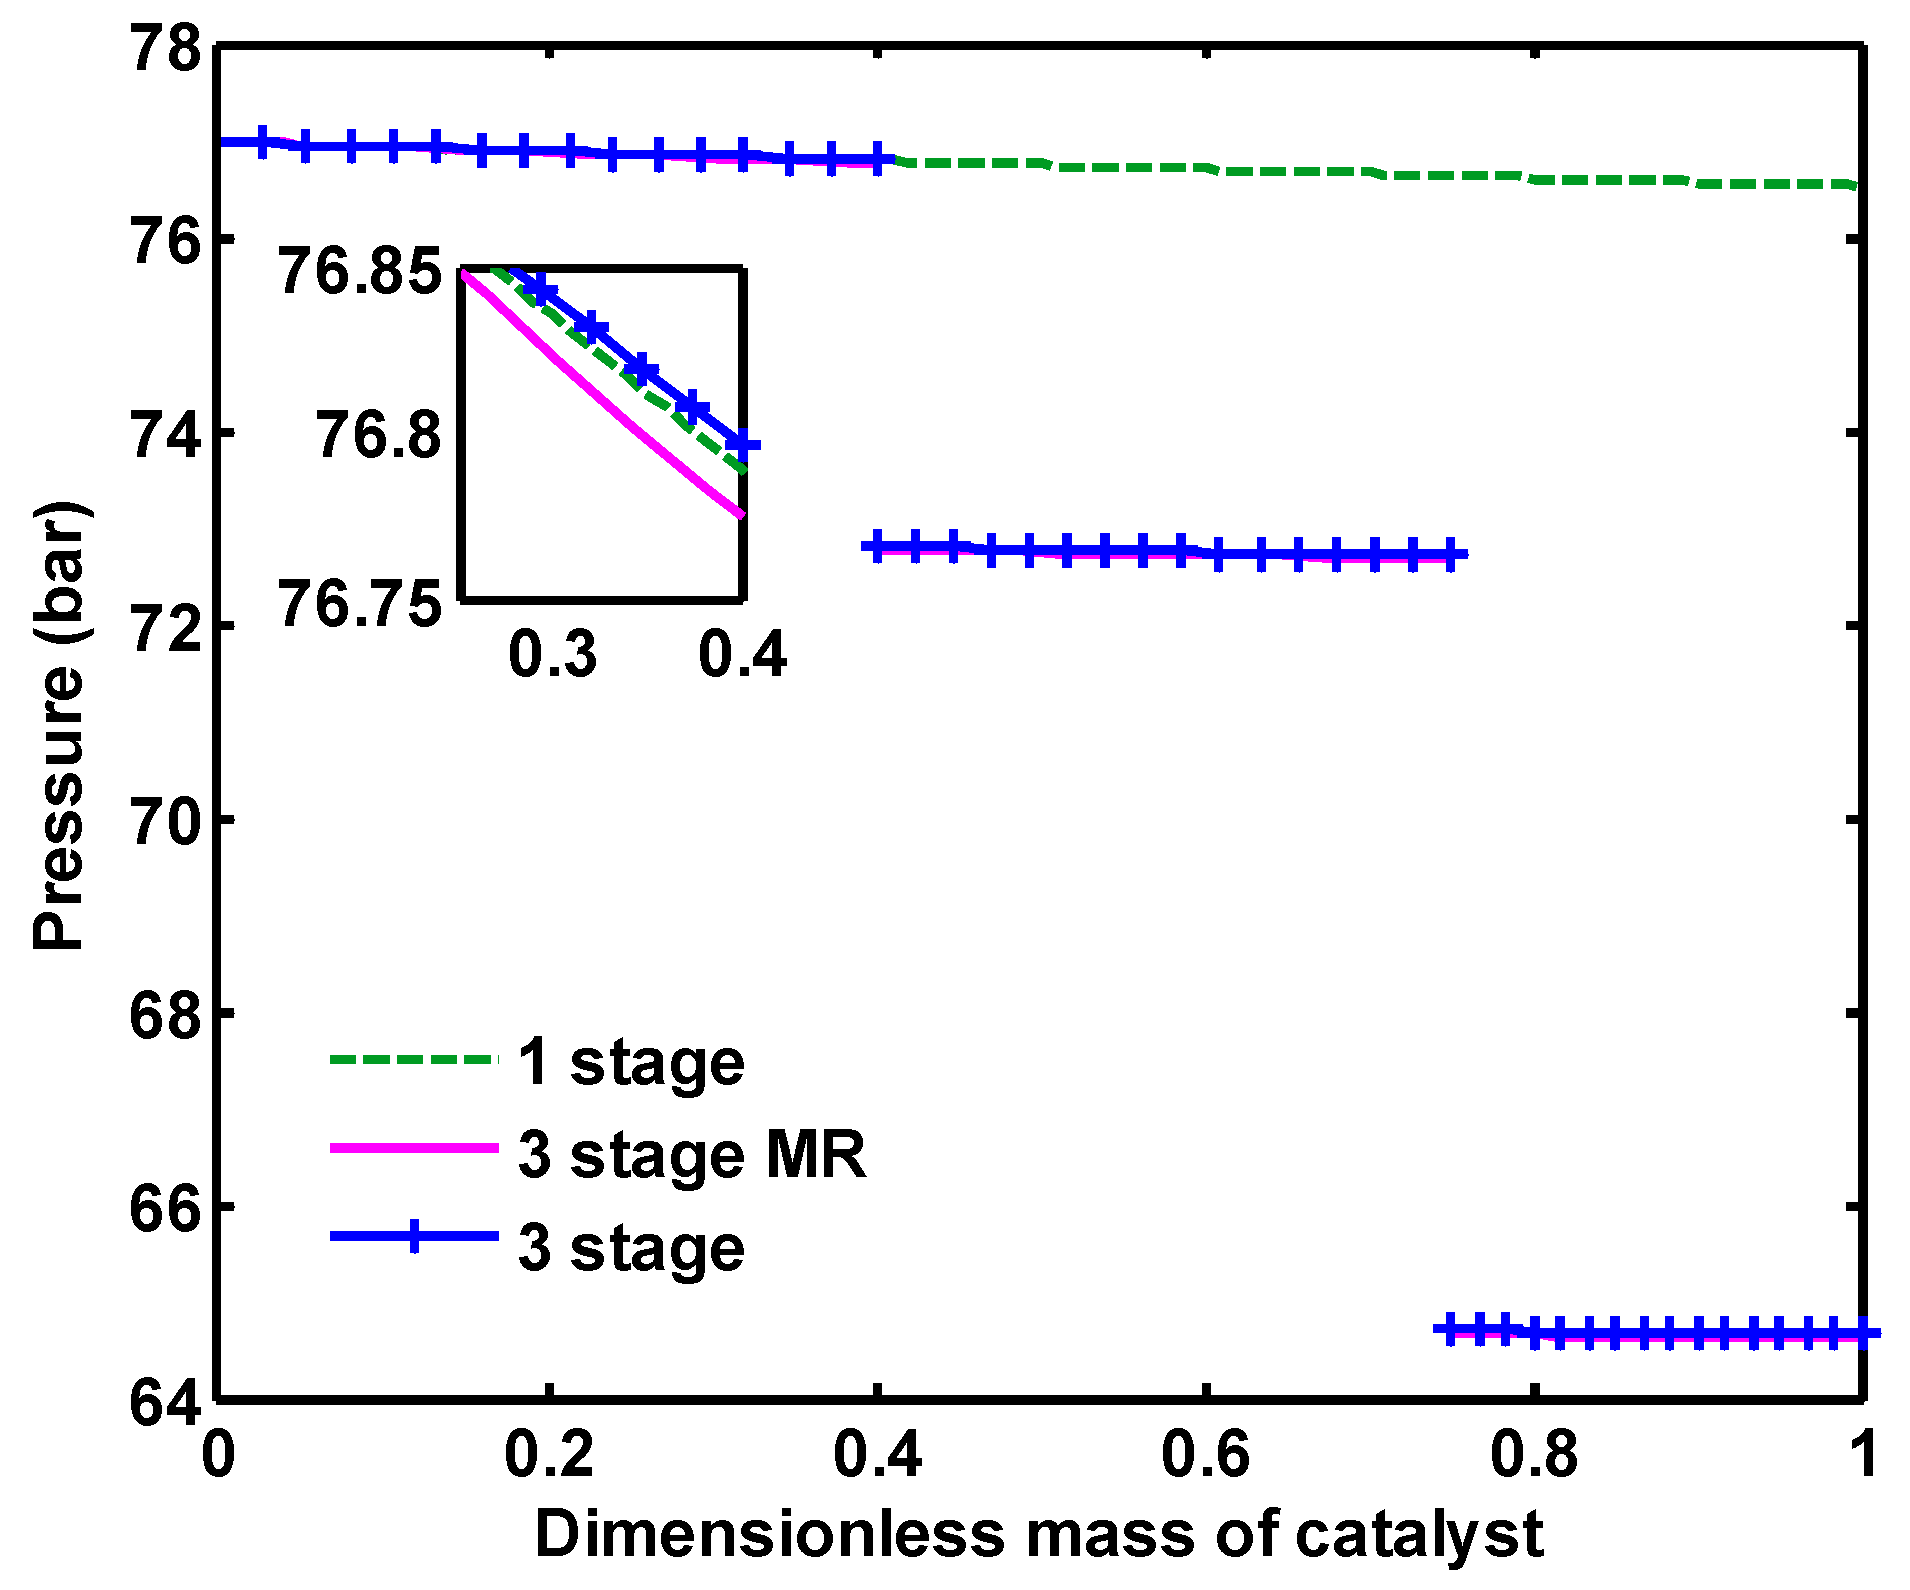
Figure 16.
(a) MeOH; (b) H2O; (c) CO; (d) CO2; (e) H2 mole fractions along CR and three-stage MR.


Figure 17.
CO2 conversion along CR and three-stage MR.

Figure 18.
(a) H2O/MeOH ratio; (b) MeOH/CO ratio along CR and three-stage MR.


Figure 19.
A comparison of methanol production rate in CR, one-stage, three-stage and three-stage membrane reactors.
Figure 19.
A comparison of methanol production rate in CR, one-stage, three-stage and three-stage membrane reactors.


Table 1.
The rate, adsorption equilibrium, and equilibrium constants of methanol synthesis reaction.
Table 1.
The rate, adsorption equilibrium, and equilibrium constants of methanol synthesis reaction.
| Rate Constants (mol/s kg bar) | ||
| Adsorption Equilibrium Constants | ||
| Equilibrium Constants | ||
| 5139 | 12.621 | |
| 3066 | 10.592 | |
| −2073 | −2.029 | |
Table 2.
The operating conditions and reactor specifications of conventional methanol synthesis and direct CO2 hydrogenation.
Table 2.
The operating conditions and reactor specifications of conventional methanol synthesis and direct CO2 hydrogenation.
| Parameter | Values |
|---|---|
| Particle diameter (m) | 5.47 × 10⁻³ |
| Bed void fraction | 0.39 |
| Density of catalyst bed (kg/m3) | 1140 |
| Length of reactor (m) | 7.022 |
| Diameter of reactor (m) | 3.8 × 10⁻² |
| Number of tubes | 2962 |
| Inlet pressure (bar) | 76.98 |
| Inlet temperature (K) | 503 |
| Feed flow rate (mol/s) | 0.64 |
| Feed composition (mole fraction) | |
| Conventional methanol synthesis | |
| CH3OH | 0.005 |
| CO2 | 0.094 |
| CO | 0.046 |
| H2O | 0.0004 |
| H2 | 0.659 |
| N2 | 0.093 |
| CH4 | 0.1026 |
| Direct CO2 hydrogenation | |
| CO2 | 0.25 |
| H2 | 0.75 |
Table 3.
The operating conditions of three stage reactors.
| Parameter | First Reactor | Second Rector | Third Reactor |
|---|---|---|---|
| Inlet temperature (K) | 503 | 503 | 503 |
| Inlet pressure (bar) | 76.98 | a | a |
| Feed flow rate per tube (mol/s) | 0.64 | b | b |
| Catalyst distribution (weight fraction) | 0.4 | 0.35 | 0.25 |
a: A total of 4 bar pressure drop was considered between each reactor; b: The molar flow rate of the unreacted gases of the previous flash drum.
Table 4.
The specifications and operating conditions of membrane reactor.
| Parameter | Values |
|---|---|
| Diameter of permeation side (m) | 3.8 × 10⁻² |
| Diameter of the reaction side | 5.3 × 10⁻² |
| Number of tubes | 2962 |
| Permeation side | |
| Feed composition (mole fraction) | |
| H2O | 0.01 |
| N2 | 0.99 |
| Inlet pressure (bar) | 1 |
| Inlet temperature (K) | 475 |
| Feed flow rate (mol/s) | 0.05 |
Table 5.
Auxiliary correlations.
| Parameter | Equation |
|---|---|
| Component heat capacity | |
| Mixture heat capacity | Based on local compositions |
| Viscosity of reaction mixtures | |
| Mixture thermal conductivity | |
| Mass transfer coefficient between gas and solid phases | |
| Overall heat transfer coefficient | |
| Heat transfer coefficient between gas phase and reactor wall |
Table 6.
Comparison between model results and plant data of methanol synthesis reactor.
| Parameters | Plant Data | Model | Error % | |
|---|---|---|---|---|
| Reactor Inlet | Reactor Outlet | Reactor Outlet | ||
| Feed flow rate (mol s−1) | 0.565 | 0.51 | 0.5065 | −0.68 |
| Temperature (K) | 503 | 528 | 523.08 | −0.93 |
| Composition (mol %) | ||||
| CO2 | 3.45 | 2.18 | 2.17 | −0.45 |
| H2 | 79.55 | 75.71 | 75.51 | −0.26 |
| CO | 4.66 | 1.44 | 1.09 | −24.30 |
| H2O | 0.08 | 1.74 | 1.76 | 1.14 |
| CH3OH | 0.032 | 5.49 | 5.81 | 5.82 |
| CH4 | 11.72 | 12.98 | 13.07 | 0.69 |
© 2017 by the authors. Licensee MDPI, Basel, Switzerland. This article is an open access article distributed under the terms and conditions of the Creative Commons Attribution (CC BY) license (http://creativecommons.org/licenses/by/4.0/).
Share and Cite
MDPI and ACS Style
Samimi, F.; Rahimpour, M.R.; Shariati, A. Development of an Efficient Methanol Production Process for Direct CO2 Hydrogenation over a Cu/ZnO/Al2O3 Catalyst. Catalysts 2017, 7, 332. https://doi.org/10.3390/catal7110332
AMA Style
Samimi F, Rahimpour MR, Shariati A. Development of an Efficient Methanol Production Process for Direct CO2 Hydrogenation over a Cu/ZnO/Al2O3 Catalyst. Catalysts. 2017; 7(11):332. https://doi.org/10.3390/catal7110332
Chicago/Turabian StyleSamimi, Fereshteh, Mohammad Reza Rahimpour, and Ali Shariati. 2017. "Development of an Efficient Methanol Production Process for Direct CO2 Hydrogenation over a Cu/ZnO/Al2O3 Catalyst" Catalysts 7, no. 11: 332. https://doi.org/10.3390/catal7110332
Note that from the first issue of 2016, this journal uses article numbers instead of page numbers. See further details here.