Intrinsic Activity of MnOx-CeO2 Catalysts in Ethanol Oxidation


Foundation for Research & Technology-Hellas, Institute of Chemical Engineering Sciences (FORTH/ICE-HT), Stadiou str., Platani, 26504 Patras, Greece
*
Author to whom correspondence should be addressed.
Catalysts 2017, 7(11), 339; https://doi.org/10.3390/catal7110339
Submission received: 4 October 2017
/
Revised: 31 October 2017
/
Accepted: 8 November 2017
/
Published: 10 November 2017
(This article belongs to the Special Issue Ceria-based Catalysts)
Abstract
:MnOx-CeO2 mixed oxides are considered efficient oxidation catalysts superior to the corresponding single oxides. Although these oxides have been the subject of numerous studies, their fundamental performance indicators, such as turnover frequency (TOF) or specific activity, are scarcely reported. The purpose of the present work is to investigate the effect of catalyst composition on the concentration of active sites and intrinsic activity in ethanol oxidation by the employment of temperature-programmed desorption and oxidation of isotopically-labelled ethanol, 12CH313CH2OH. The transformation pathways of preadsorbed ethanol in the absence of gaseous oxygen refer to dehydrogenation to acetaldehyde followed by its dissociation combined with oxidation by lattice oxygen. In the presence of gaseous oxygen, lattice oxygen is rapidly restored and the main products are acetaldehyde, CO2, and water. CO2 forms less easily on mixed oxides than on pure MnOx. The TOF of ethanol oxidation has been calculated assuming that the amount of adsorbed ethanol and CO2 produced during temperature-programmed oxidation (TPO) is a reliable indicator of the concentration of the active sites.
1. Introduction
Volatile organic compounds (VOCs) include all organic compounds that exist in the gaseous state in air. Ethanol is one of the dominating VOCs in some segments of the printing industry and in exhaust gases from ethanol-fuelled vehicles. The most commonly employed methods for ethanol (total) oxidation are thermal and catalytic incineration [1]. Noble metals [2,3,4] and oxides of the transition metals [5,6,7] have been mostly investigated for the complete oxidation of ethanol.
The possibility of forming partial oxidation products that are more harmful than the original organic compound is very high during the oxidation process of compounds like ethanol. Side reactions are mainly dehydrogenation to acetaldehyde and dehydration to ethylene or diethyl ether [4,8]. In some cases, due to secondary reactions of these primary products, the formation of molecules with more than two carbon atoms, such as ethyl acetate, crotonaldehyde, and acetone has been reported [9,10].
The interaction of ethanol with ceria-based catalysts including ceria-supported metals (Pd, Pt, Rh, and Co) has been studied with dynamic techniques, such as temperature-programmed desorption (TPD), by several investigators [10,11,12,13]. It has been generally observed that a part of ethanol reversibly adsorbs and desorbs at low temperatures, while the remaining part undergoes surface transformation to other surface species. Acetaldehyde is a major desorption product over CeO2 and Rh/CeO2, while it is produced in small amounts over Pt/CeO2 and Pd/CeO2. CO and CO2 are other major desorption products and the formation of methane, benzene, and acetone has also been reported. In the case of Co/CeO2, the main products during TPD were CH3CHO, C2H4, and CH4 [13].
A common approach to enhance the catalytic function of ceria in oxidation reactions is the addition of a dopant cation towards a mixed metal oxide. If the dopant is Mnn+, whose corresponding oxides (Mn3O4, Mn2O3, MnO2) are among the most active in VOC oxidation, the resulting MnxCe1−xOδ materials, either cerium-rich or manganese-rich, are interesting candidate catalysts. Several investigators have reported on the performance of MnOx-CeO2 catalysts in VOC oxidation. The morphological impact of manganese–cerium oxides on ethanol oxidation has been examined by Li et al. [14]. They showed that different crystallographic faces possess different oxidation activities. The oxidation of ethanol over Mn0.6Ce0.4O2 prepared by coprecipitation leads to acetaldehyde and CO2 as oxidation products and complete conversion to CO2 is achieved at temperatures around 200 °C [15]. The oxidation of benzene over Ce–Mn oxides synthesized by flame spray pyrolysis has been examined by Liu et al. [16]. The 12.5%-Ce–Mn oxide was the most active sample. The oxidation of toluene over nanorod-shaped Mn-Ce mixed oxides prepared by hydrothermal treatment was studied by Liao et al. [17]. The highest activity was observed for the samples with a high manganese content. Mn-Ce mixed oxides prepared by an oxalate precursor were examined in the oxidation of benzene, toluene, and ethyl acetate by Tang et al. [18,19]. Mn-Ce mixed oxides prepared by coprecipitation were studied in the oxidation of n-hexane by Picasso et al. [20]. The Ce0.67Mn0.33O2 with a 24 h aging time showed the highest performance. Mn-Ce mixed oxides synthesized via a modified reverse nanoemulsion method were investigated in the oxidation of methanol [21]. The highest activity was shown by the monophasic Mn0.25Ce0.75O2 catalyst. Mn-Ce mixed oxides have also been examined in diesel soot oxidation [22]. The most active sample was the one containing 20 at.% Mn. Single and mixed Mn-Ce oxides supported in ceramic monoliths were applied in the oxidation of toluene, ethanol, and methyl ethyl ketone [23]. The Mn-rich mixed oxide exhibited the best performance. Pintos et al. have performed density functional theory (DFT+U) calculations to gain insight into the behavior of a 12.5% Mn-doped CeO2 solid solution in oxidation reactions [24]. We have reported on the performance of a series of MnOx-CeO2 catalysts, prepared by the urea combustion method, in ethanol oxidation [8]. An interesting finding of that study was that mixed oxide catalysts present smaller specific activity than the single oxide counterparts (MnOx, CeO2), but the larger surface area of mixed oxide catalysts counterbalances their smaller specific activity allowing complete conversion of the examined VOCs at lower temperatures compared to the single oxides. Using standard definitions, as found, e.g., in [25], the reaction rate, R, over a catalyst can be expressed as the product of turnover frequency, TOF, concentration of active sites on the catalyst surface, Csites, and the specific surface area of the catalyst, SSA, as follows:
R (mol s−1 g−1) = TOF (s−1) Csites(mol m−2) SSA (m2 g−1)
The observed decrease in specific activity could be due to smaller TOF or Csites values or both in the mixed oxides. In order to gain more information on the nature of surface processes and transformation steps of adsorbed ethanol, which are considered relevant to the kinetics of ethanol oxidation over MnOx-CeO2 catalysts, a study of temperature-programmed desorption (TPD) and oxidation (TPO) of isotope-labelled ethanol was carried out, the results of which are the subject of the present work.
2. Results
Catalyst characterization results have been reported elsewhere [8]. In brief, it was found that a major fraction of Mn ions get incorporated in the ceria lattice with a homogeneous distribution of Mn ions in the bulk and the surface for Mn/(Mn + Ce) ratios up to 0.25. At Mn/(Mn + Ce) ratios higher than 0.25, the segregation of a separate Mn3O4 phase took place. The specific surface areas of mixed oxide samples were up to one order of magnitude higher than the ones of pure CeO2 or MnOx.
2.1. TPD of Ethanol
Temperature programmed desorption profiles of ethanol over pure CeO2 and pure MnOx are presented in Figure 1. Molecular ethanol (12CH313CH2OH) was desorbed in the form of two or three overlapping peaks at temperatures below 200 °C. Desorption of ethanol from CeO2 or M/CeO2 catalysts in the form of one or more overlapping peaks below 200 °C has also been observed by other investigators [11,12,26]. At the same temperature region (below 200 °C), acetaldehyde desorption was observed. The production of acetaldehyde is accompanied by water production indicative of the participation of oxygen from the catalyst surface according to the overall reaction:
[C2H5OH] + [O] → CH3CHO + H2O
Decomposition and oxidation reactions of the adsorbed ethanol take place at temperatures above 230 °C leading to the production of CO2, CO, 13CO2, 13CO, H2, and H2O in the case of CeO2. CO and 13CO appear in the form of three peaks at 300, 430, and 630 °C. The low-temperature CO peak is accompanied by H2 desorption. The relative intensity of the three peaks is different for 12CO and 13CO with most 13CO located in the low-temperate peak compared to 12CO. This is understandable taking into account that 13CO originates from the labelled α-carbon of ethanol. The presence of 12CO indicates the oxidation of β-carbon of the original adsorbed ethanol molecule. Noting that above 230 °C no intact ethanol molecule is expected to remain on the ceria surface, the observed family of peaks at 300 °C (12CO, H2, 13CO) can be attributed to oxidative decomposition of adsorbed acetaldehyde-like species:
[12CH313CHO] + [O] → 12CO + 13CO + H2 + H2O
It should be noted that no CH4 (m/z = 15) was detected to desorb during TPD. The presence of CO at higher temperatures indicates that the lattice oxygen of ceria is not readily available to fully oxidize all carbon species originating from ethanol. 12CO2 and 13CO2 have similar profiles in the form of two peaks at 350–400 °C and 600–700 °C. Overall, the complexity of the TPD profiles over CeO2 indicates the presence of a multitude of adsorption states and intermediate species. The fact, though, that the profiles of 12C and 13C-containing molecules are similar implies that these adsorbed species contain (at least) one C-C bond whose breaking is rate determining.
The corresponding TPD profile following 12CH313CH2OH adsorption on pure MnOx is presented in Figure 2b. Molecular desorption of ethanol is observed in the form of three overlapping peaks at temperatures below 200 °C accompanied by similar in shape acetaldehyde peaks. In contrast to what was found in the case of CeO2, no CO (either 12CO or 13CO) was detected to desorb during TPD. This is an indication of a higher oxidation capability of MnOx compared to CeO2. The profile is also simpler with a single peak of CO2 with a small hump at the low-temperature side. The CO2 peak, which is accompanied by a H2O peak, is at ~340 °C compared to the double peaks at 350–400 °C and 600–700 °C in the case of CeO2.
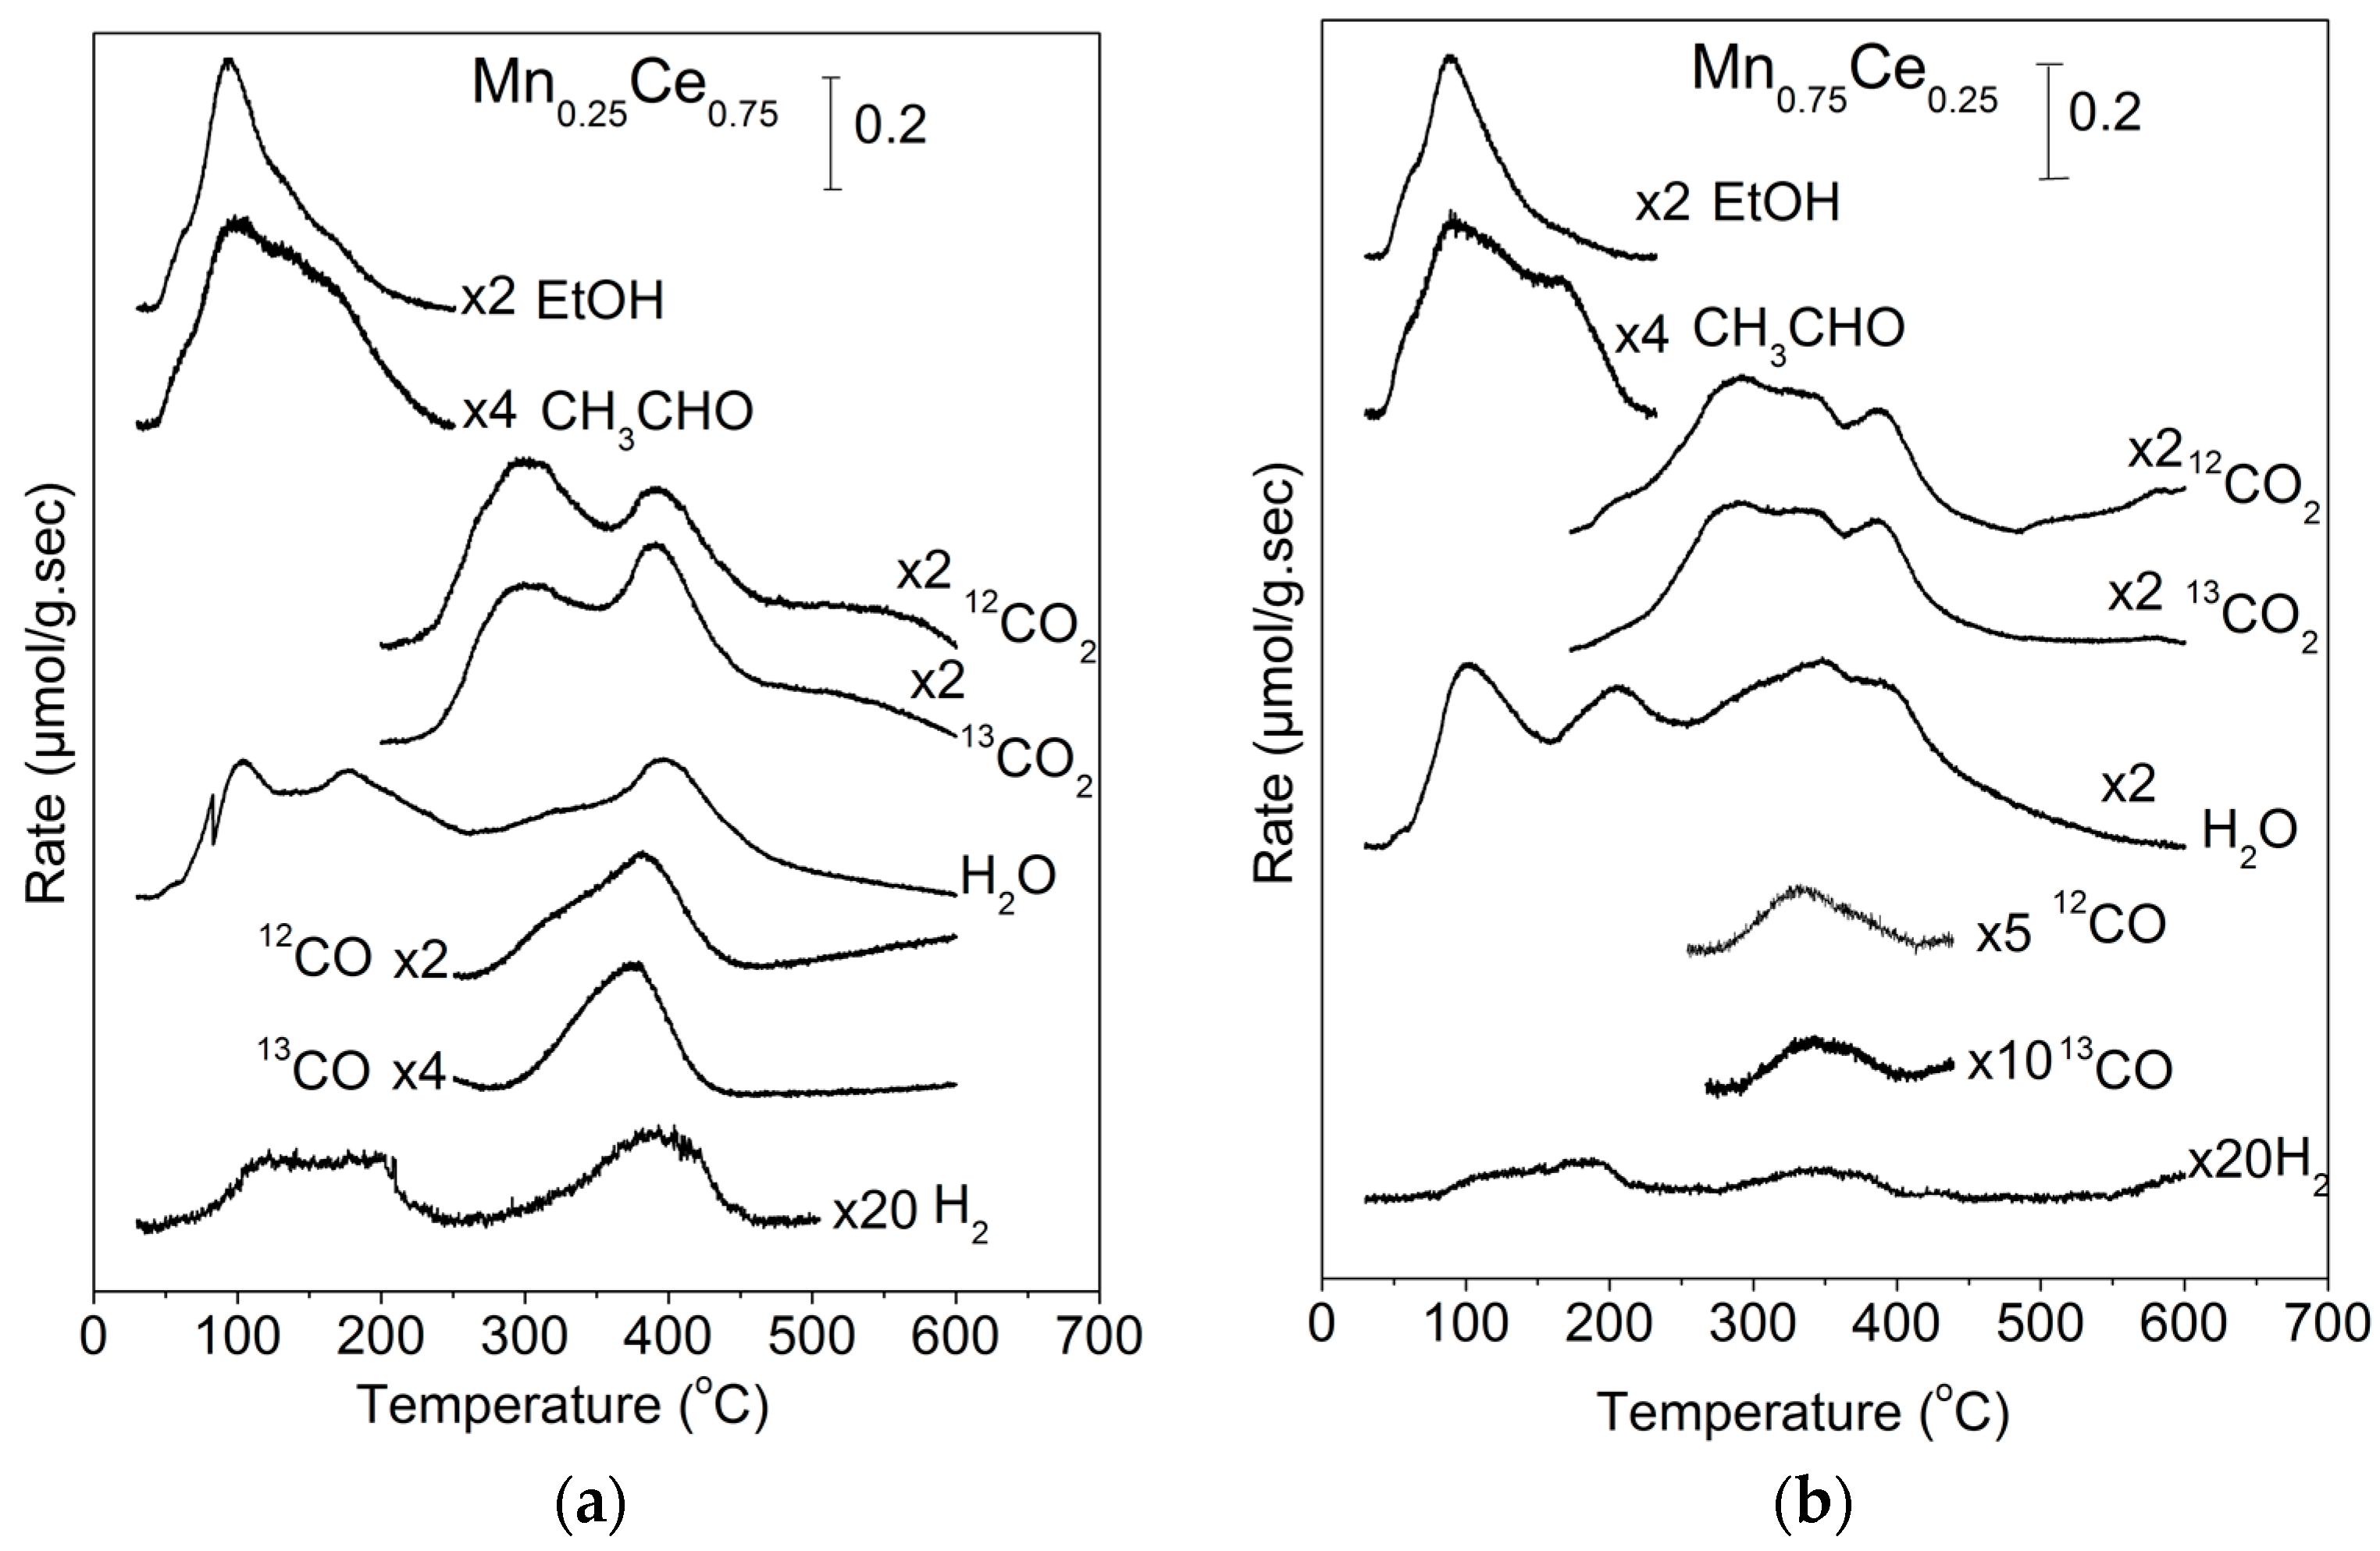
TPD profiles from Mn0.25Ce0.75 and Mn0.75Ce0.25 catalysts following 12CH313CH2OH adsorption are presented in Figure 2. The corresponding profiles from the other mixed oxide catalysts are included in the supplementary material (Figures S1–S3). Comparison of Mn0.25Ce0.75 with CeO2 shows the following: (i) a broad CO peak with a low-temperature shoulder appears on Mn0.25Ce0.75 at ~380 °C instead of the three CO peaks over CeO2; and (ii) CO2 peaks have shifted to lower temperatures on Mn0.25Ce0.75, where they appear at 280 °C and 400 °C instead of 350–400 °C and 600–700 °C for CeO2.
Table 1 presents the product distribution during ethanol-TPD over MnxCe1−x catalysts calculated on a carbon mass balance basis according to Equation (4) (EtOH(%) is given as an example):
EtOH(%) = 2yEtOH/(2yEtOH + 2yCH3CHO + yCO2 + yCO)
The amount of desorbed ethanol was 13% of the total carbon mass balance for MnOx and 28% for CeO2. In a similar fashion, acetaldehyde was 12% for MnOx and 23% for CeO2. The most important difference is in the case of CO2, which is 71% for MnOx and only 28% for CeO2, and also for CO, which is not present at all for MnOx. The amount of hydrogen is quite low in all cases (most of the hydrogen atoms leave the surface in acetaldehyde and water), but again it is considerably less for MnOx than for CeO2. The last column in Table 1 presents the percentage of CO2 produced during exposure of the catalysts to oxygen at the end of the TPD run at 700 °C. It can be observed that a minor fraction (3–4%) of carbon from adsorbed ethanol remains on the surface at the end of TPD and is titrated as CO2. Due to its small quantity, the residual carbon has not been taken into account in the carbon mass balance presented in Table 1.
2.2. Temperature-Programmed Oxidation (TPO) of Ethanol
Temperature programmed oxidation profiles of ethanol over pure CeO2 and pure MnOx are presented in Figure 3. The presence of gaseous oxygen leads to the disappearance of CO and H2, which get oxidized to CO2 and H2O, respectively, and the CO2 peaks are shifted to lower temperatures. In the case of CeO2, the CO2 profile is rather broad with a peak below 300 °C, while the CO2 peaks appeared above 350 °C in the absence of oxygen. In the case of MnOx, the CO2 peak is shifted from 340 °C to 223 °C. The profile of O2 consumption closely follows the profile of oxidation products (CO2, H2O) in the case of MnOx, but for CeO2, a higher oxygen consumption is observed in the low-temperature range (100–200 °C) and this also applies to the water profile which does not have a peak at the same region as CO2. This implies that oxidation of adsorbed ethanol takes place through an oxidative dehydrogenation step leading to water desorption and to a carbon-rich adsorbed intermediate which is oxidized to CO2 at higher temperatures.
The corresponding TPO profiles of ethanol from Mn0.25Ce0.75 and Mn0.75Ce0.25 catalysts following 12CH313CH2OH adsorption are presented in Figure 4, while the TPO profiles from the other mixed oxide catalysts are included in the supplementary material (Figures S4–S6). The profiles from the Ce-rich and the Mn-rich catalysts bear many similarities, showing 13CO2 and CO2 peaks at around 240 °C. The profiles of H2O are also similar and they consist of four peaks, from which the first three appearing below 200 °C coincide with acetaldehyde production and the fourth H2O peak coincides with CO2 production. The profile of O2 consumption coincides with the profiles of oxidation products (H2O and CO2). Table 2 presents the product distribution of carbon-containing products during ethanol-TPO over MnxCe1−x catalysts. The amounts of desorbed ethanol were lower than those in TPD experiments (Table 1), indicating that gaseous oxygen has enhanced the oxidation ability of the catalysts and ceria was again the sample with the highest percentage of desorbed ethanol. Regarding acetaldehyde, its relative amount was slightly increased in most catalysts with the exception of ceria, where it remained stable. The amount of CO2 increased considerably, especially in the case of ceria-rich catalysts. The 13CO2 peak appears invariably at a lower temperature than the 12CO2 peak by ~3 °C, indicating that the α-carbon of ethanol which is in a higher initial oxidation state gets more easily oxidized than the β-carbon.
One important indicator of the performance of the examined catalysts in the complete oxidation of ethanol is the profile of CO2 during TPO, which is produced from oxidation of organic surface species originating from adsorbed ethanol. These CO2 profiles are compiled in Figure 5 for all catalysts for ease of comparison. A vertical dotted line passing through the CO2 peak of MnOx helps in observing the trends along the composition of the catalysts. The CO2 peak over MnOx is at 223 °C. There is a gradual shift of the CO2 peak to higher temperatures with an increase of cerium content. For example, the peak is at 230 °C for Mn0.75Ce0.25 and 251 °C for Mn0.05Ce0.95. In addition, there is a minor growth of a low-temp CO2 peak at 100–120 °C. The CO2 profile over pure CeO2 is quite different than all other Mn-containing samples. It is rather broad, with CO2 already appearing at 50 °C and extending up to 350 °C. Nevertheless, the major CO2 peak is at 256 °C. Therefore, the surface species originating from preadsorbed ethanol get oxidized to CO2 with increasing difficulty with an increase of cerium content in the catalysts and MnOx is the sample with the highest intrinsic activity among all examined catalysts.
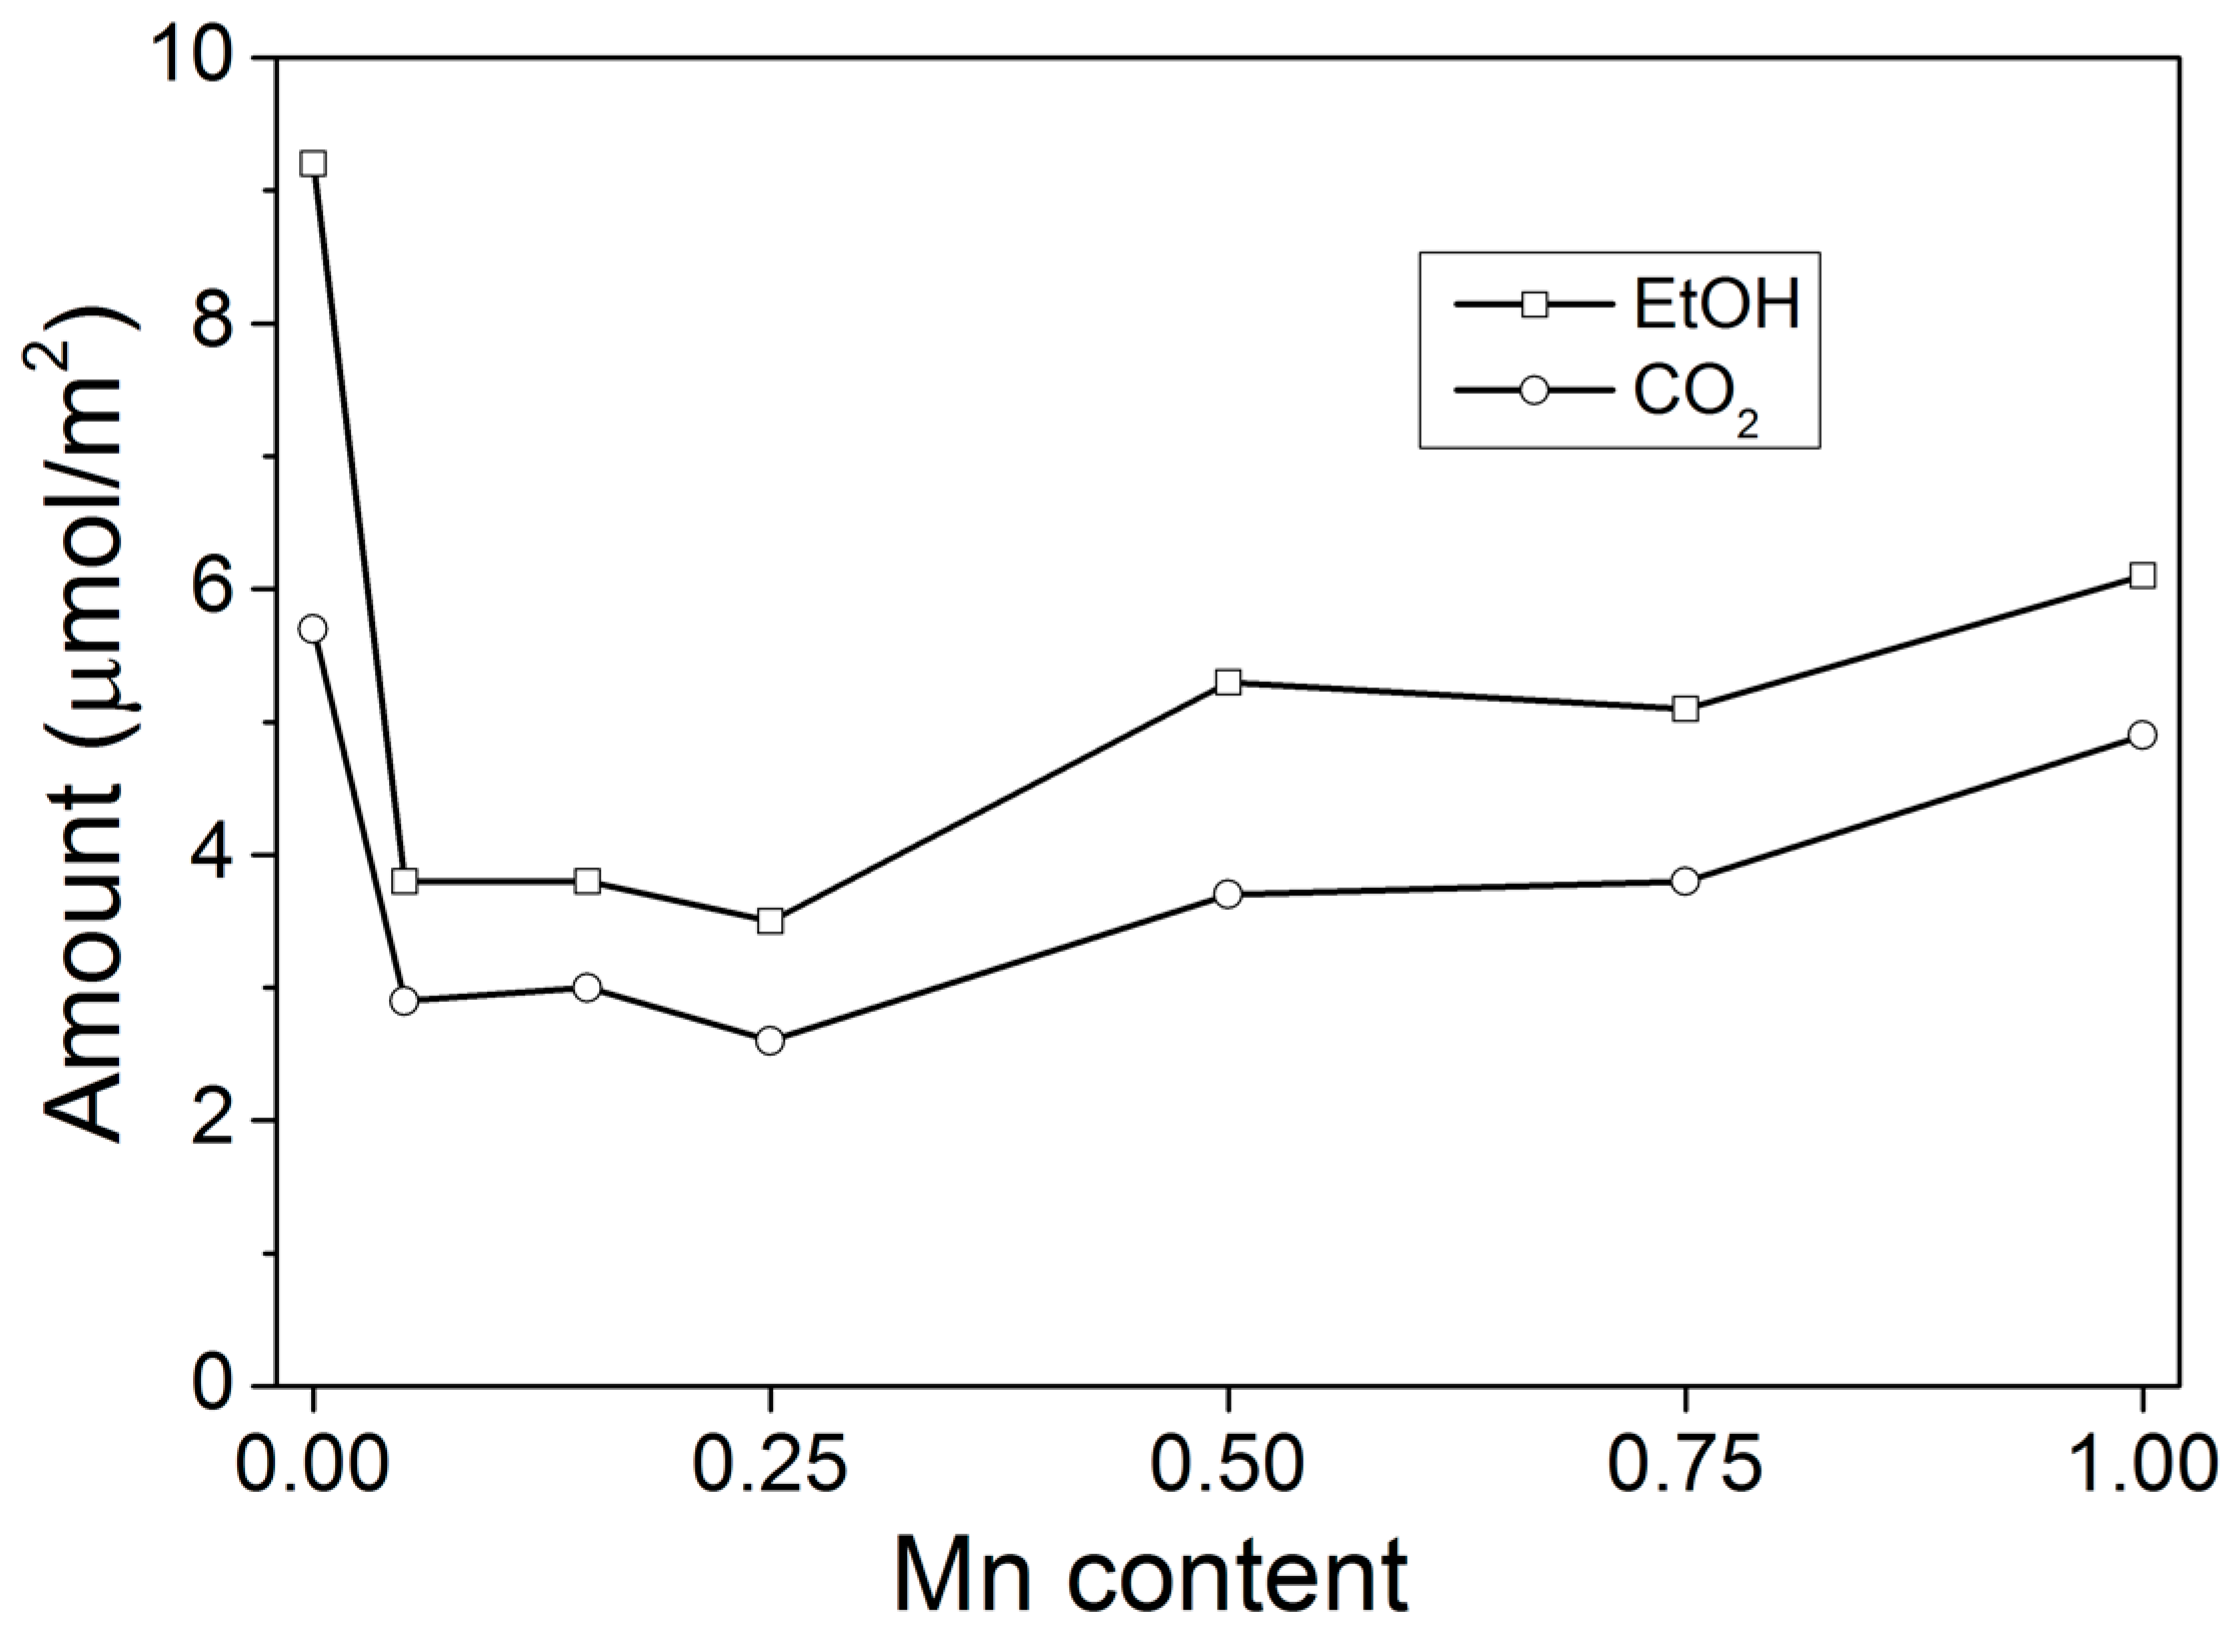
The other indicator of the catalytic performance is the concentration (or number density) of active sites on the surface. Since the studied reaction in this work is ethanol oxidation, ethanol can be taken to be the most reliable probe molecule to titrate the active sites. Thus the amount of adsorbed ethanol per unit surface area is assumed to reflect the active site concentration. An alternative option is the specific amount of CO2 produced from the oxidation of surface ethanol-derived species during TPO, since this reflects the pool of surface intermediates that get fully oxidized. Figure 6 depicts the specific amount (in μmol/m2) of adsorbed ethanol and CO2 produced during TPO as a function of the composition of MnxCe1−x catalysts. Both ethanol and CO2 have the same dependence on catalyst composition. It is evident that the concentration of active sites decreases considerably by ~50% upon the addition of Mn ions to ceria and then gradually increases with increase of Mn content. The pure oxides appear to possess a higher concentration of active sites than all the mixed oxides. Therefore, the addition of Mn ions to ceria or cerium ions to MnOx invariably leads to a decrease of the active site concentration.
3. Discussion
We have provided convincing experimental evidence that the density of active sites for ethanol oxidation is lower on mixed MnxCe1−x oxide catalysts compared to the corresponding pure oxides. In addition, the intrinsic activity of mixed oxides is lower than the one of pure MnOx and probably higher than pure CeO2. The actual performance of mixed oxide catalysts under steady state conditions, however, is superior to the pure oxides [8] and the reaction rates per mass of catalyst are two to 10 times higher on mixed oxides. This is a direct consequence of the much larger specific surface area (SSA) of the mixed oxides (38–59 m2/g depending on Mn/Ce ratio, Table 3) compared to ~5 m2/g for pure CeO2 and ~10 m2/g for pure MnOx [8]. The effect of SSA more than compensates for the unfavorable effects of the combination of the two oxides. Processing results presented in Ref. [8] in the light of the data of the present work leads to the calculation of the TOF of ethanol oxidation and the results are presented in Table 3. The TOF refers to the rate of ethanol consumption at 180 °C. It can be observed that pure MnOx is around four times more active than pure CeO2. The TOF of all mixed oxides lies in between TOFs of the pure oxides. Focusing on the Ce-rich composition (x up to 0.25) where manganese ions are incorporated into the ceria lattice forming a solid solution [8,27,28], it is evident that the addition of Mn ions leads to doubling of the TOF, but also to halving of the concentration of the active sites. At the same time, the SSA of Ce-rich mixed oxides is almost one order of magnitude higher than the one of pure CeO2, indicating that the presence of manganese ions is beneficial for the containment of crystal growth during catalyst synthesis and preservation of the nanostructure [8,28,29]. “Dilution” of manganese oxide with ceria, on the other hand, leads to a decrease of intrinsic activity by 50% as well as to a decrease of the concentration of active sites, but again to an increase of SSA.
It is not an easy task to provide an explanation for the observed behavior of mixed MnxCe1−x oxides compared to pure CeO2 or MnOx. Trovarelli and Llorca have stressed the importance of size, shape, and degree of exposure of specific facets of ceria-based particles on their catalytic performance [30]. The distribution of specific nanofacets of ceria depends on its size and shape and leads to different reactivity in CO adsorption, for example [31]. Li et al. [14] have found that MnOx-CeO2 nanocubes exposing the {100} plane are twice as active in ethanol oxidation as MnOx-CeO2 nanorods primarily exposing the {111} plane. Therefore, it could be postulated that the observed behavior of mixed MnxCe1−x oxides in the present work is due to the different exposure of facets induced by the addition of manganese ions into ceria and the accompanying effect of smaller crystallite size of the mixed oxide samples. A similar trend concerning the effect of composition of MnxCe1−x catalysts on SSA, reaction rate, and specific activity has been observed by Chen et al. in the case of phenol wet oxidation [28]. In a broader context, it is a pity that data on differential reaction rates, specific reaction rates, and intrinsic activity (TOF) are scarcely reported in the relevant literature of ceria-based materials applied in VOC oxidation. Typically, the reported catalytic experiments consist of conversion curves as a function of reaction temperature and the indicators of catalytic activity are the T10, T50, and T90 temperatures.
4. Materials and Methods
MnOx-CeO2 catalysts were prepared by the urea combustion method. Details of catalyst preparation can be found elsewhere [8]. For ease of reference, the catalysts are denoted as MnxCe1−x, where x is the Mn/(Mn + Ce) atomic ratio. Pure MnOx and CeO2 samples were also prepared with the same method.
TPD and TPO experiments were performed in a fixed-bed reactor system interfaced to an on-line mass spectrometer (Omnistar, Pfeiffer Vacuum GmbH, Asslar, Germany). Isotopically-labelled ethanol, namely 12CH313CH2OH (obtained from Sigma-Aldrich Chemie GmbH, Taufkirchen, Germany), was used in the present work.
The number of catalysts employed in the experiments was varied in order to keep the sample surface area loaded in the reactor fixed at 2.5 m2. The corresponding amounts varied between 42 mg for Mn0.05Ce0.95 (sample with highest specific surface area) and 520 mg for CeO2 (sample with lowest specific surface area). Table 3 presents the specific surface areas for all examined catalysts. Prior to each TPD or TPO run, the catalyst sample was treated under a flow of 20% O2/He at 550 °C for half an hour and was subsequently cooled to room temperature under He flow. This procedure was found to give reproducible results. Ethanol was adsorbed on the catalyst surface at room temperature from a flow of He containing ~1600 ppm of ethanol. The feed also contained 2% Ar as an inert tracer. Following completion of ethanol adsorption, as indicated by the stable signal of ethanol in the mass spectrometer, the catalyst was purged with helium to remove any weakly adsorbed ethanol from the surface, as well as to purge ethanol vapors from the reactor and lines. Then, temperature programming was commenced with a heating rate of 10 °C min−1 up to 600 °C. Helium was used as the carrier gas for TPD and a 1%O2/He mixture for TPO, with a flow rate of 50 cm3 min−1 in both cases. At the end of the TPD runs and while the catalyst was maintained at 600 °C, the flow was switched to a 1% O2/He mixture in order to titrate possible carbonaceous residues on the catalyst originating from ethanol. Preliminary TPD and TPO experiments were conducted on all catalysts in order to identify the compounds appearing in the gas phase during the run. This was accomplished by continuous scanning of mass numbers (m/z) from 1 to 100 during heating. Ethanol and acetaldehyde were the only organic molecules detected during TPD and TPO. Corrections for cracking in the mass spectrometer were made for each product, and for some species, multiple corrections were necessary. Each species signal, except for those containing 13C, was calibrated with the use of gaseous mixtures of a known composition. Products containing 13C were calibrated by using the equivalent 12C compounds.
5. Conclusions
The interaction of ethanol with MnxCe1−x catalysts has been investigated with TPD and TPO techniques. It has been found that the addition of Mn ions to ceria leads to:
- A decrease of the concentration of active sites, on the hypothesis that the amount of adsorbed ethanol and produced CO2 during TPO are proper probes for counting these sites
- Doubling of TOF for ethanol oxidation.
On the other hand, the addition of cerium ions to MnOx leads to:
- A decrease of the concentration of active sites
- A decrease of TOF for ethanol oxidation by ~50%.
The significantly higher SSA of the mixed oxides more than compensates for the observed variations in intrinsic activity and density of active sites.
Supplementary Materials
The following are available online at www.mdpi.com/2073-4344/7/11/339/s1, Figure S1: TPD profiles following 12CH313CH2OH adsorption on Mn0.05Ce0.95 catalyst, Figure S2: TPD profiles following 12CH313CH2OH adsorption on Mn0.15Ce0.85 catalyst, Figure S3: TPD profiles following 12CH313CH2OH adsorption on Mn0.50Ce0.50 catalyst, Figure S4: TPO profiles following 12CH313CH2OH adsorption on Mn0.05Ce0.95 catalyst, Figure S5: TPO profiles following 12CH313CH2OH adsorption on Mn0.15Ce0.85 catalyst, Figure S6: TPO profiles following 12CH313CH2OH adsorption on Mn0.50Ce0.50 catalyst.
Author Contributions
D.D. performed the experiments and analyzed the data; T.I. wrote the paper.
Conflicts of Interest
The authors declare no conflict of interest.
References
- Spivey, J.J. Complete catalytic oxidation of volatile organics. Ind. Eng. Chem. Res. 1987, 27, 2165–2180. [Google Scholar] [CrossRef]
- Cordi, E.M.; Falconer, J.L. Oxidation of volatile organic compounds on Al2O3, Pd/Al2O3, and PdO/Al2O3 catalysts. J. Catal. 1996, 162, 104–117. [Google Scholar] [CrossRef]
- Liotta, L.F. Catalytic oxidation of volatile organic compounds on supported noble metals. Appl. Catal. B Environ. 2010, 100, 403–412. [Google Scholar] [CrossRef]
- Avgouropoulos, G.; Oikonomopoulos, E.; Kanistras, D.; Ioannides, T. Complete oxidation of ethanol over alkali-promoted Pt/Al2O3 catalysts. Appl. Catal. B Environ. 2006, 65, 62–69. [Google Scholar] [CrossRef]
- Larsson, P.O.; Andersson, A. Complete oxidation of CO, ethanol, and ethyl acetate over copper oxide supported on Titania and ceria modified Titania. J. Catal. 1998, 179, 72–89. [Google Scholar] [CrossRef]
- Kamal, M.S.; Shaikh, A.; Razzak, S.A.; Hossain, M.M. Catalytic oxidation of volatile organic compounds (VOCs)—A review. Atmos. Environ. 2016, 140, 117–134. [Google Scholar] [CrossRef]
- Xu, H.; Yan, N.; Qu, Z.; Liu, W.; Mei, J.; Huang, W.; Zhao, S. Gaseous heterogeneous catalytic reactions over Mn-Based Oxides for environmental applications: A critical review. Environ. Sci. Technol. 2017, 51, 8879–8892. [Google Scholar] [CrossRef] [PubMed]
- Delimaris, D.; Ioannides, T. VOC oxidation over MnOx-CeO2 catalysts prepared by a combustion method. Appl. Catal. B Environ. 2008, 84, 303–312. [Google Scholar] [CrossRef]
- Lin, P.; Luo, M.-F.; Xin, Q.; Sun, G.-Q. The mechanism studies of ethanol oxidation on PdO catalysts by TPSR techniques. Catal. Lett. 2004, 93, 139–144. [Google Scholar] [CrossRef]
- Idriss, H.; Diagne, C.; Hindermann, J.P.; Kiennemann, A.; Barteau, M.A. Reactions of acetaldehyde on CeO2 and CeO2-Supported catalysts. J. Catal. 1995, 155, 219–237. [Google Scholar] [CrossRef]
- Yee, A.; Morrison, S.J.; Idriss, H. A study of the reactions of ethanol on CeO2 and Pd/CeO2 by steady state reactions, temperature programmed desorption, and in situ FT-IR. J. Catal. 1999, 186, 279–295. [Google Scholar] [CrossRef]
- Yee, A.; Morrison, S.J.; Idriss, H. A study of ethanol reactions over Pt/CeO2 by temperature-programmed desorption and in situ FT-IR spectroscopy: Evidence of benzene formation. J. Catal. 2000, 191, 30–45. [Google Scholar] [CrossRef]
- De Lima, S.M.; da Silva, A.M.; da Costa, L.O.O.; Graham, U.M.; Jacobs, G.; Davis, B.H.; Mattos, L.V.; Noronha, F.B. Study of catalyst deactivation and reaction mechanism of steam reforming, partial oxidation, and oxidative steam reforming of ethanol over Co/CeO2 catalyst. J. Catal. 2009, 268, 268–281. [Google Scholar] [CrossRef]
- Li, H.; Qi, G.; Tana; Zhang, X.; Li, W.; Shen, W. Morphological impact of manganese–cerium oxides on ethanol oxidation. Catal. Sci. Technol. 2011, 1, 1677–1682. [Google Scholar] [CrossRef]
- Li, H.; Qi, G.; Tana; Zhang, X.; Huang, X.; Li, W.; Shen, W. Low-temperature oxidation of ethanol over a Mn0.6Ce0.4O2 mixed oxide. Appl. Catal. B Environ. 2011, 103, 54–61. [Google Scholar] [CrossRef]
- Liu, G.; Yue, R.; Jia, Y.; Ni, Y.; Yang, J.; Liu, H.; Wang, Z.; Wu, X.; Chen, Y. Catalytic oxidation of benzene over Ce–Mn oxides synthesized by flame spray pyrolysis. Particuology 2013, 11, 454–459. [Google Scholar] [CrossRef]
- Liao, Y.; Fu, M.; Chen, L.; Wu, J.; Huang, B.; Ye, D. Catalytic oxidation of toluene over nanorod-structured Mn–Ce mixed oxides. Catal. Today 2013, 216, 220–228. [Google Scholar] [CrossRef]
- Tang, W.; Wu, X.; Liu, G.; Li, S.; Li, D.; Li, W.; Chen, Y. Preparation of hierarchical layer-stacking Mn-Ce composite oxide for catalytic total oxidation of VOCs. J. Rare Earths 2015, 33, 62–69. [Google Scholar] [CrossRef]
- Tang, W.; Wu, X.; Li, S.; Li, W.; Chen, Y. Porous Mn-Co mixed oxide nanorod as a novel catalyst with enhanced catalytic activity for removal of VOCs. Catal. Commun. 2014, 56, 134–138. [Google Scholar] [CrossRef]
- Picasso, G.; Cruz, R.; del Rosario Sun Kou, M. Preparation by co-precipitation of Ce-Mn based catalysts for combustion of n-hexane. Mater. Res. Bull. 2015, 70, 621–632. [Google Scholar] [CrossRef]
- Chojnacka, A.; Molenda, M.; Chmielarz, L.; Piwowarska, Z.; Gajewska, M.; Dudek, B.; Dziembaj, R. Ceria based novel nanocomposites catalysts MnxCe1−x O2/α-Al2O3 for low-temperature combustion of methanol. Catal. Today 2015, 257, 104–110. [Google Scholar] [CrossRef]
- Zhao, H.; Zhou, X.; Wang, M.; Xie, Z.; Chen, H.; Shi, J. Highly active MnOx–CeO2 catalyst for diesel soot combustion. RSC Adv. 2017, 7, 3233–3239. [Google Scholar] [CrossRef]
- Colman-Lerner, E.; Peluso, M.A.; Sambeth, J.; Thomas, H. Cerium, manganese and cerium/manganese ceramic monolithic catalysts. Study of VOCs and PM removal. J. Rare Earths 2016, 34, 675–682. [Google Scholar] [CrossRef]
- Pintos, D.G.; Juan, A.; Irigoyen, B. Mn-Doped CeO2: DFT+U Study of a Catalyst for Oxidation Reactions. J. Phys. Chem. C 2013, 117, 18063–18073. [Google Scholar] [CrossRef]
- Vannice, M.A. Kinetics of Catalytic Reactions, 1st ed.; Springer: New York, NY, USA, 2005; pp. 6–8. ISBN 978-1-4419-3758-2. [Google Scholar]
- Sheng, P.-Y.; Bowmaker, G.A.; Idriss, H. The Reactions of Ethanol over Au/CeO2. Appl. Catal. A Gen. 2004, 261, 171–181. [Google Scholar] [CrossRef]
- Machida, M.; Uto, M.; Kurogi, D.; Kijima, T. MnOx-CeO2 Binary Oxides for Catalytic NOx Sorption at Low Temperatures. Sorptive Removal of NOx. Chem. Mater. 2000, 12, 3158–3164. [Google Scholar] [CrossRef]
- Chen, H.; Sayari, A.; Adnot, A.; Larachi, F. Composition–activity effects of Mn-Ce-O composites on phenol catalytic wet oxidation. Appl. Catal. B Environ. 2001, 32, 195–204. [Google Scholar] [CrossRef]
- Picasso, G.; Gutiérrez, M.; Pina, M.P.; Herguido, J. Preparation and characterization of Ce-Zr and Ce-Mn based oxides for n-hexane combustion: Application to catalytic membrane reactors. Chem. Eng. J. 2007, 126, 119–130. [Google Scholar] [CrossRef]
- Trovarelli, A.; Llorca, J. Ceria Catalysts at Nanoscale: How Do Crystal Shapes Shape Catalysis? ACS Catal. 2017, 7, 4716–4735. [Google Scholar] [CrossRef]
- Yang, C.; Yu, X.; Heißler, S.; Nefedov, A.; Colussi, S.; Llorca, J.; Trovarelli, A.; Wang, Y.; Wöll, C. Surface Faceting and Reconstruction of Ceria Nanoparticles. Angew. Chem. Int. Ed. 2017, 56, 375–379. [Google Scholar] [CrossRef] [PubMed]
Figure 1.
(a) TPD profiles following 12CH313CH2OH adsorption on pure CeO2, (b) TPD profiles following 12CH313CH2OH adsorption on pure MnOx.
Figure 1.
(a) TPD profiles following 12CH313CH2OH adsorption on pure CeO2, (b) TPD profiles following 12CH313CH2OH adsorption on pure MnOx.
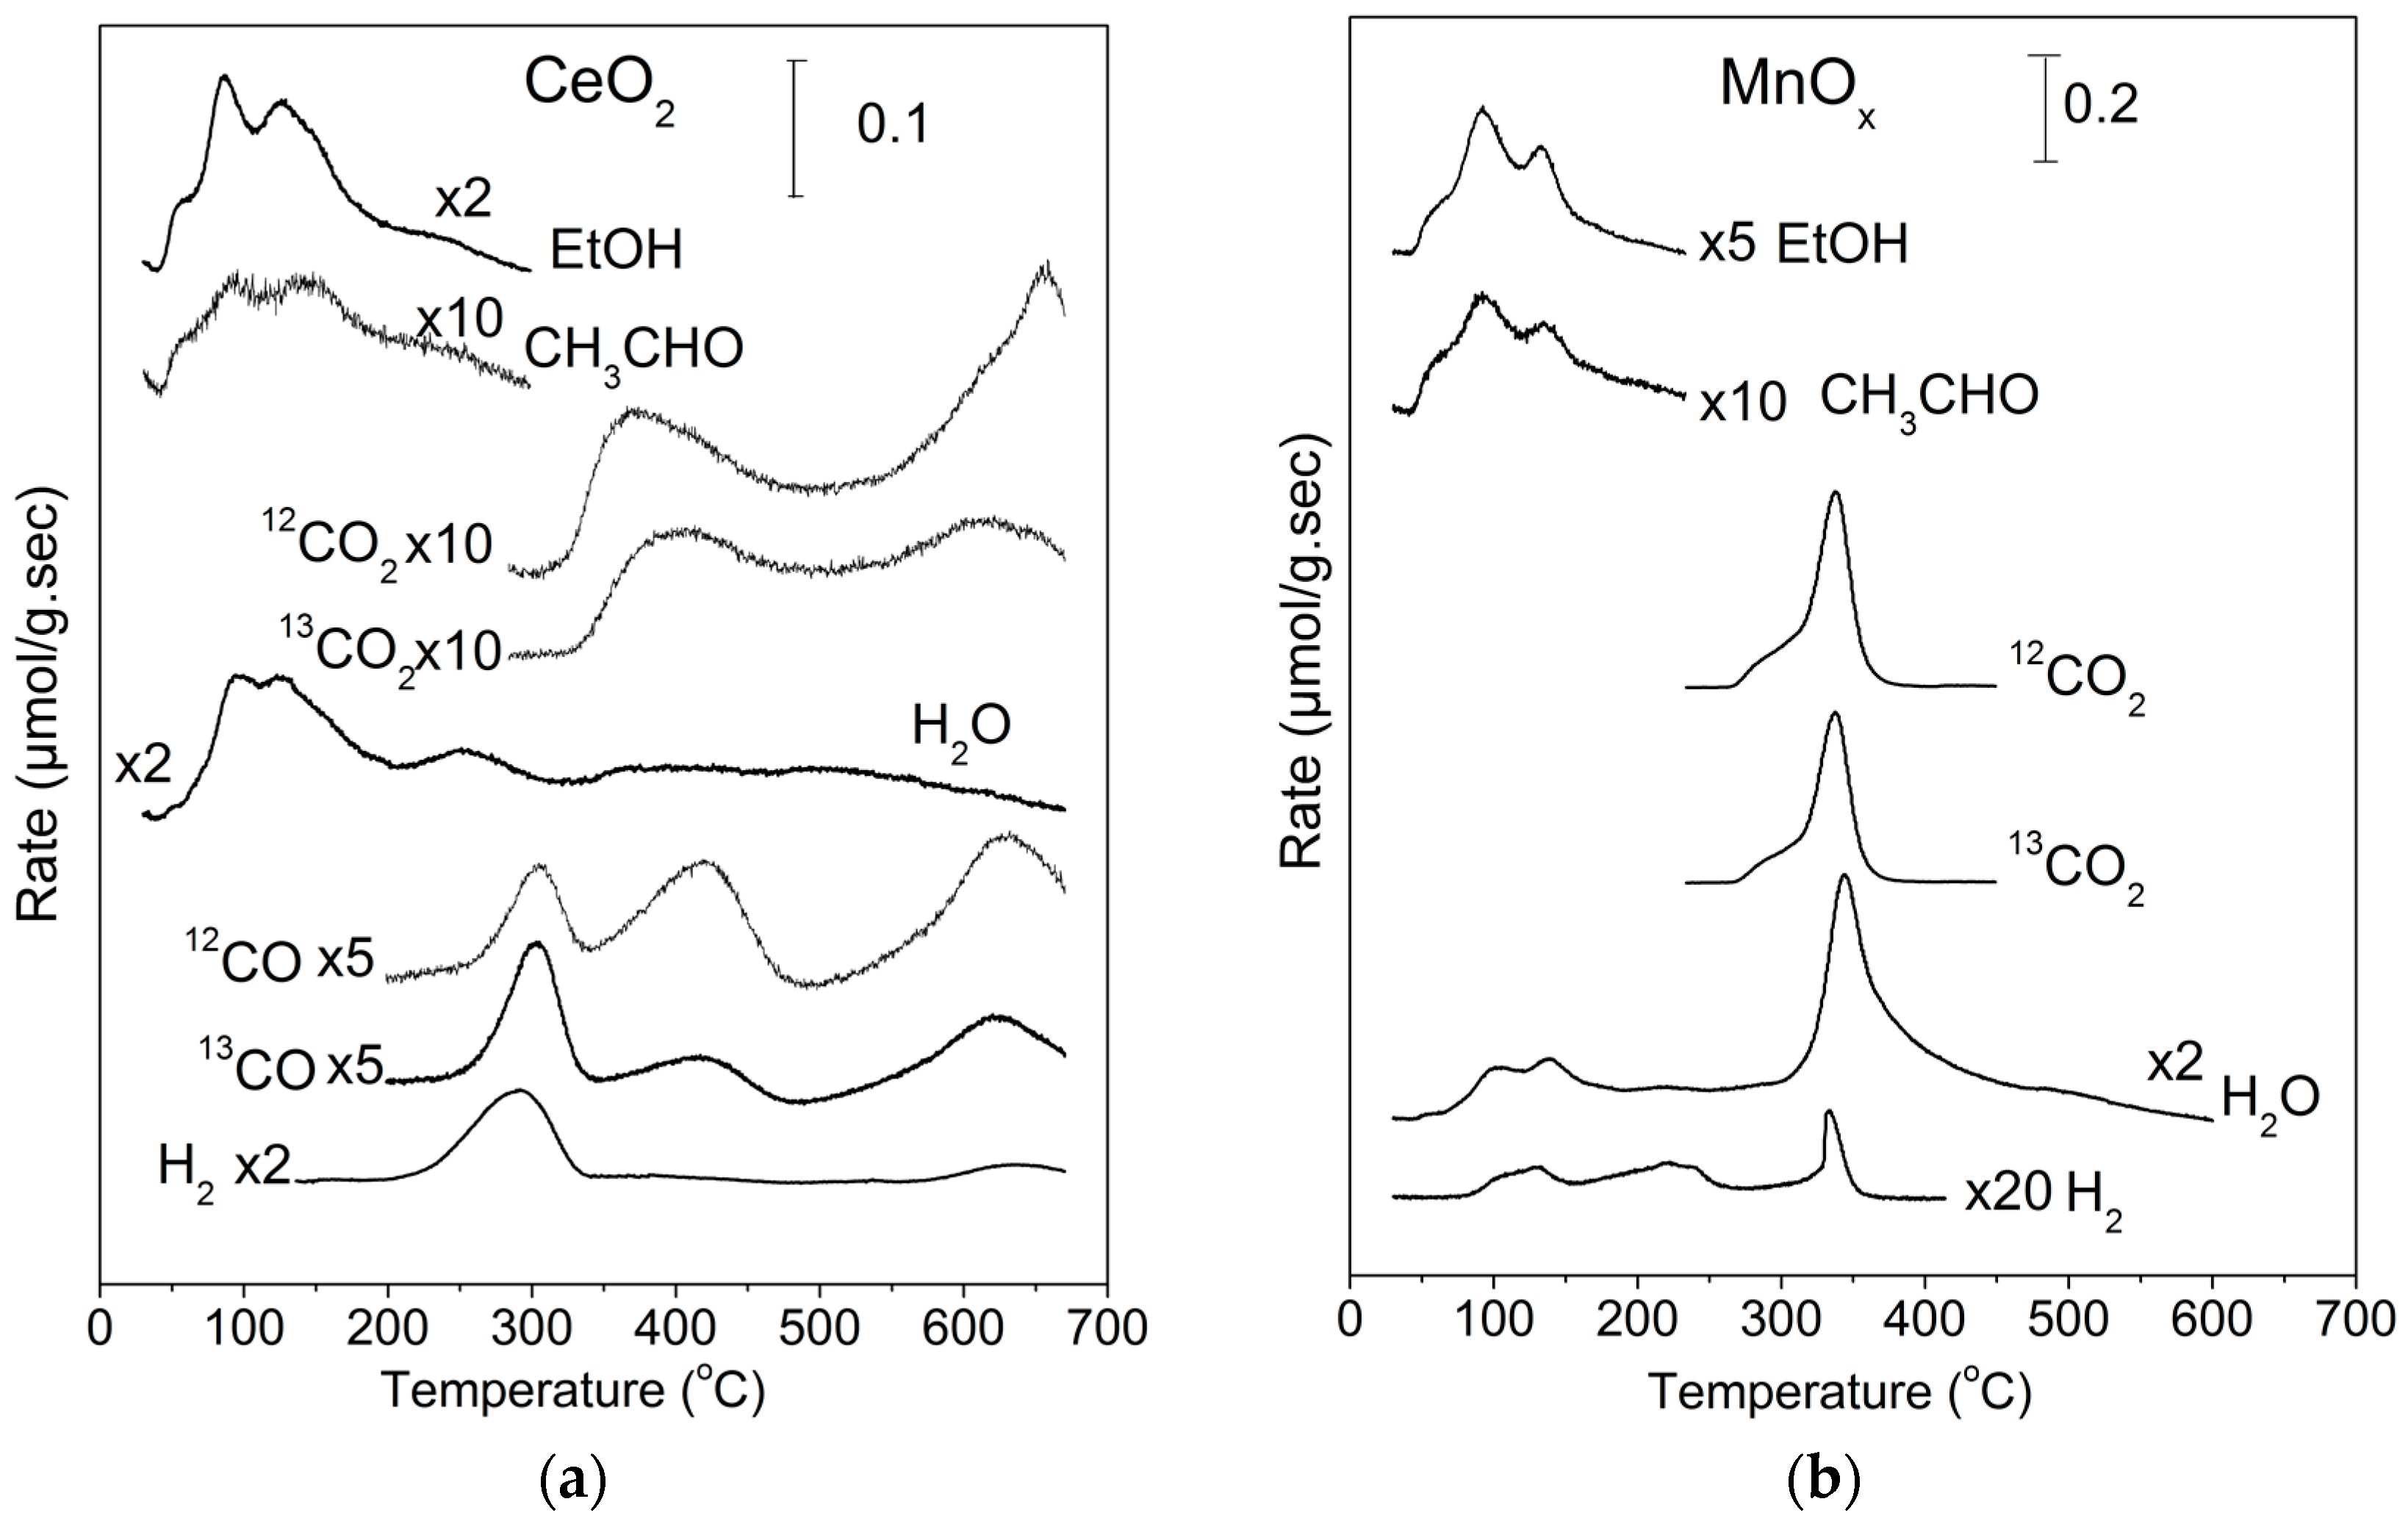
Figure 2.
(a) TPD profiles following 12CH313CH2OH adsorption on Mn0.25Ce0.75 catalyst, (b) TPD profiles following 12CH313CH2OH adsorption on Mn0.75Ce0.25 catalyst.
Figure 2.
(a) TPD profiles following 12CH313CH2OH adsorption on Mn0.25Ce0.75 catalyst, (b) TPD profiles following 12CH313CH2OH adsorption on Mn0.75Ce0.25 catalyst.

Figure 3.
(a) TPO profiles following 12CH313CH2OH adsorption on pure CeO2, (b) TPO profiles following 12CH313CH2OH adsorption on pure MnOx.
Figure 3.
(a) TPO profiles following 12CH313CH2OH adsorption on pure CeO2, (b) TPO profiles following 12CH313CH2OH adsorption on pure MnOx.
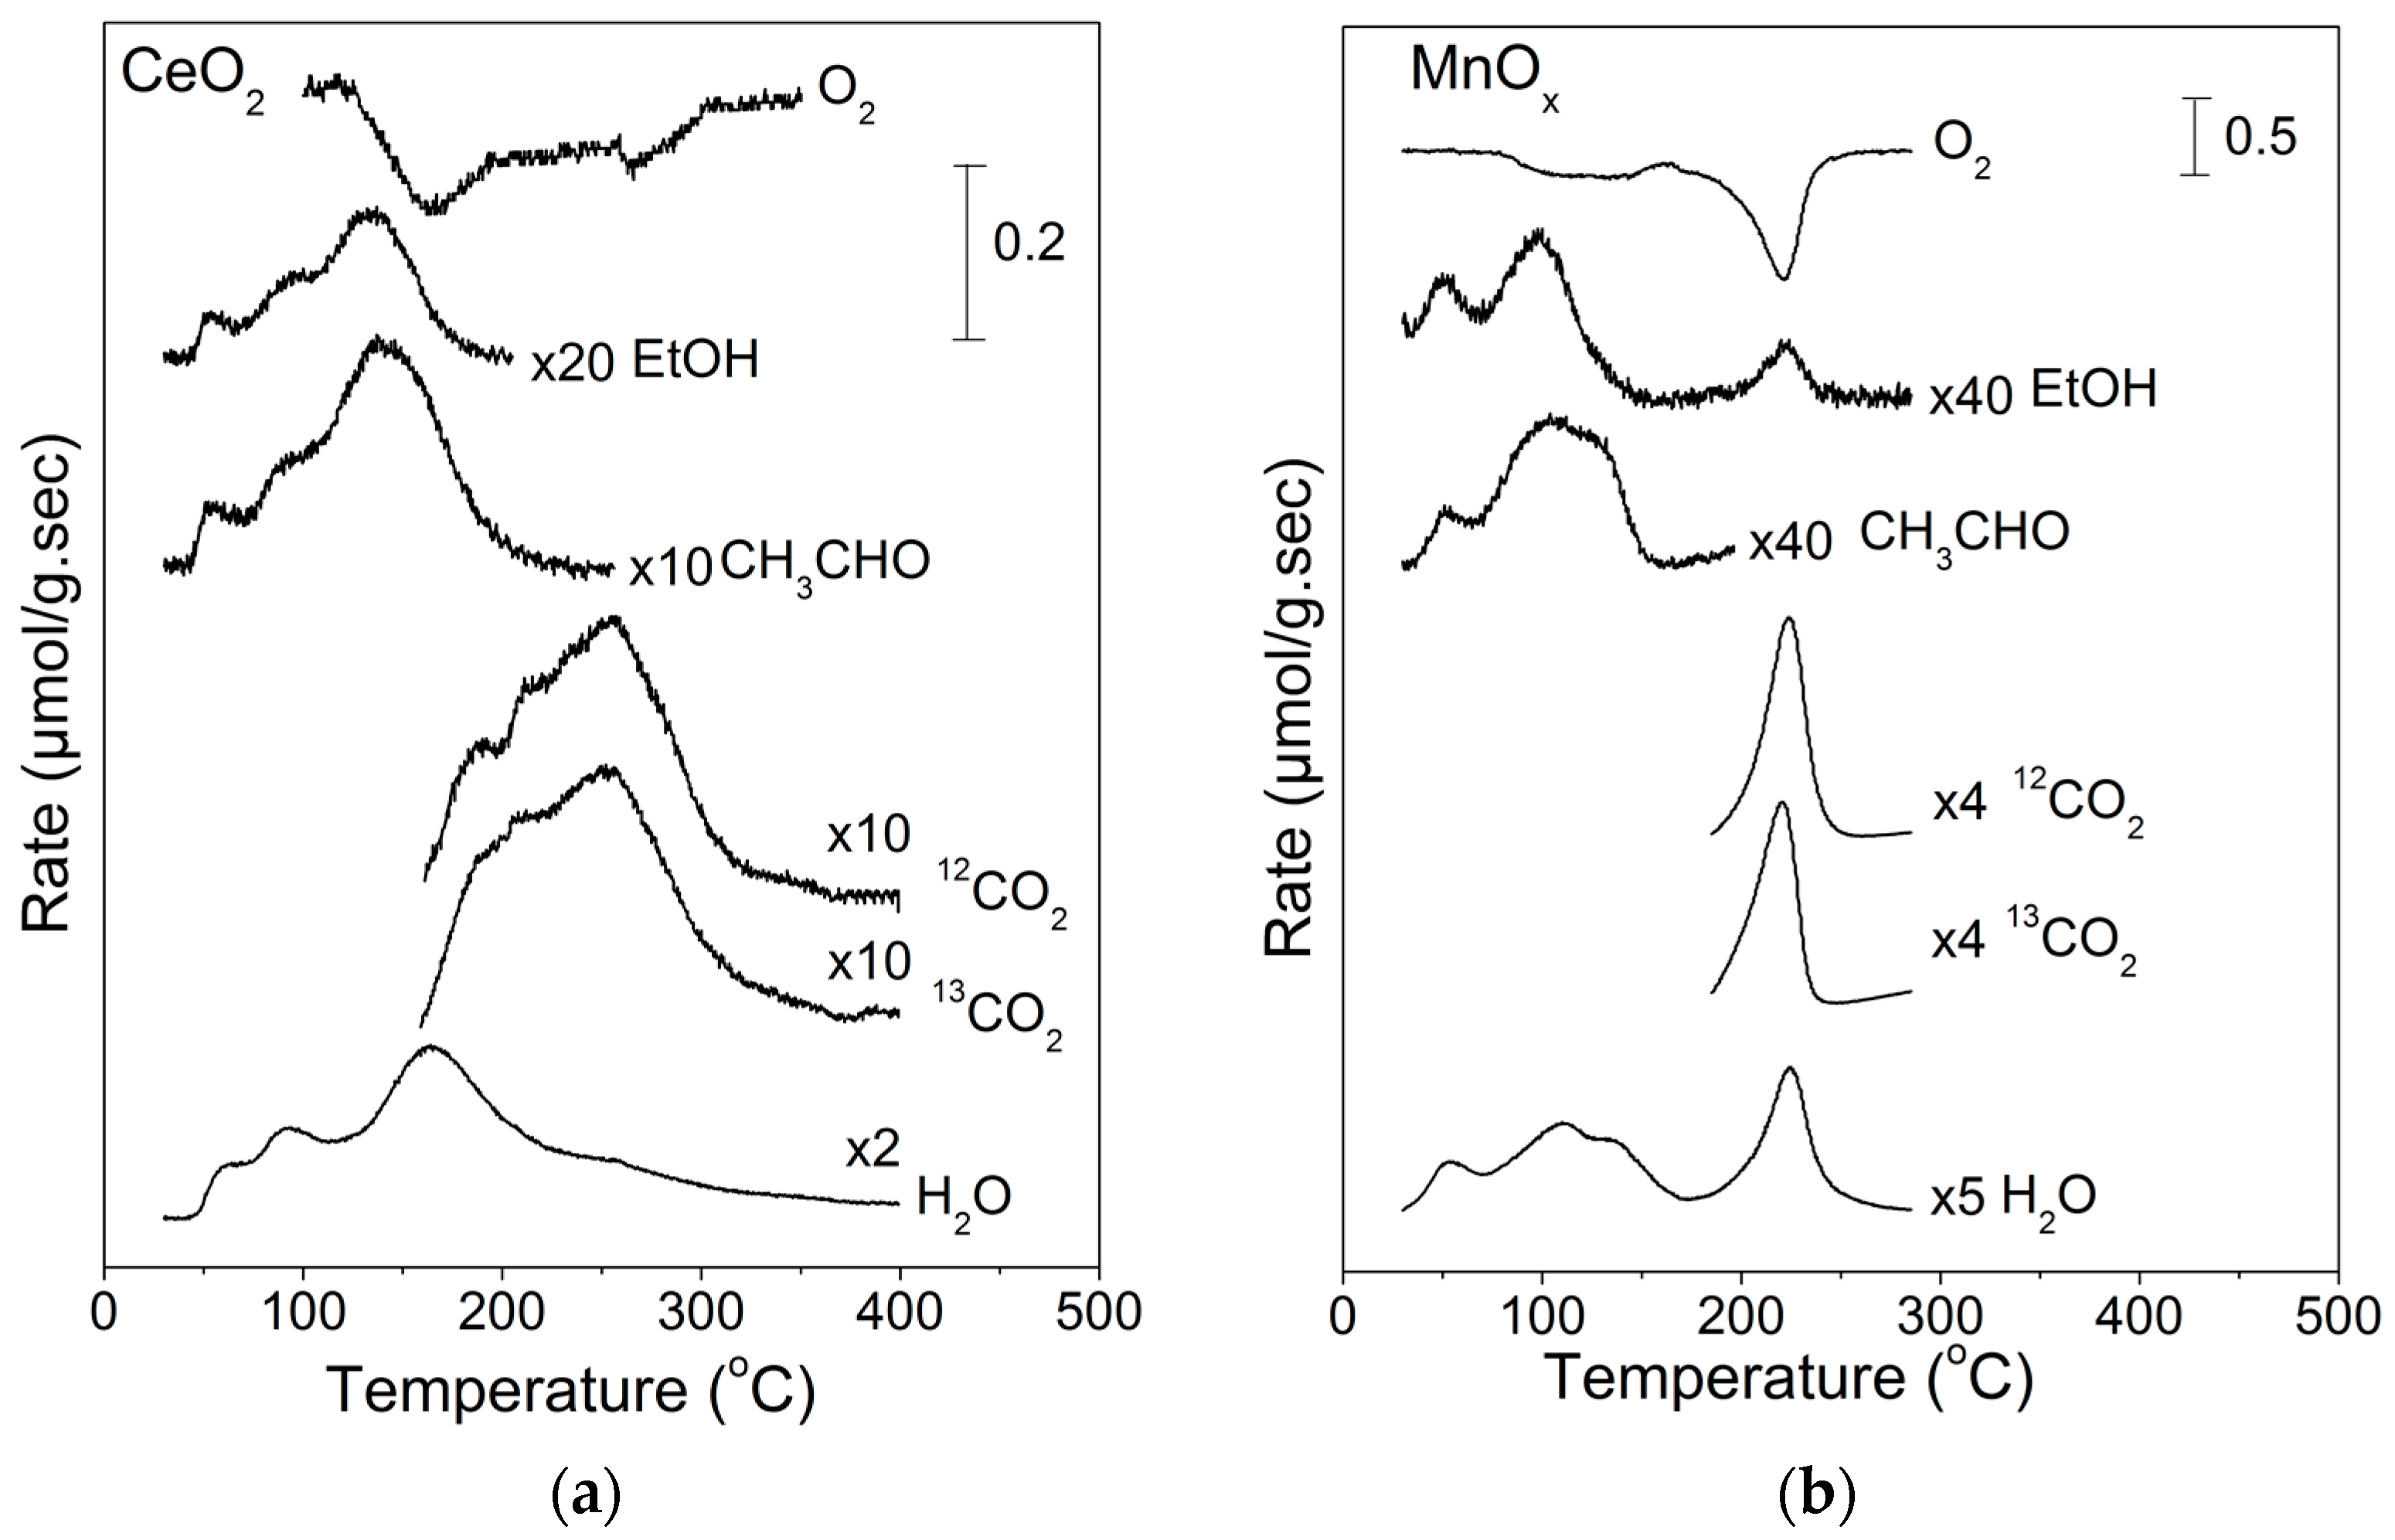
Figure 4.
(a) TPO profiles following 12CH313CH2OH adsorption on Mn0.25Ce0.75 catalyst, (b) TPO profiles following 12CH313CH2OH adsorption on Mn0.75Ce0.25 catalyst.
Figure 4.
(a) TPO profiles following 12CH313CH2OH adsorption on Mn0.25Ce0.75 catalyst, (b) TPO profiles following 12CH313CH2OH adsorption on Mn0.75Ce0.25 catalyst.
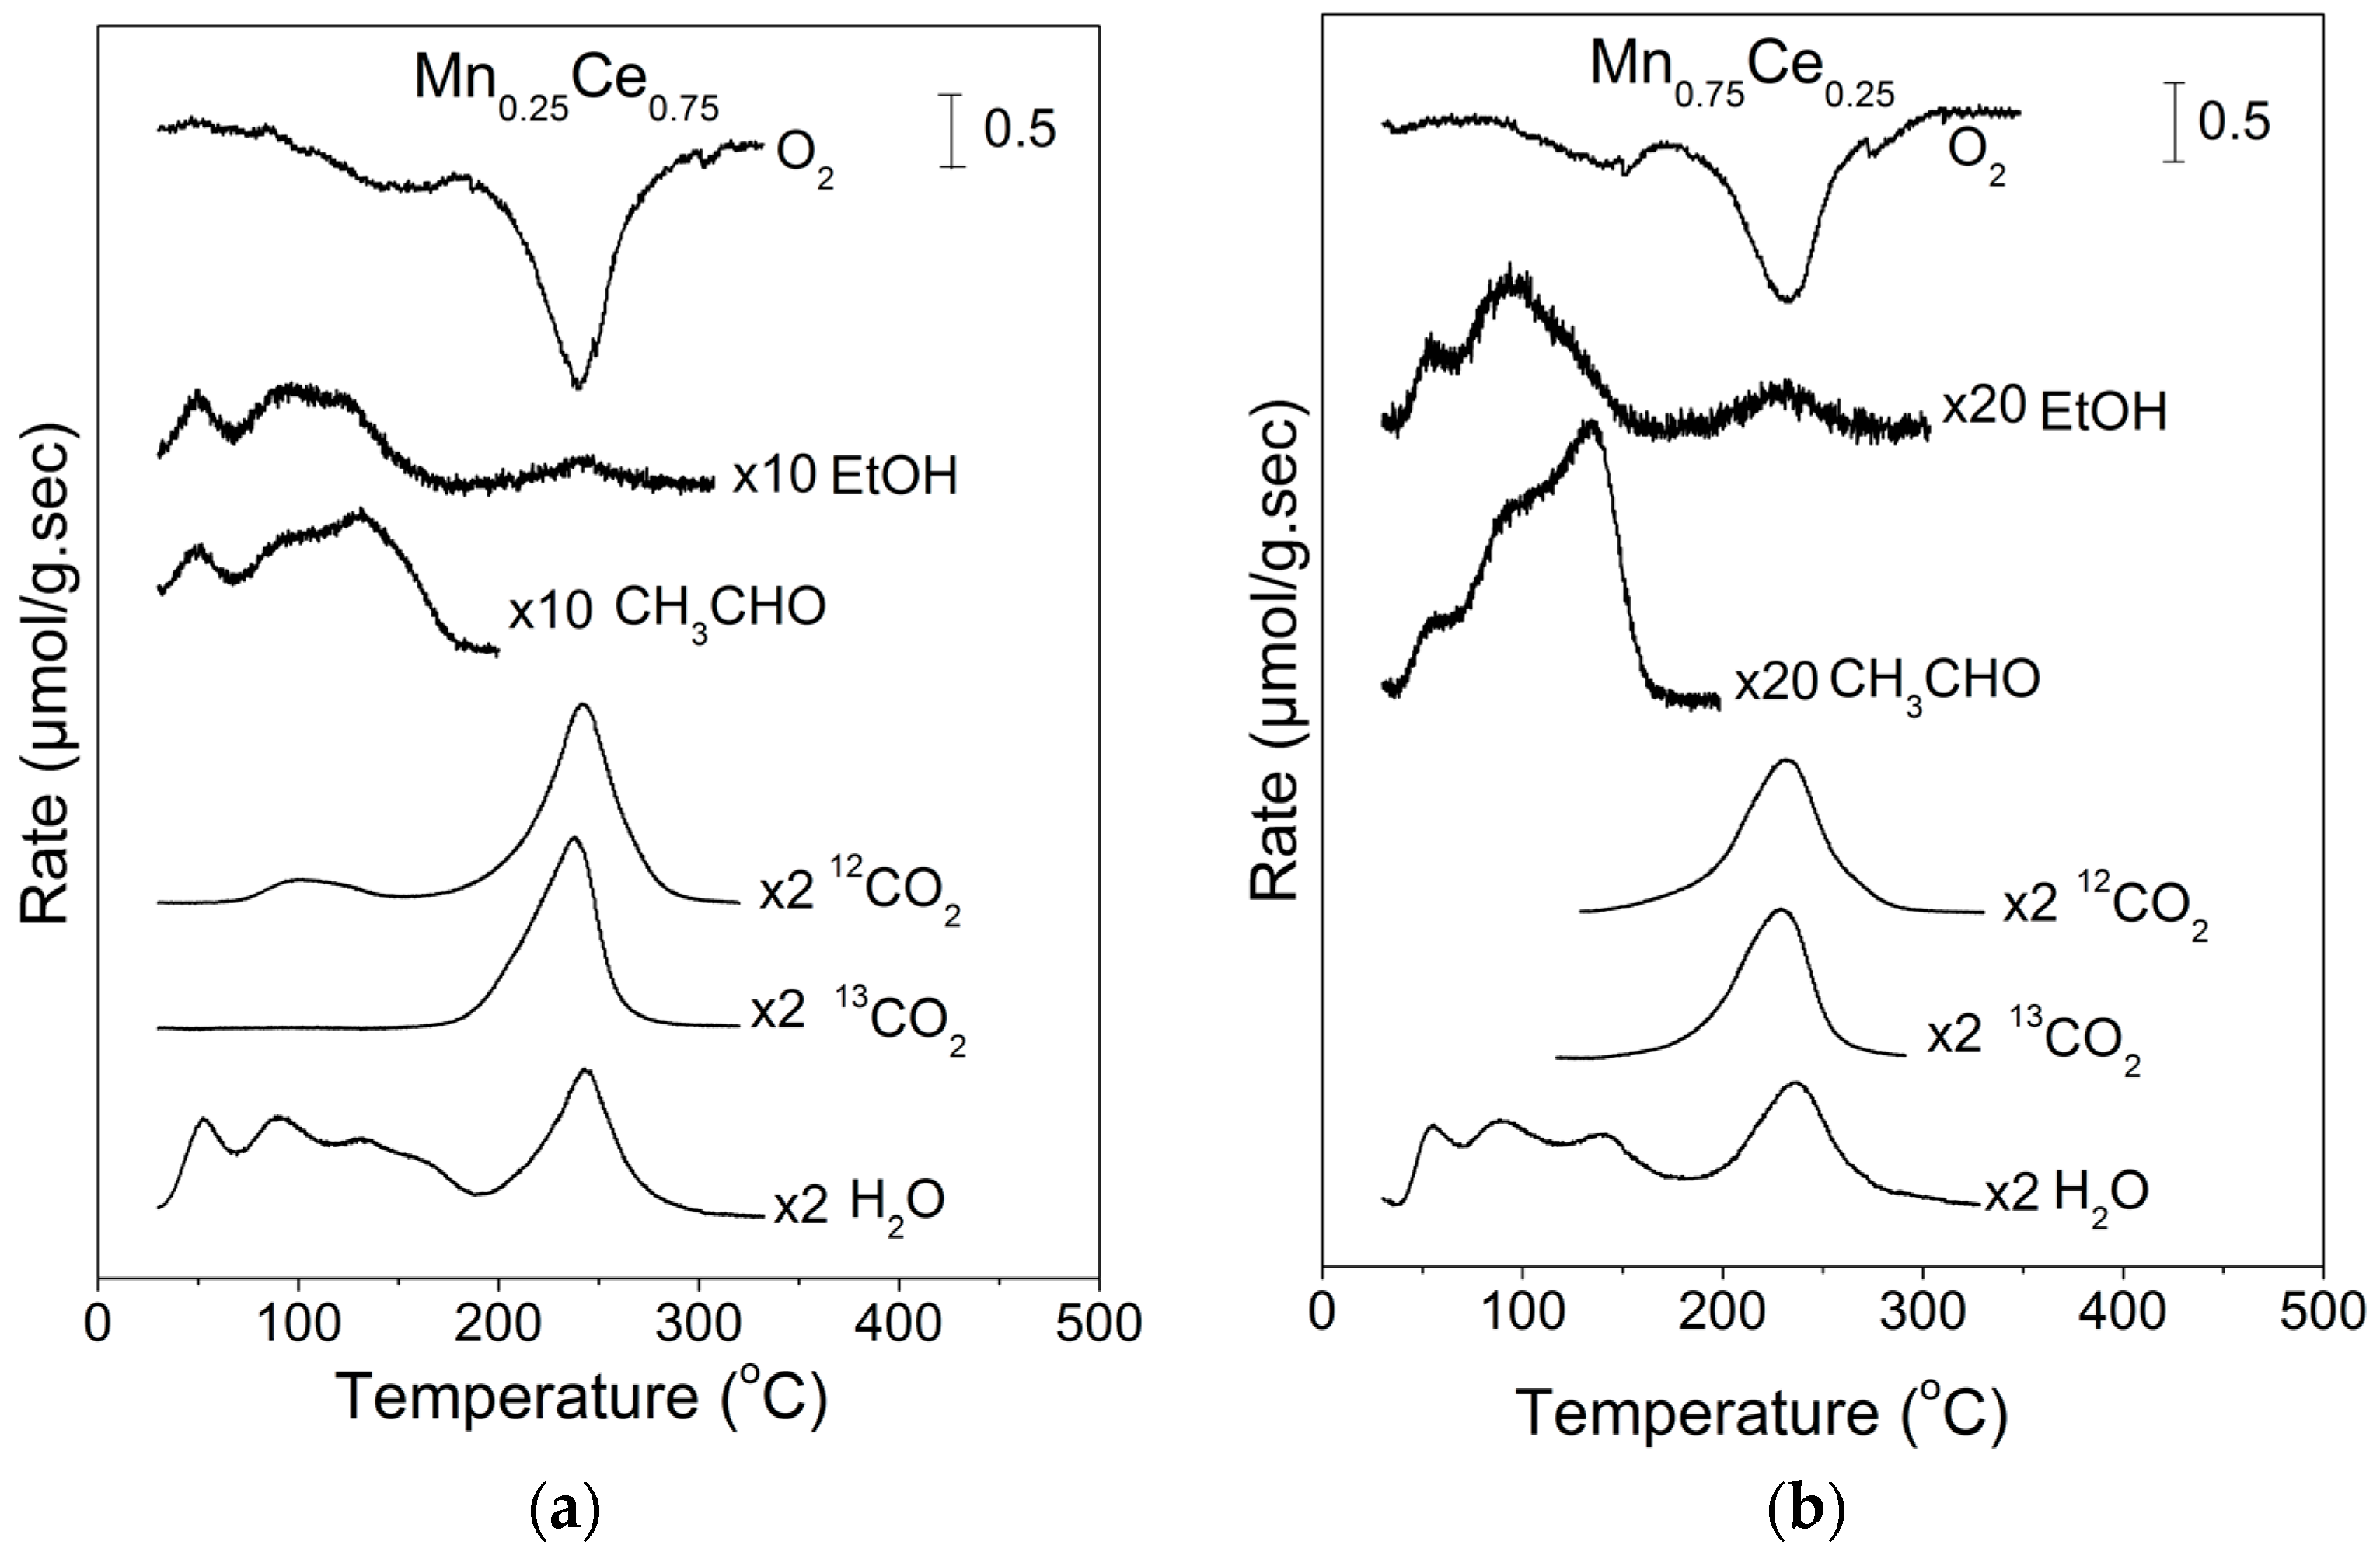
Figure 5.
CO2 profiles during TPO of ethanol over MnxCe1−x catalysts.
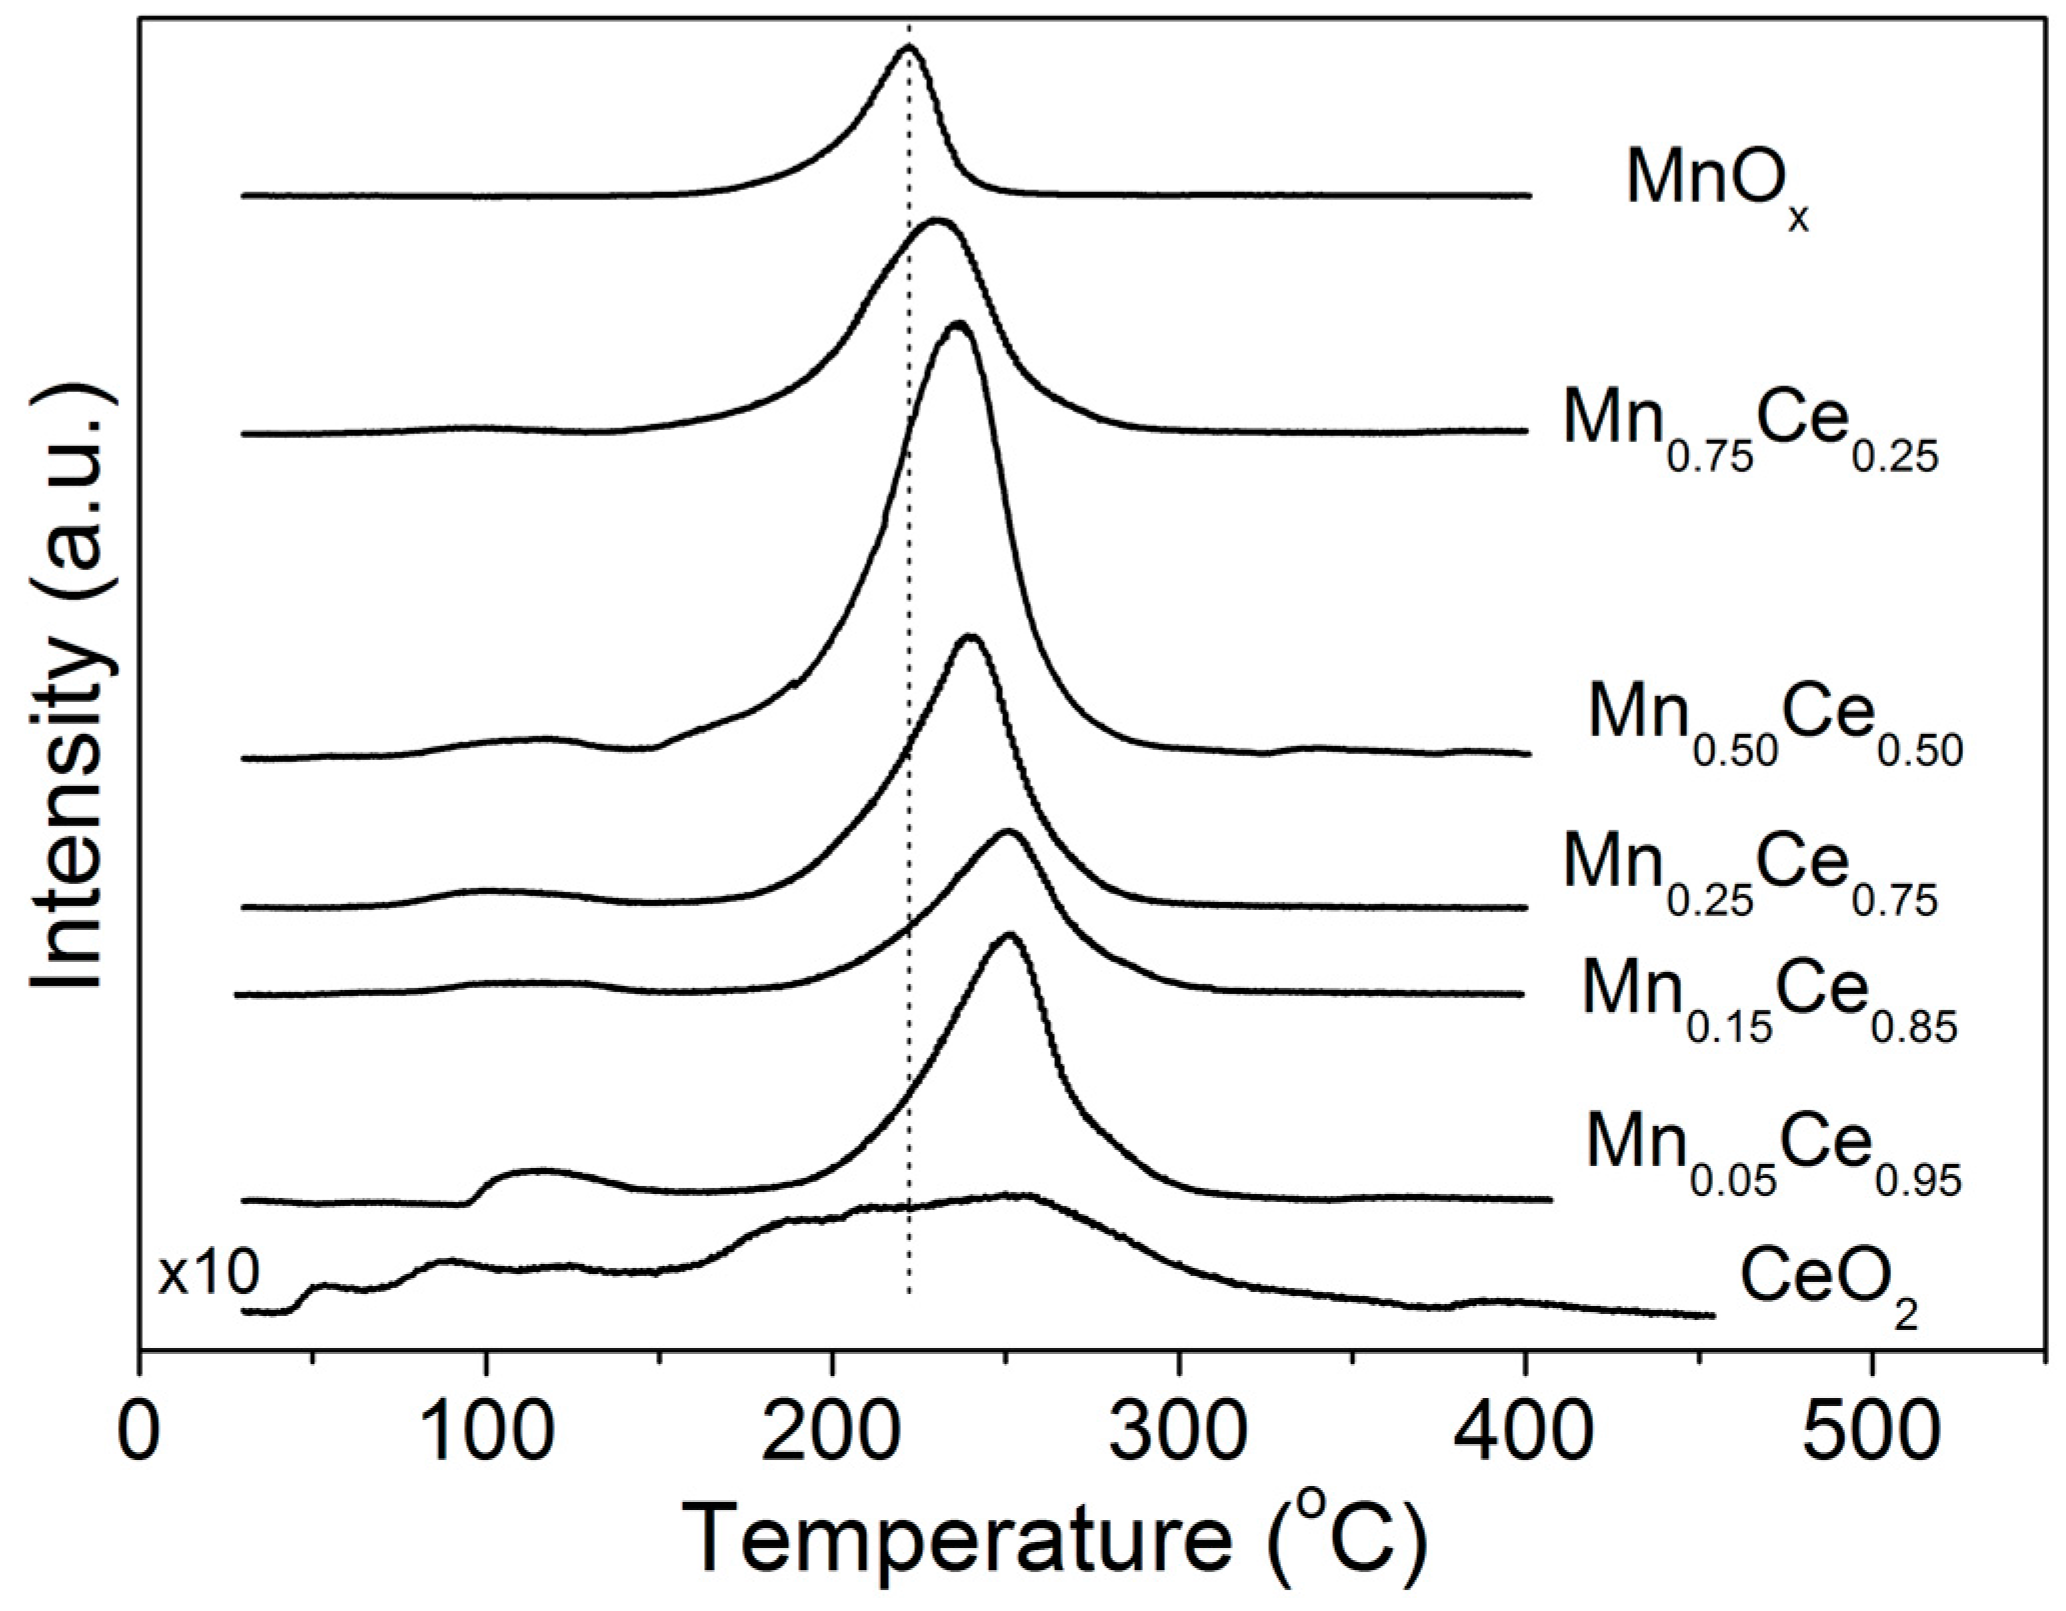
Figure 6.
Specific amount of adsorbed ethanol and CO2 produced during TPO as a function of the composition of MnxCe1−x catalysts.
Figure 6.
Specific amount of adsorbed ethanol and CO2 produced during TPO as a function of the composition of MnxCe1−x catalysts.


Table 1.
Product distribution during ethanol-TPD over MnxCe1−x catalysts.
| EtOH (%) | CH3CHO (%) | CO2 (%) | CO (%) | H2 a (%) | CO2 b (%) | |
|---|---|---|---|---|---|---|
| CeO2 | 28.1 | 22.7 | 28.1 | 21.9 | 6.8 | 3.1 |
| Mn0.05Ce0.95 | 17.7 | 19.0 | 47.2 | 15 | 1.6 | 2.6 |
| Mn0.15Ce0.85 | 15.5 | 15.8 | 53.1 | 14.1 | 1.4 | 0.6 |
| Mn0.25Ce0.75 | 14.6 | 15.9 | 59.6 | 7.9 | 0.8 | - |
| Mn0.50Ce0.50 | 13.0 | 15.3 | 60.3 | 7.9 | - | 0.3 |
| Mn0.75Ce0.25 | 13.0 | 21.5 | 62.5 | 2.8 | 0.6 | 0.3 |
| MnOx | 13.2 | 11.8 | 70.6 | - | 0.8 | 4.2 |
a Expressed as a percentage of the total amount of hydrogen contained in adsorbed ethanol. b It refers to the amount of CO2 produced at the end of TPD experiment during exposure to oxygen.
Table 2.
Product distribution during ethanol-TPO over MnxCe1−x catalysts.
| EtOH (%) | CH3CHO (%) | CO2 (%) | |
|---|---|---|---|
| CeO2 | 12.5 | 22.7 | 61.6 |
| Mn0.05Ce0.95 | 11.1 | 28.6 | 75.8 |
| Mn0.15Ce0.85 | 4.8 | 18.0 | 79.2 |
| Mn0.25Ce0.75 | 9.5 | 21.9 | 72.9 |
| Mn0.50Ce0.50 | 10.9 | 26.1 | 70.1 |
| Mn0.75Ce0.25 | 6.6 | 15.3 | 74.4 |
| MnOx | 6.3 | 15.9 | 80.8 |
Table 3.
Turnover Frequency (TOF) of ethanol oxidation at 180 °C over MnxCe1−x catalysts.
| Catalyst | SSA (m2 g−1) | Csites (μmol m−2) | R (μmol s−1 g−1) | TOF (×10−3 s−1) |
|---|---|---|---|---|
| CeO2 | 4.8 | 9.2 | 0.07 | 1.52 |
| Mn0.05Ce0.95 | 59.4 | 3.8 | 0.35 | 1.57 |
| Mn0.15Ce0.85 | 50.0 | 3.8 | 0.56 | 2.95 |
| Mn0.25Ce0.75 | 47.3 | 3.5 | 0.50 | 3.03 |
| Mn0.50Ce0.50 | 48.8 | 5.3 | 0.73 | 2.81 |
| Mn0.75Ce0.25 | 38.2 | 5.1 | 0.75 | 3.86 |
| MnOx | 10.3 | 6.1 | 0.37 | 5.87 |
© 2017 by the authors. Licensee MDPI, Basel, Switzerland. This article is an open access article distributed under the terms and conditions of the Creative Commons Attribution (CC BY) license (http://creativecommons.org/licenses/by/4.0/).
Share and Cite
MDPI and ACS Style
Delimaris, D.; Ioannides, T. Intrinsic Activity of MnOx-CeO2 Catalysts in Ethanol Oxidation. Catalysts 2017, 7, 339. https://doi.org/10.3390/catal7110339
AMA Style
Delimaris D, Ioannides T. Intrinsic Activity of MnOx-CeO2 Catalysts in Ethanol Oxidation. Catalysts. 2017; 7(11):339. https://doi.org/10.3390/catal7110339
Chicago/Turabian StyleDelimaris, Dimitrios, and Theophilos Ioannides. 2017. "Intrinsic Activity of MnOx-CeO2 Catalysts in Ethanol Oxidation" Catalysts 7, no. 11: 339. https://doi.org/10.3390/catal7110339
Note that from the first issue of 2016, this journal uses article numbers instead of page numbers. See further details here.