Article

Fine-Tuning Synthesis and Characterization of Mono-Sized H-Beta Zeolite-Supported Palladium-Iridium Nanoparticles and Application in the Selective Hydrogenation of Acetylene

by
Masood Sahooli
,
Mohammad Reza Rahimpour
* and
Mohammad Khorram
Department of Chemical Engineering, School of Chemical and Petroleum Engineering, Shiraz University, Shiraz 71345, Iran
*
Author to whom correspondence should be addressed.
Catalysts 2017, 7(11), 343; https://doi.org/10.3390/catal7110343
Submission received: 1 October 2017 / Revised: 28 October 2017 / Accepted: 29 October 2017 / Published: 13 November 2017
(This article belongs to the Special Issue Zeolites and Catalysis)

Abstract

:
In this research, a mono-sized Beta zeolite support synthesized by the solvothermal method was used in the selective acetylene to ethylene hydrogenation reaction with minimum coke build up on the catalyst surface. Tetrapropylammonium hydroxide (TPAOH), tetrapropylammonium bromide (TPABr), n-butylamine, and morpholine were used as structure direct agents (SDA) in the support to obtain various shapes. The characterization results show that although the Si/(Al + SDA) ratio has no effect on the phase purity of support, it has a remarkable effect on porosity, crystal size, shape, and structure of micropores. After comparing characterization results, the developed support, based on TPAOH, was selected and modified by different metals (Ce, Ir, Ag, and Pd) using the incipient wetness co-impregnation method. Since there is an interaction between selectivity and conversion, the optimum metal content in the synthesized catalysts and reaction condition were determined to achieve the desired acetylene conversion and ethylene selectivity. The physicochemical transformation of the developed optimum catalysts was determined using different techniques. Based on the characterization and cata-test results, the catalyst which contains 0.29% Ir and 0.08% Pd presents a better performance and higher stability compared to the other catalysts due to the moderate size and mono layer dispersion of the metals on the support. The experimental results show that acetylene conversion and ethylene selectivity approach 97% and 92% at 55 °C, respectively.

Graphical Abstract

1. Introduction

In the previous few decades, synthetic micro/meso-porous materials have played a significant role in addressing social subjects such as the extra effective utilization of reproducible resources or fossils, to meet more accurate environmental standards [1,2,3]. Zeolite supported catalysts, that are classified as nanostructured catalysts, have a considerable surface-to-volume ratio which favorably affects their catalytic activity [4,5]. Zeolite supported catalysts, that are synthesized by various methods such as solvothermal treatment, hydrothermal treatment, etc. [2,6,7,8,9], have broad industrial utilization in a wide variety of processes such as, aromatization and oligomerization of light olefins, alkylation reactions, catalytic cracking, and optoelectronic devices [10,11,12,13]. Among the synthesized zeolites, zeolite Beta is a famous substance which has 12-loop crossovers channels with a pore size distribution of around <2 nm [14]. Nevertheless, micro pore size distribution of the Beta zeolite is considered as a barrier for the transformation of molecules [15]. The pore size of microporous zeolites can be modified by various techniques including ion exchange [16], zeolites external surface modification, and framework control using structure direct agents (SDA) [17,18].
For the first time, in 1992, Kresge et al. prepared a big-channel zeolite by using quats (NR4+ that R is an aryl or alkyl group like the methyl groups, benzyl groups, methylene chains, ammonium groups and heterocyclic amines [19]) as SDA without transformation restrictions [20]. Using this SDA, shapeless silica and/or aluminosilicate substances were obtained instead of zeolite crystal-like materials. Regardless of their shapeless skeleton, the products had mono-sized pore distribution of about 2–50 nm which was higher than the obtained pore size distribution for zeolites up to that time. In addition, the shape and the diameter of the mesoporous zeolites were controllable through tuning type and concentration of the SDA suspensions. From that time onwards, by using SDA suspensions for pore tuning, different substances with various mesoporous morphologies have been made. However, under synthesis circumstances, the meso-zeotype substances have less stability than the zeolite crystal-like which is due to the shapeless quiddity of their SDAs. In addition, poor acid sites of the shapeless SDAs have limited their application in catalytic processes in which potent Brønsted acidity of mesoporous is needed [21]. To overcome these problems, many efforts have been made to prepare large pore substances with zeolite specifications. A considerable number of researches have been reported on zeolite synthesis and development [22]. For example, Ryoo et al. prepared C38H82N2Br2 as SDA for initial load and by using this SDA, the scientists prepared mesosheet zeolite of only 2.5 nm width. This SDA acted as an organic surfactant while the tails of numerous SDAs were aggregated to make a suspension [23,24]. Na et al. and Kim et al. described that the mesosheet zeolite made by several templates (such as zeolite Beta (*BEA), Linde Type A(LTA), and Linde Type l(LTL)that are synthesized with binary SDA surfactant) not only had a considerable conversion in the methanol to hydrocarbons process, but they also had a good lifetime [25]. Wadlinger et al. synthesized Beta zeolite with *BEA morphology by using N,N,N-triethylethanaminium (TEA) SDA [26]. Moreover, the TEA+, benzyl(2-hydroxy-1-methyl-2-phenylethyl)dimethylammonium bromide, methylphenyl carbinol, etc. were used as SDAs in Beta zeolite preparation for increasing hydrophobicity [27]. According to the literature, hydrophobicity of Beta zeolite increased when methylcyclohexane, toluene, and water solvents and/or a mixture of these were used [28].
Catalysts with moderate pore size distribution, which are promising selective catalysts, can be obtained by adding a metal precursor to micro/meso-porous supports [29]. The presence of microporous channels favorably affects the mass transfer and diffusion of guest molecules. This is why Beta zeolite has a considerable stability and catalytic activity [30].
Selective hydrogenation of acetylene to ethylene is a challenging issue which not only is important in academia but is also critical in the chemical industry [31,32]. In the academic world, acetylene hydrogenation is considered as a model for selective hydrogenation reactions. As for the industrial world, this reaction is mostly used to purify the ethylene stream which is the product of naphtha cracking. When this purified stream is used for polyethylene production, it yields more alkene which enhances the profitability and eliminates undesired alkyne [32]. Selective acetylene hydrogenation has been reviewed thoroughly in other publications [32,33]. For instance, Benavidez et al. deposited Pd nanoparticles on carbon, alumina, and magnesia. These nanoparticles were about 0.5–1.0 nm and they were produced by solution phase alcohol reduction of Pd(OAc)2 [34,35]. It is safe to say that most of the industrially used catalysts are egg-shell catalysts with minor loads of Pd (<0.1 wt%) where the active component is alloyed with Ag, Cu, Ir, Au, etc. which acts as a structural diluent [32]. Addition of another metal, which is better to have for high hydrogenolysis activity, may increase the sintering resistance of Pd [36]. The ring opening tendency of Ir (through dicarbene mechanism) is stronger than for other noble metals and is famous for its extraordinary hydrogenolysis activity [37,38,39]. Iridium has a noticeable oxidation/reduction potential, therefore, in acidic media (Ir3þ/Ir 1.16 V), it is electrochemically stable. This is why Ir is a suitable candidate for improving the surface electronic structure of Pd alloys and the stability of Pt-based catalysts which is of paramount importance for further increasing their catalytic activity [39,40,41]. As introduced by Exxon (1970s), Ir forms a part of the reforming Pt-Ir catalysts with higher activity than monometallic Pt which was used commercially previously [37]. You et al. studied Ir decorated PdCu alloy and the obtained ternary Ir-PdCu/C catalyst had a higher oxygen reduction reaction (ORR) activity [42]. In addition, Ham et al. showed that Pd-Ir-Co alloy catalyst had higher ORR activity and durability than the bimetallic Pd3Co alloy [39]. According to their studies, chemical composition plays a key role in tuning the electrocatalytic properties of Pd alloy catalysts [39]. Jin et al. showed that Pd-Ag alloys considerably improve the selectivity of the catalyst but need catalyst activation by high temperature reduction in hydrogen [43]. Han et al. assessed a new procedure for introducing Ag to Pd/TiO2 catalysts using sequential photo-deposition [44].
Wang and Song [45,46] selected K, La, and Cu as promoters for the Pd or Au catalysts in acetylene hydrogenation. Higher catalytic activity was exhibited, and the lifetime was improved greatly [47]. Zhang et al. [48,49] synthesized a series of Au-La/SAC, Au-Co/SAC catalysts and found that the additives Co(III), Co(II), and La(III) could greatly inhibit coke deposition and sintering of the catalyst surface to improve the activity and long-term stability of the catalysts. However, there are several examples of non-palladium catalysts proposed for selective alkyne hydrogenation including Ni-Zn alloy [50], the ternary Cu-Ni-Fe system [51], and CeO2 [52] as well as monometallic Au [53,54], Ag [55], and Cu [56] catalysts. They demonstrate very high ethylene selectivity but require elevated temperatures to provide high acetylene conversion and are therefore strongly limited for commercial use. On the contrary, in spite of the high activity, selectivity, and stability of supported monometallic palladium catalysts, they are not sufficient, especially at high acetylene conversions, so the second metal (e.g., Ag, Cu) is introduced to improve catalytic performance [33,57]. It hinders palladium hydride formation and decreases the number of adjacent Pd sites responsible for multiplet adsorption leading to over-hydrogenation of acetylene to ethane and its oligomerization to higher hydrocarbons (green oil) [57,58]. The Pd-Ag bimetallic catalysts have been found to be most efficient and are successfully employed on an industrial scale [59]. Also, a Pd-based catalyst supported Y zeolite was studied by Wang et al. [60] and it was found that acetylene conversion and selectivity were about 95% and more than 90%, respectively. Although the catalyst displayed favorable catalytic activity for acetylene conversion and selectivity, it became easily deactivated as the reaction time exceeded 140 min [47]. In the event in this article a palladium-based catalyst supported Beta zeolite hardly deactivated as the reaction time exceeded 15 h and acetylene conversion and selectivity were about 97% and more than 92%, respectively, showing that this specification of catalysts here is higher than the previous research up to this time.
A summarized scheme of the reaction is demonstrated in Figure 1. At lower temperatures of interest, the influence of dehydrogenation and decomposition paths on the overall activity and selectivity over pure Pd is negligible, consequently these paths are neglected [32,43,61,62]. Generally, hydrogenation (through which ethylene/ethane is produced) and oligomerization (through which 1,3-butadiene and larger hydrocarbons are produced) are the existing reaction pathways that compete with each other [32].
Oligomerization pathway is highly relevant given that oligomers are the precursor for ‘green oil’ production that generally brings about deactivation of the catalyst as a result of hydrocarbon accumulation on the surface of the catalyst. Therefore, the catalyst which avoids oligomer production is considered as the ideal catalyst for hydrogenation of acetylene which is a big challenge with Pd based catalysts. It is more realistic to choose catalysts that decrease the production of 1,3-butadiene (small k3 in Figure 1) or larger oligomers which eventually bring about deactivation (small k4 in Figure 1). In order for a catalyst to selectively hydrogenate acetylene, it is imperative to maximize the rate of ethylene formation (large k1 in Figure 1) whilst minimizing over hydrogenation (k2 in Figure 1) [32].
In this work, we synthesized unique and mono-sized mesoporous spherical Beta zeolite by a facile solvothermal method and we also successfully synthesized and modified PdM/H-Beta-based (M = Ag, Ce, and Ir) catalysts by an incipient wetness co-impregnation method. Different SDA such as tetrapropylammonium hydroxide (TPAOH), tetrapropylammonium bromide (TPABr), morpholine, and n-butylamine were added via a solvothermal procedure to modify the shape, specific surface area, pore size distribution, acidity, and stability of Beta-based catalysts. Finally, PdM/H-Beta-based catalysts were characterized with high-resolution transmission electron microscopy (HRTEM), X-ray powder diffraction (XRD), thermogravimetric analysis–differential thermogravimetry (TGA–DTG), N2-adsorption/desorption, pore size distribution (PSD), Fourier–transform infrared spectroscopy (FTIR), UV–Visible, inductivity couple plasma-optical emission spectrometry (ICP–OES), dynamic light scattering (DLS), temperature programmed desorption (TPD), stability, and zeta potential. They were used in the selective hydrogenation of acetylene to ethylene at different gas hour space velocity (GHSV), reaction temperature, and hydrogen to acetylene ratio (R) to investigate the acetylene conversion, ethylene selectivity, and yield of the process.

2. Results and Discussion

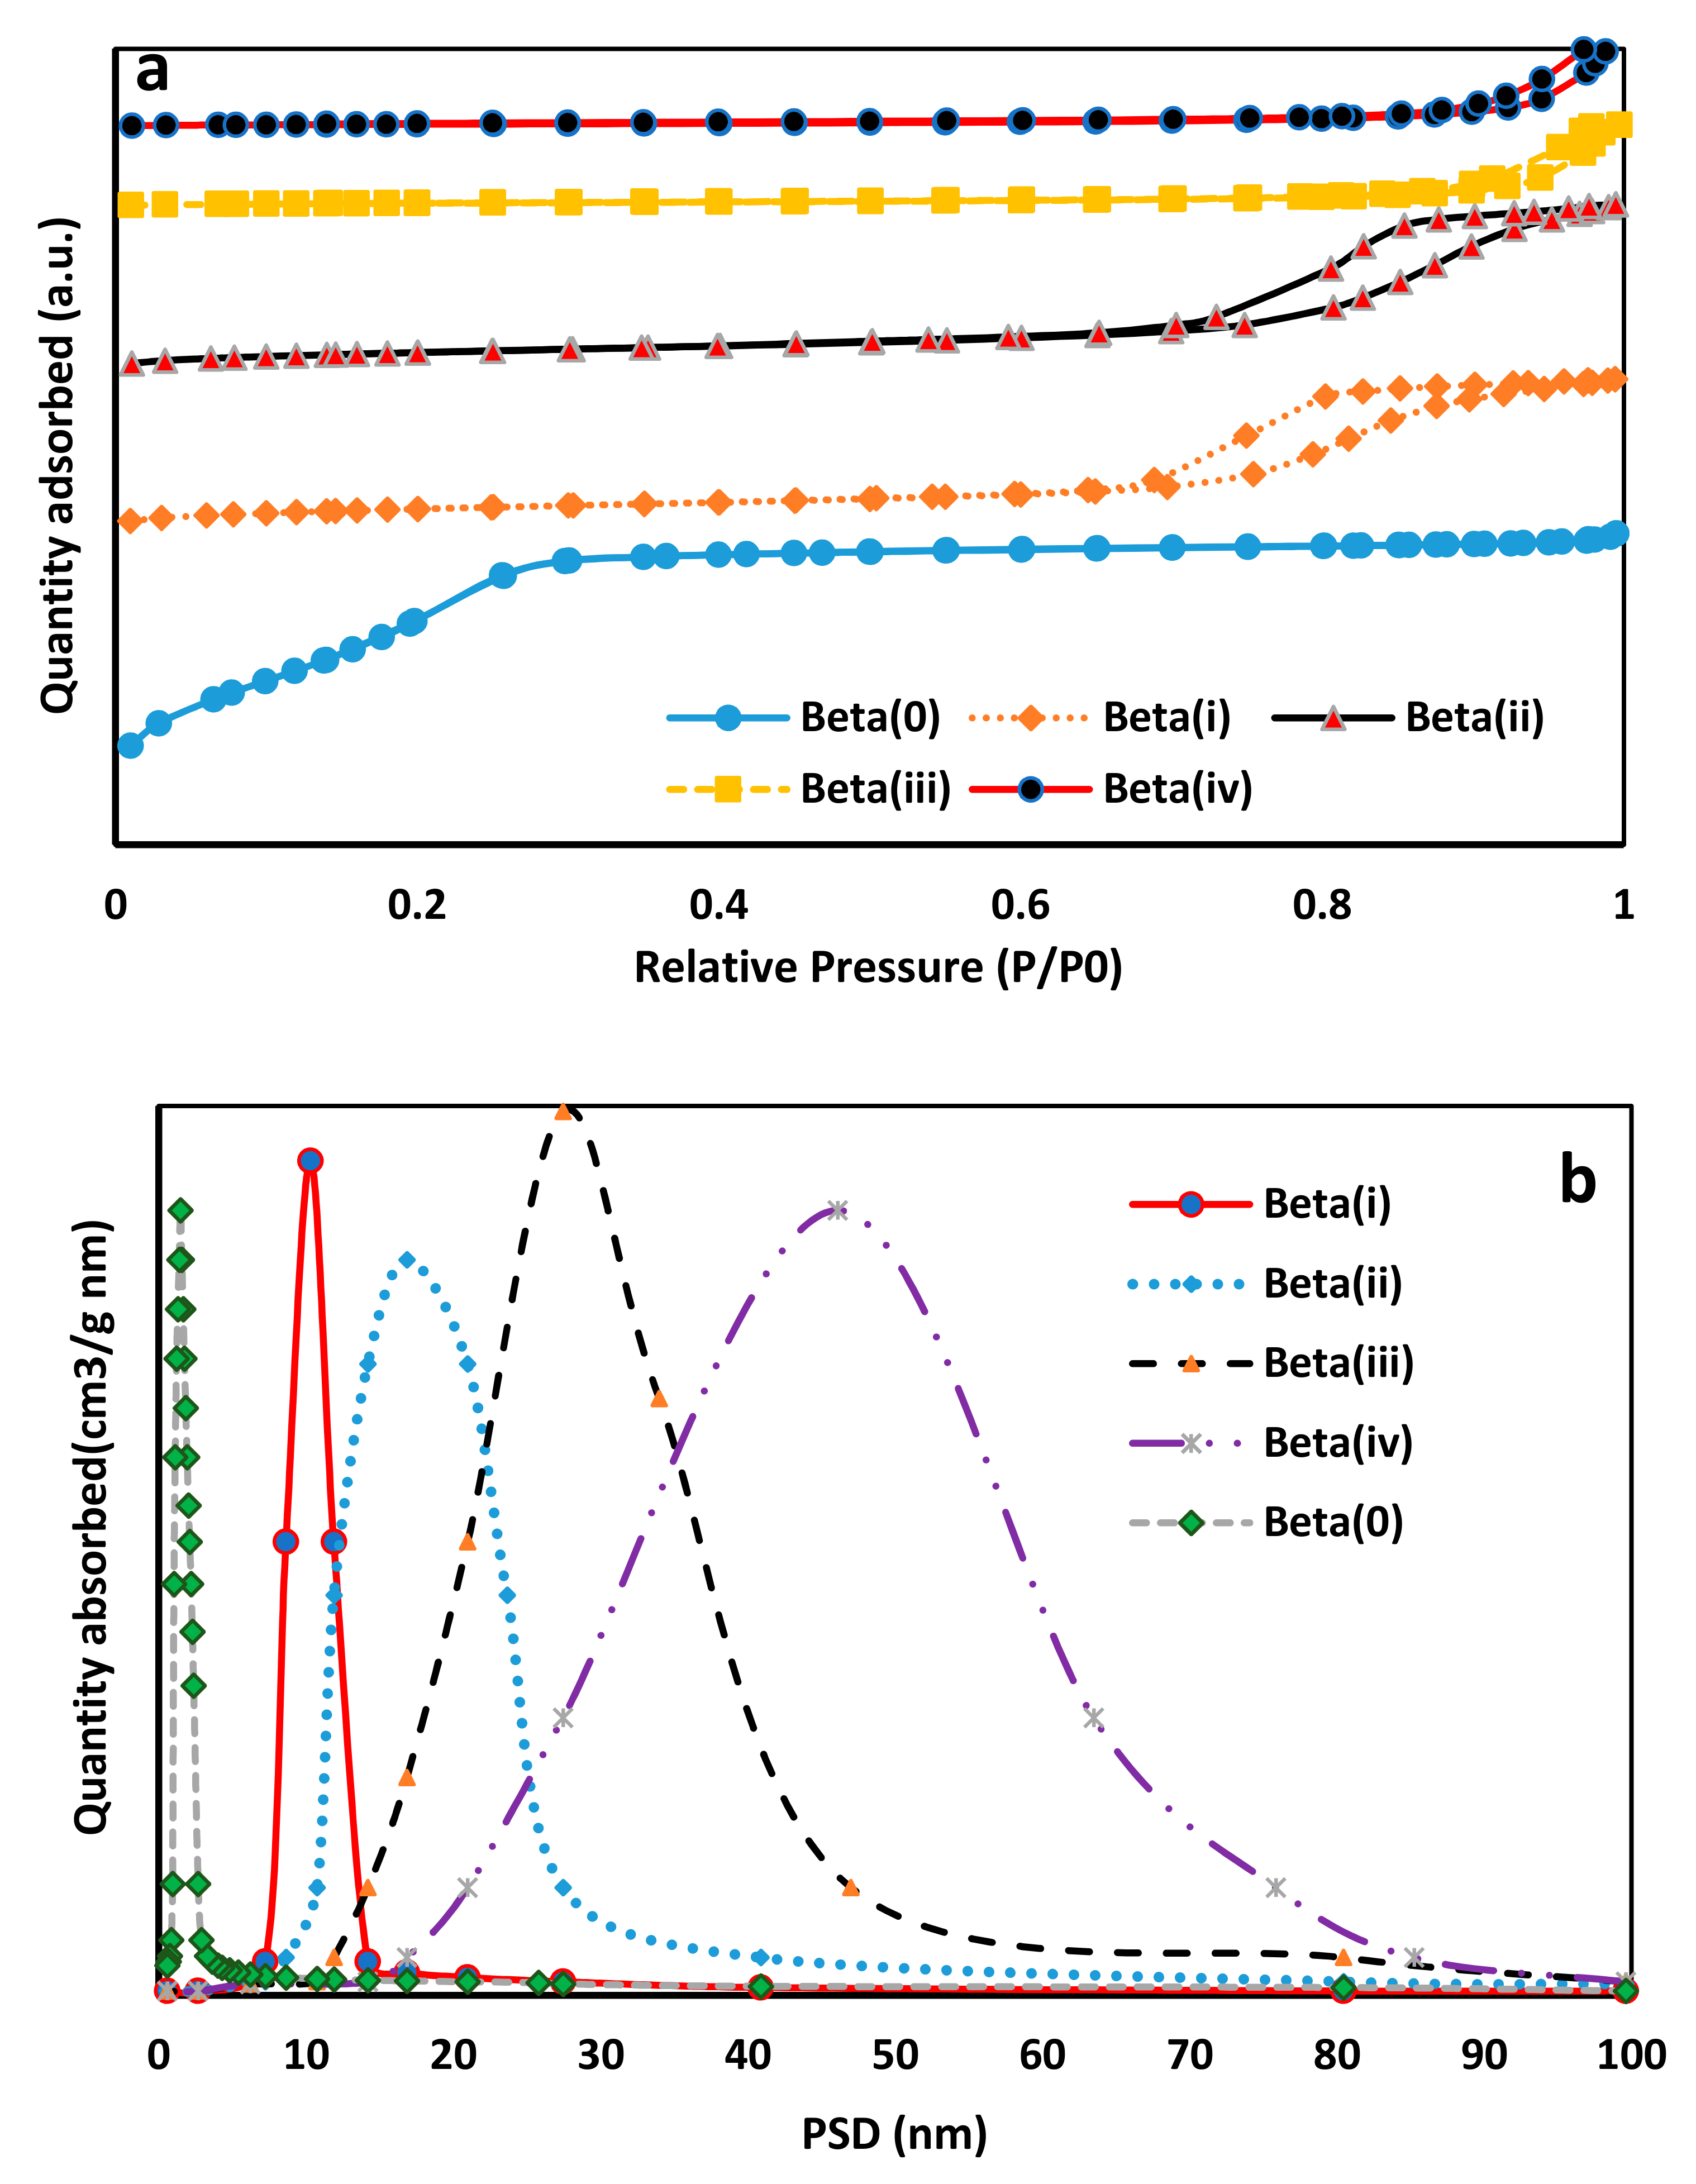
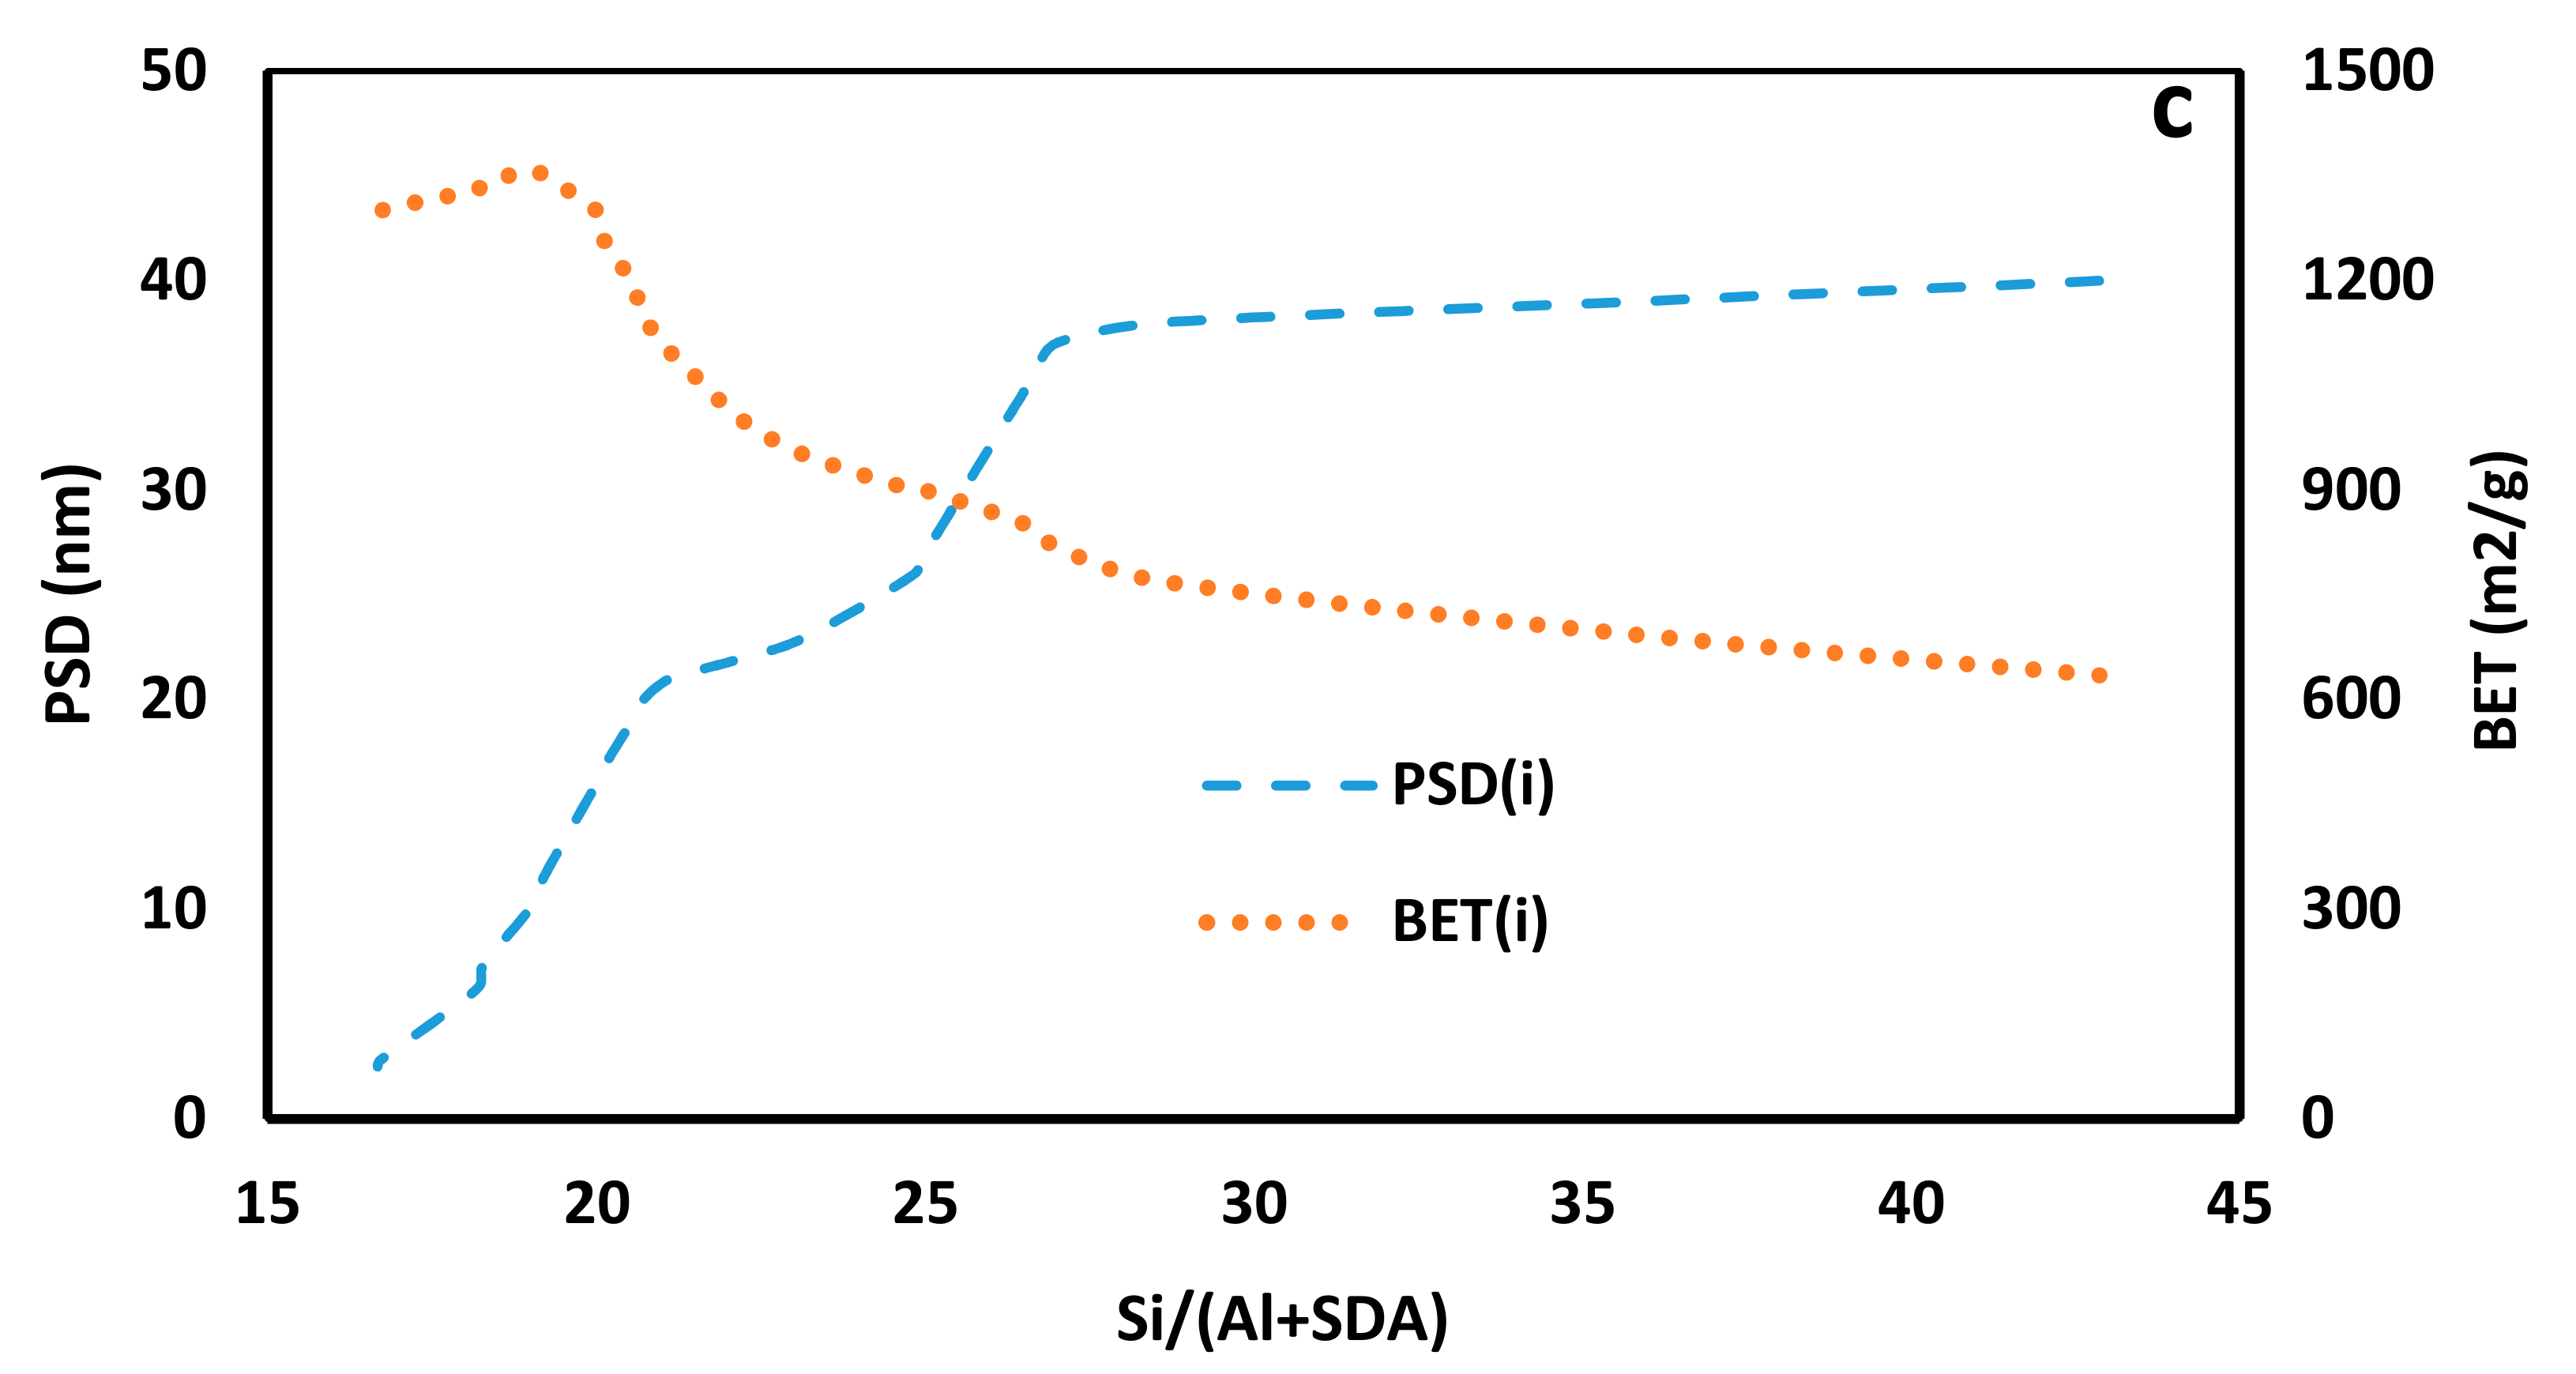
2.1. BET and DLS Characterization

Beta-based catalysts (Beta as support, 0.08%Pd1.9%Ag/H-Beta(i), 0.08%Pd2.9%Ce/H-Beta(i), and 0.08%Pd0.29%Ir/H-Beta(i) as optimum catalysts) were characterized with N2 adsorption–desorption isotherms, PSD patterns, and DLS pictures. Table S1 shows the different Beta-based catalyst synthesis conditions in which the PSD and specific surface area are changed with the SDA and tetraethylorthosilicate (TEOS) values. The Si/(Al + SDA) ratio is 28.57, 19.05, 20.68, 13.18, 11.95 for Beta(0), Beta(i), Beta(ii), Beta(iii), and Beta(iv)-based catalysts, respectively and TPAOH is selected as the best SDA because this sample has a very high surface area, excellent acidity, standardized morphology, and the nanoparticles are moderate and mono sized. According to the Table S1 and Figure S2, by increasing the Si/(Al + SDA) ratio, the PSD value increases but the Brunauer–Emmett–Teller (BET) value increases at first to the maximum value and then decreases. This demonstrates that augmenting TPAOH results in a moderate pore size distribution in the supports, and the micro porosity of samples could be easily adjusted by adding various amounts of SDA. The highest specific surface area is obtained over Beta-zeolite with TPAOH as SDA which has a moderate particle size and micropore volume. Table S2 and Table 1 show the synthesis conditions of different catalysts and optimized catalysts with textural properties, respectively. BET specific area, average PSD curves of optimum supports and effect of Si/(Al + SDA) on the BET and PSD of optimum supported are depicted in Figure 2a–c.
The isotherm of Beta-based catalyst (Figure 2a) demonstrates an International Union of Pure and Applied Chemistry (IUPAC) kind I and IV treatment, which is usual for microporous substances, and no mesoporous appears in Beta(0) PSD patterns, because of the presence of a slightly enhanced absorption at higher pressures. Additionally, the isotherm of Beta(i, ii, iii, and iv)-based catalysts shows mesoporous channels and no microporous appears in their PSD patterns (Figure 2b). This gives growth to a remarkable internal and external specific area, eventually over 1474.78 m2 g−1 with a PSD final amount of about 1.5 nm for Beta(0). The non-appearance of a pronounced hysteresis curl in the BET Beta(0)-based patterns brings about a comparatively high amount of Smicro and as a result there is a rise in exterior specific area partnership compared to interior crystalline microporosity [63]. It also proposes the existence of some slit-like intercrystalline voids which are due to the agglomeration of crystals. Specific surface area and PSD value for other Beta(i, ii, iii, iv)-based catalysts that are synthesized with different SDA are shown in Table S2 and Table 1. Figure 2c shows that with an increase in the Si/(Al + SDA) ratio when TPAOH is used as SDA, PSD and BET increase but BET increases to a maximum surface area then decreases. At the optimum Si/(Al + SDA) ratio, this is 19.05, PSD and BET set at 10.3 nm and 1358.3 m2 g−1, respectively. For other SDAs, with a decrease in Si/(Al + SDA) ratio, PSD peaks at 20.68 (ii), 13.18 (iii), 11.95 (iv), are reported in Figure S1 and Table 2. The Beta-zeolite with n-butylamine and morpholine supports contains lower BET and a very wide PSD compared to the Beta-based catalysts with TPAOH and TPABr as SDA. For Beta(iv) and Beta(iii), a large adsorption is observed at high relative pressure which is attributed to N2-adsorption in the interparticle voids. These results are attributed to the attendance of low crystallinity and α-quartz phase through the Beta-based catalyst with n-butylamine and morpholine.
The H-Beta(i)-based catalyst shows higher textural specifications compared to the other supports which means that the introduction of SDA (such as TPAOH) can strongly modify the textual specifications of the supports and catalysts. Therewith, the decrease in the textural specifications of the catalysts could be ascribed to a little incorporation of chelating agents. As shown in Figure S2, all samples display kind IV patterns with H3 kind hysteresis curl because a high amount of alumina and/or silica is integrated into the support’s structure. The moderate and mono sized PSD patterns are obtained from the patterns of all samples, especially in 0.08%Pd 0.29%Ir/H-Beta(i). Figure S3 depicts DLS catalysts under optimum synthesis conditions and the results are demonstrated in Table 2. Figure S3 shows that the crystal sizes of the different catalysts over optimum support are around 10–30 nm and the crystal sizes of 0.08%Pd0.29%Ir/H-Beta(i) catalyst were mono and narrow sized compared to other catalysts.

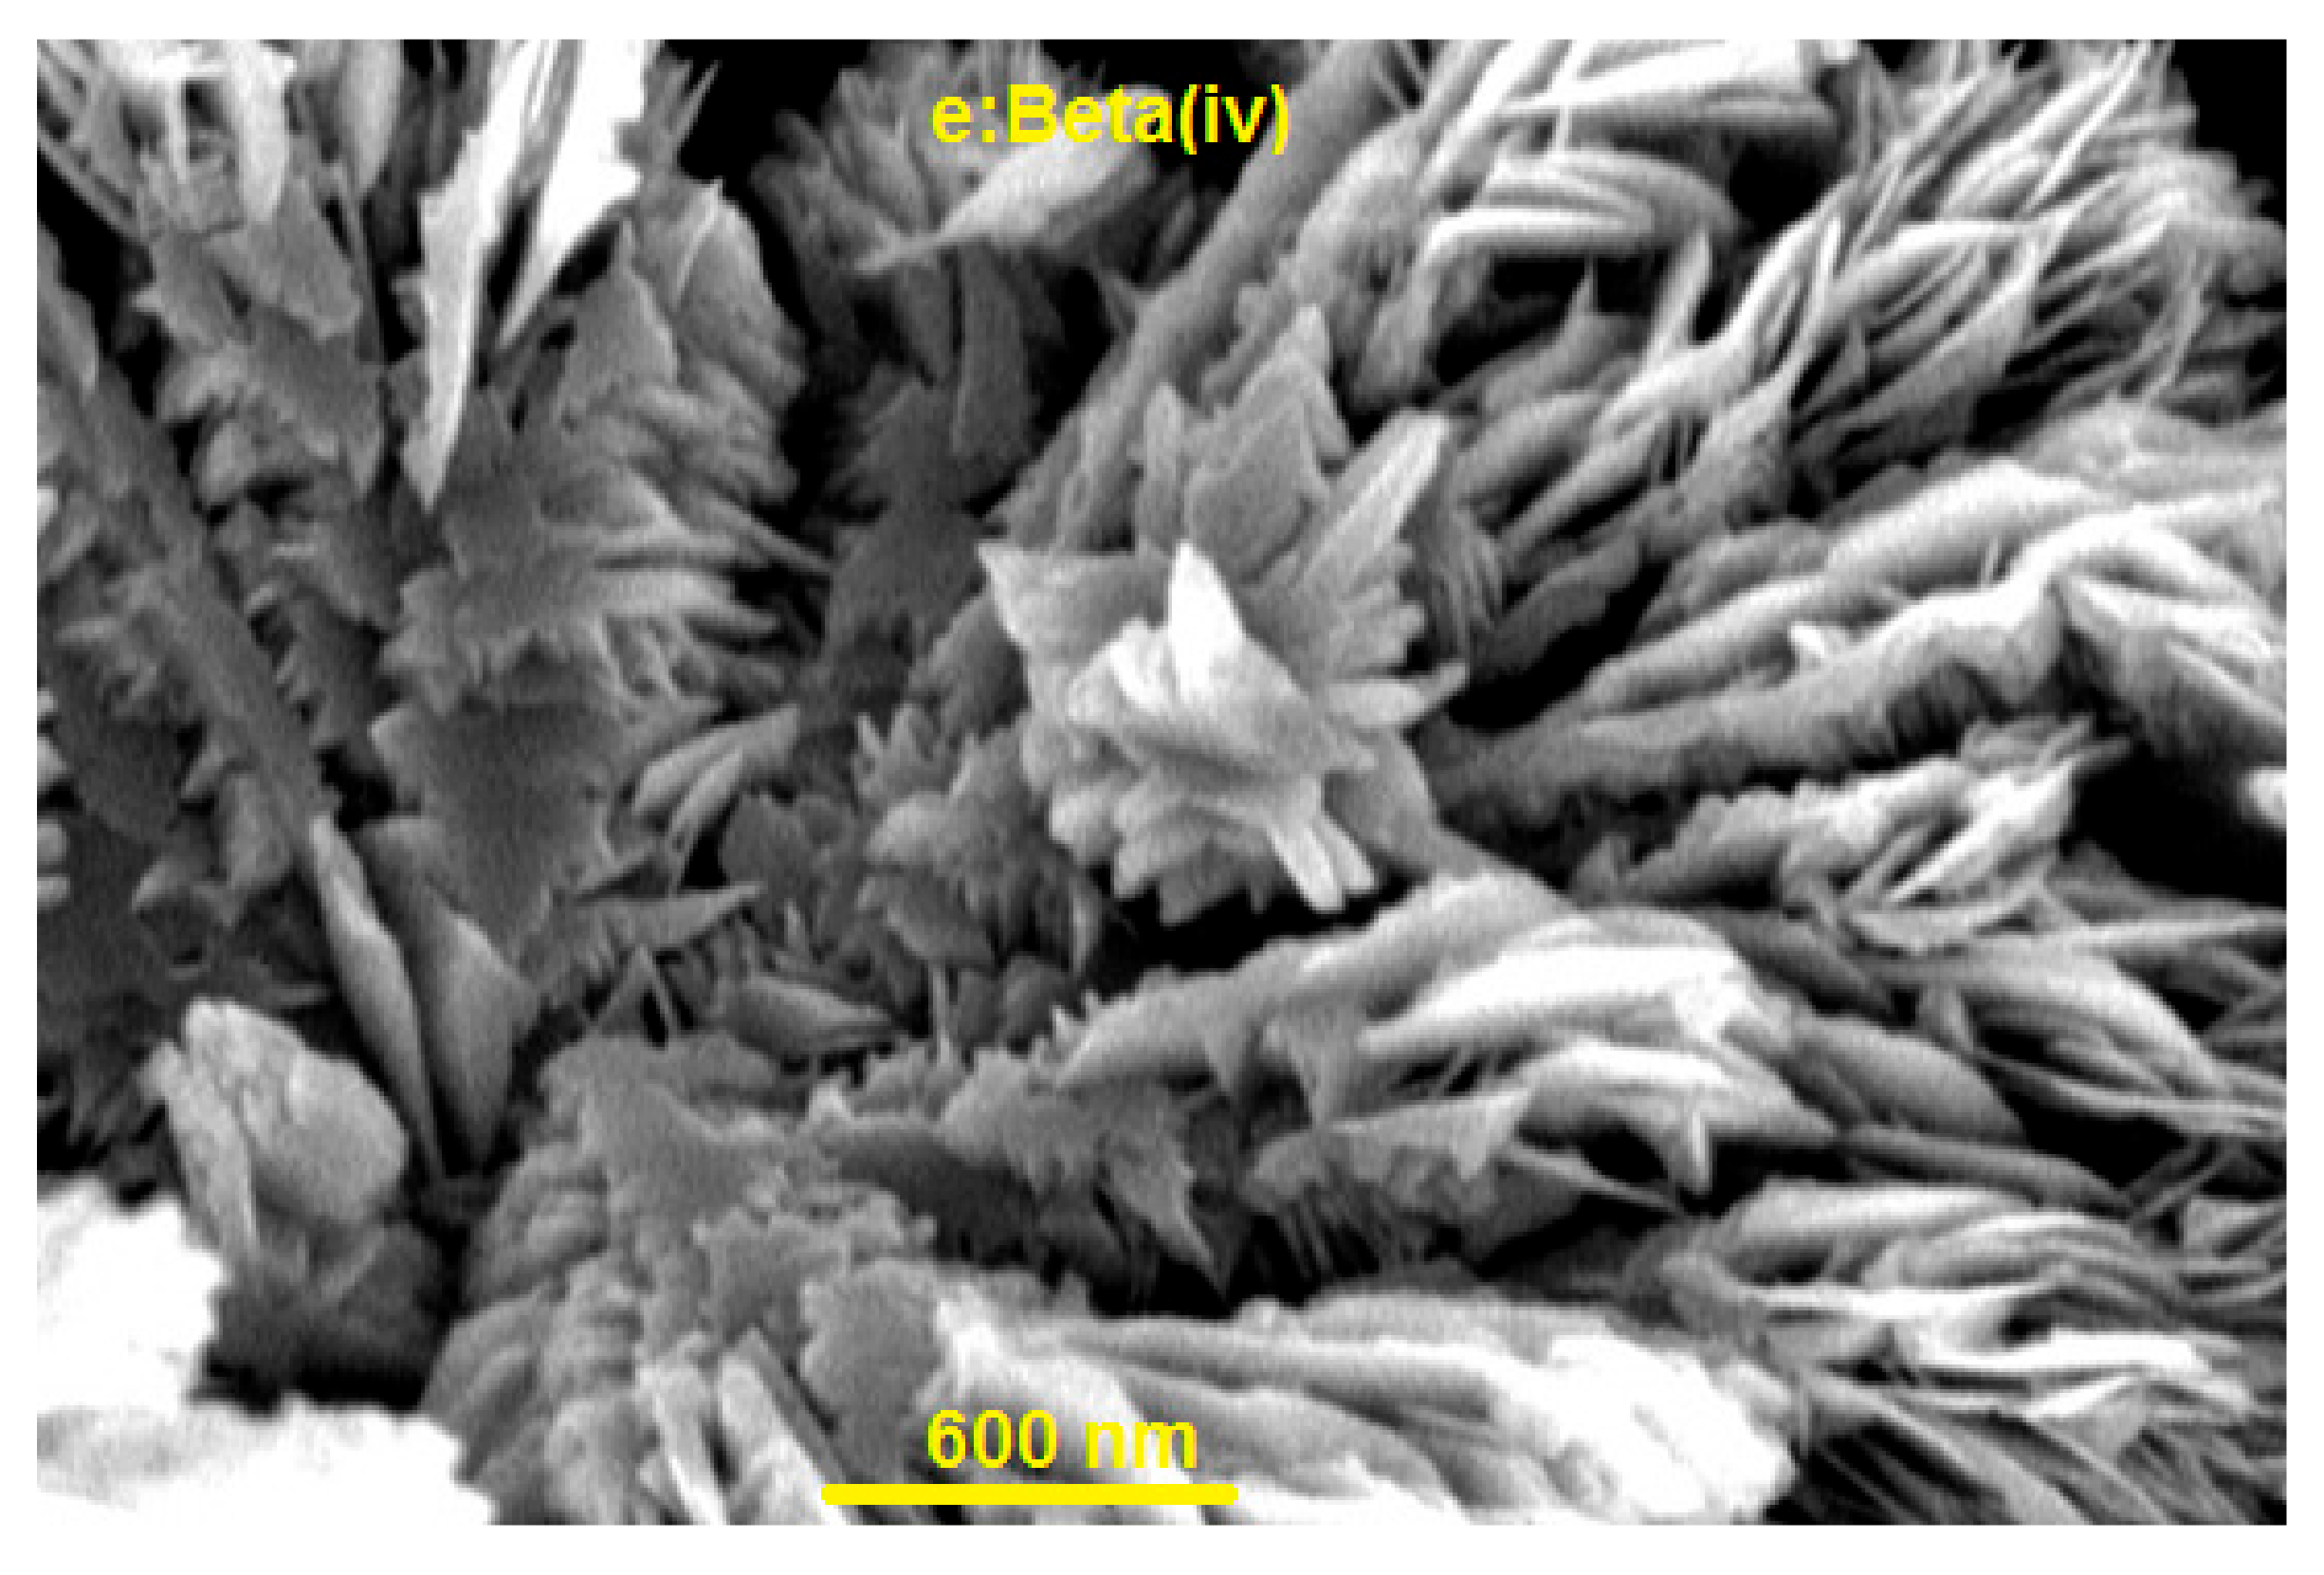
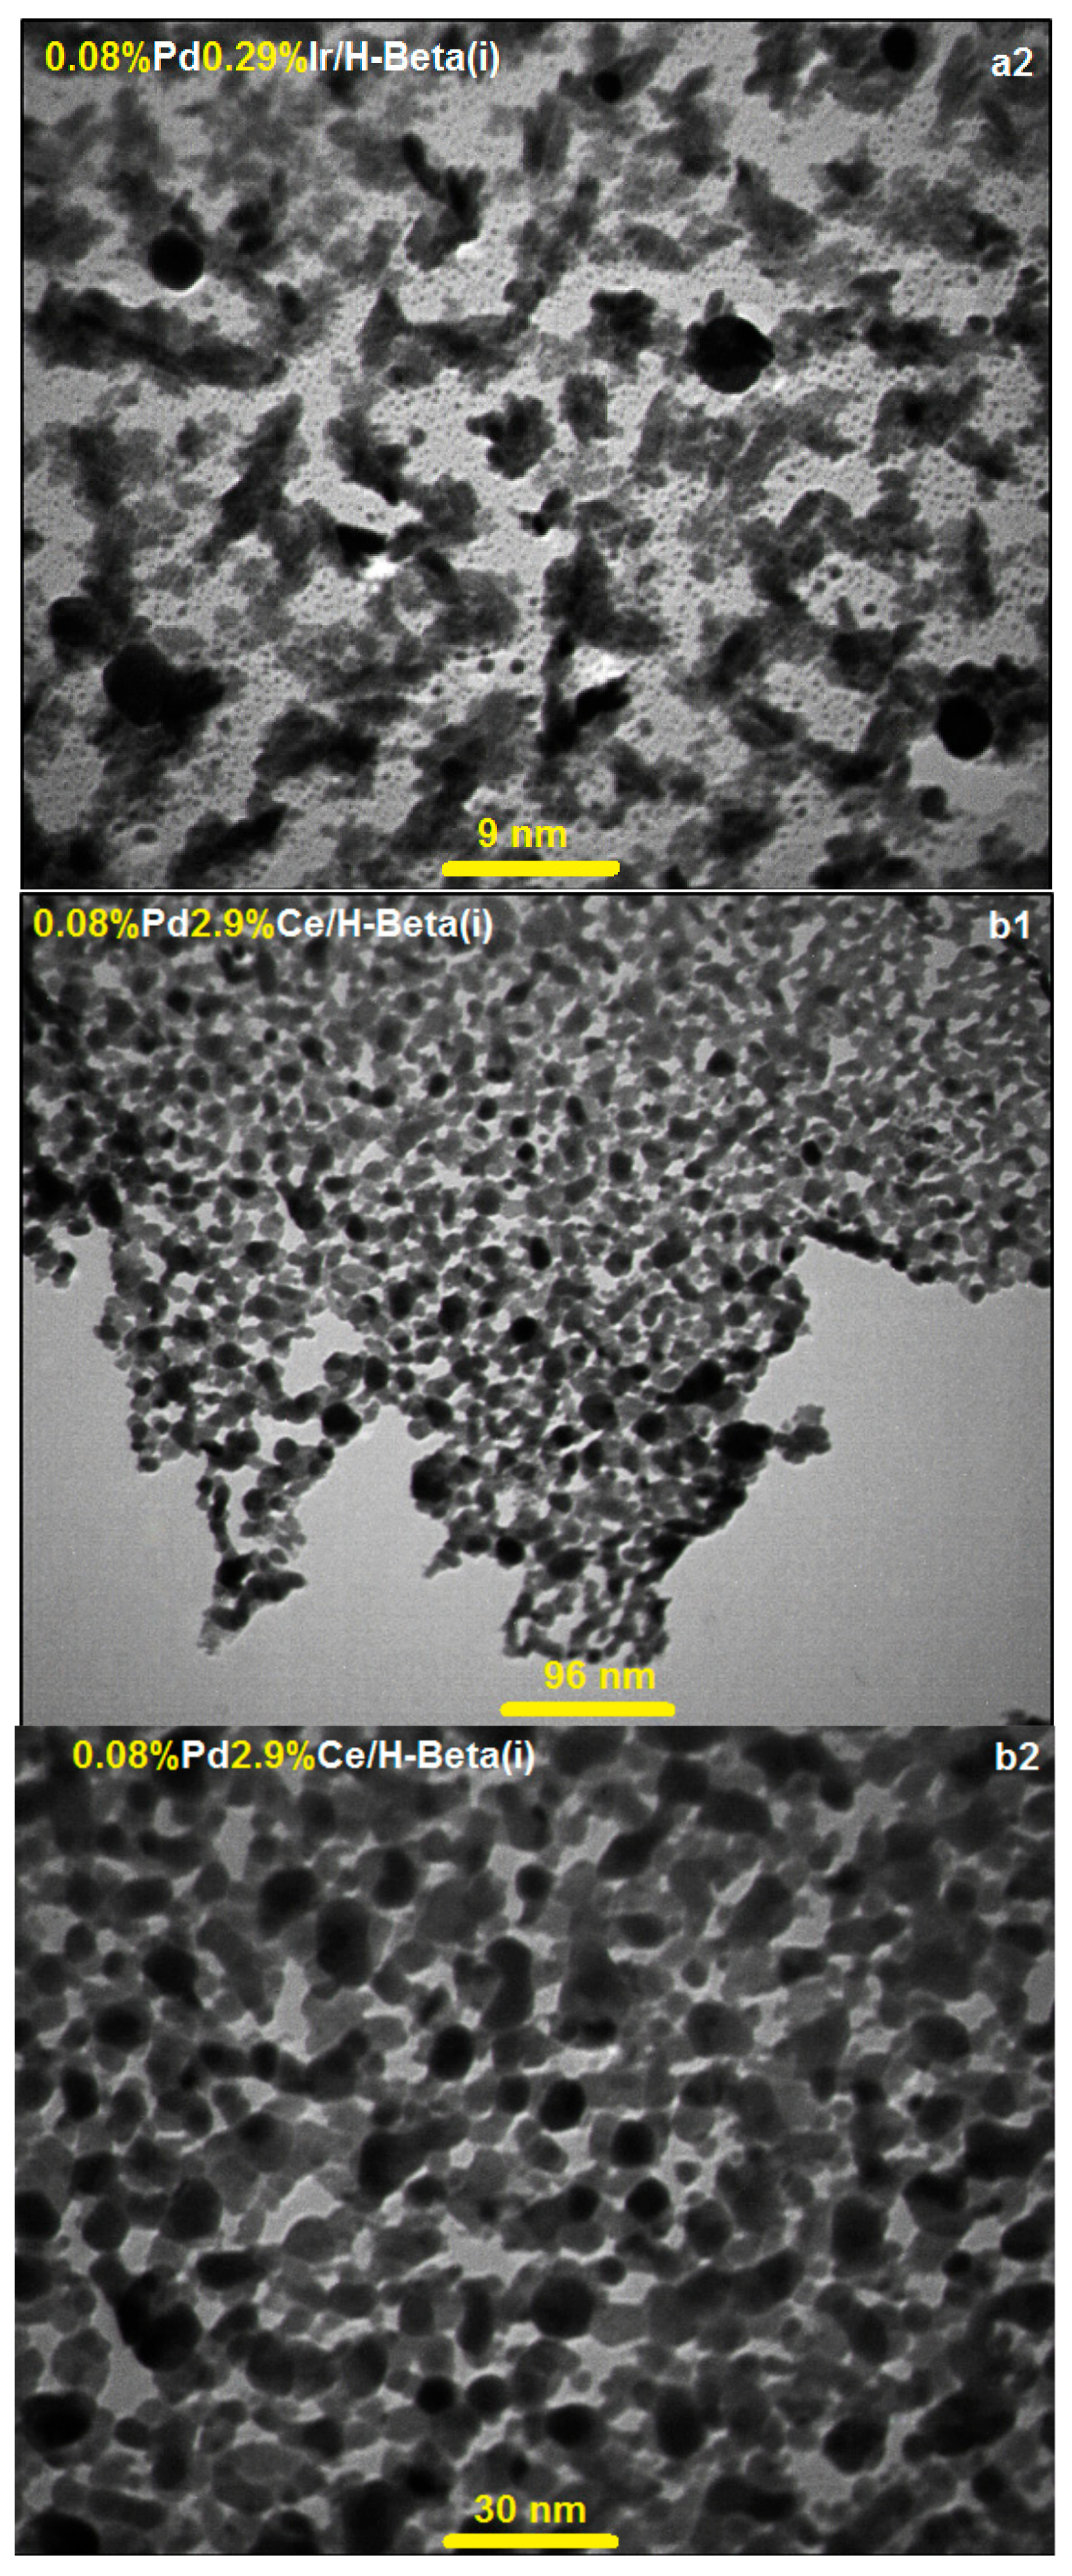
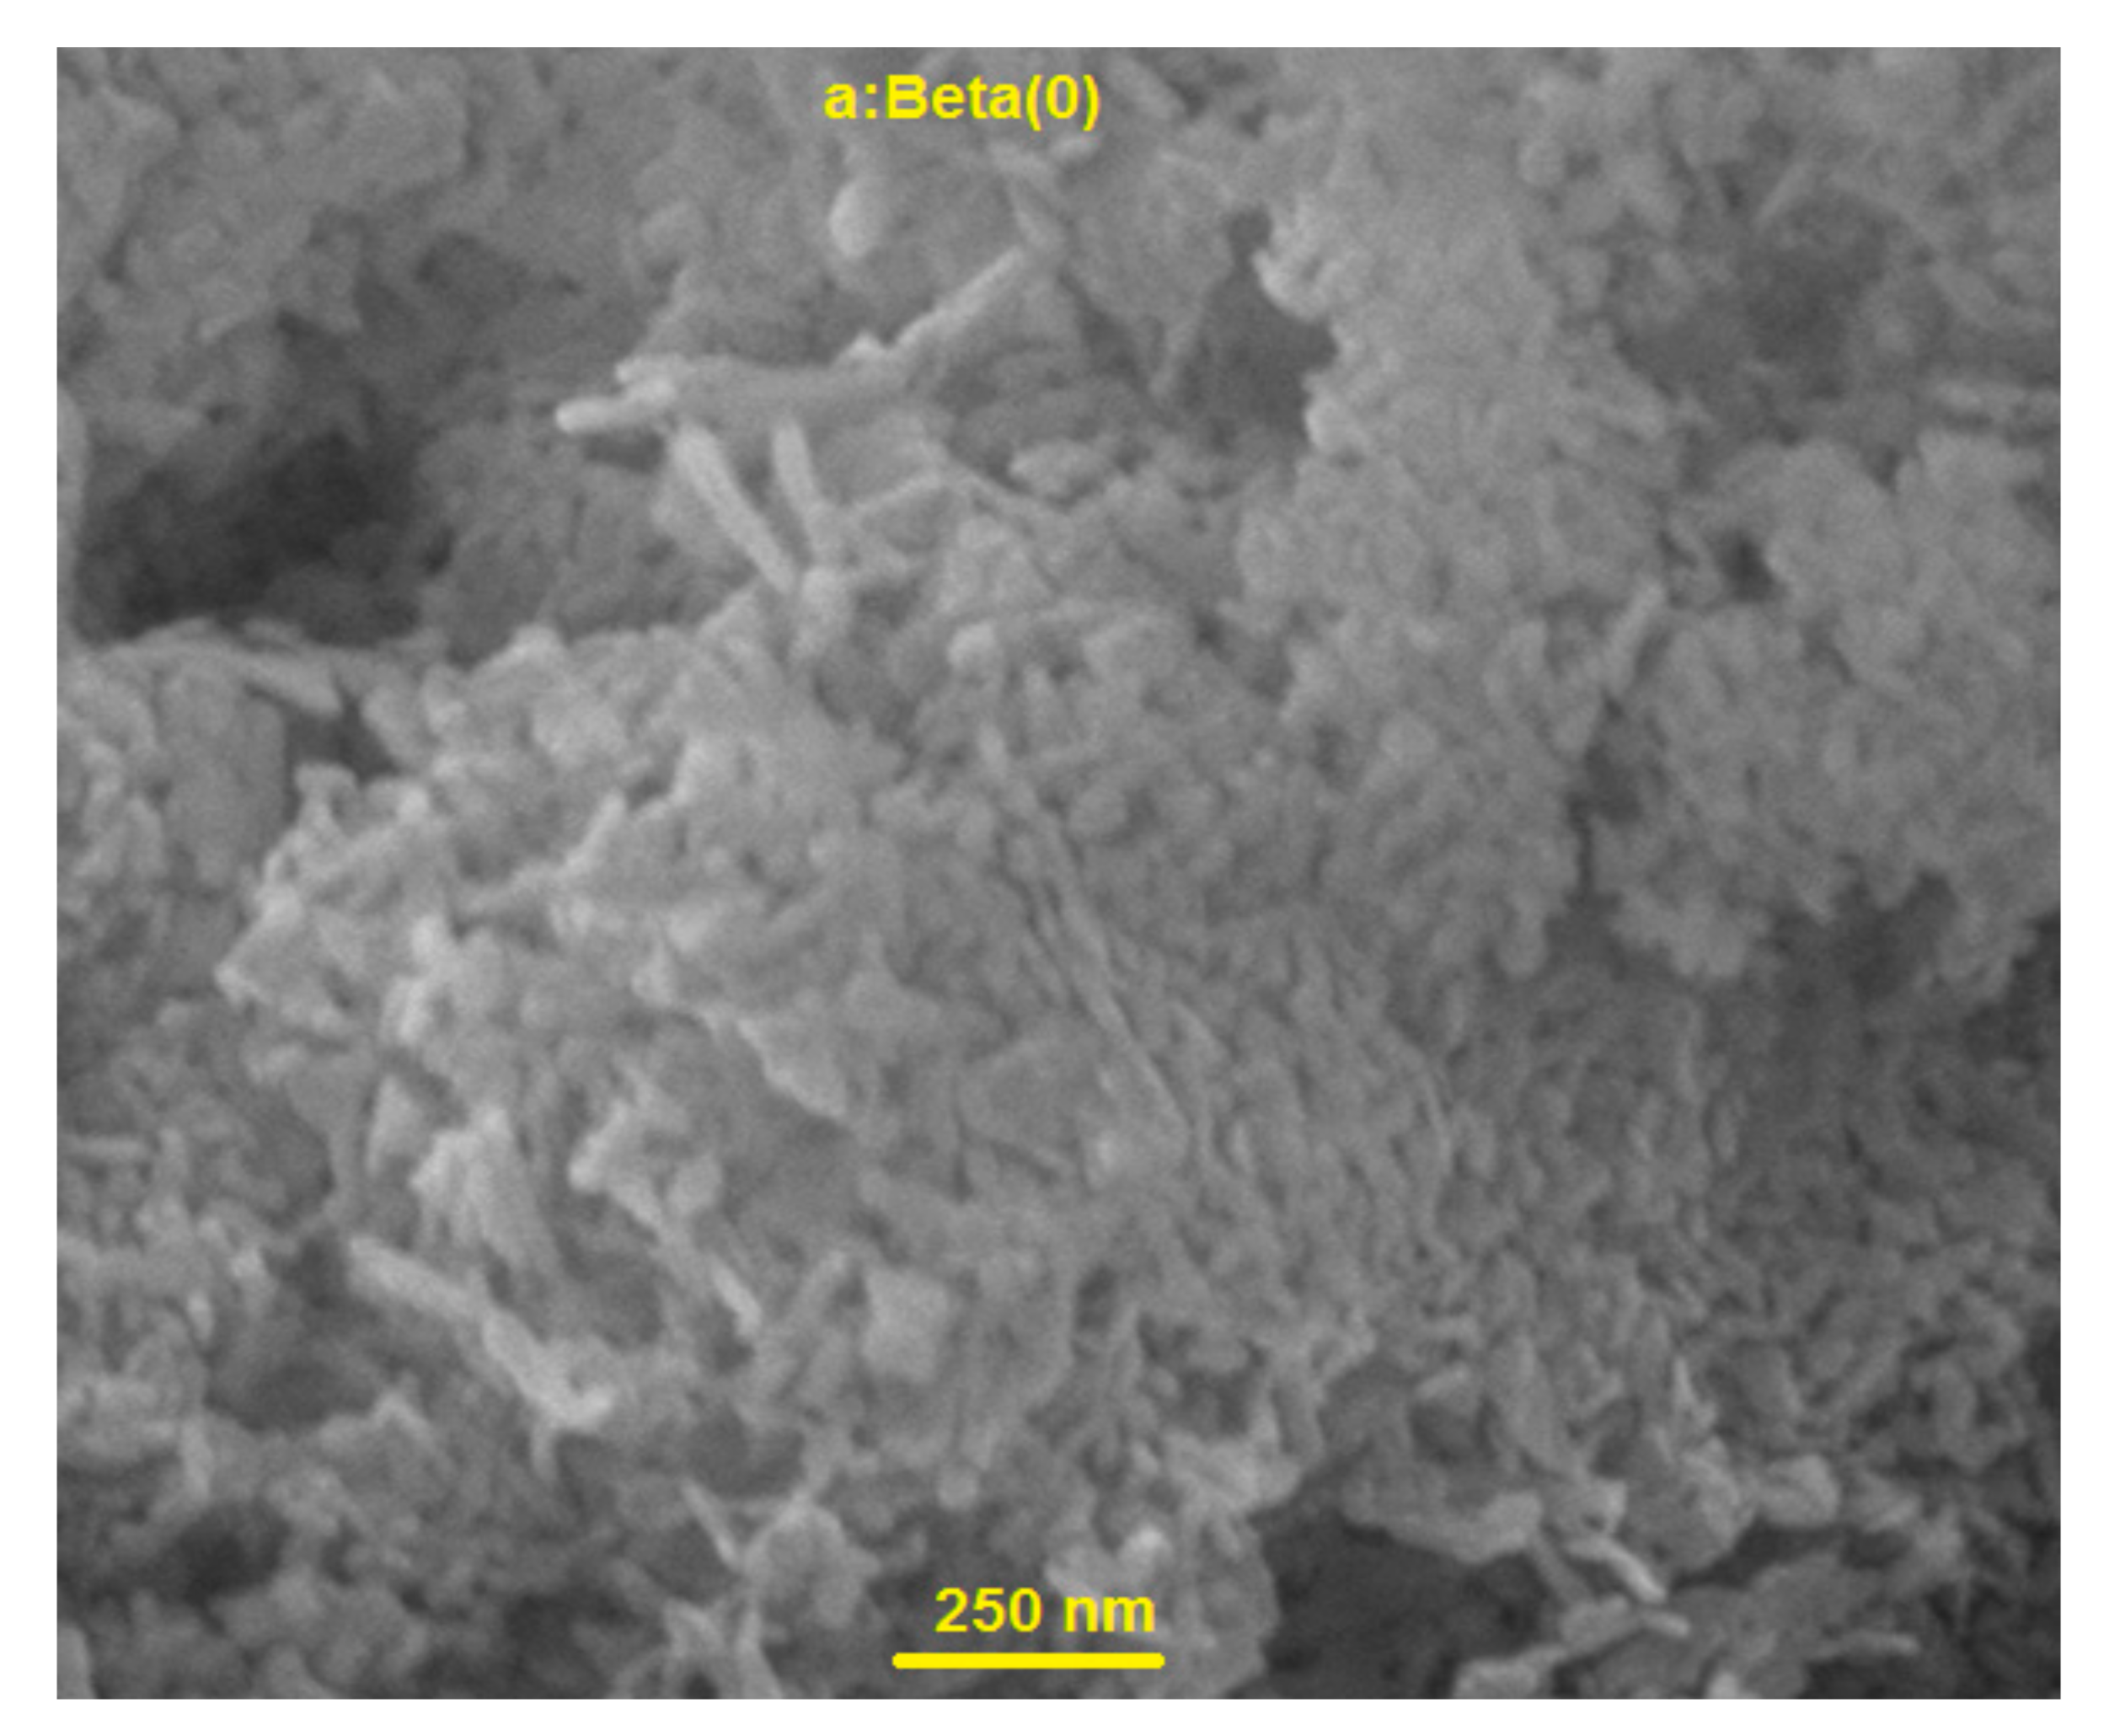
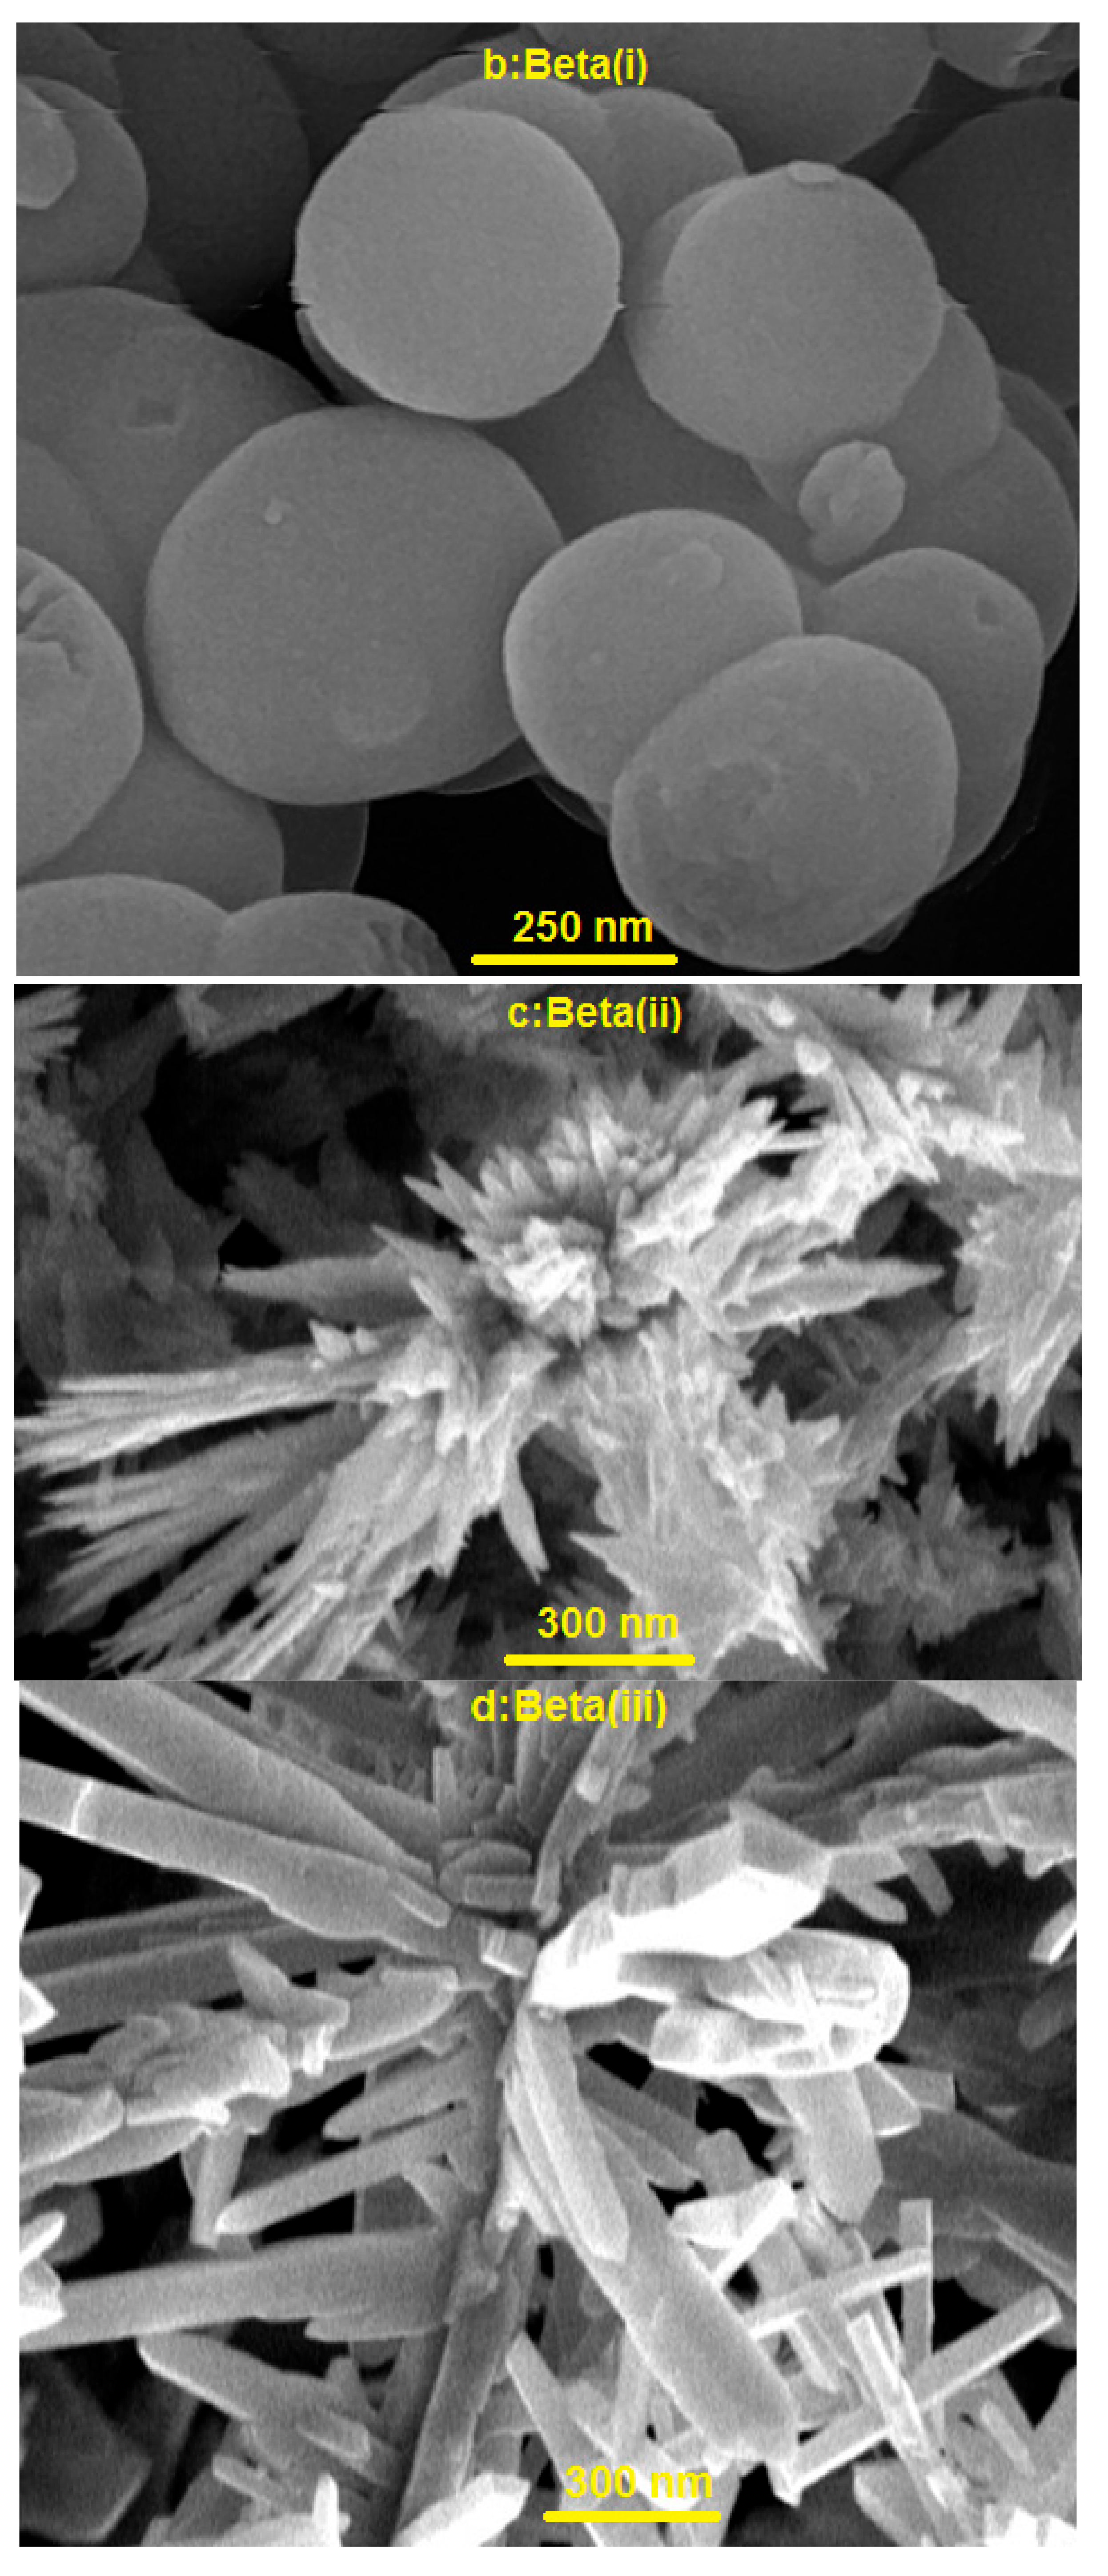
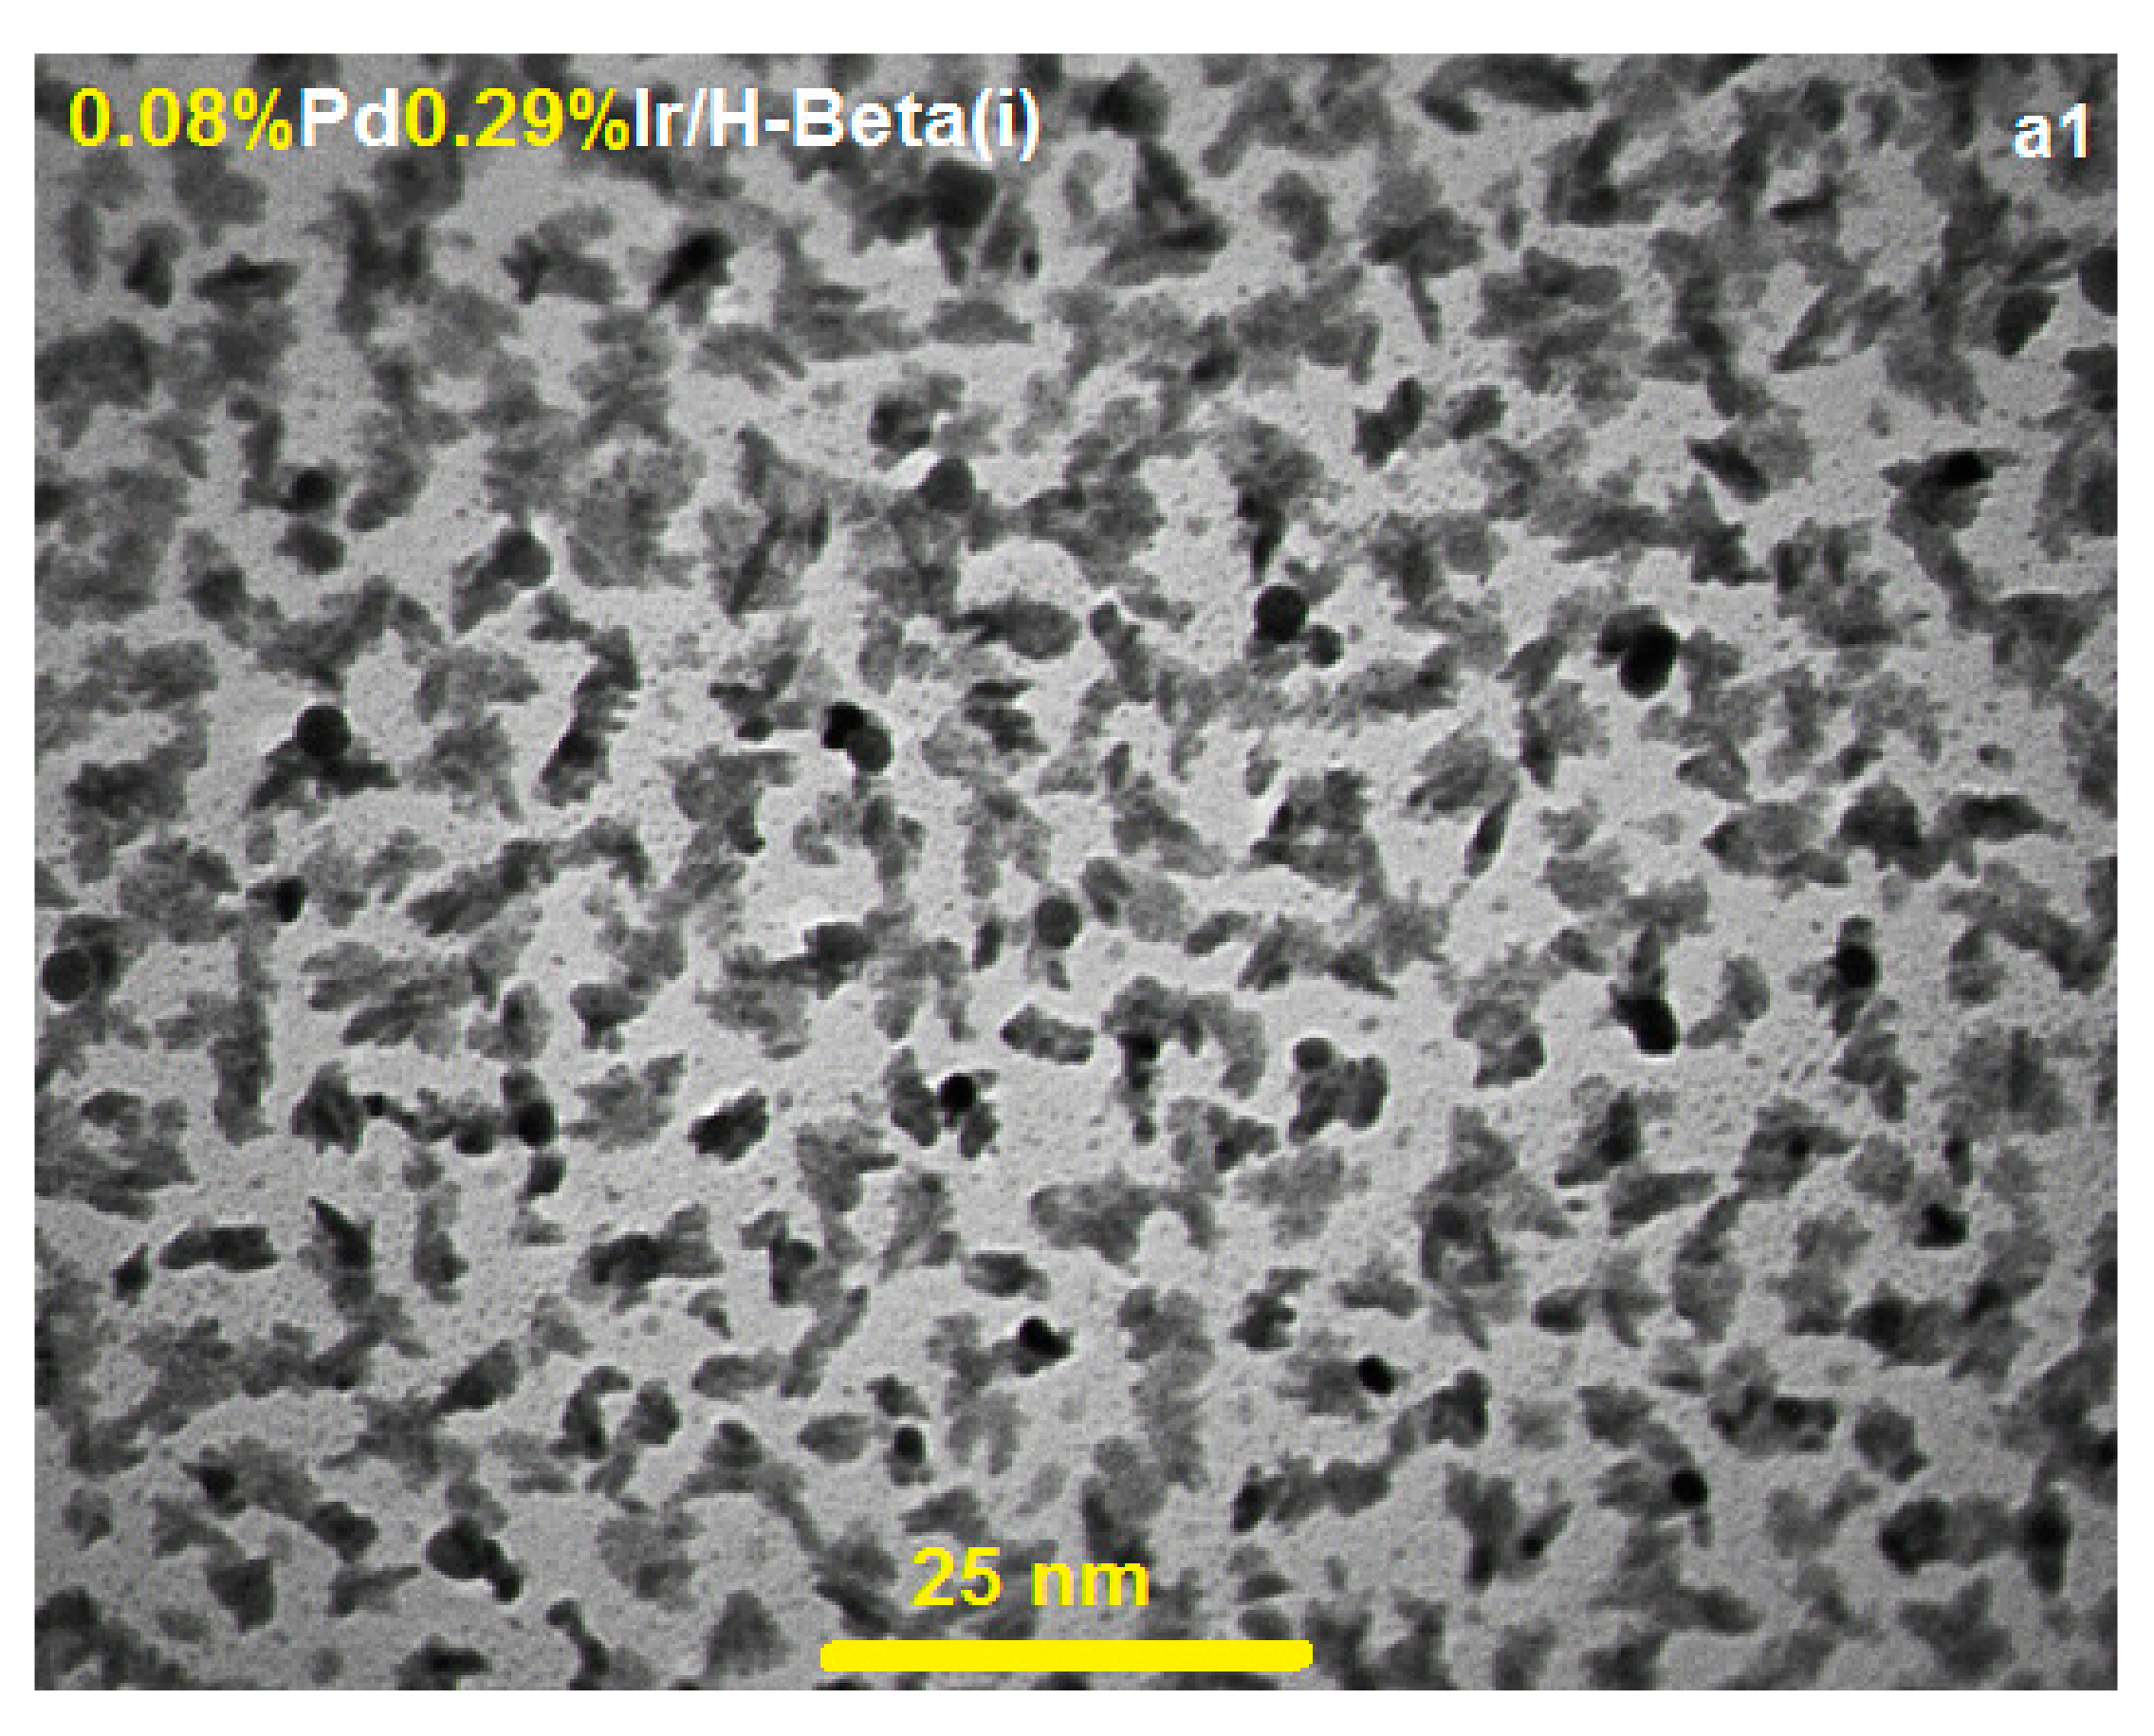
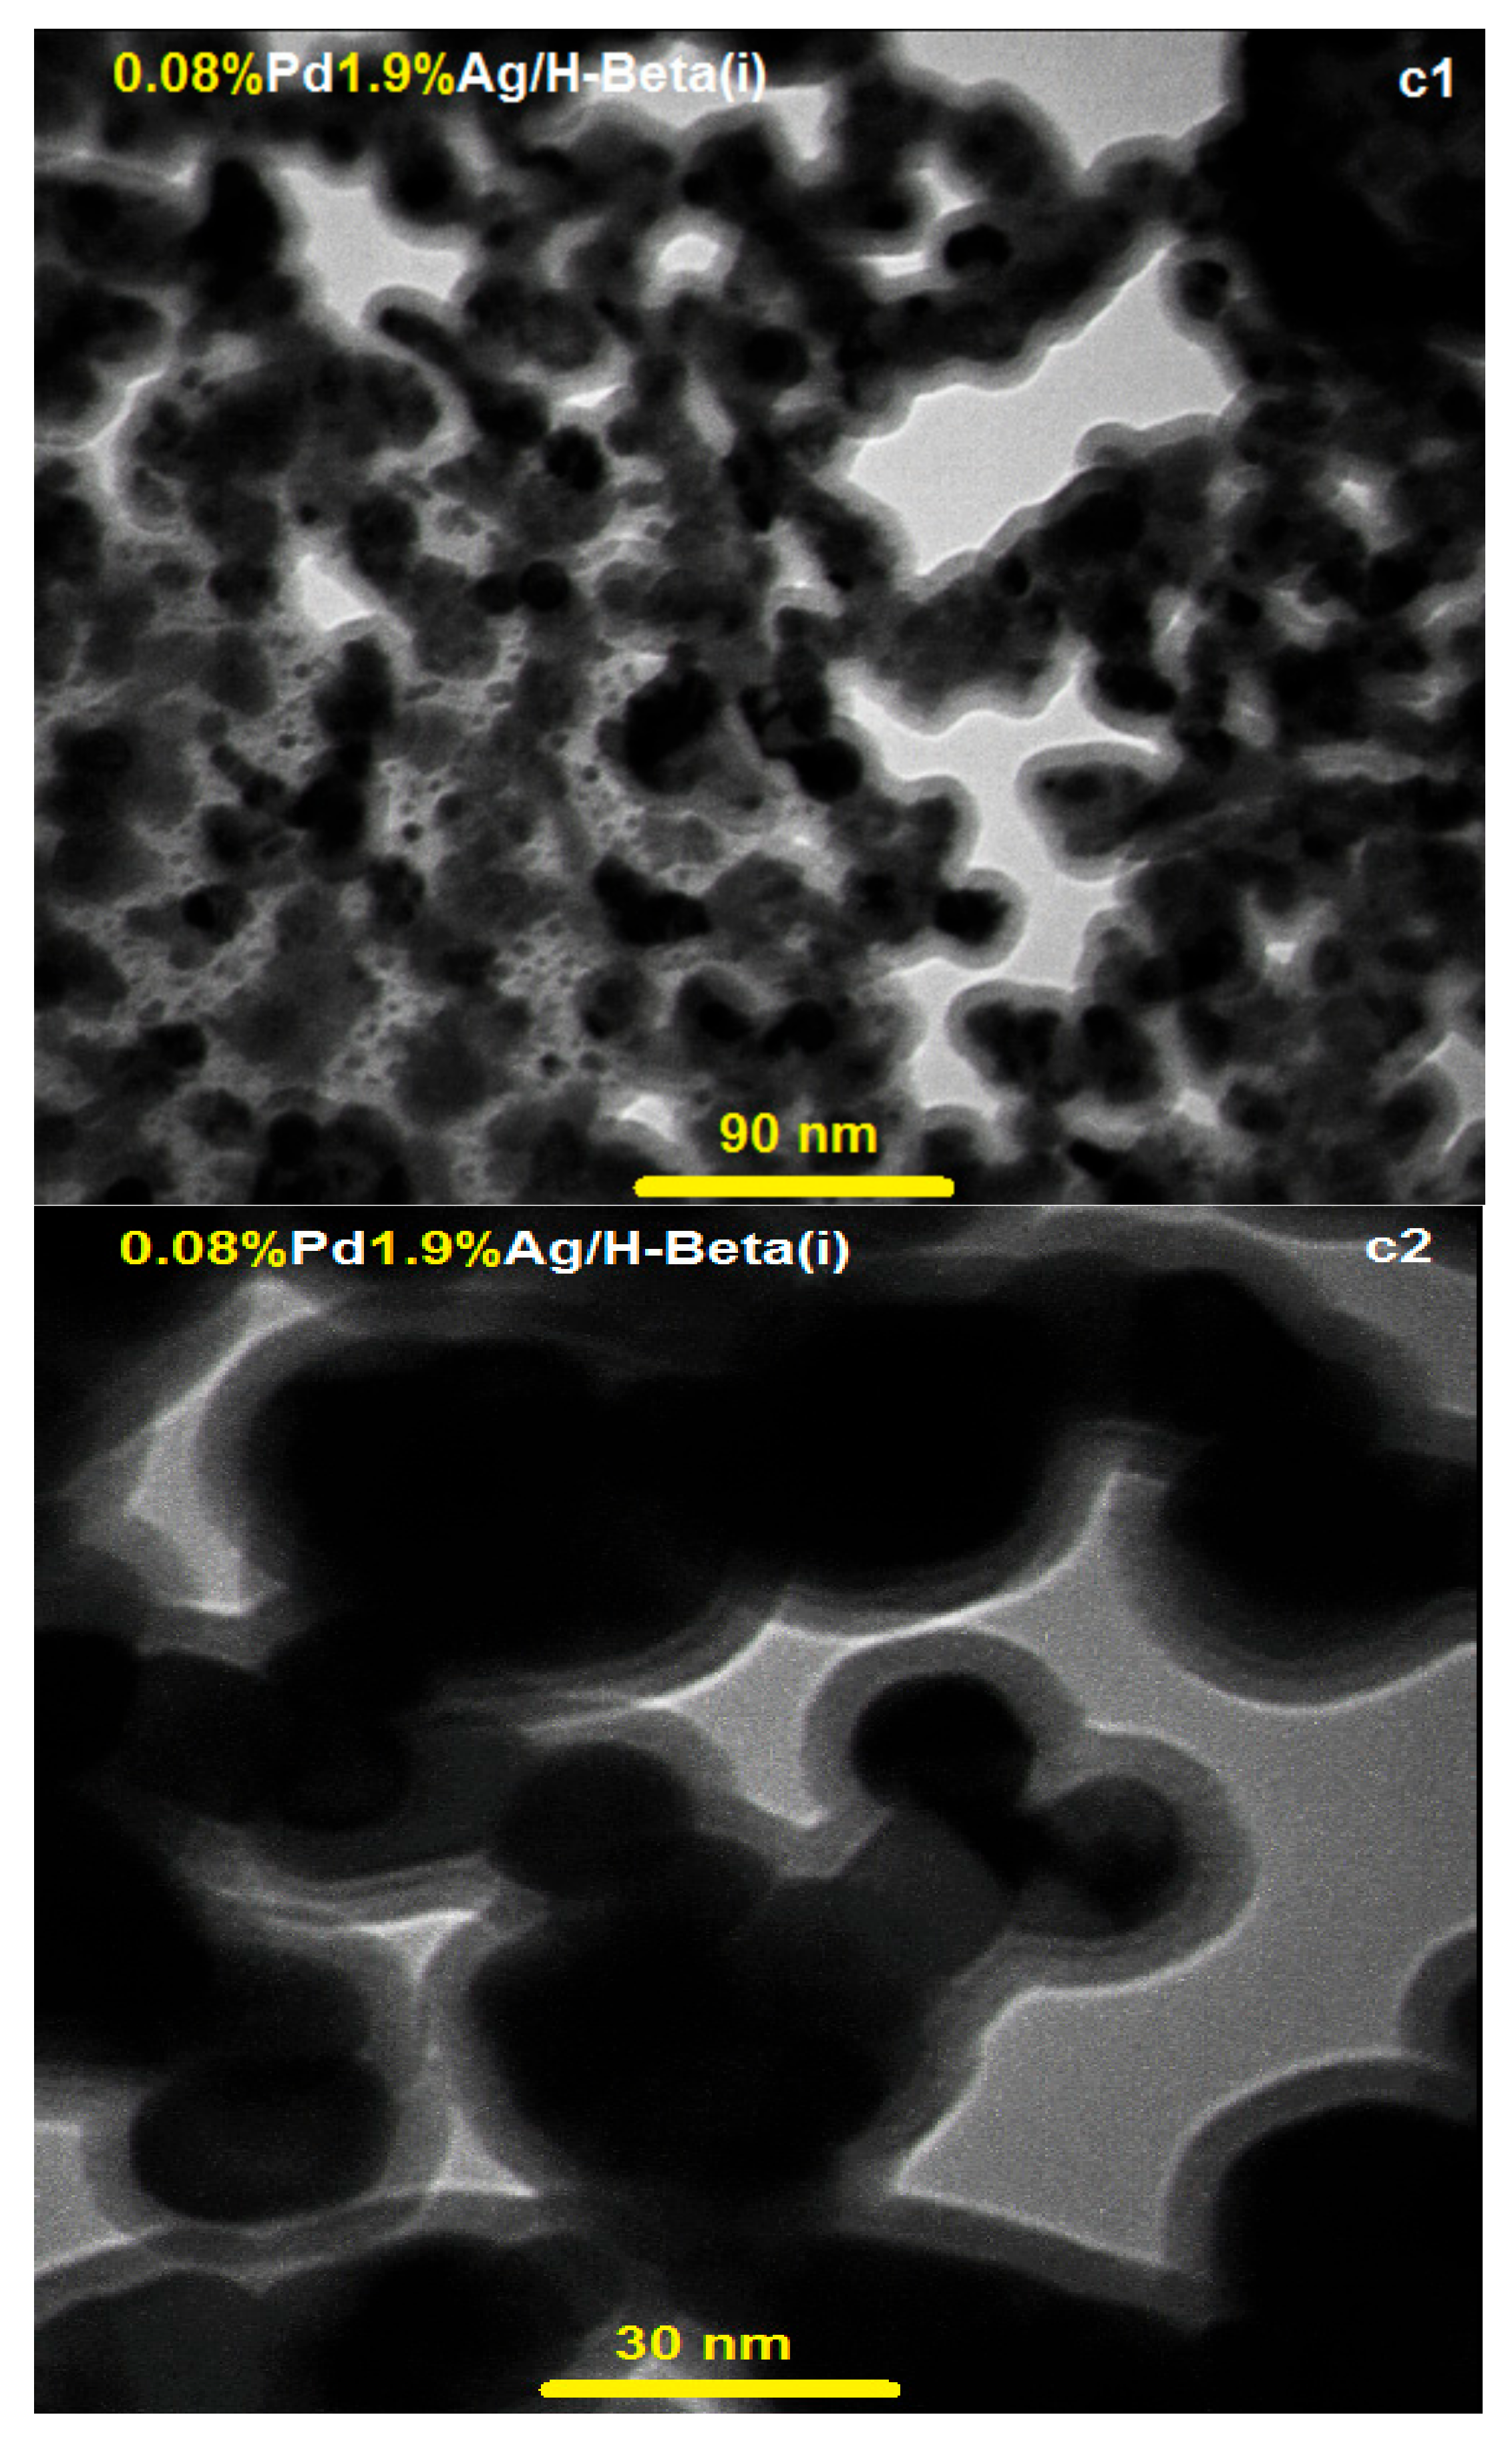
2.2. TEM and FESEM Characterization
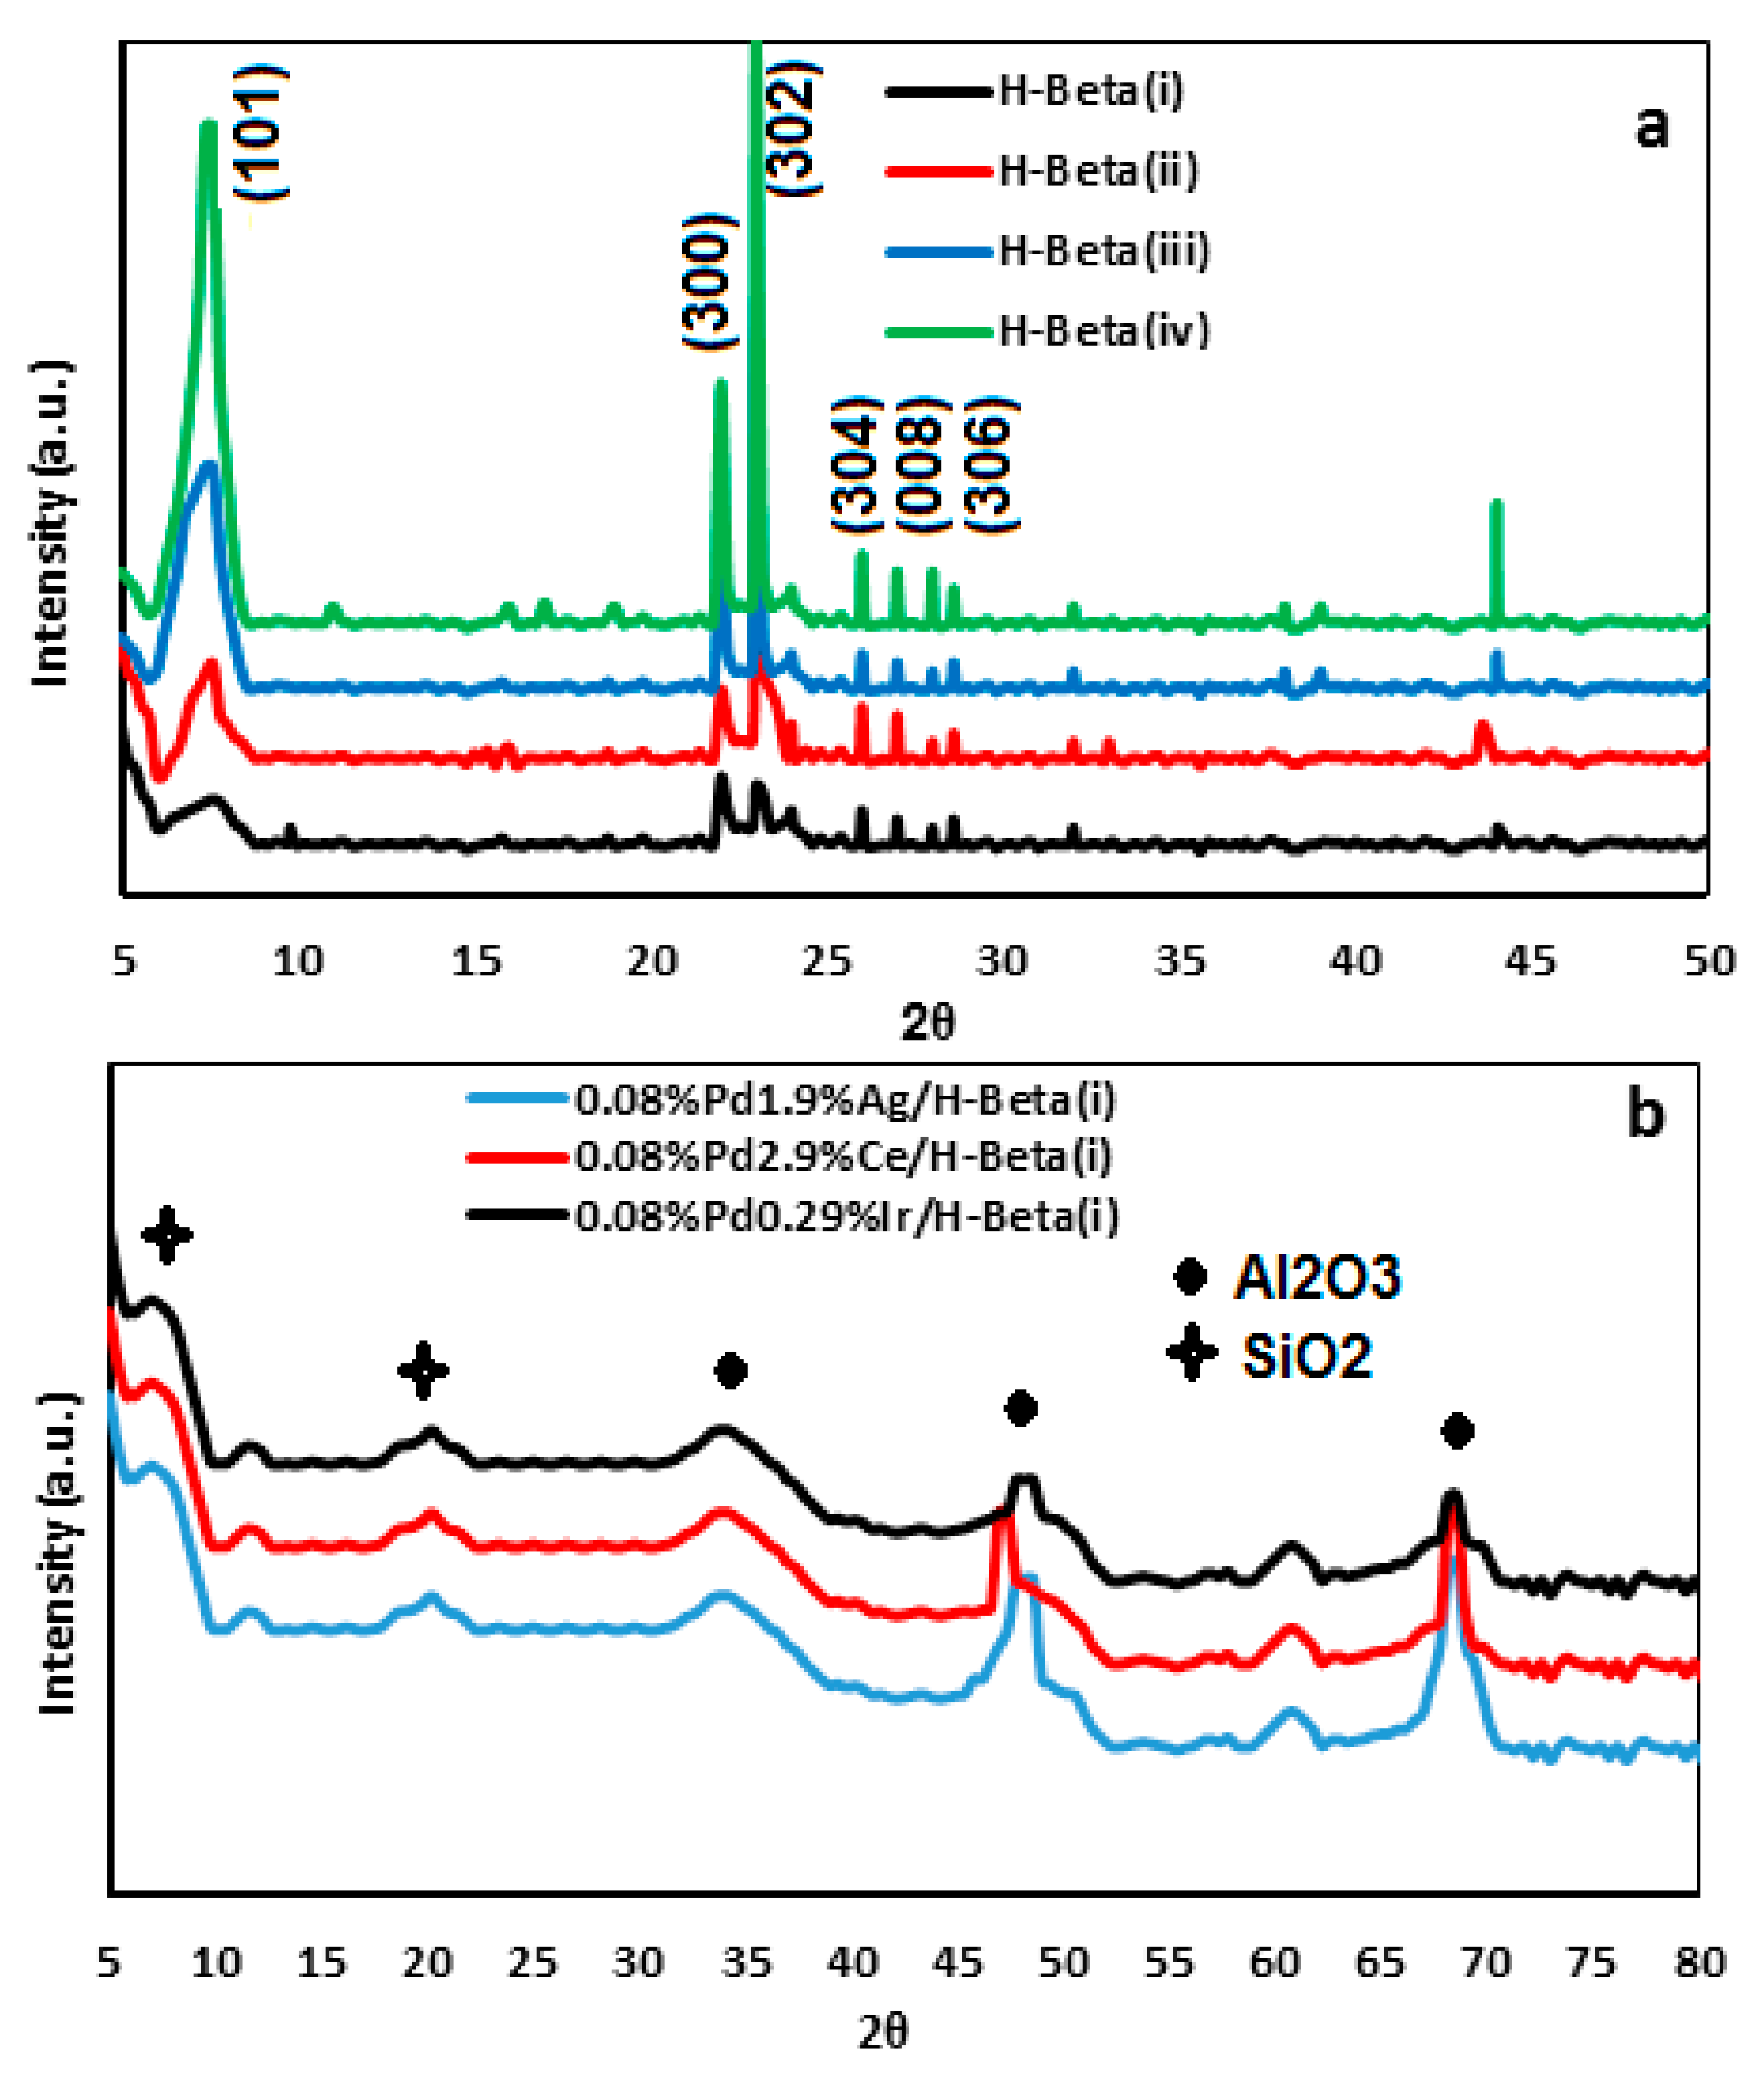
The effect of Si/(Al + SDA) parameter on the Beta morphology of Beta-zeolite is also investigated. The obtained results show that a change in the type of SDA brings about a change in shapes. Figure 3 shows that all of the Beta-zeolite samples display orderly shapes. As Si/(Al + SDA) is reduced in the synthesis procedure, the shapes of the mesoporous Beta-zeolites become more standard. With modifying the Si/(Al + SDA) value for the four different SDA, four various shapes are formed.
SDA also plays a significant role in the synthesis of the supports and catalysts. A large amount of Beta-zeolite with TPAOH, as the SDA, exhibits a spherical shape that is useful for diminishing diffusion restrictions with the average crystal size of ~12 nm (DLS patterns are depicted in Figure S4). Hydrophobicity, size, and the geometric figure of SDAs impress their filling and directing styles. Hence, the morphology and particle direction change with SDA alteration [24]. According to Figure 3, Beta-zeolite precursor with TPABr as the SDA has a clews like shape and the average sizes of crystals are about ~18 nm. Beta-zeolite precursor with morpholine as the SDA has approximately a stretched nanowire shape with nonhomogeneous average sizes of ~40 nm and Beta-zeolite precursor with n-butylamine as the SDA has gear wheel shape with average crystal size of ~67 nm (DLS patterns are demonstrated in Figure S4). These types of zeolite pictures have not been presented in the literature. These results show that the shape of all of the supports depends on the Si/(Al + SDA) parameter. Researches have shown that the selective hydrogenation of acetylene is structure sensitive [64].
The crystal size distribution of bimetallic PdIr, PdCe and PdAg nanoparticles has an excellent influence on their catalytic efficiency which is shown in Figure 4 and Figure S5.
According to Figure S5, the distribution of Pd, Ir, Ce, and Ag metals on the Beta(ii, iii, iv)-based catalysts are much poorer than the Beta(i)-based catalysts (Figure 4) and this result can be explained based on the SDA effects on the supports reported in Section 2.1. Also, the performance of the Beta(i, ii, iii, iv)-based catalysts investigated in the selective hydrogenation of acetylene are reported in Section 2.8. The Cata-test shows that selectivity and conversion of Beta(i)-based catalysts are much higher than the Beta(i, ii, iii, iv)-based catalysts. Therefore, it can be concluded that the Beta(i)-based catalysts are a better support than the Beta(ii, iii, iv)-based catalysts and the denoted optimum support with dispersity of Pd, Ir, Ce and Ag metals in this support is shown in Figure 4.
Figure 4 shows the TEM pattern of the optimum H-Beta(i)-based catalyst. According to Figure 4, Pd and Ir metals have a very good dispersity and TEM images confirm the DLS, BET, and PSD results. Figure 4 shows that Pd and Ir metals have mono and narrow sized particles in the H-Beta(i)-based catalyst but Ag and Ce metals have poorer dispersity compared to Ir metal. It is clearly observed from the Energy Dispersive Spectrometer (EDS) patterns, shown in Figure S6, that the as-acquired supported Pd, Ir, Ce, and Ag catalysts contain Pd, Ir, Ag, Ce, Al, Si, and O.

2.3. XRD Patterns

Figure 5a shows the XRD patterns of mesoporous H-Beta(i), H-Beta(ii), H-Beta(iii), and H-Beta(iv) supports. XRD analysis displayed well-resolved diffraction peaks, which are fine matched to the reference pattern of Beta-based catalysts reported in the literature (peaks at 2θ = 5°–9° along with 2θ = 20°–27°) [65].
No additional amorphous silica or crystalline phase was observed [66]. With an increase in the Si/(Al + SDA) parameter, the severity of diffraction peaks increases which shows growth of particle sizes and reduction of specific surface area. The XRD analyses of the optimum catalysts are shown in Figure 5b. It can be seen that all of the optimum samples have potent peaks at 2θ = 33.8°, 48.6°, and 69.3°, which are probably relative to the characteristic peaks of alumina or silica.
The relatively feeble diffraction peaks at 6.6 and 20.2 are indexed as the specific peaks of Beta-zeolite nanoparticles as formerly explained (Figure 5a). Afterward, the XRD analysis of all of the optimum samples exhibits no clear Pd, Ag, Ce, and Ir oxide diffraction peaks which denotes the absence of bulk crystalline Pd, Ag, Ce, and Ir oxides on the support. Finally, the XRD analysis (Figure 5b) of catalysts shows that the Beta-based catalyst structure remains pure and no Pd peak is observed, as reported in the literature.

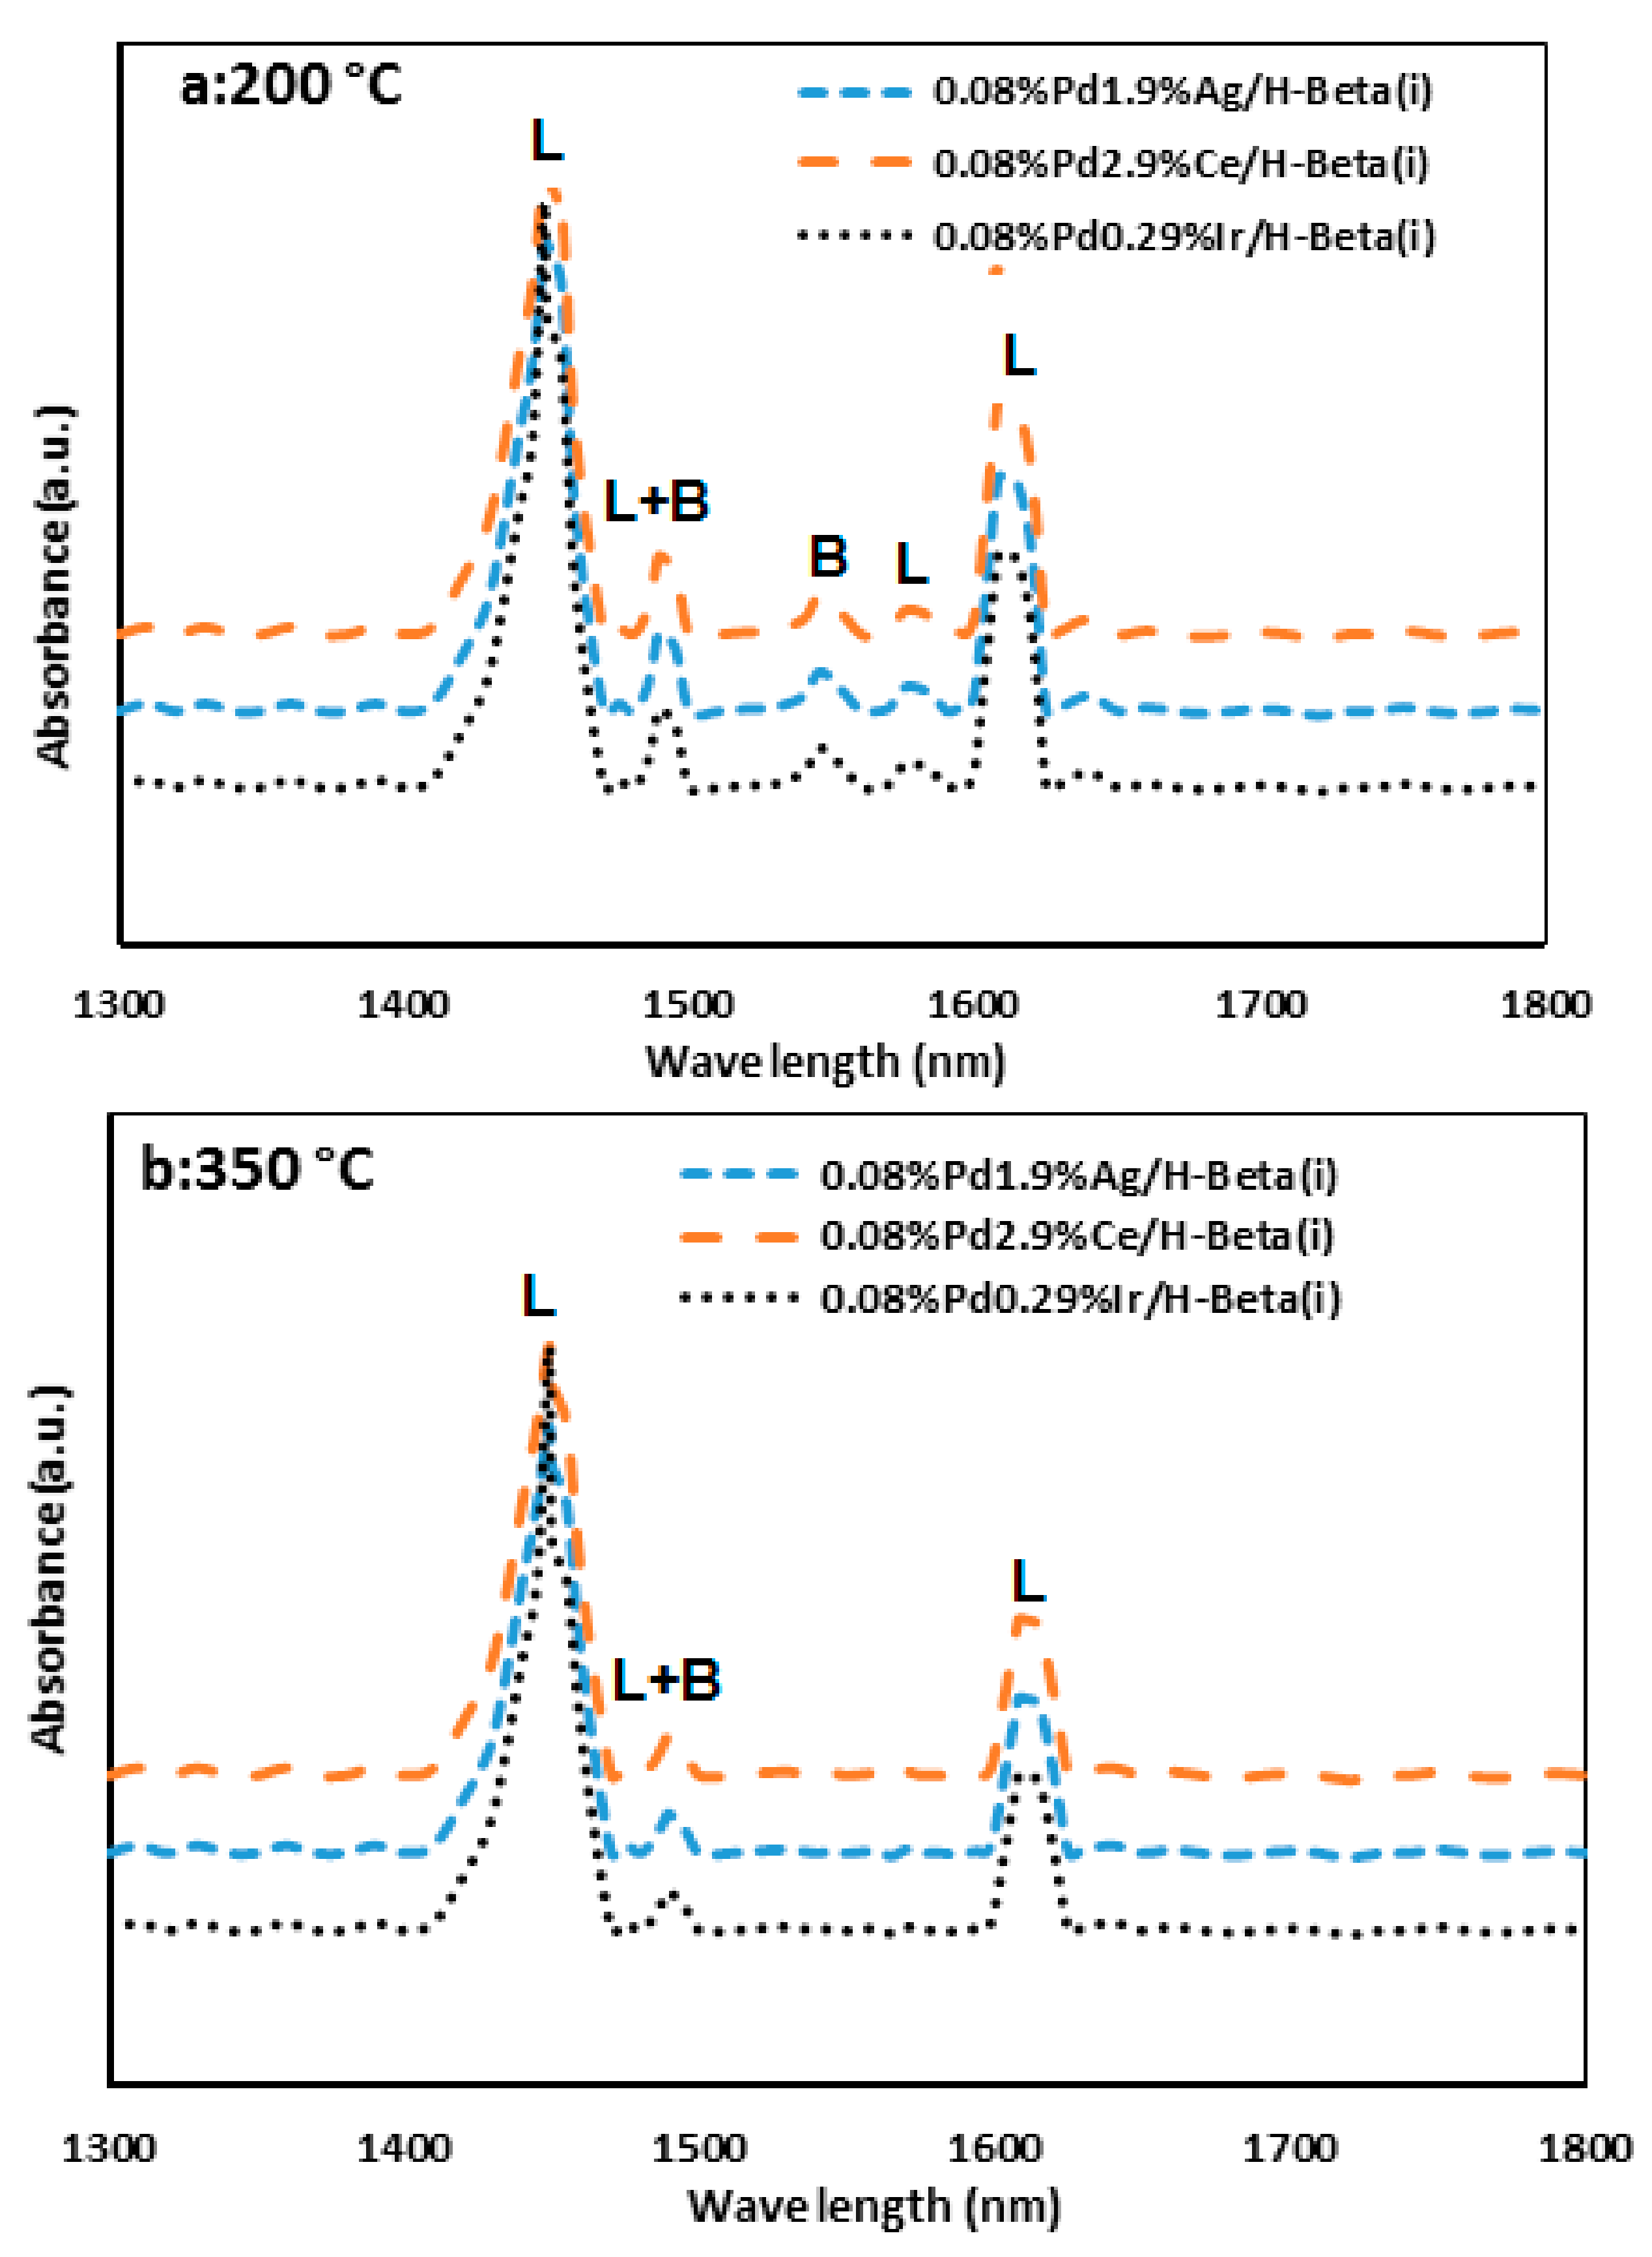
2.4. FT-IR Spectroscopy

The Beta-based catalysts that are prepared with different SDAs were investigated by FT-IR analysis, as shown in Figure 6. The wavelength is near to 458 cm−1 because of the existence of AlO4 and SiO4 intramural, a triangular pyramid module (Figure 6a). The wavelength of about 520 cm−1 confirms that the Beta-mesoporous is generated by 5-membered rings. The severity ratio of the wavelength which is about 520 cm−1 and 458 cm−1, is defined as FTIR crystallinity, which increases in the following order: Beta(i) > Beta(ii) > Beta(iii) > Beta(iv).
The SDA presence can be identified through the feeble H–C stretching sorption wavelength at about 2850–2950 cm−1 (Figure 6b). The absorption intensity at ~3653 and 3765 cm−1 is dedicated to the Al–O–H–Si and Si–O–H vibration [67]. The combination of the obtained results with BET, PSD, DLS, FTIR, and XRD characterizations patterns shows that Beta with TPAOH as SDA is a support with mono sized crystals and moderate pores.

2.5. Surfac Acidity Meassurment

Pyridine is usually used as the probe molecule to evaluate the amount of Lewis (L) and Brønsted (B) acidic sites because of its specific interaction with different kinds of acid sites [68]. The acidities of the optimum samples were considered by means of the pyridine IR spectra on absorbing pyridine and later desorbing at temperatures of 200 °C and 350 °C. Various intensities are detected in the zone of 1800–1300 cm−1, as shown in Figure 7a,b.
As mentioned in the references [69,70], the bands near ~1608 cm−1 and 1449 cm−1 are attributed to the potent L-acid sites, and the bands at about 1640 and 1545 cm−1 are attributed to the B acid sites [71]. While the wavelength near 1575 cm−1 is attributed to the weak L sites, the wavelength near about 1489 cm−1 is dedicated to both L and B sites. As shown schematically in Figure 7a, all of the catalysts supported with H-Beta(i) show a wavelength at about 1545 cm−1 which is related to the B acid sites. The wavelengths appearing at about 1449 and 1608 cm−1 are attributed to L bound acid sites [72]. Furthermore, the generic wavelength presenting at about 1489 cm−1 is attributed to the combination of L and B acid sites. The data on acid strength site distribution in the different catalysts is listed in Table 3.
These results are obtained from the adsorption IR analysis collected from the optimum samples. As depicted in Figure 7a, after pyridine desorption at 200 °C, B and L acid sites of the 0.08%Pd 0.29%Ir/H-Beta(i) catalyst are considerably higher than those of the other supported catalysts. Furthermore, the acid strength distributions of 0.08%Pd 1.9%Ag/H-Beta(i) and 0.08%Pd 2.9%Ce/H-Beta(i) catalysts are approximately alike. There is a minor percentage of weak B acid sites in the catalysts due to the presence of H-kind Beta-precursor in the Beta(i) support. The existence of a minor percentage of B acid sites is due to the addition of a small percentage of Al species in the catalysts. After degassing at 350 °C (Figure 7b), no B acid site was identified in the samples. The percent of moderate and potent L and B is as follow: 0.08%Pd 0.29%Ir/H-Beta(i) > 0.08% Pd 2.9%Ce/H-Beta(i) > 0.08%Pd 1.9% Ag/H-Beta(i).

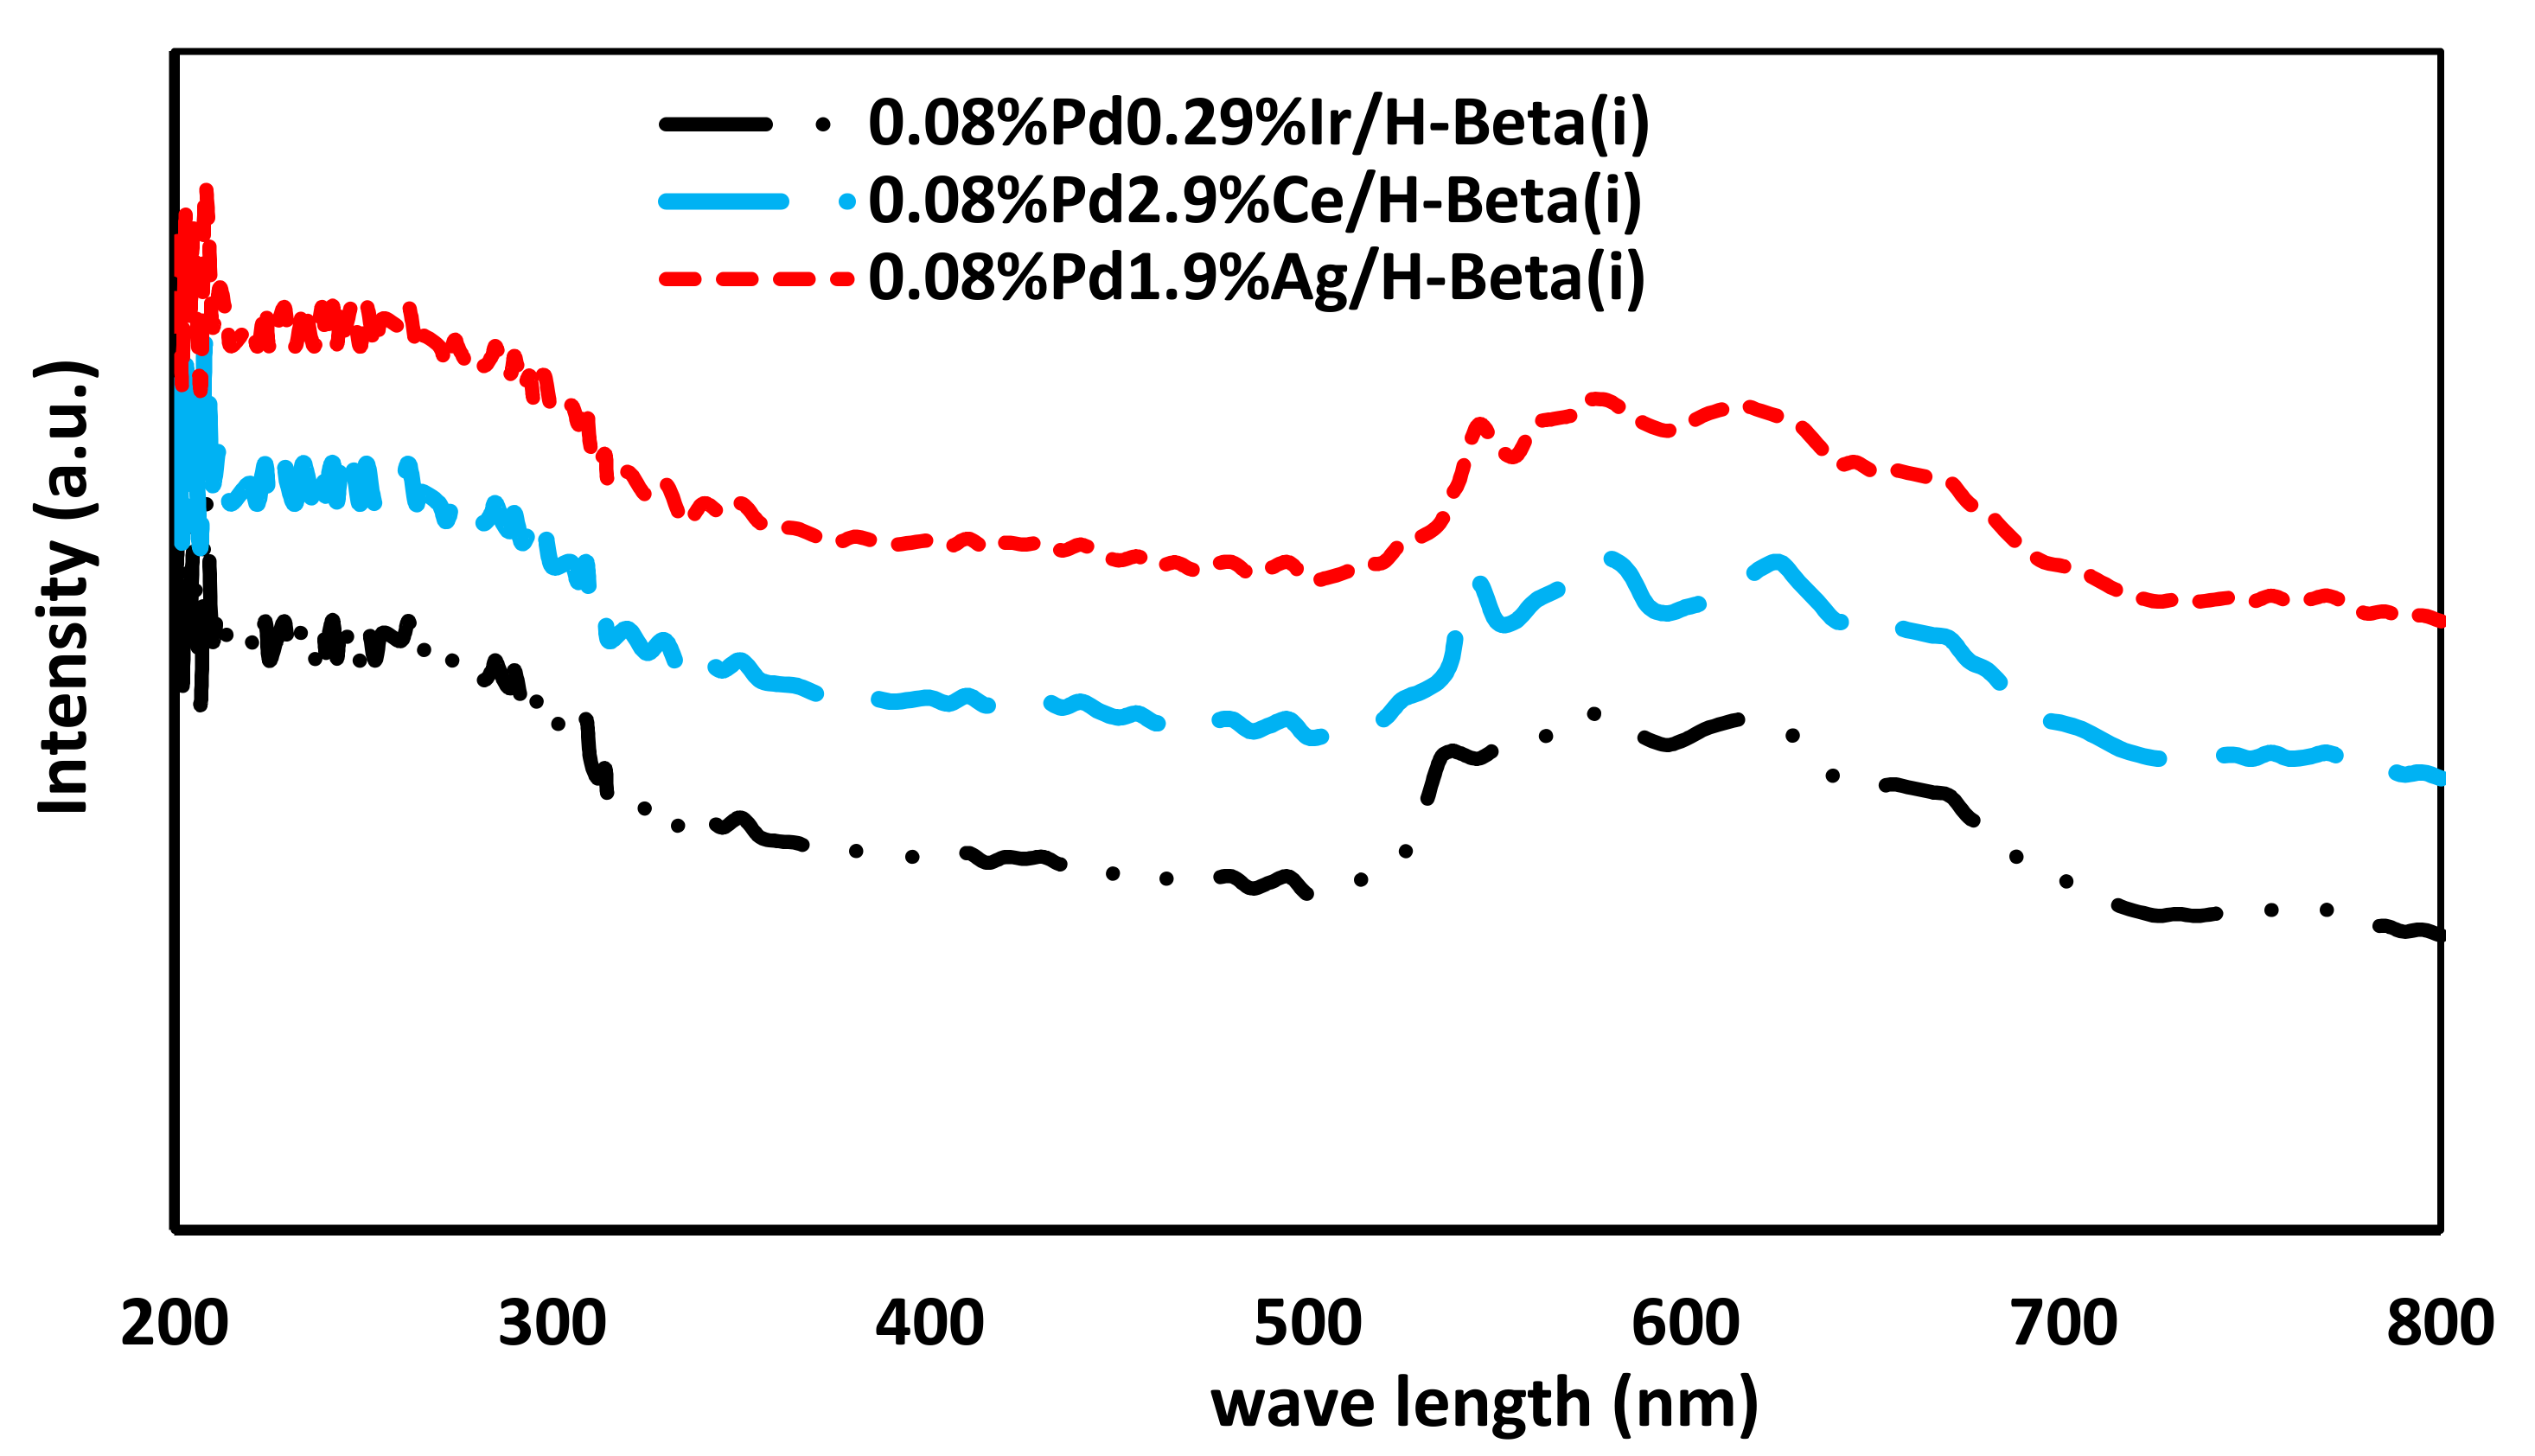
2.6. UV–Visible Spectroscopy Specification

The scattering of Pd, Ce, Ag, and Ir oxide molecules on the supports was characterized by Ultra Violet (UV) spectrophotometer. The UV absorption analyses of various catalysts with different amounts of crystalline metals are shown in Figure 8. UV spectroscopy in the range of 200–800 nm displays the polymerization states and the nature of the chemical forms of Pd oxide on the surface of the catalysts.
The sorption wavelengths related to LMCT (ligand-to-metal charge transfer) O2− → Pd2+ are detectable in the 200–390 nm range [73]. The precise location of the wavelengths reflects the native symmetry of Pd2+ affiliated with their agglomeration and coordination environments states [74]. In this analysis, the absorption bands in the range of ~260–290 and 290–360 nm, that show isolated tetrahedral and octahedral Pd species, respectively, are detected in all of the catalysts. Also, 0.08%Pd0.29%Ir/H-Beta(i) is well shown in Figure 8 which illustrates an increase in the ratio of scattered tetrahedral and octahedral Pd molecules after modification owing to TPAOH. The key wavelengths in the visible zone are detected at about 538, 572, and 615 nm which are because of the incorporation of the triangular pyramid of Ag(II), Ir(III), and Ce(III) into the support. Nevertheless, the peak intensities are moderately weak in 0.08%Pd 0.29%Ir/H-Beta(i) (see Figure 8). This phenomenon may be due to the presence of Ir3+ molecules which have lower polymerization than the other metals. The UV–Vis analysis results suggest that the specification of the active phase (Pd) and promoter (Ir) shows superior scattering on the surfaces of Beta when TPAOH is added through the synthesis procedure.

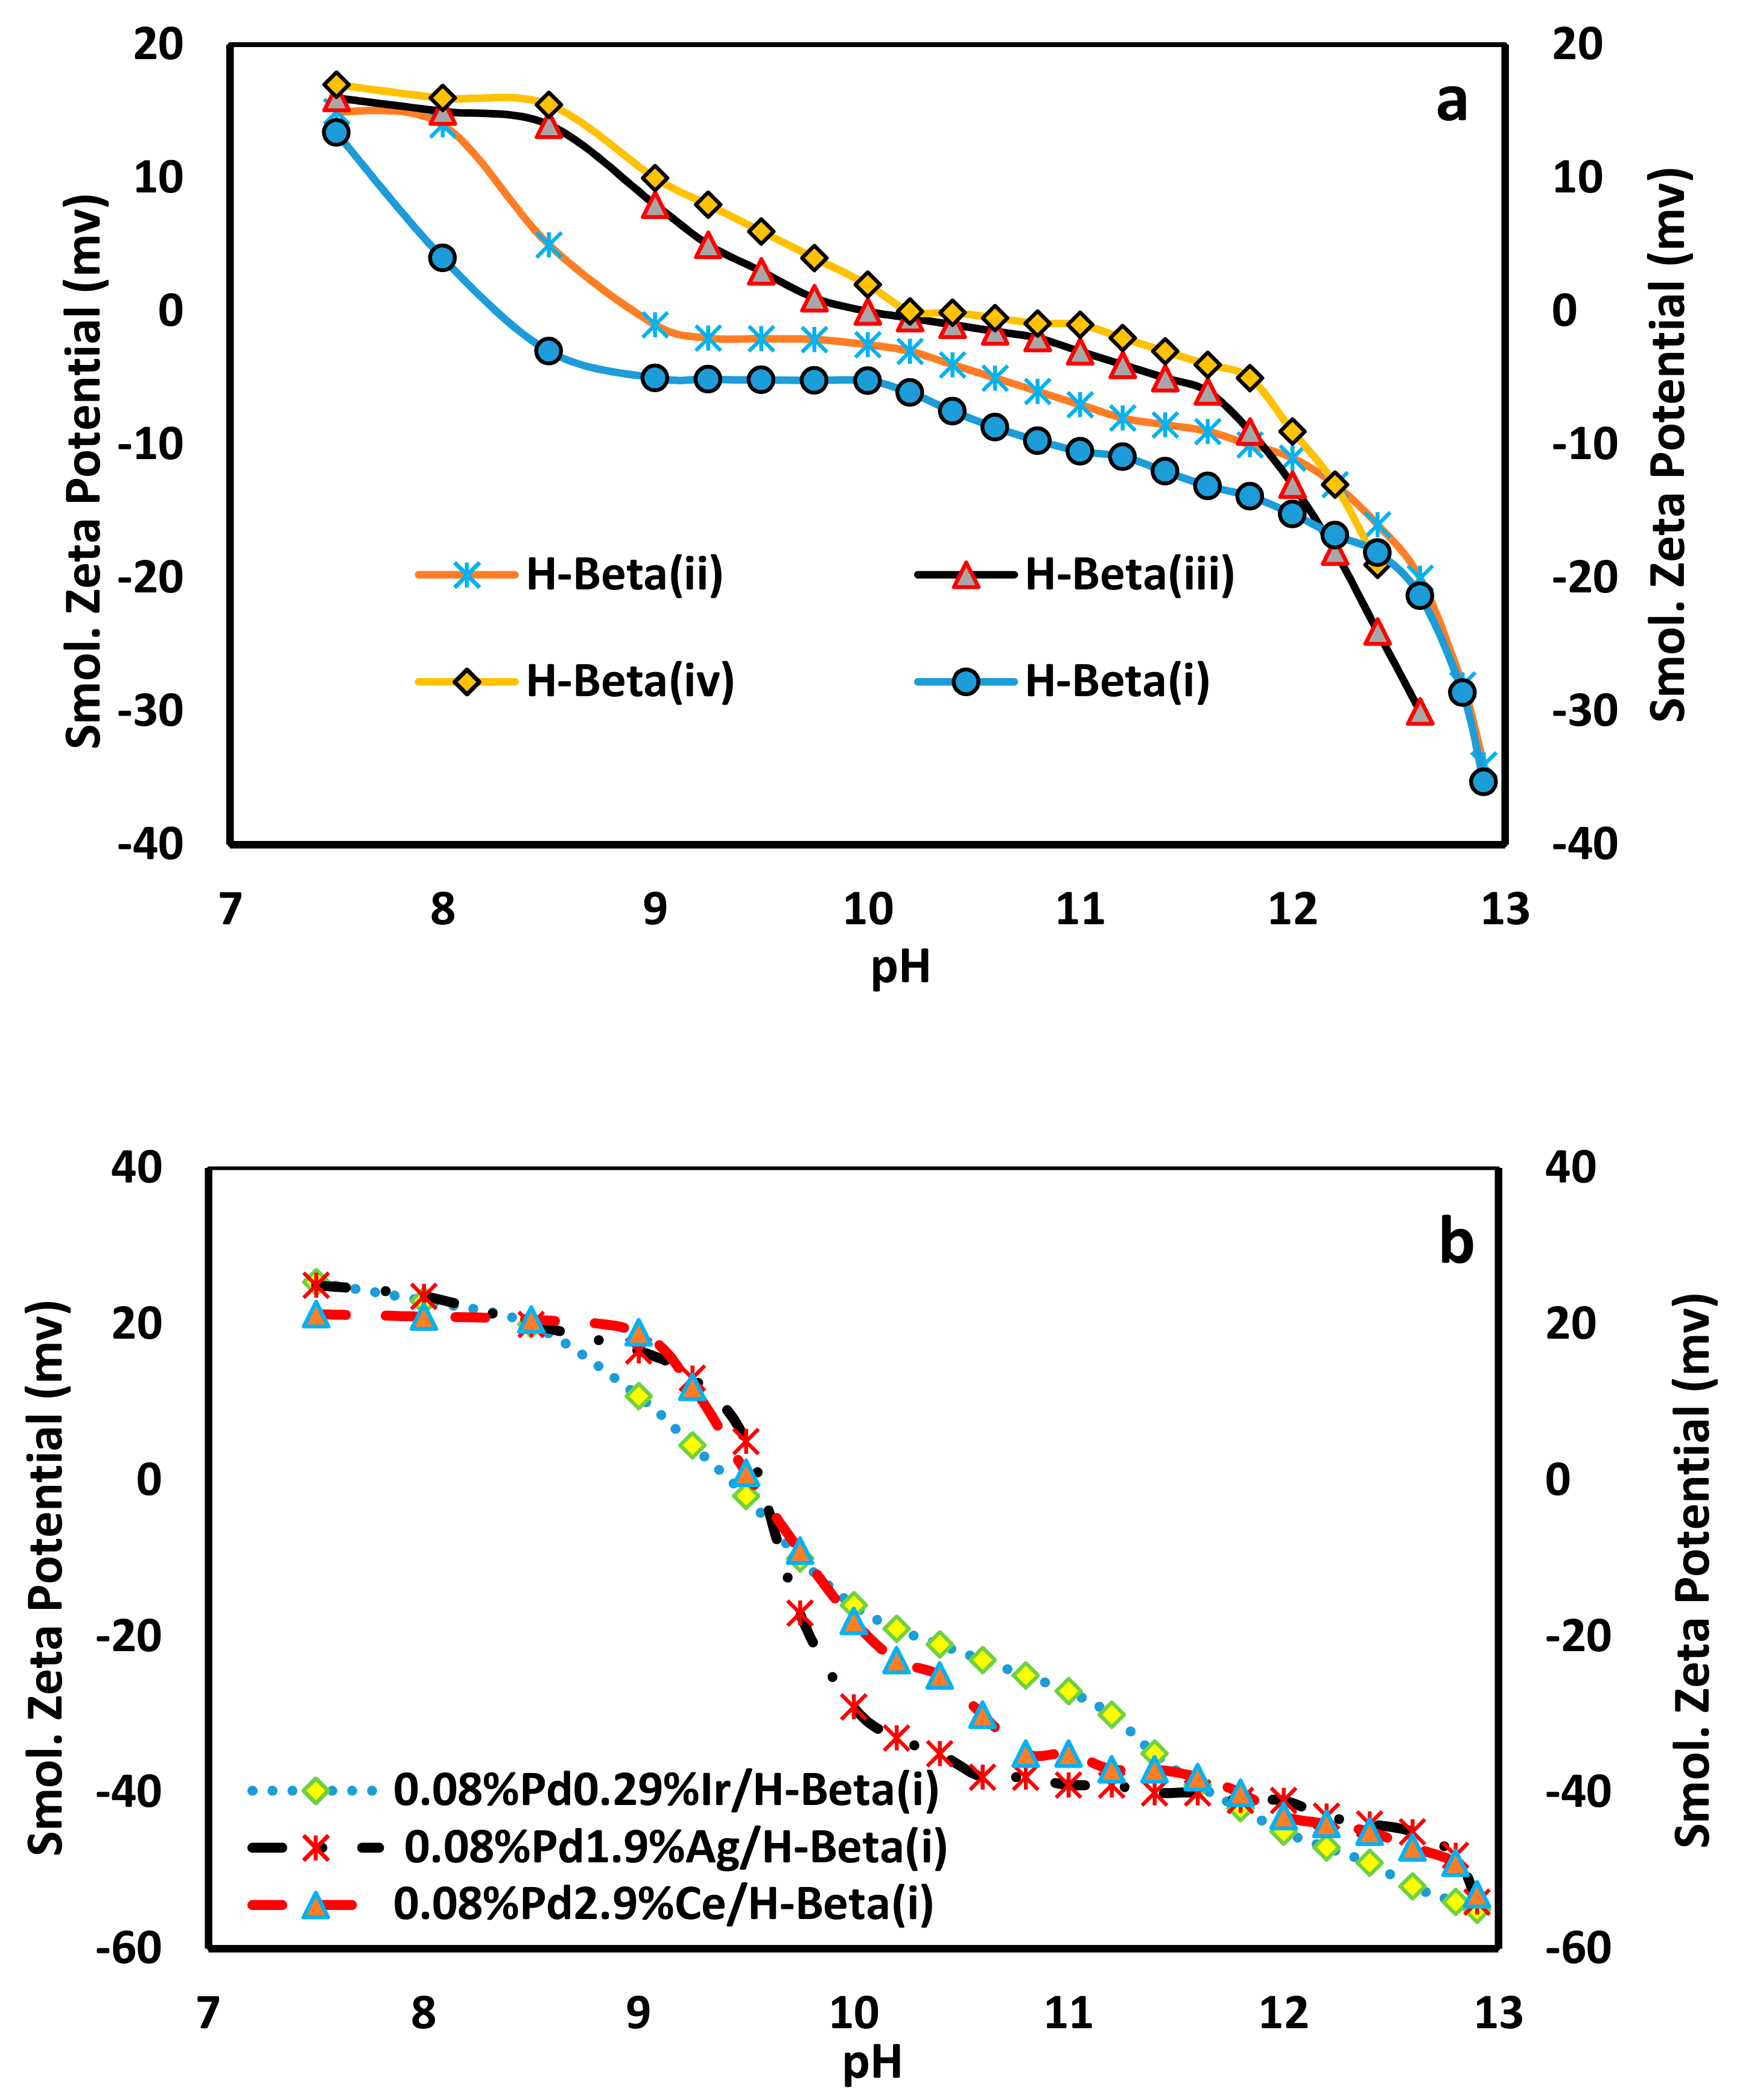
2.7. Zeta (ξ) Potentiail Analysis

The structure of the substances is one of the key factors that affect the reciprocal action between the active site precursor solution and support of the specific surface. It can be explained using the below mechanisms: (1) ligand-exchange, (2) ion-exchange, and (3) electrostatic interaction. The electrostatic reciprocal action depends on the pH of the solution and supports charge. The ξ potential technic has provided beneficial data according to the material charge in support and catalyst preparation [75]. Figure 9a,b show the results of ξ potential measurements carried out using different supports and catalysts. All of the supports and catalysts are presented with NaNO3 and de-agglomerated in an ultrasonic probe with high energy for about 1 h.
As shown in Figure 9a, the point of zero charges (PZCs) for H-Beta(i) is at pH ~8.3, for H-Beta(ii) is at pH ~8.92, for H-Beta(iii) is at pH ~10 and for H-Beta(iv) is at pH ~10.2. In other words, the surface charge of H-Beta(i), H-Beta(ii), H-Beta(iii), and H-Beta(iv) is positive below pH ~8.3, 8.92, 10, and 10.2, respectively, and becomes negative above these values. It is important to note that for a special substance, the amount of the ξ as a function of pH depends on many parameters, e.g., the electrolyte concentration, whether the material is solid or porous, the measurement method, and the presence of impurities or additives. Generally, ξ at high amounts of pH should be significantly higher than that at pH ranges near the PZCs. This might be due to an increase in the electrolyte concentration and/or a partial dissolution of the special substance during the titration to lower or higher pH values. The pH values for all of the support and catalyst emulsions were ~>6.5 before starting the titration. The PZCs for the micro/mesoporous structure do not significantly differ from the corresponding solid structures since all of the nanoparticles with zero charge are motionless in the applied electric field. Figure 9b displays the same type of measurements which are performed using the optimum catalysts. These measurements were carried out without de-agglomeration and sodium nitrate addition. As Figure 9 depicts, the PZCs for 0.08%Pd0.29%Ir/H-Beta(i), 0.08%Pd2.9%Ce/H-Beta(i), 0.08%Pd 1.9%Ag/H-Beta(i) are at pH ~9.4, 9.52, and 9.55, respectively. For these samples (Figure 9b), all of the patterns (ξ = f(pH)) present the same shape, and cross together at the isoelectric point. For 0.08%Pd 0.29%Ir/H-Beta(i), one PZC is reported (Figure 9b). This diversity is perhaps due to the attendance of various frameworks of alumina silica and/or the presence of PdIr in this catalyst. The diversity among the potential surface charges shows that the sorption of Pd and Ir solution types are monotonous. For other catalysts, one peak is detectable as is demonstrated in Figure 9b. As mentioned in other researches, by increasing the electrostatic attraction in the metal complex with a permeating precursor, mono sized and smaller metal particles appear in the catalyst [75]. Furthermore, Pd complex which is adsorbed in the precursor has a more monotonous size distribution on the surface of 0.08%Pd 0.29%Ir/H-Beta(i) microporous compared to 0.08%Pd 2.9%Ce/H-Beta(i), and 0.08%Pd 1.9%Ag/H-Beta(i) catalysts. The ξ distribution of surfaces change by changing the support, metal active phase, and promoter. The amount of metalliferous solution that can be adsorbed by the catalysts depends on the value of the surface charge of the catalyst [76]. So, various amounts of Pd adsorption complex lead to the formation of various Pd active sites on the synthesized catalysts.

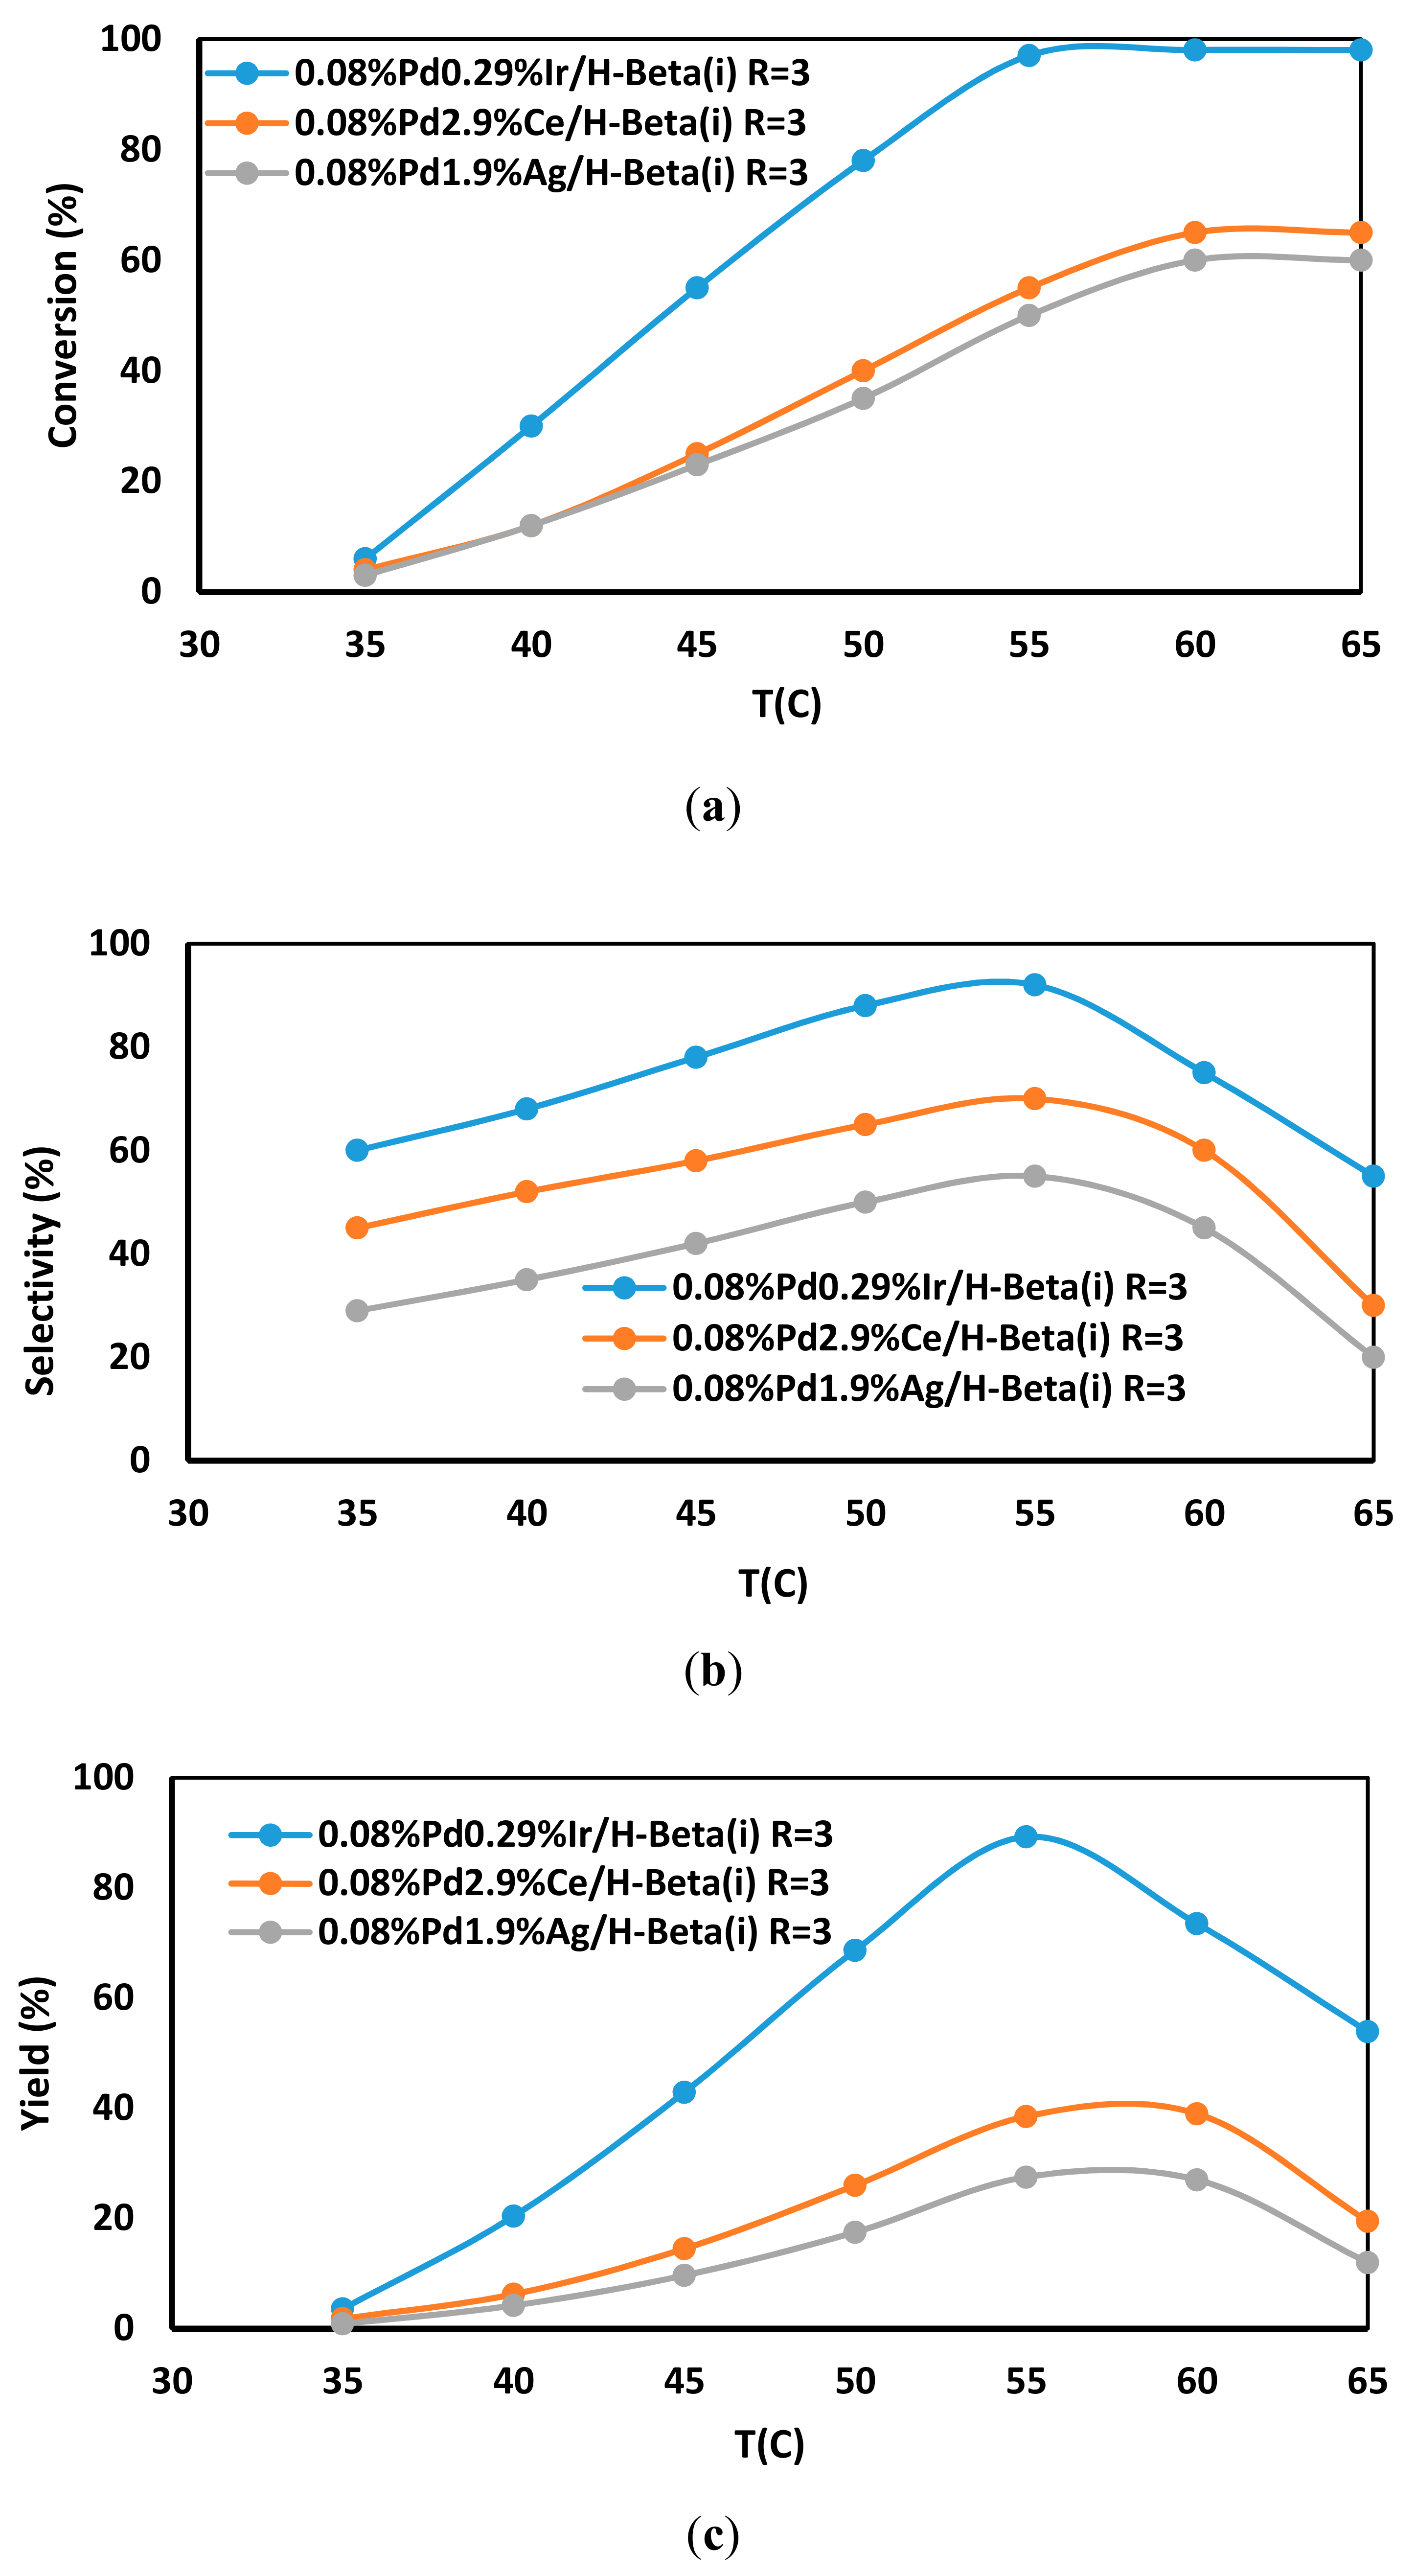
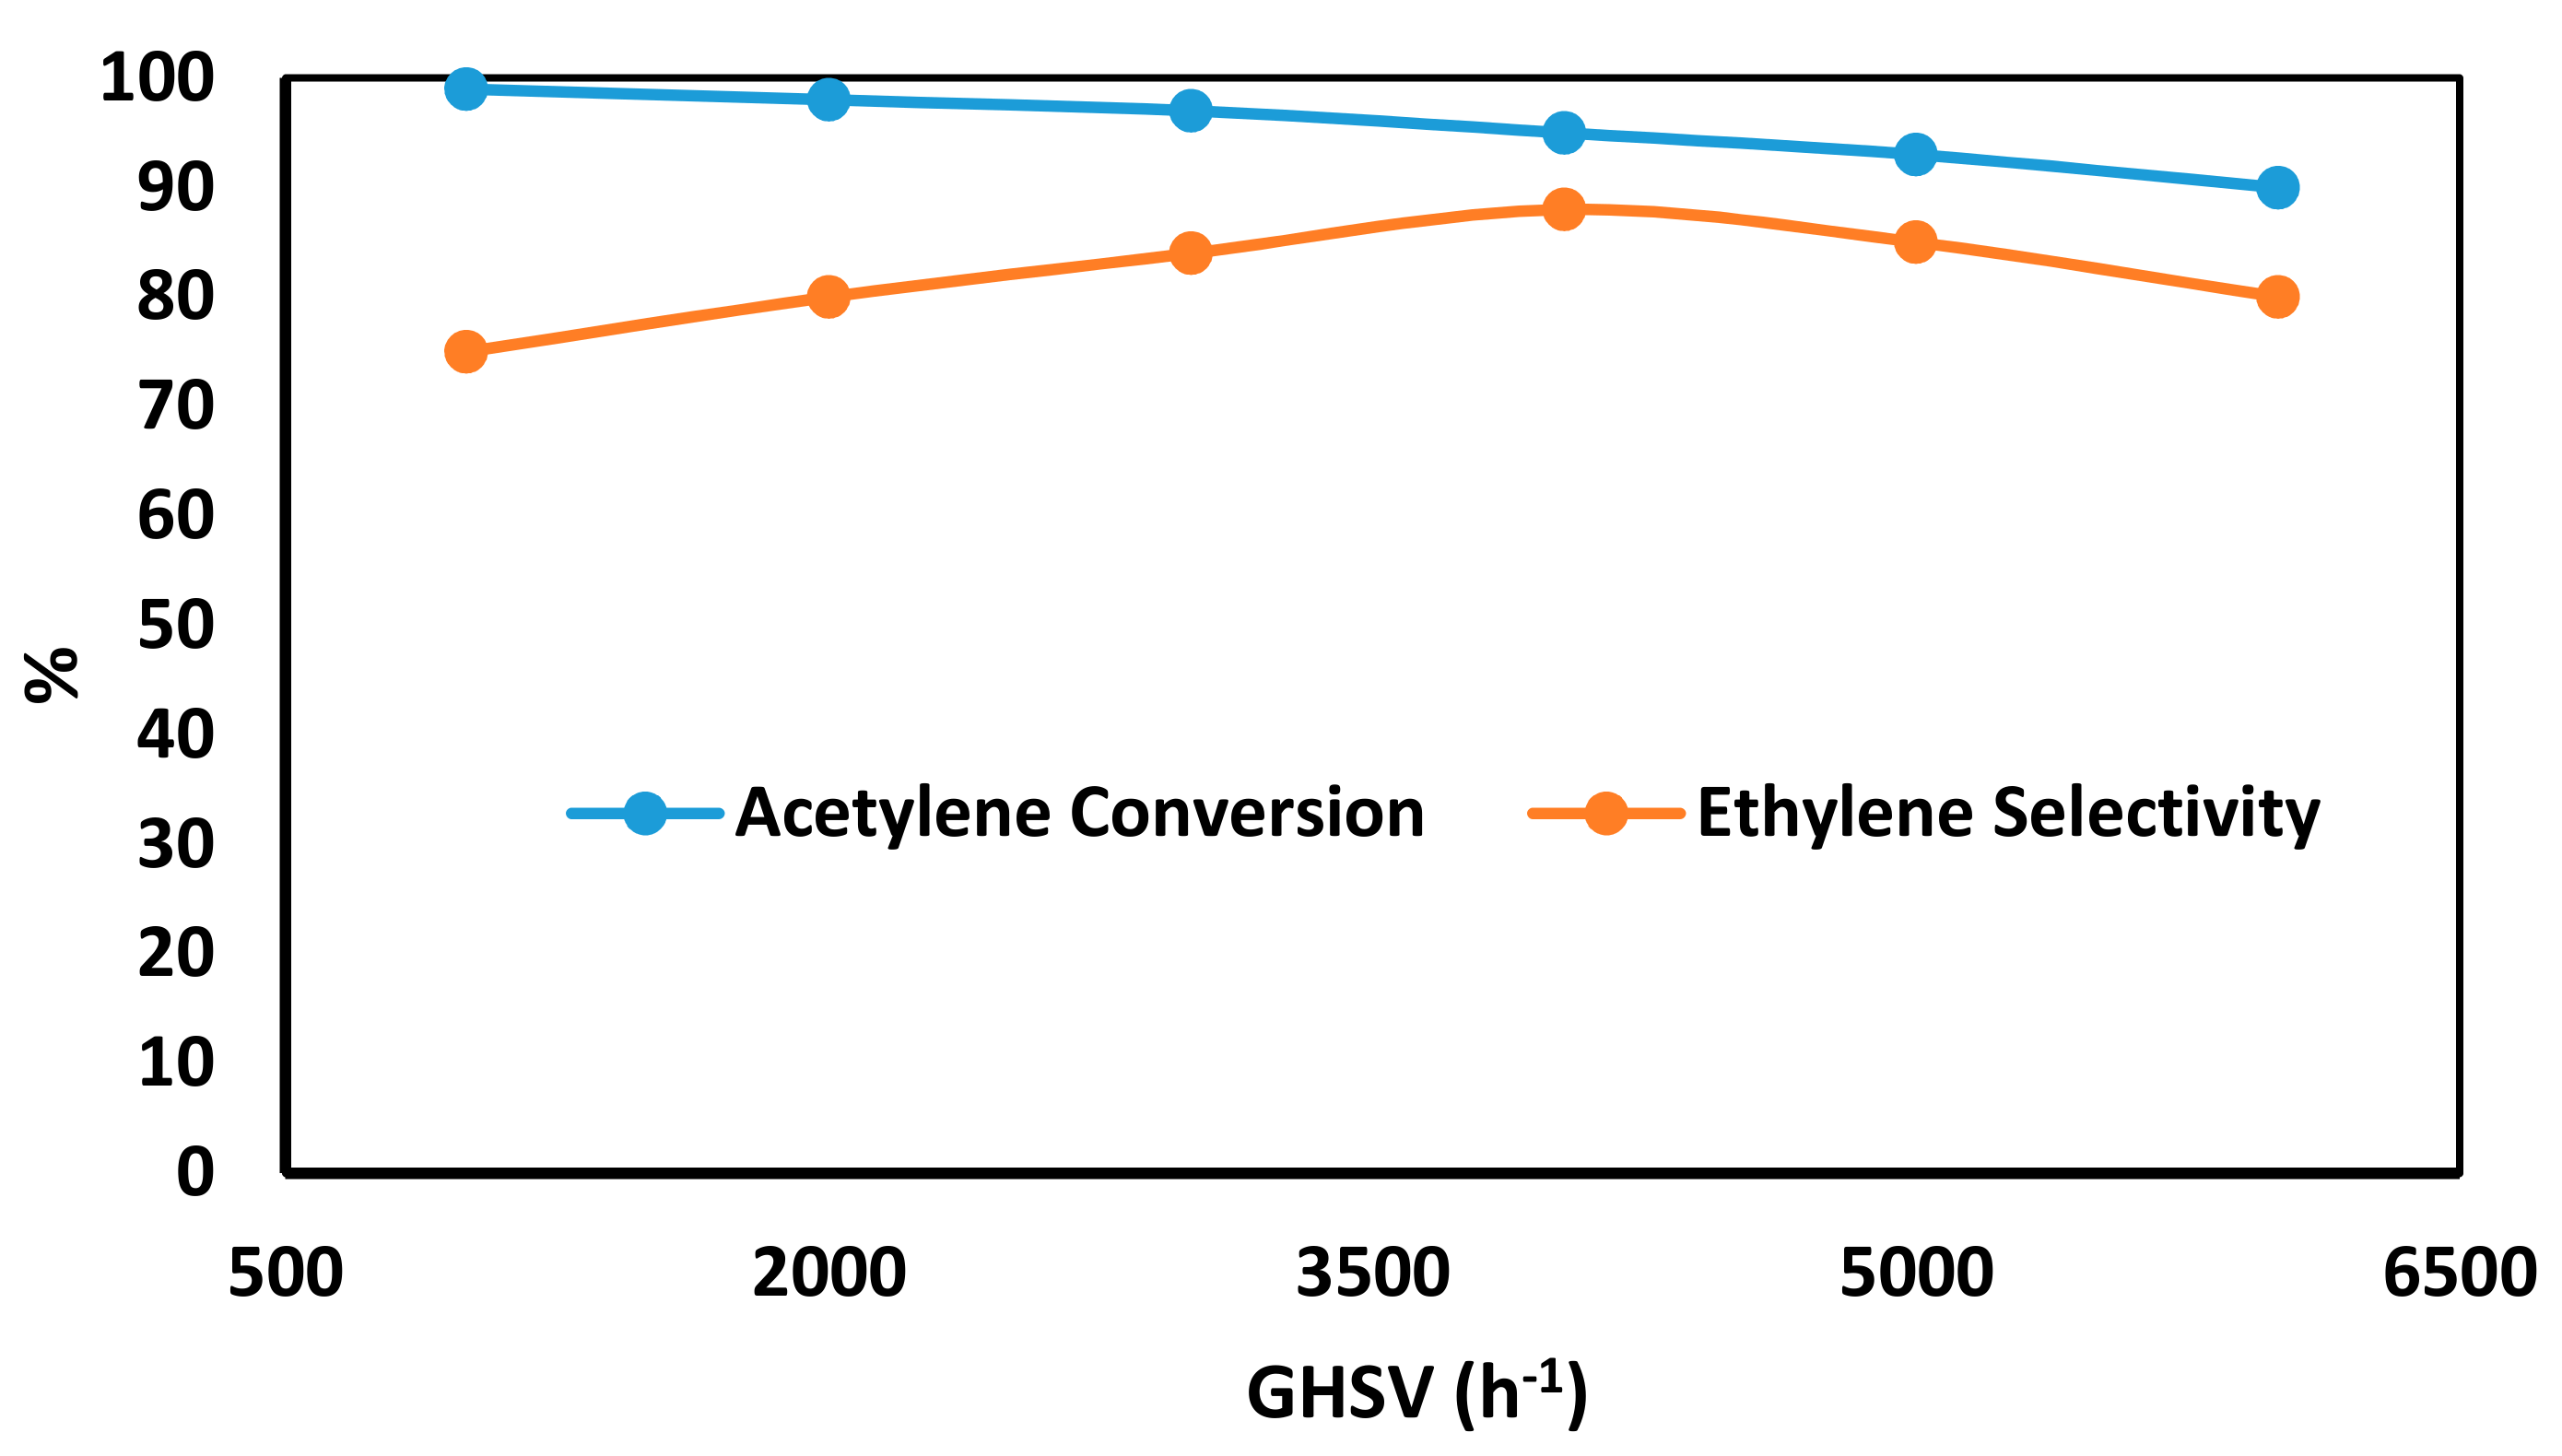
2.8. Catalytic Performance in the Selective Hydrogenation of Acetylene
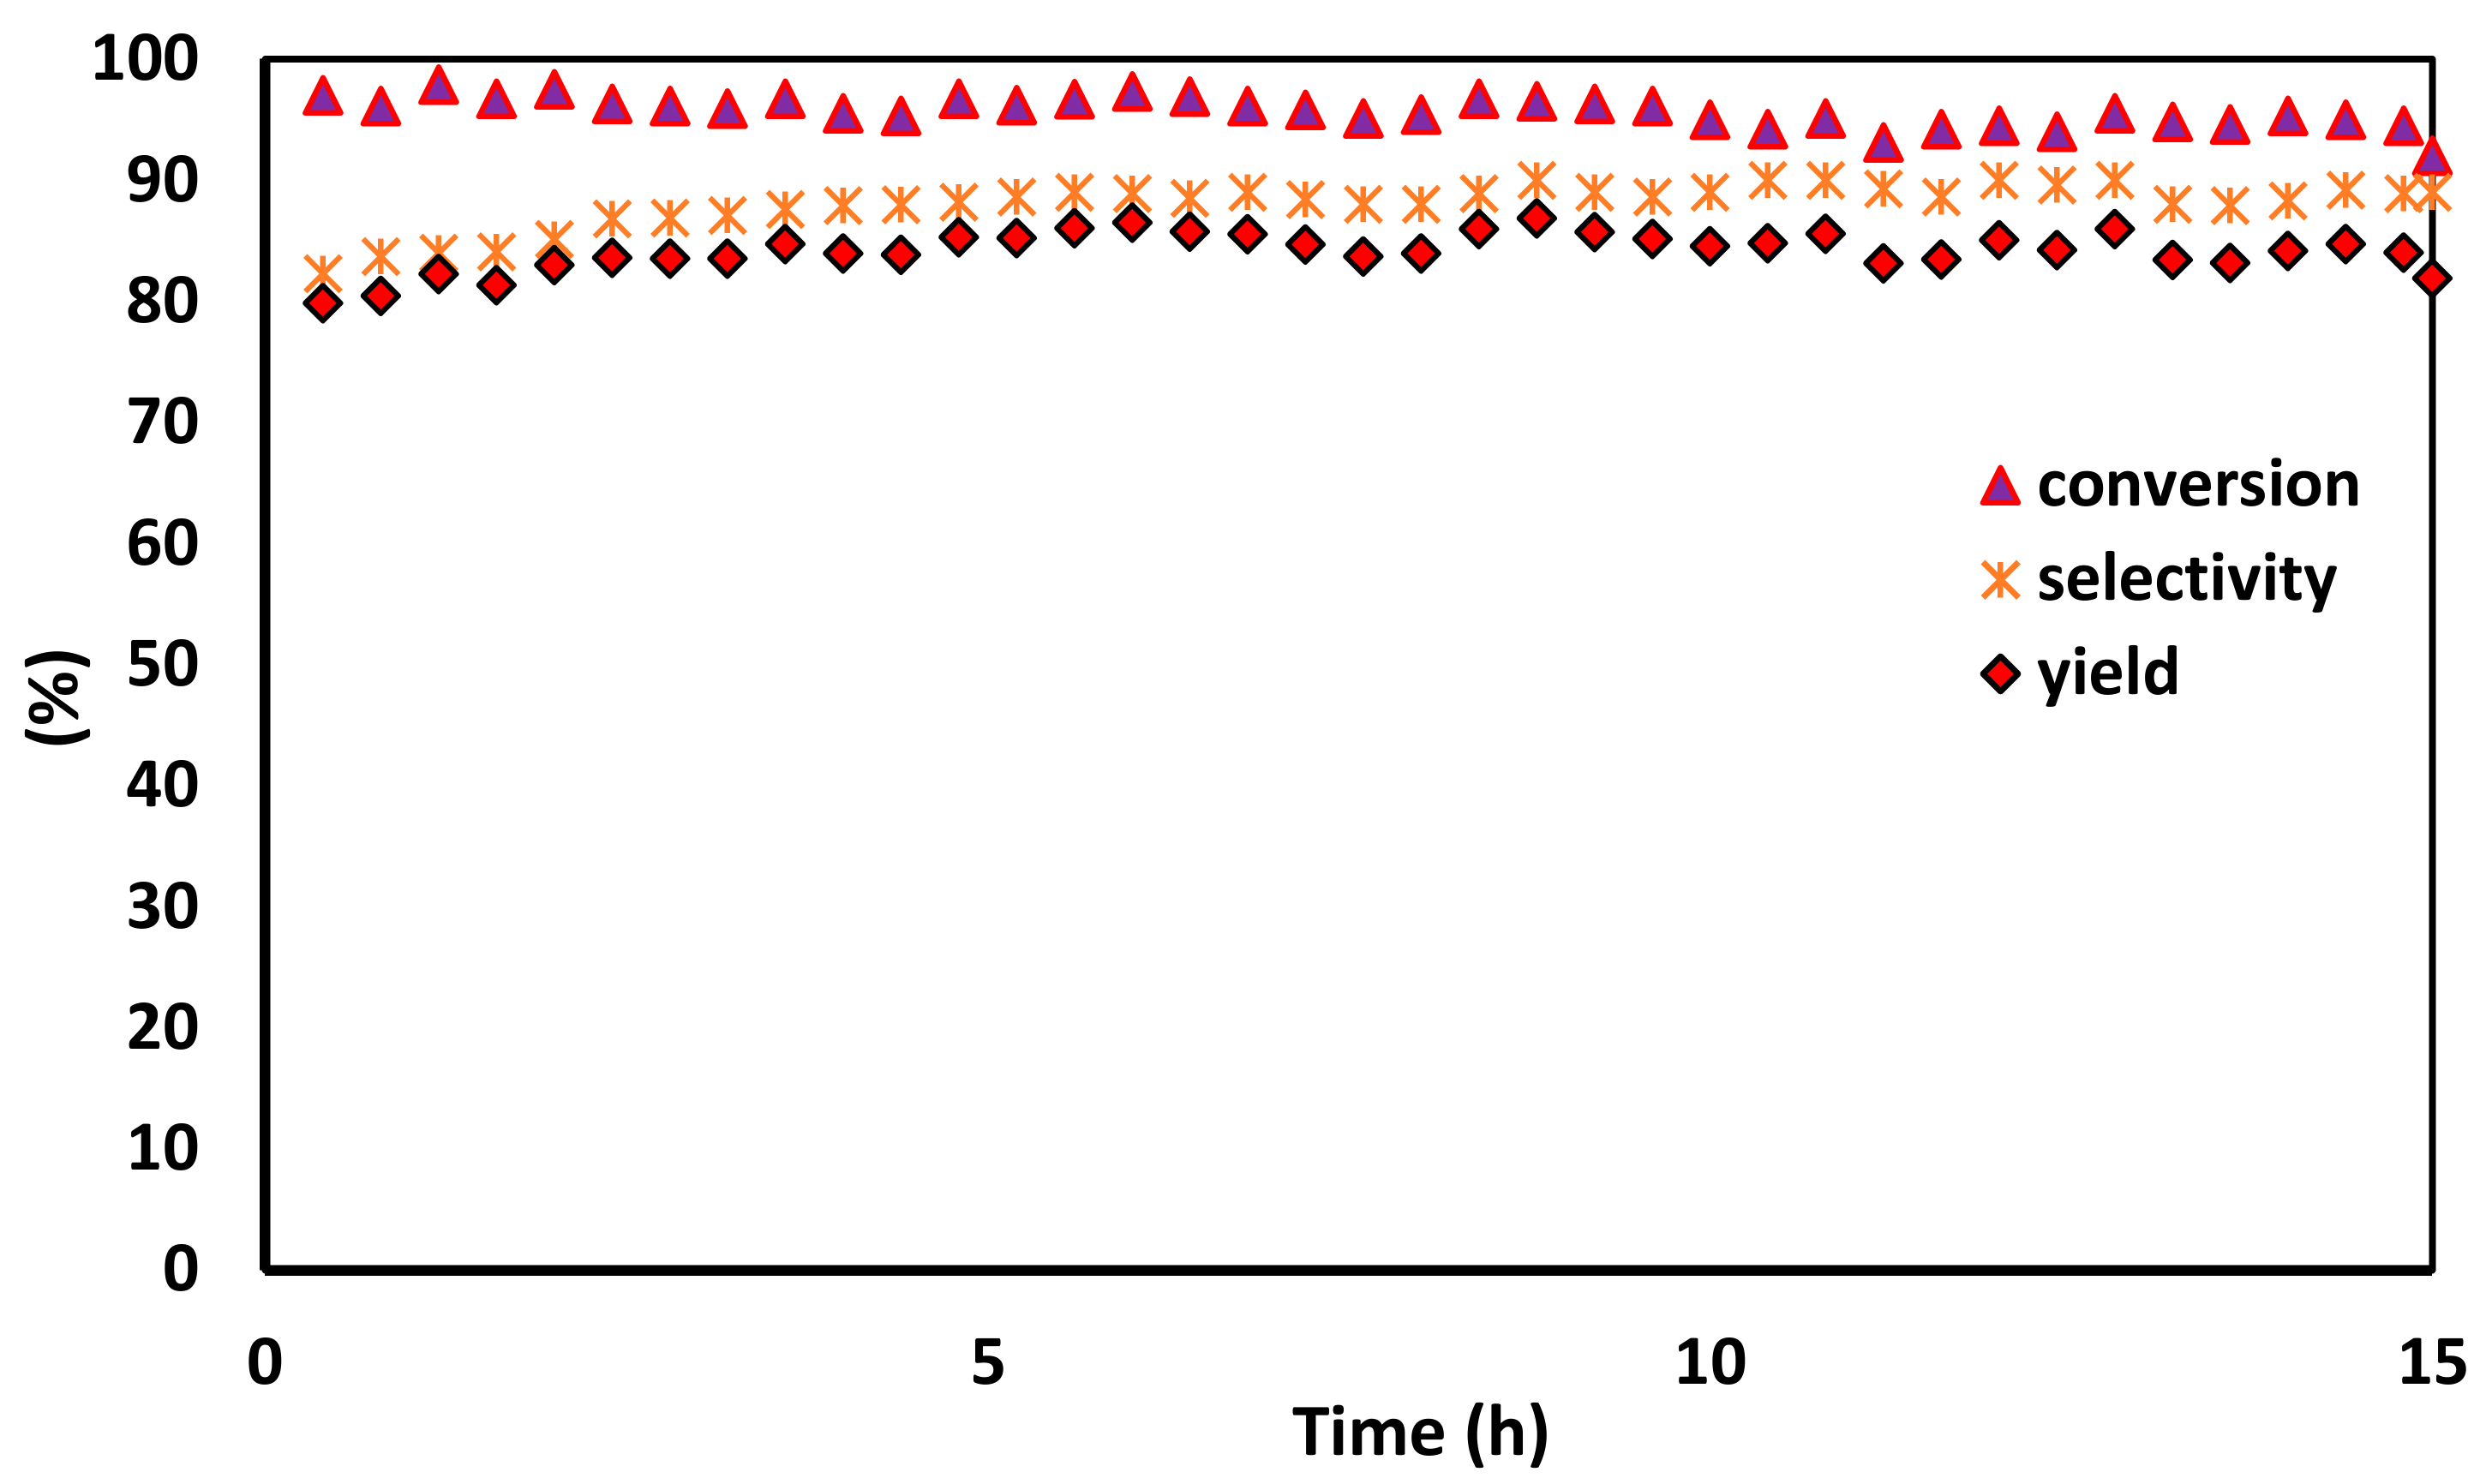
The process mechanism proposes that rapid discharging of the process outlets from the reactor bed results in higher production of products such as ethylene. Rapid discharge of the products could be attained by exerting microporous materials via narrow particle sizes and introducing good mass transfer. Narrow sizes of particles with a superior specific area decrease the diffusion path lengths and increase the surface active sites, which displayed great catalytic efficiency [77]. In an acetylene hydrogenation process, the conversion of catalysts is not the unique imperative factor. In a chain process of the kind, acetylene → ethylene → ethane, the ethylene selectivity is also important [78]. Acetylene conversion, yield and selectivity in the hydrogenation of acetylene are measured at 1000–6000 h−1 GHSV and 35–65 °C temperature over the total catalysts (0.08%Pd 0.29%Ir/H-Beta(i), 0.08%Pd2.9%Ce/H-Beta(i), 0.08%Pd1.9%Ag/H-Beta(i), 0.08%Pd0.29%Ir/H-Beta(ii), 0.08%Pd2.9%Ce/H-Beta(ii), 0.08%Pd1.9%Ag/H-Beta(ii), 0.08%Pd0.29%Ir/H-Beta(iii), 0.08%Pd2.9%Ce/H-Beta(iii), 0.08%Pd1.9%Ag/H-Beta(iii), 0.08%Pd0.29%Ir/H-Beta(iv), 0.08%Pd2.9%Ce/H-Beta(iv), 0.08%Pd1.9%Ag/H-Beta(iv)) with various R, including 1/1, 3/1 and 5/1 (R = 1, 3 and 5), after reduction at 150 °C. The results of the acetylene hydrogenation process show that 0.08%Pd0.29%Ir/H-Beta(i) catalyst at R = 3, p = 20 bar and GHSV = 4030 h−1, has the best performance, as displayed in Figure 10 and Figures S7–S21. According to Figures S7–S21, it can be concluded that 0.08%Pd0.29%Ir/H-Beta(i) catalyst has the best performance of the catalysts and is explained below.
Figure 10 and Figures S7–S21 show the acetylene conversion, ethylene selectivity, and yield with different R. At first, the conversion of acetylene increases with an increase in the process temperature and the selectivity of ethylene and then decreases. The 0.08%Pd 0.29%Ir/H-Beta(i) catalyst has the highest conversion because it has the biggest valency for dissociation and/or activation of hydrogen. In detail, at R of 1, the acetylene activity (conversion) of 0.08%Pd 0.29%Ir/H-Beta(i) catalyst at 35 °C is 5%, and reaches 55% when the reaction temperature increases to 65 °C (Figure S7). The 0.08%Pd 2.9%Ce/H-Beta(i) catalyst has only 3% conversion at 35 °C but when the temperature reaches 65 °C, it has the same conversion as 0.08%Pd0.29%Ir/H-Beta(i) (about 40%) (Figure S8). For 0.08%Pd1.9%Ag/H-Beta(i) catalyst, the highest conversion of acetylene is about 36% at 65 °C, which is the lowest at the same temperature (Figure S9). Also, according to Figures S13–S21 for other catalysts at different R, conversion is as below: at R of 1, the acetylene activity (conversion) of 0.08%Pd0.29%Ir/H-Beta(ii), 0.08%Pd0.29%Ir/H-Beta(iii), 0.08%Pd0.29%Ir/H-Beta(iv) catalysts at 35 °C are 4%, 1.23%, 1%, and reaches to 49%, 40%, 33%, respectively, when the reaction temperature increases to 65 °C (Figures S13a, S16a, S19a). The 0.08%Pd2.9%Ce/H-Beta(ii), 0.08%Pd2.9%Ce/H-Beta(iii), 0.08%Pd2.9%Ce/H-Beta(iv) catalysts have only 1.8%, 2.3%, 1% conversion, respectively, at 35 °C but when the temperature reaches 65 °C, they have the same conversion as 0.08%Pd0.29%Ir/H-Beta(i) (about 40%) (Figures S14a, S17a, S20a). For 0.08%Pd1.9%Ag/H-Beta(ii), 0.08%Pd1.9%Ag/H-Beta(iii), 0.08%Pd1.9%Ag/H-Beta(iv) catalysts, the highest conversion of acetylene is about 45%, 49%, 41%, respectively, at 65 °C, which is the lowest at the same temperature (Figures S15a, S18a, S21a). With the increase of R to 3, the conversion increases quickly and reaches about 99% at 65 °C. Similarly, with R of 5, the conversion of acetylene over 0.08%Pd0.29%Ir/H-Beta(i) increases even faster and reaches nearly 100% at 55 °C. The difference in the activity of the catalysts that have been tested in the hydrogenation of the acetylene process is related to the shape and particle size distribution of active component, specific surface area, and the interplay of Pd and other metals with supports in the catalysts, which will be discussed in the characterization section. The catalysts 0.08%Pd2.9%Ce/H-Beta(i) and 0.08%Pd1.9%Ag/H-Beta(i), 0.08%Pd0.29%Ir/H-Beta(ii), 0.08%Pd2.9%Ce/H-Beta(ii), 0.08%Pd1.9%Ag/H-Beta(ii), 0.08%Pd0.29%Ir/H-Beta(iii), 0.08%Pd2.9%Ce/H-Beta (iii), 0.08%Pd1.9%Ag/H-Beta(iii), 0.08%Pd0.29%Ir/H-Beta(iv), 0.08%Pd2.9%Ce/H-Beta(iv), 0.08%Pd1.9%Ag/H-Beta(iv) have the lowest conversion, selectivity and yield owing to the lake of special acidity, and mono and narrow sized crystals during synthesis. As displayed in Figure 10 and Figures S7–S21, the selectivity toward ethylene over the different catalysts decreased in the order of 0.08%Pd 0.29%Ir/H-Beta(i) > 0.08%Pd2.9%Ce/H-Beta(i) > 0.08%Pd1.9%Ag/H-Beta(i), 0.08%Pd0.29%Ir/H-Beta(ii) > 0.08%Pd2.9%Ce/H-Beta(ii) > 0.08%Pd1.9%Ag/H-Beta(ii), 0.08%Pd0.29%Ir/H-Beta(iii) > 0.08%Pd2.9%Ce/H-Beta(iii) > 0.08%Pd1.9%Ag/H-Beta(iii), 0.08%Pd0.29%Ir/H-Beta(iv) > 0.08%Pd2.9%Ce/H-Beta(iv) > 0.08%Pd1.9%Ag/H-Beta(iv). As expected, by increasing the temperature of the bed reactor to 65 °C to the maximum acetylene conversions, optimum yield and high selectivity are achieved at the same GHSV. The 0.08%Pd0.29%Ir/H-Beta(i) catalyst at first displays perfect conversions of acetylene with excellent selectivity to ethylene at 55 °C. It should be noted that, since ethylene is produced as an in-between substance in the selective acetylene hydrogenation process, when the conversion of acetylene is near to 100%, the ethylene selectivity decreases significantly [79]. When the temperature of reaction changes from 35 to 65 °C, the selectivity over 0.08%Pd 0.29%Ir/H-Beta(i) catalyst increases and then decreases steadily, from almost 100% (at R = 1) to about −1% (at R = 5). Nevertheless, the selectivity over the other catalyst decreases sharply when the temperature reaches 45 °C and then it faces a reduction to about −40% at 65 °C (in Figures S7–S21). The preferable ethylene selectivity of 0.08%Pd 0.29%Ir/H-Beta(i) catalyst could be owing to the strong synergistic trace of bimetallic PdIr with supports including electronic and geometric effects. As for 0.08%Pd 2.9%Ce/H-Beta(i) catalyst, with an increase in the temperature, the ethylene selectivity decreases rapidly from 90% (at R = 1) to only −10% (at R = 5). As 0.08%Pd2.9%Ce/H-Beta(i) catalyst characterization confirms, poor ethylene selectivity of the 0.08%Pd2.9%Ce/H-Beta(i) catalyst is due to the different nature of the Ce compared to Ir metal on the Beta-based catalyst. Due to the nature of supports, the shape and particle size distribution of active phases and promoters also have a decisive role in the conversion and selectivity. Commonly, an increase in the particle size distribution leads to a reduction of ethylene selectivity and the support effect overwhelms the effect of particle size distribution [54]. Furthermore, because the ethylene selectivity decreases sharply when the conversion of acetylene approached 100%, it is necessary to survey the selectivity of ethylene at a fixed acetylene conversion over different catalysts. The selective acetylene conversion over 0.08%Pd2.9%Ce/H-Beta(i) and 0.08%Pd1.9%Ag/H-Beta(i) are significantly lower than that over 0.08%Pd0.29%Ir/H-Beta(i) catalysts, which is due to the agglomeration of metal nanoparticles during the synthesis. The observed increase in the selectivity of ethylene over 0.08%Pd1.9%Ag/H-Beta(i) catalyst after exchanging Ag with Ce metal indicates that 0.08%Pd2.9%Ce/H-Beta(i) is better than 0.08%Pd1.9%Ag/H-Beta(i) and 0.08%Pd0.29%Ir/H-Beta(i) is the best catalysts for this purpose. Figures S7–S12 show that the selectivities of 0.08%Pd0.29%Ir/H-Beta(i), 0.08%Pd2.9%Ce/H-Beta(i), and 0.08%Pd1.9%Ag/H-Beta(i) catalysts are 88%, 70%, and 55%, respectively, at R = 3 and reaction temperature of 55 °C, indicating that the bimetallic PdIr catalyst has a better ethylene selectivity than PdCe and PdAg bimetallic catalysts. As shown in Figures S7–S12, the yield percentage of ethylene in acetylene hydrogenation increases gradually with temperature and maximizes at ~55% at 65 °C when the R ratio is 1 and increases rapidly with temperature, reaching to ~84% at 60 °C when R is 3. Nevertheless, with R of 5, the yield percentage drops to negative values at a temperature increase to 55 °C, which is not favorable even though the activity of acetylene is very desirable. The results suggest that the performance of 0.08%Pd0.29%Ir/H-Beta(i) for acetylene hydrogenation is the best with R ratio of 3. It is challenging to obtain high yield of acetylene hydrogenation in large excess of ethylene with industrial Pd catalysts. As for the supported Pd catalysts, promoters are necessary to improve the ethylene selectivity [80]. The addition of Ce, Ag or Ir to Pd modifies the geometrical and electronic properties and enhances the ethylene selectivity. It also should be mentioned that the obtained catalyst with Pd nanoparticles have higher selectivity than catalysts reported in the literature (PdTi/SiO2 (37.5%), Pd/ZnAl2O3 (64%), and Pd/SiO2 (20%) catalysts synthesized by solvothermal methods at a similar conversion 100, 102). Nevertheless, the selectivity is improved by modifying the conversion species, and the maximum ethylene selectivity (≥88%) at 95% acetylene conversion was obtained by this procedure. The deactivation behavior of the catalysts varies extremely with the crystallite size distribution and support structure. Crystals with a narrow size distribution and moderate micropores retained their conversion longer. Finally, it can be concluded from the FTIR analysis and cata-test that 0.08%Pd0.29%Ir/H-Beta(i) heterogeneous catalyst provided high catalytic activity with low loading level (0.08 wt%), because the Lewis acid catalyst was grafted on the surface of the nanocomposites [81].
There also is a reduction in the undesired oligomerization of alkenes which is followed by the sedimentation of carbonaceous substance. Therefore, the 0.08%Pd0.29%Ir/H-Beta(i) catalyst has the highest selectivity, yield, activity, and stability in the hydrogenation of acetylene process. This conclusion is also confirmed in the literature which summarized that moderate crystallites showed the best catalytic performance. An optimized R is obtained over mesoporous 0.08%Pd0.29%Ir/H-Beta(i) catalysts, which was ascribed to the optimum Si/(Al + SDA) ratios and low diffusion obstacle that facilitate the transport of ethylene products out of the catalyst before they are finally converted to other products [82,83]. Figure 11 shows that with increasing GHSV from 1000 to 6000 h−1 at T = 55 °C and p = 20 bar over 0.08%Pd0.29%Ir/H-Beta(i) catalyst, acetylene conversion decreases from about 95% to 90% and at GHSV = 4030 h−1 the ethylene selectivity reaches the maximum (about 88%).
At lower GHSV, where acetylene remains on the catalyst bed for a longer time, hydrogenation of acetylene process occurred, and the selectivity of the products such as ethylene increase. With an increase in GHSV, ethylene forms mainly through hydrogenation of the acetylene process at maximum selectivity. With a further increase in GHSV, acetylene remains on the catalyst bed for a shorter time. Therefore, a reduction appears in the conversion.

2.9. Stability

Stability is another significant parameter in catalyst evaluation. Time-on-stream analysis of the 0.08%Pd0.29%Ir/H-Beta(i) catalysts (reduced at 150 °C) in selective hydrogenation of acetylene was performed at 55 °C and 20 bar for up to 15 h, as shown in Figure 12.
The activity of 0.08%Pt0.29%Ir/H-Beta(i) catalyst maintains the highest level during the initial 13 h and after 15 h, slowly decreases to 92%. This stable conversion of 0.08%Pd0.29%Ir/H-Beta(i) catalyst could be attributed to low carbon deposition and preferable structure stability.

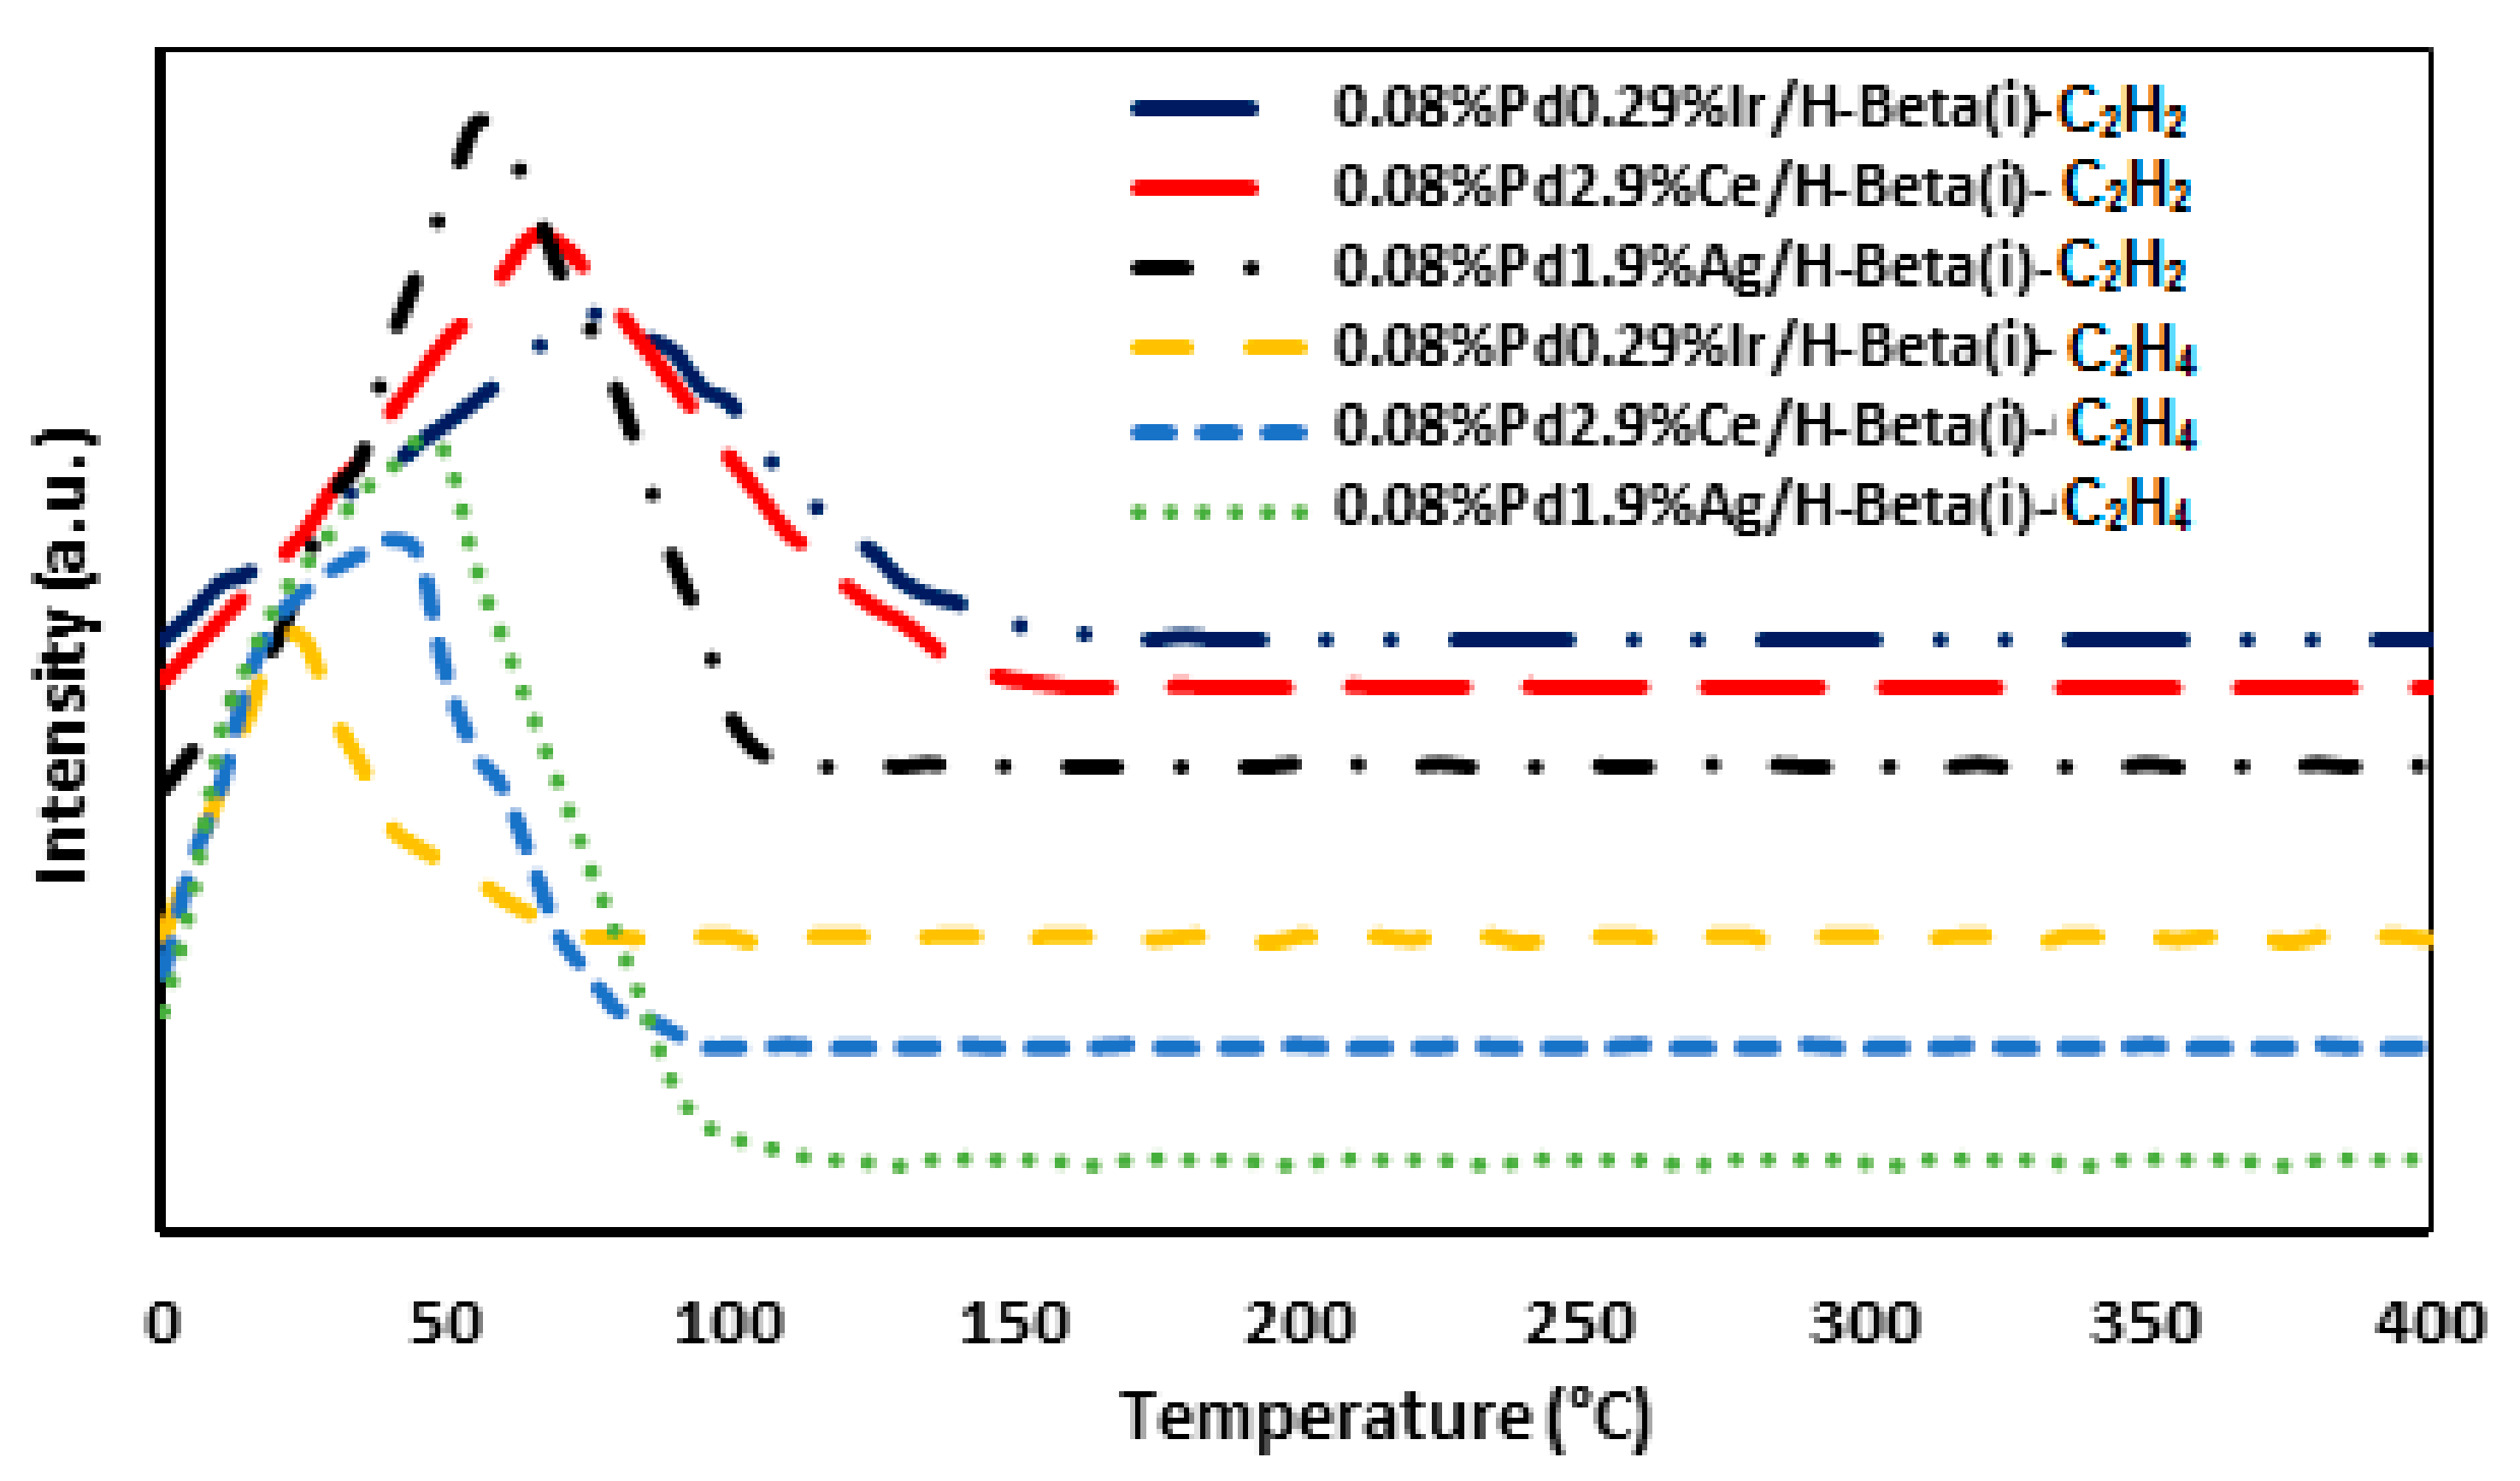
2.10. TPD–C2H2 and TPD–C2H4
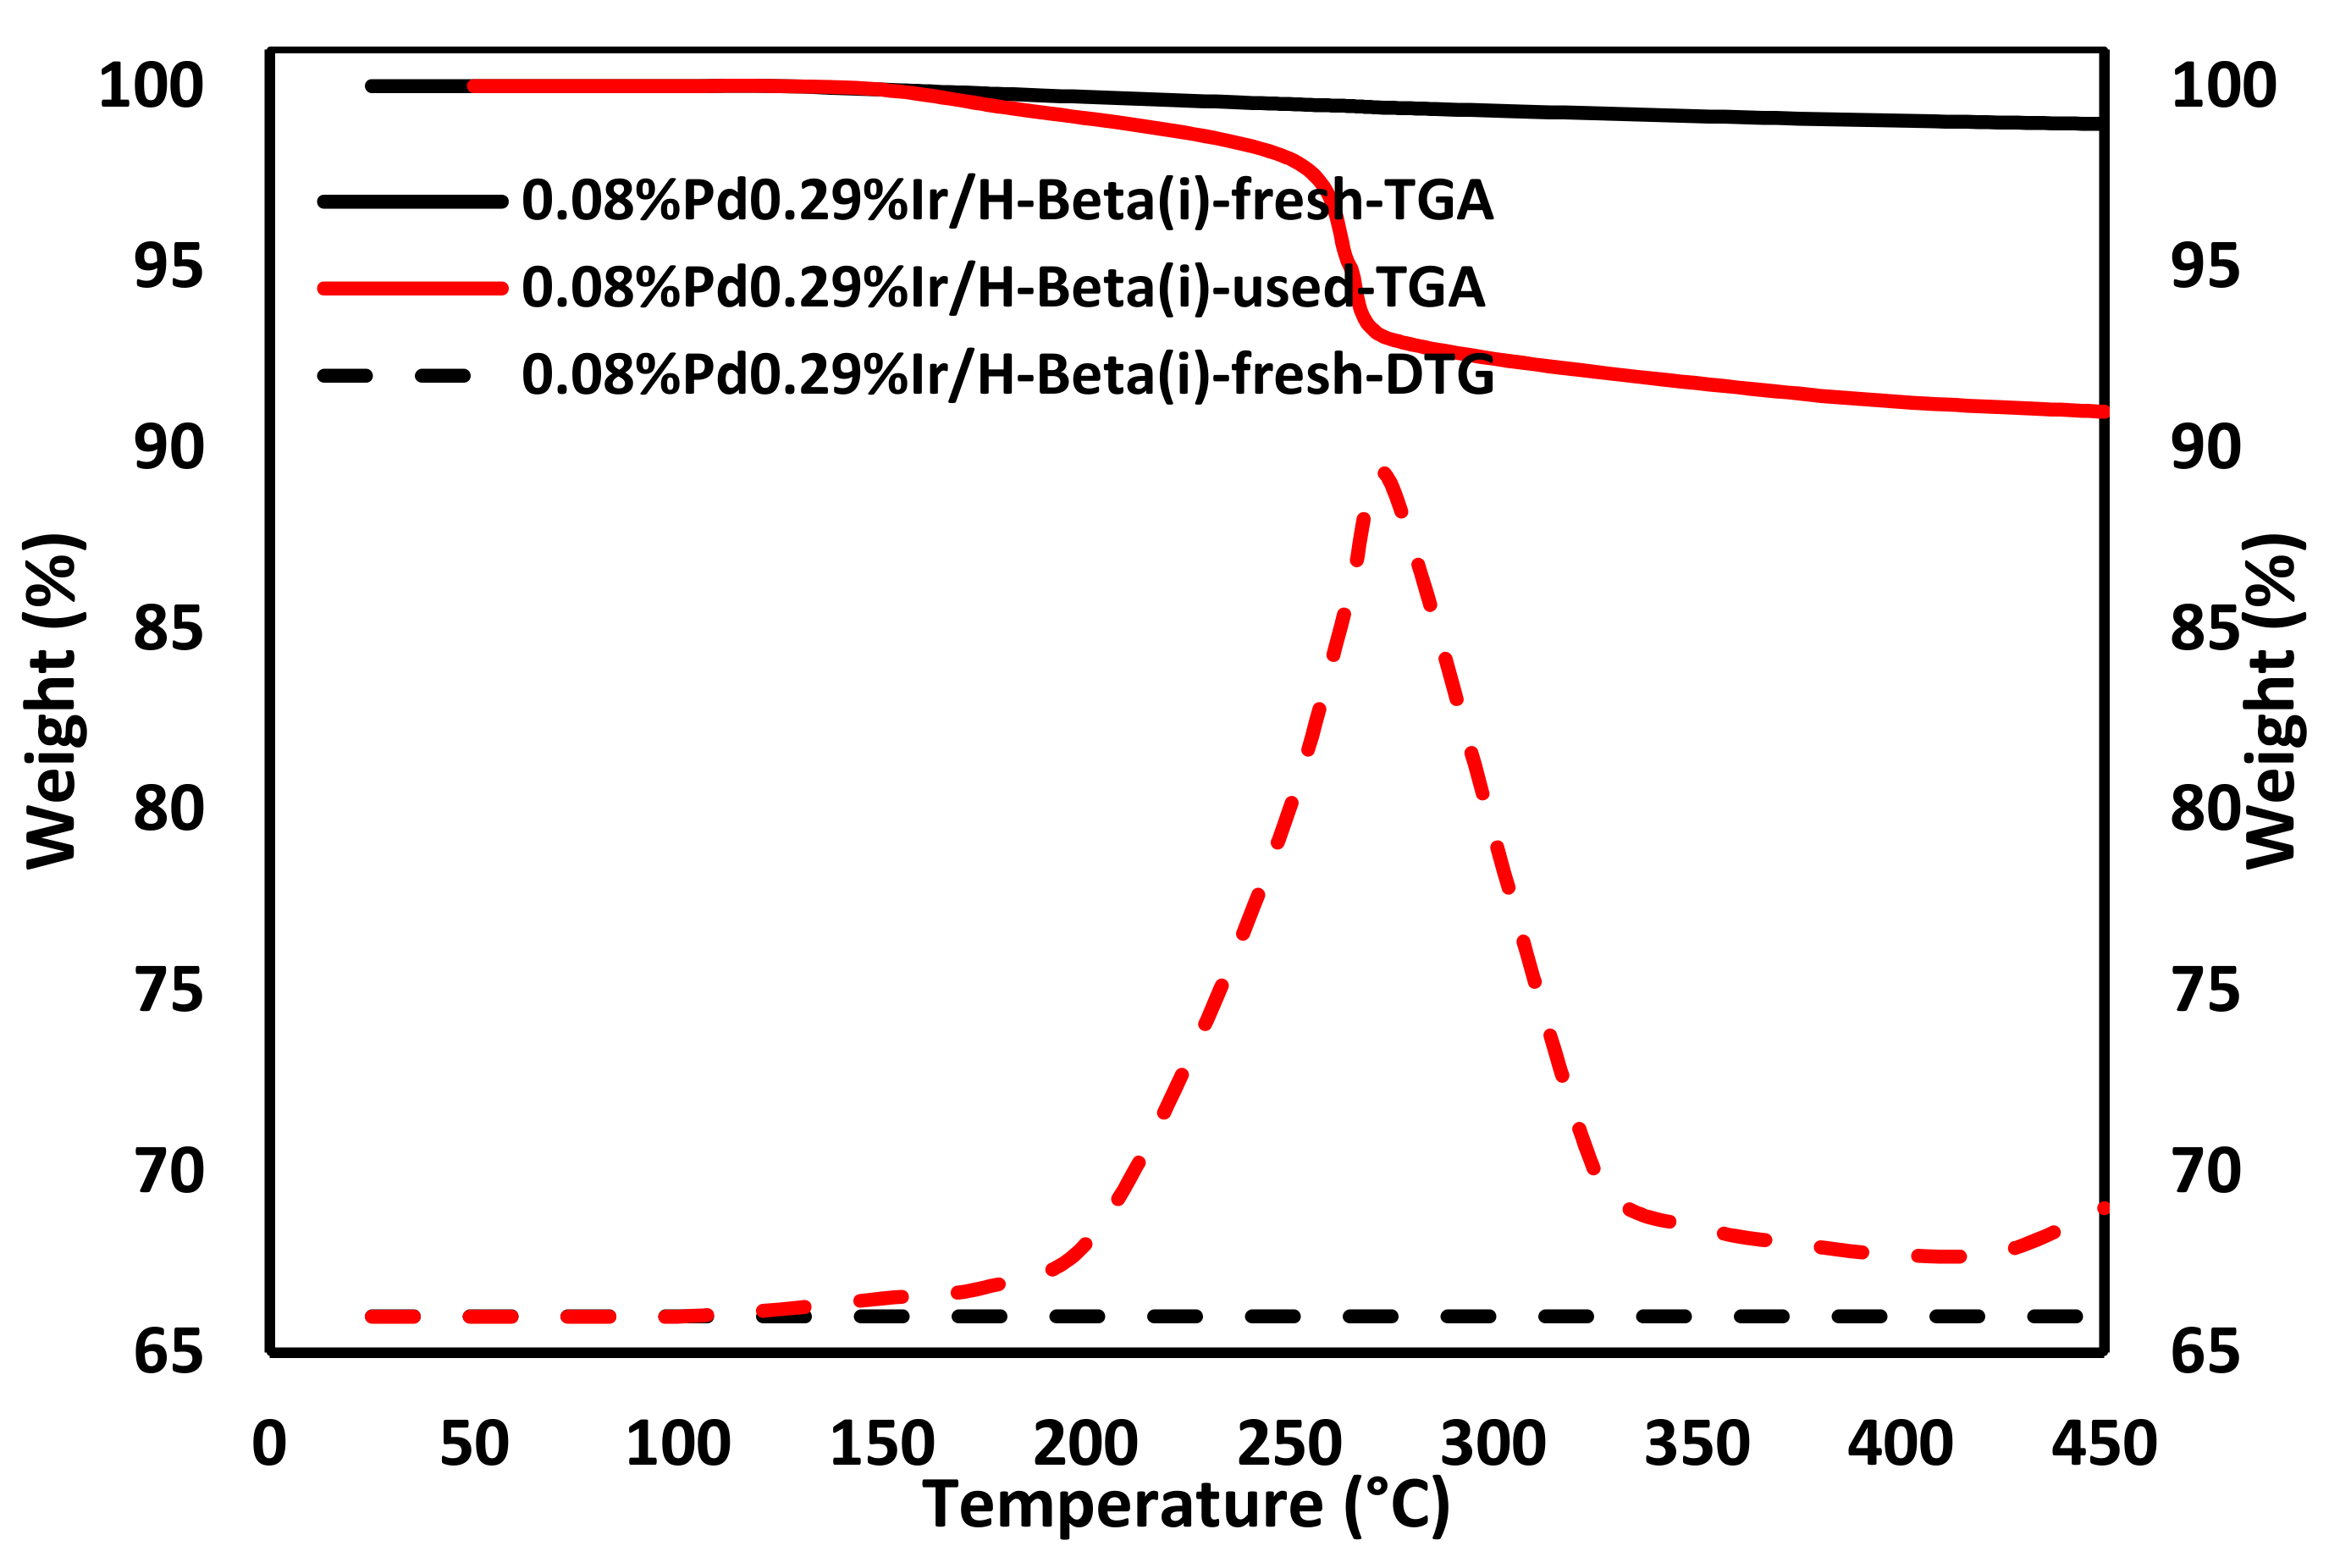
Figure 13 shows that in the 0.08%Pd0.29%Ir/H-Beta(i) catalyst, an increase in the temperature of acetylene desorption leads to an increase in the acetylene activity and a reduction in the temperature of ethylene desorption brings a rise in ethylene selectivity.
Note that in this process, large amounts of ethylene compete with acetylene. Also, the comparative adsorption between C2H2 and C2H4 is evaluated by the change in Temperature programmed desorption (TPD) temperature that meaningfully modified the C2H2 conversion. Furthermore, according to TPD characterization at low temperatures, 0.08%Pd0.29%Ir/H-Beta(i) catalyst has a better conversion than 0.08%Pd2.9%Ce/H-Beta(i) and 0.08%Pd1.9%Ag/H-Beta(i) catalysts, as is depicted in Figure 10a.

2.11. Coke Analysis

To investigate fresh and used (after 15 h stability reaction) catalysts, the carbonaceous pattern was analyzed with Thermal Gravity Analysis-derivative thermogravimetry (TGA-DTG) characterization, which is shown in Figure 14.
According to this Figure, the mass loss of 0.08%Pd0.29%Ir/H-Beta(i)-fresh catalyst is negligible (≤1.05%) until about 400 °C. In addition, quantities of carbonaceous types for 0.08%Pd0.29%Ir/H-Beta(i)-used catalyst are very considerable compared to that for the fresh catalyst (the amount of weight loss for the used catalyst is about 8.5% after the catalyst is reduced at 150 °C). DTG patterns show that carbonaceous types on the used-catalyst are reduced at 150 °C and may be omitted at lower temperature near 275 °C. The results of characterization, specially TGA-DTG, show that after reduction of 0.08%Pd0.29%Ir/H-Beta(i) catalyst at 150 °C, there is a minor amount of carbon deposit. Consequently, 0.08%Pd0.29%Ir/H-Beta(i) catalyst, that is reduced at 150 °C, not only is selective and active, but is also stable for acetylene hydrogenation.

3. Experimental Methods

3.1. Materials

Tetraethylorthosilicate (TEOS, 98%) (Sigma-Aldrich Shanghai Trading Co. Ltd., Shanghai, China), sodium aluminate (NaAlO2, technical) (Sigma-Aldrich Shanghai Trading Co. Ltd., Shanghai, China), sodium hydroxide (NaOH, BioXtra, ≥98% (acidimetric), pellets (anhydrous)) (Sigma-Aldrich Shanghai Trading Co. Ltd., Shanghai, China), TPAOH solution (1.0 M in H2O) (Sigma-Aldrich Shanghai Trading Co. Ltd., Shanghai, China), TPABr (98%) (Sigma-Aldrich Shanghai Trading Co. Ltd., Shanghai, China), tetrahydro-1,4-oxazine (morpholine, ReagentPlus®, ≥99%) Sigma-Aldrich Shanghai Trading Co. Ltd., Shanghai, China), butan-1-amine (n-butylamine, 99.5%) (Sigma-Aldrich Shanghai Trading Co. Ltd., Shanghai, China), toluene (anhydrous, 99.8%) (Sigma-Aldrich Shanghai Trading Co. Ltd., Shanghai, China), ammonium nitrate (NH4NO3, ACS reagent, ≥98%) (Sigma-Aldrich Shanghai Trading Co. Ltd., Shanghai, China), palladium chloride (PdCl2, ReagentPlus®, 99%) (Sigma-Aldrich Shanghai Trading Co. Ltd., Shanghai, China), silver nitrate (AgNO3, ACS reagent, ≥99.0%), iridium(III) chloride hydrate (IrCl3·H2O, 99.9% trace metals basis) (Sigma-Aldrich Shanghai Trading Co. Ltd., Shanghai, China), nitric acid cerium(III) salt (Ce(NO3)3·6H2O, >99% trace metals basis) (Sigma-Aldrich Shanghai Trading Co. Ltd., Shanghai, China), and deionized water (DW) were of analytical ranking grade and without additional purification.

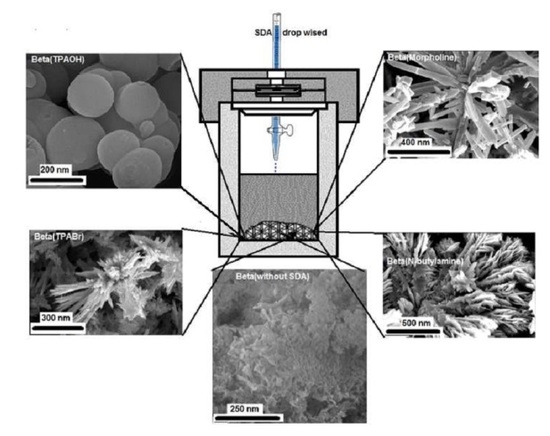
3.2. Synthesis of H-Beta-Based Catalyst

The Beta-zeolite micro/mesoporous solution was synthesized with a molar ratio of a SiO2:b Al2O3:c Na2O:d SDA:e solvent and a, b, c, d, and e parameters were modified during synthesis. To synthesis the support, 70 mM of NaAlO2 solution was mixed with 95 mM of NaOH solution with slow stirring, then 2 M of TEOS and specified amount of SDA (TPAOH(i) or TPABr(ii) or orpholine(iii) or n-butylamine(iv)) solution was added dropwise into the above mixture precursor with vigorous stirring. The solution was stirred with a hot plate magnetic stirrer for 20 h at 303 K, then it was heated at about 130–170 °C in a PTFE-lined autoclave for 50 h. The Beta-zeolite precursor was accumulated by vacuum filtration, dried at ambient temperature, and calcined with 3 °C/min ratio at about 550 °C for 9 h with static air to remove the templates.
H-type support of Beta-based catalyst was obtained 1–4 times ion-exchanged with a 0.5–2 M NH4NO3 aqueous solution at 110 °C for 4 h with vigorous stirring. After that, the aqueous solution was filtered with a vacuum pump and calcined with 3 °C/min ratio at about 550 °C for 9 h. The resulting supports were denoted as H-Beta(0), H-Beta(i), H-Beta(ii), H-Beta(iii), and H-Beta(iv), and H-Beta(0) was synthesized without using SDA. The amount of Si/(Al + SDA) ratio for different Beta-based catalysts is reported in Table S1 in the electronic supplementary information (ESI) file and an optimum value of Si/(Al + SDA) is reported in Table 2.

3.3. Synthesis of Different Catalysts by the Incipient Wetness Co-Impregnation Method

Using a common and facile procedure, we mixed a certain amount of 0.01 M PdCl2 and 0.2 M HCl, and then we diluted it with DW to obtain H2PdCl4. All of the samples were synthesized subsequently with the incipient wetness co-impregnation method. 0.01–0.1 wt% of Pd, 1–3 wt% of Ag, 1–3 wt% of Ce and 0.1–0.4 wt% of Ir were co-impregnated on H-Beta(i, ii, iii, iv)-based catalysts with H2PdCl4, AgNO3, Ce(NO3)3·6H2O, and IrCl3·H2O solutions, respectively. Among the four supports that were synthesized, H-Beta(i) was the best support and its characterizations and cata-tests are reported in Section 2. The samples were dried at 100 °C for 9 h and calcined with 3 °C/min ratio at 550 °C for 9 h to obtain the catalysts. The obtained catalysts are reported in Table S2 (for H-Beta(i) support) and the optimum loading of Pd, Ag, Ce, Ir metals (evaluated with ICP analysis) and textural properties of optimum catalysts (evaluated with N2-adsorption/desorption, PSD and DLS analysis) are reported in Table 3. The optimum catalysts were denoted as 0.08%Pd1.9%Ag/H-Beta(i), 0.08%Pd2.9%Ce/H-Beta(i), and 0.08%Pd0.29%Ir/H-Beta(i).

3.4. Catalysts and Supports Characterizations

The supports and catalysts were investigated with an EDX-SEM spectroscopy (Philips XL 30) (JEOL, Beijing, China), and HRTEM (JEOL JEM 2100, 200 kV) images with gold coating (JEOL Ltd., Shanghai, China).
Crystal size distribution and surface charge (zeta potential) of catalysts were measured with particle size analysis (SZ-100 nanoparticle series instruments) which was performed by DLS (HORIBA, Beijing, China).
XRD patterns were characterized on a Shimadzu XRD-6000 powder diffraction by using Ni-filtered Cu Ka radiation (λ = 0.154056 nm) at 200 mA and 40 kV in the 2θ ranges of 3–90° with a scan velocity of 4° min−1 (HORIBA, Beijing, China).
N2-adsorption/desorption analyses of supports and catalysts were conducted at 77 K after out gassing the samples at 110 °C for 12 h with a Micromeritics Tristar II 2020 analyzer. The BET procedure was used to calculate the internal and external surface areas (m2/g) of the samples using adsorption information in a relative pressure of ~0.05 to 0.2. The PSD was derived from the desorption data of N2 physisorption analysis applying the Barrett-Joyner-Halenda (BJH) procedure. The entire volumes of micro, meso, and macro-pores Vt were estimated by the Horvath and Kawazoe (HK) model (HORIBA, Beijing, China).
The UV–Vis spectrophotometer recorded at the wavelength of about 100–900 nm via a Hitachi UV–Vis (U-4100) instrument.
FTIR absorbance spectra (JEOL Ltd., Shanghai, China) were performed on a FTS-3000 spectrophotometer with wave numbers in the range of 4000 to 400 cm. Two mg of the samples which was mixed with 200 mg of dry KBr was used to prepare the transparent discs.
FTIR spectroscopy (with pyridine as a probe molecule) was used to determine the type and strength of acid sites. All samples were prepared as self-supporting wafers (ca. 8–12 mg/cm2) and activated overnight at 350 °C under vacuum prior to pyridine adsorption at 200 °C and at 3 torr. After 20 min of adsorption, the probe molecule was desorbed during 20 min and the corresponding spectrum was recorded with a resolution of 4 cm−1 by using a Nicolet spectrometer equipped with a mercury cadmium telluride (MCT) detector cooled with liquid N2. All measured spectra were normalized to 10 mg/cm2 wafers. Furthermore, different desorption temperatures (200 and 350 °C) were assayed in order to assess the strength of the acid sites, using a desorption time of 20 min at every temperature. The quantity of acid sites was determined using the following bands and absorption coefficients: pyridine PyH+ band at 1545 cm−1 (ε = 1.67 cm/μmol) and pyridine PyL bands at 1461 + 1454 cm−1 (ε = 2.2 cm/μmol) [84].
The weight loss of the fresh and used samples was determined using a TA Q500 thermogravimetric analyzer (JEOL, Beijing, China). The temperature was increased from room temperature to 450 °C at a heating rate of 20 °C min−1. DTG analysis results of the catalysts were also obtained.
TPD measurements were performed on an AutoChem II 2920 equipped with a quadrupole mass spectrometer (JEOL, Beijing, China). The samples were loaded in the U-tube reactor, followed by reduction at 250 °C for 1 h. After cooling to room temperature, the sample was subjected to acetylene or ethylene adsorption for 1 h, and then purged with He for 30 min. The temperature was increased to 400 °C with a heating rate of 10 °C min−1.
The metal content was analyzed by an ICP-OES (Optima 3000 DV, Perkin Elmer, EUA, Beijing, China). ICP/OES was carried out using a Varian Vista-MPX CCD Simultaneous ICP/OES device, the used Pd-standard was 10,000 ppm Pd in 5% HNO3. Potential Pd leaching into the reaction mixture was also analyzed by ICP/OES analysis. For this purpose, samples were taken through a syringe filter (Whatman Puradisc 4, 4 mm diameter, 0.45 lm, PTFE) during standard heterogeneous Suzuki-Miyaura reactions (reaction temperature: 115 °C), the solvent was evaporated, and the residue was dissolved n HNO3. The analysis of these samples with ICP/OES showed that the Pd concentration in the reaction solution was less than the detection limit (i.e., 50 ppb), which corresponds to less than 0.11% of the starting Pd-amount. The same result was obtained when the complete reaction mixture of a standard heterogeneous Suzuki-Miyaura reaction was filtered, the solvent was evaporated, and the residue was dissolved in HNO3. Both findings indicate that virtually no Pd leaches from the surface into the solution.

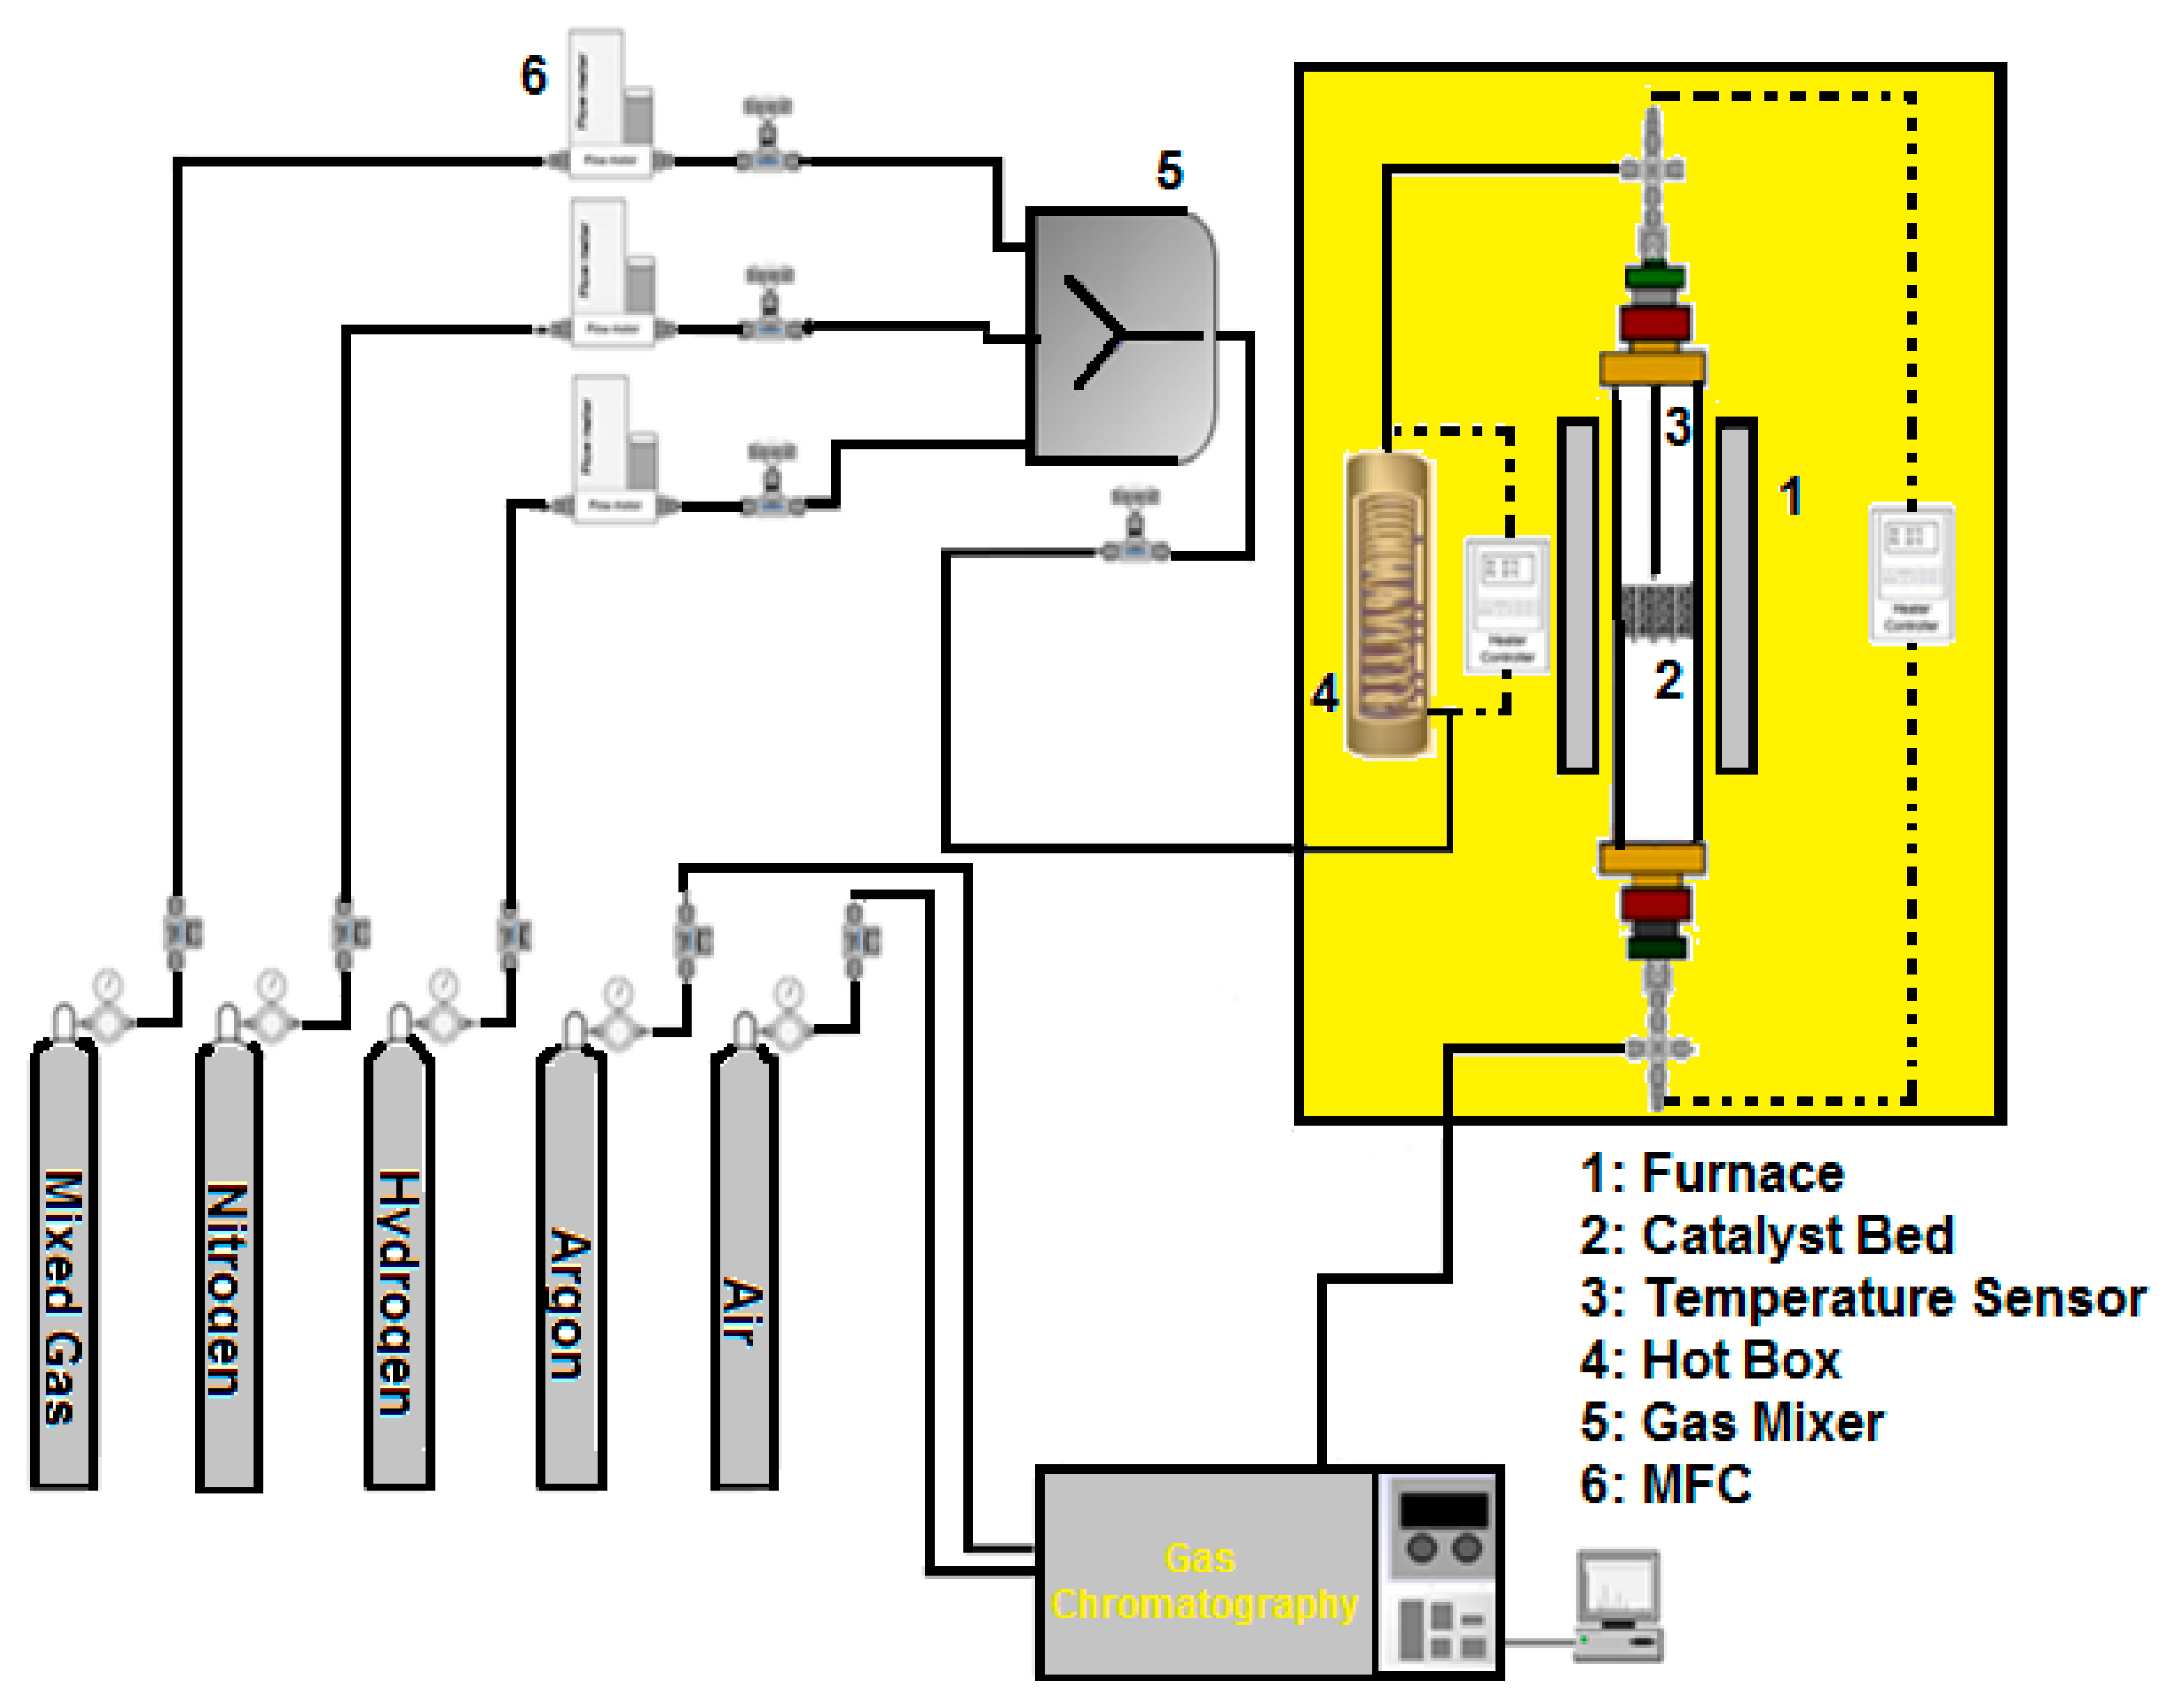
3.5. Catalytic Measurements

Figure 15 demonstrates a schematic plan of the apparatus, including a fixed-bed cylindrical microactivity-reactor acting in down-flow procedure, with the catalyst fixed-bed placed on a poriferous plate [85,86,87,88,89].
The microactivity-reactor was placed inside a hot box (304 stainless steel) insulated with heating capability to 220 °C. A thermocouple with K type encrusted with a 1.5 mm thickness and Inconel covering was placed horizontally via up to down of the micro-activity reactor and was in straight connection with the fixed bed. This scheme permits the analysis of process conditions with answer times of only milliseconds. After passing the streams through a check valve, the reactant inlet streams (H2 reactant, mixed gas, N2 carrier gas) were fed into the microactivity-reactor through HI-TEC mass flow controllers by Bronkhorst. To investigate the catalysts using a facile procedure, all of the samples were analyzed for the acetylene hydrogenation process with excess ethylene. Catalyst and quartz sand were packed in a cylindrical microactivity reactor. The packed bed catalyst was reduced in high purity H2 (99.999%) with GHSV 500 h−1 and N2 carrier (99.999%) at 150 °C for about 7–9 h and then underwent purging with N2 carrier before beginning the heating process and switching the reaction to the process condition. Afterward, the furnace of the reactor was fixed for 1 h before being increased to the subsequent process temperature. Table 4 shows the gaseous reactants, that were prepared from the domestic Jam Petrochemical Company (JPC), and H2, which were used to obtain different R (1–5), and were fed into the reactor at a GHSV of 1000–6000 h−1 at 35–65 °C and 10–22 bar.
The investigation of the mixture product of the microactivity-reactor was done via a GC device (Horiba, Hiroshima, Japan) by a 0.32 mm (i.d.) × 30 m × 1.50 m GS-CARBONPLOT capillary (17A) column working at about ~75 °C and an Flame Ionization Detector (FID) indicator. The calculations of conversion, yield, and selectivity are defined as follows:
Acetylene   Conversion   %   = ( C 2 H 2 inlet C 2 H 2 outlet ) C 2 H 2 inlet   ×   100
Ethylene   Selectivity   %   =   1   ( C 2 H 6 outlet   C 2 H 6 inlet ) ( C 2 H 2 inlet   C 2 H 2 outlet )   ×   100
Ethylene   Yield   %   =   Acetylene   Conversion   %   ×   Ethylene   Selectivity   %

4. Conclusions

In this research, we successfully synthesized a unique type of Beta zeolite as support with an incipient wetness co-impregnation-solvothermal method. The supports with different shapes such as spherical seed, like clews, stretched nanowire, and gear wheel-shaped were synthesized by adding different values of TPAOH, TPABr, morpholine, and n-butylamine as SDAs while the obtained supports with TPAOH had a standard geometry and less mass transfer limitation. The values of Si/(Al + SDA), surface area, pore size, and crystal size in Beta zeolite supports were modified and the optimum values for TPAOH supports were 19.05, 1358.3 m2·g−1, 10.3 nm and 12 nm, respectively. FTIR patterns showed that the Beta-based catalyst was the most active support in the acetylene hydrogenation process. The optimized weight percentages for Pd, Ir, Ce, and Ag were 0.08%, 0.29%, 2.9%, and 1.9%, respectively. TEM analysis showed that Pd and Ir bi-metals were very mono sized and mono dispersed on the support surfaces. Cata-tests showed that 0.08%Pd0.29%Ir/H-Beta(i) catalysts have an optimum acetylene conversion (about ~97%), high selectivity (near ~92%), and maximum yield (about ~99%) at optimum GHSV and reaction temperature which were 4030 h−1 and 55 °C, respectively. Stability tests displayed that 0.08%Pd0.29%Ir/H-Beta(i) catalysts were stabilized after 15 h. TGA-DTG analysis demonstrated that after reduction at 150 °C, the optimum catalysts had insignificant carbonaceous spaces.

Supplementary Materials

The following are available online at www.mdpi.com/2073-4344/7/11/343/s1, Table S1. Total amount of Si/(Al + SDA) ratio for synthesis of Beta-based catalysts. Table S2. The amount value of metals loading on H-Beta(i)-based catalysts. Figure S1. Effect of Si/(Al + SDA) ratio over PSD and BET of Beta-based catalyst for (a) TPABr, (b) morpholine and (c) n-butylamine as SDA. Figure S2. N2 adsorption-desorption isotherms (a) and BJH pore diameter distributions patterns (b) of the optimum catalysts. Figure S3. DLS pictures of the catalysts that optimum via TPAOH. Figure S4. DLS patterns of H-Beta-based catalyst with SDA. Figure S5. TEM patterns of different Beta-based catalysts, (a1) 0.08%Pd0.29%Ir/H-Beta(ii), (a2) 0.08%Pd2.9%Ce/H-Beta(ii), (a3) 0.08%Pd1.9%Ag/H-Beta(ii), (b1) 0.08%Pd0.29%Ir/H-Beta(iii), (b2) 0.08%Pd2.9%Ce/H-Beta(iii), (b3) 0.08%Pd1.9%Ag/H-Beta(iii), (c1) 0.08%Pd0.29%Ir/H-Beta(iv), (c2) 0.08%Pd2.9%Ce/H-Beta(iv), (c3) 0.08%Pd1.9%Ag/H-Beta(iv). Figure S6. EDX analyses of the optimum catalysts. Figure S7. (a) Acetylene conversion, (b) Ethylene selectivity and (c) Yield percentage over 0.08%Pd0.29%Ir/H-Beta(i) catalysts under different H2/C2H2 ratios, GHSV = 4030 h−1, and P = 20 bar. Figure S8. (a) Acetylene conversion, (b) Ethylene selectivity and (c) Yield percentage over 0.08%Pd 2.9%Ce/H-Beta(i) catalysts under different H2/C2H2 ratios GHSV = 4030 h−1, and P = 20 bar. Figure S9. (a) Acetylene conversion, (b) Ethylene selectivity and (c) Yield percentage over 0.08%Pd 1.9%Ag/H-Beta(i) catalysts under different H2/C2H2 ratios GHSV = 4030 h−1, and P = 20 bar. Figure S10. Acetylene conversion over optimum catalysts under P = 20 bar and GHSV = 4030 h−1 (a) R = 1 and (b) R = 5. Figure S11. Ethylene selectivity optimum catalysts under P = 20 bar and GHSV = 4030 h−1 (a) R = 1 and (b) R = 5. Figure S12. Yield over optimum catalysts under P = 20 bar and GHSV = 4030 h−1 (a) R = 1 and (b) R = 5. Figure S13. (a) Acetylene conversion, (b) Ethylene selectivity and (c) Yield percentage over 0.08%Pd 0.29%Ir/H-Beta(ii) catalysts under different H2/C2H2 ratios, GHSV = 4030 h−1, and P = 20 bar. Figure S14. (a) Acetylene conversion, (b) Ethylene selectivity and (c) Yield percentage over 0.08%Pd 2.9%Ce/H-Beta(ii) catalysts under different H2/C2H2 ratios GHSV = 4030 h−1, and P = 20 bar. Figure S15. (a) Acetylene conversion, (b) Ethylene selectivity and (c) Yield percentage over 0.08%Pd 1.9%Ag/H-Beta(ii) catalysts under different H2/C2H2 ratios GHSV = 4030 h−1, and P = 20 bar. Figure S16. (a) Acetylene conversion, (b) Ethylene selectivity and (c) Yield percentage over 0.08%Pd 0.29%Ir/H-Beta(iii) catalysts under different H2/C2H2 ratios, GHSV = 4030 h−1, and P = 20 bar. Figure S17. (a) Acetylene conversion, (b) Ethylene selectivity and (c) Yield percentage over 0.08%Pd 2.9%Ce/H-Beta(iii) catalysts under different H2/C2H2 ratios GHSV = 4030 h−1, and P = 20 bar. Figure S18. (a) Acetylene conversion, (b) Ethylene selectivity and (c) Yield percentage over 0.08%Pd 1.9%Ag/H-Beta(iii) catalysts under different H2/C2H2 ratios GHSV = 4030 h−1, and P = 20 bar. Figure S19. (a) Acetylene conversion, (b) Ethylene selectivity and (c) Yield percentage over 0.08%Pd0.29%Ir/H-Beta(iv) catalysts under different H2/C2H2 ratios GHSV = 4030 h−1, and P = 20 bar. Figure S20. (a) Acetylene conversion, (b) Ethylene selectivity and (c) Yield percentage over 0.08%Pd2.9%Ce/H-Beta(iv) catalysts under different H2/C2H2 ratios GHSV = 4030 h−1, and P = 20 bar. Figure S21. (a) Acetylene conversion, (b) Ethylene selectivity and (c) Yield percentage over 0.08%Pd1.9%Ag/H-Beta(iv) catalysts under different H2/C2H2 ratios GHSV = 4030 h−1, and P = 20 bar.

Author Contributions

Masood Sahooli, Mohammad Khorram and Mohammad Reza Rahimpour conceived and designed the experiments; Masood Sahooli performed the experiments; Masood Sahooli, Mohammad Khorram and Mohammad Reza Rahimpour performed catalyst synthesis; Masood Sahooli analyzed the data; Mohammad Khorram contributed reagents/materials/analysis tools; Mohammad Reza Rahimpour participated in the analysis and interpretation of characterization results; and Masood Sahooli wrote the paper.

Conflicts of Interest

The authors declare no conflict of interest.

References

  1. Sharma, P.; Song, J.S.; Han, M.H.; Cho, C.H. Gis-nap1 zeolite microspheres as potential water adsorption material: Influence of initial silica concentration on adsorptive and physical/topological properties. Sci. Rep. 2016, 6, 22734. [Google Scholar] [CrossRef] [PubMed]
  2. Awala, H.; Gilson, J.P.; Retoux, R.; Boullay, P.; Goupil, J.M.; Valtchev, V.; Mintova, S. Template-free nanosized faujasite-type zeolites. Nat. Mater. 2015, 14, 447–451. [Google Scholar] [CrossRef] [PubMed]
  3. Valtchev, V.; Majano, G.; Mintova, S.; Pérez-Ramírez, J. Tailored crystalline microporous materials by post-synthesis modification. Chem. Soc. Rev. 2013, 42, 263–290. [Google Scholar] [CrossRef] [PubMed]
  4. Shokouhimehr, M. Magnetically separable and sustainable nanostructured catalysts for heterogeneous reduction of nitroaromatics. Catalysts 2015, 5, 534–560. [Google Scholar] [CrossRef]
  5. Kim, A.; Rafiaei, S.M.; Abolhosseini, S.; Shokouhimehr, M. Palladium nanocatalysts confined in mesoporous silica for heterogeneous reduction of nitroaromatics. Energy Environ. Focus 2015, 4, 18–23. [Google Scholar] [CrossRef]
  6. Milina, M.; Mitchell, S.; Crivelli, P.; Cooke, D.; Pérez-Ramírez, J. Mesopore quality determines the lifetime of hierarchically structured zeolite catalysts. Nat. Commun. 2014. [Google Scholar] [CrossRef]
  7. Kim, K.; Lee, T.; Kwon, Y.; Seo, Y.; Song, J.; Park, J.K.; Lee, H.; Park, J.Y.; Ihee, H.; Cho, S.J.; et al. Lanthanum-catalysed synthesis of microporous 3d graphene-like carbons in a zeolite template. Nature 2016, 535, 131–135. [Google Scholar] [CrossRef] [PubMed]
  8. Fasano, M.; Humplik, T.; Bevilacqua, A.; Tsapatsis, M.; Chiavazzo, E.; Wang, E.N.; Asinari, P. Interplay between hydrophilicity and surface barriers on water transport in zeolite membranes. Nat. Commun. 2016, 7, 12762. [Google Scholar] [CrossRef] [PubMed]
  9. Gizzatov, A.; Key, J.; Aryal, S.; Ananta, J.; Cervadoro, A.; Palange, A.L.; Fasano, M.; Stigliano, C.; Zhong, M.; Di Mascolo, D. Hierarchically structured magnetic nanoconstructs with enhanced relaxivity and cooperative tumor accumulation. Adv. Funct. Mater. 2014, 24, 4584–4594. [Google Scholar] [CrossRef] [PubMed]
  10. Hendon, C.H.; Wittering, K.E.; Chen, T.-H.; Kaveevivitchai, W.; Popov, I.; Butler, K.T.; Wilson, C.C.; Cruickshank, D.L.; Miljanić, O.S.; Walsh, A. Absorbate-induced piezochromism in a porous molecular crystal. Nano Lett. 2015, 15, 2149–2154. [Google Scholar] [CrossRef] [PubMed] [Green Version]
  11. Na, K.; Choi, K.M.; Yaghi, O.M.; Somorjai, G.A. Metal nanocrystals embedded in single nanocrystals of mofs give unusual selectivity as heterogeneous catalysts. Nano Lett. 2014, 14, 5979–5983. [Google Scholar] [CrossRef] [PubMed]
  12. Mitchell, S.; Pinar, A.B.; Kenvin, J.; Crivelli, P.; Kärger, J.; Pérez-Ramírez, J. Structural analysis of hierarchically organized zeolites. Nat. Commun. 2015, 6, 8633. [Google Scholar] [CrossRef] [PubMed]
  13. Bai, P.; Jeon, M.Y.; Ren, L.; Knight, C.; Deem, M.W.; Tsapatsis, M.; Siepmann, J.I. Discovery of optimal zeolites for challenging separations and chemical transformations using predictive materials modeling. Nat. Commun. 2015, 6, 5912. [Google Scholar] [CrossRef] [PubMed]
  14. Linares, M.; Vargas, C.; García, A.; Ochoa-Hernández, C.; Čejka, J.; García-Muñoz, R.A.; Serrano, D.P. Effect of hierarchical porosity in beta zeolites on the beckmann rearrangement of oximes. Catal. Sci. Technol. 2017, 7, 181–190. [Google Scholar] [CrossRef]
  15. Van Donk, S.; Janssen, A.H.; Bitter, J.H.; de Jong, K.P. Generation, characterization, and impact of mesopores in zeolite catalysts. Catal. Rev. 2003, 45, 297–319. [Google Scholar] [CrossRef]
  16. Breck, D.; Eversole, W.; Milton, R.; Reed, T.; Thomas, T. Crystalline zeolites. I. The properties of a new synthetic zeolite, type A. J. Am. Chem. Soc. 1956, 78, 5963–5972. [Google Scholar] [CrossRef]
  17. Kuznicki, S.M.; Bell, V.A.; Nair, S.; Hillhouse, H.W.; Jacubinas, R.M.; Braunbarth, C.M.; Toby, B.H.; Tsapatsis, M. A titanosilicate molecular sieve with adjustable pores for size-selective adsorption of molecules. Nature 2001, 412, 720–724. [Google Scholar] [CrossRef] [PubMed]
  18. Morris, R.E.; Čejka, J. Exploiting chemically selective weakness in solids as a route to new porous materials. Nat. Chem. 2015, 7, 381–388. [Google Scholar] [CrossRef] [PubMed]
  19. Na, K.; Choi, M.; Ryoo, R. Cyclic diquaternary ammoniums for nanocrystalline bea, mtw and mfi zeolites with intercrystalline mesoporosity. J. Mater. Chem. 2009, 19, 6713–6719. [Google Scholar] [CrossRef]
  20. Kresge, C.; Leonowicz, M.; Roth, W.; Vartuli, J.; Beck, J. Ordered mesoporous molecular sieves synthesized by a liquid-crystal template mechanism. Nature 1992, 359, 710–712. [Google Scholar] [CrossRef]
  21. Taguchi, A.; Schüth, F. Ordered mesoporous materials in catalysis. Microporous Mesoporous Mater. 2005, 77, 1–45. [Google Scholar] [CrossRef]
  22. Hould, N.D.; Foster, A.; Lobo, R.F. Zeolite beta mechanisms of nucleation and growth. Microporous Mesoporous Mater. 2011, 142, 104–115. [Google Scholar] [CrossRef]
  23. Ryoo, R.; Joo, S.H.; Kruk, M.; Jaroniec, M. Ordered mesoporous carbons. Adv. Mater. 2001, 13, 677–681. [Google Scholar] [CrossRef]
  24. Choi, M.; Na, K.; Kim, J.; Sakamoto, Y.; Terasaki, O.; Ryoo, R. Stable single-unit-cell nanosheets of zeolite mfi as active and long-lived catalysts. Nature 2009, 461, 246. [Google Scholar] [CrossRef] [PubMed]
  25. Kim, W.; Kim, J.-C.; Kim, J.; Seo, Y.; Ryoo, R. External surface catalytic sites of surfactant-tailored nanomorphic zeolites for benzene isopropylation to cumene. ACS Catal. 2013, 3, 192–195. [Google Scholar] [CrossRef]
  26. Zhu, Z.; Xu, H.; Jiang, J.; Wu, H.-H.; Wu, P. Hydrophobic nanosized all-silica beta zeolite: Efficient synthesis and adsorption application. ACS Appl. Mater. Interfaces 2017, 9, 27273–27283. [Google Scholar] [CrossRef] [PubMed]
  27. Arranz, M.; Pérez-Pariente, J.; Blasco, T. Fluorine-containing organic molecules as structure-directing agents in the synthesis of crystalline microporous materials. Part ii: Synthesis of all-silica zeolites from fluorine-containing derivatives of 1-benzyl-1-methyl-hexamethylenammonium cations. Microporous Mesoporous Mater. 2006, 89, 235–245. [Google Scholar] [CrossRef]
  28. Stelzer, J.; Paulus, M.; Hunger, M.; Weitkamp, J. Hydrophobic properties of all-silica zeolite beta. Microporous Mesoporous Mater. 1998, 22, 1–8. [Google Scholar] [CrossRef]
  29. Karimi, B.; Abedi, S.; Clark, J.H.; Budarin, V. Highly efficient aerobic oxidation of alcohols using a recoverable catalyst: The role of mesoporous channels of sba-15 in stabilizing palladium nanoparticles. Angew. Chem. 2006, 118, 4894–4897. [Google Scholar] [CrossRef]
  30. Liu, C.; Yuan, P.; Cui, C. The pore confinement effect of fdu-12 mesochannels on mos2active phases and their hydrodesulfurization performance. J. Nanomater. 2016, 2016, 1–10. [Google Scholar] [CrossRef]
  31. Zang, W.; Li, G.; Wang, L.; Zhang, X. Catalytic hydrogenation by noble-metal nanocrystals with well-defined facets: A review. Catal. Sci. Technol. 2015, 5, 2532–2553. [Google Scholar] [CrossRef]
  32. McCue, A.J.; Anderson, J.A. Recent advances in selective acetylene hydrogenation using palladium containing catalysts. Front. Chem. Sci. Eng. 2015, 9, 142–153. [Google Scholar] [CrossRef]
  33. Borodziński, A.; Bond, G.C. Selective hydrogenation of ethyne in ethene-rich streams on palladium catalysts, part 2: Steady-state kinetics and effects of palladium particle size, carbon monoxide, and promoters. Catal. Rev. 2008, 50, 379–469. [Google Scholar] [CrossRef]
  34. Benavidez, A.D.; Burton, P.D.; Nogales, J.L.; Jenkins, A.R.; Ivanov, S.A.; Miller, J.T.; Karim, A.M.; Datye, A.K. Improved selectivity of carbon-supported palladium catalysts for the hydrogenation of acetylene in excess ethylene. Appl. Catal. A 2014, 482, 108–115. [Google Scholar] [CrossRef]
  35. Burton, P.D.; Boyle, T.J.; Datye, A.K. Facile, surfactant-free synthesis of pd nanoparticles for heterogeneous catalysts. J. Catal. 2011, 280, 145–149. [Google Scholar] [CrossRef]
  36. Khan, N.A.; Shaikhutdinov, S.; Freund, H.-J. Acetylene and ethylene hydrogenation on alumina supported pd-ag model catalysts. Catal. Lett. 2006, 108, 159–164. [Google Scholar] [CrossRef]
  37. Ziaei-Azad, H.; Semagina, N. Iridium addition enhances hydrodesulfurization selectivity in 4,6-dimethyldibenzothiophene conversion on palladium. Appl. Catal. B 2016, 191, 138–146. [Google Scholar] [CrossRef]
  38. Ziaei-azad, H.; Yin, C.-X.; Shen, J.; Hu, Y.; Karpuzov, D.; Semagina, N. Size- and structure-controlled mono- and bimetallic ir–pd nanoparticles in selective ring opening of indan. J. Catal. 2013, 300, 113–124. [Google Scholar] [CrossRef]
  39. Meku, E.; Du, C.; Sun, Y.; Du, L.; Wang, Y.; Kong, F.; Yin, G. Composition optimization of ternary palladium–iridium–iron alloy catalysts for oxygen reduction reaction in acid medium. RSC Adv. 2016, 6, 22754–22763. [Google Scholar] [CrossRef]
  40. Yang, T.; Cao, G.; Huang, Q.; Ma, Y.; Wan, S.; Zhao, H.; Li, N.; Yin, F.; Sun, X.; Zhang, D.; et al. Truncated octahedral platinum–nickel–iridium ternary electro-catalyst for oxygen reduction reaction. J. Power Sources 2015, 291, 201–208. [Google Scholar] [CrossRef]
  41. Wang, C.-H.; Hsu, H.-C.; Wang, K.-C. Iridium-decorated palladium–platinum core–shell catalysts for oxygen reduction reaction in proton exchange membrane fuel cell. J. Coll. Interface Sci. 2014, 427, 91–97. [Google Scholar] [CrossRef] [PubMed]
  42. You, D.J.; Jin, S.-A.; Lee, K.H.; Pak, C.; Choi, K.H.; Chang, H. Improvement of activity for oxygen reduction reaction by decoration of ir on pdcu/c catalyst. Catal. Today 2012, 185, 138–142. [Google Scholar] [CrossRef]
  43. Mei, D.; Neurock, M.; Smith, C.M. Hydrogenation of acetylene–ethylene mixtures over pd and pd–ag alloys: First-principles-based kinetic monte carlo simulations. J. Catal. 2009, 268, 181–195. [Google Scholar] [CrossRef]
  44. Han, Y.; Peng, D.; Xu, Z.; Wan, H.; Zheng, S.; Zhu, D. TiO2 supported pd@ ag as highly selective catalysts for hydrogenation of acetylene in excess ethylene. Chem. Commun. 2013, 49, 8350–8352. [Google Scholar] [CrossRef] [PubMed]
  45. Wang, S.; Shen, B.; Song, Q. Kinetics of acetylene hydrochlorination over bimetallic au–cu/c catalyst. Catal. Lett. 2010, 134, 102–109. [Google Scholar] [CrossRef]
  46. Song, Q.; Wang, S.; Shen, B.; Zhao, J. Palladium-based catalysts for the hydrochlorination of acetylene: Reasons for deactivation and its regeneration. Pet. Sci. Technol. 2010, 28, 1825–1833. [Google Scholar] [CrossRef]
  47. Wang, F.; Wang, L.; Wang, J.; Zhao, Y.; Wang, Y.; Yang, D. Bimetallic pd-k/y-zeolite catalyst in acetylene hydrochlorination for pvc production. React. Kinet. Mech. Catal. 2014, 114, 725–734. [Google Scholar] [CrossRef]
  48. Zhang, H.; Dai, B.; Wang, X.; Xu, L.; Zhu, M. Hydrochlorination of acetylene to vinyl chloride monomer over bimetallic au–la/sac catalysts. J. Ind. Eng. Chem. 2012, 18, 49–54. [Google Scholar] [CrossRef]
  49. Zhang, H.; Dai, B.; Wang, X.; Li, W.; Han, Y.; Gu, J.; Zhang, J. Non-mercury catalytic acetylene hydrochlorination over bimetallic au–co(iii)/sac catalysts for vinyl chloride monomer production. Green Chem. 2013, 15, 829–836. [Google Scholar] [CrossRef]
  50. Studt, F.; Abild-Pedersen, F.; Bligaard, T.; Sørensen, R.Z.; Christensen, C.H.; Nørskov, J.K. Identification of non-precious metal alloy catalysts for selective hydrogenation of acetylene. Science 2008, 320, 1320–1322. [Google Scholar] [CrossRef] [PubMed]
  51. Bridier, B.; López, N.; Pérez-Ramírez, J. Molecular understanding of alkyne hydrogenation for the design of selective catalysts. Dalton Trans. 2010, 39, 8412–8419. [Google Scholar] [CrossRef] [PubMed]
  52. Vilé, G.; Bridier, B.; Wichert, J.; Pérez-Ramírez, J. Ceria in hydrogenation catalysis: High selectivity in the conversion of alkynes to olefins. Angew. Chem. Int. Ed. 2012, 51, 8620–8623. [Google Scholar] [CrossRef] [PubMed]
  53. Segura, Y.; López, N.; Pérez-Ramírez, J. Origin of the superior hydrogenation selectivity of gold nanoparticles in alkyne+ alkene mixtures: Triple-versus double-bond activation. J. Catal. 2007, 247, 383–386. [Google Scholar] [CrossRef]
  54. Yan, X.; Wheeler, J.; Jang, B.; Lin, W.-Y.; Zhao, B. Stable au catalysts for selective hydrogenation of acetylene in ethylene. Appl. Catal. A 2014, 487, 36–44. [Google Scholar] [CrossRef]
  55. Vilé, G.; Baudouin, D.; Remediakis, I.N.; Copéret, C.; López, N.; Pérez-Ramírez, J. Silver nanoparticles for olefin production: New insights into the mechanistic description of propyne hydrogenation. ChemCatChem 2013, 5, 3750–3759. [Google Scholar] [CrossRef]
  56. Bridier, B.; López, N.; Pérez-Ramírez, J. Partial hydrogenation of propyne over copper-based catalysts and comparison with nickel-based analogues. J. Catal. 2010, 269, 80–92. [Google Scholar] [CrossRef]
  57. Zhang, Y.; Diao, W.; Monnier, J.R.; Williams, C.T. Pd–Ag/SiO2 bimetallic catalysts prepared by galvanic displacement for selective hydrogenation of acetylene in excess ethylene. Catal. Sci. Technol. 2015, 5, 4123–4132. [Google Scholar] [CrossRef]
  58. Kuhn, M.; Lucas, M.; Claus, P. Long-time stability vs deactivation of pd–Ag/Al2O3 egg-shell catalysts in selective hydrogenation of acetylene. Ind. Eng. Chem. Res. 2015, 54, 6683–6691. [Google Scholar] [CrossRef]
  59. Gulyaeva, Y.K.; Kaichev, V.V.; Zaikovskii, V.I.; Suknev, A.P.; Bal’zhinimaev, B.S. Selective hydrogenation of acetylene over pd/fiberglass catalysts: Kinetic and isotopic studies. Appl. Catal. A 2015, 506, 197–205. [Google Scholar] [CrossRef]
  60. Wang, L.; Wang, F.; Wang, J.; Tang, X.; Zhao, Y.; Yang, D.; Jia, F.; Hao, T. Hydrochlorination of acetylene to vinyl chloride over pd supported on zeolite y. React. Kinet. Mech. Catal. 2013, 110, 187–194. [Google Scholar] [CrossRef]
  61. Azizi, Y.; Petit, C.; Pitchon, V. Formation of polymer-grade ethylene by selective hydrogenation of acetylene over Au/CeO2 catalyst. J. Catal. 2008, 256, 338–344. [Google Scholar] [CrossRef]
  62. Delgado, J.A.; Benkirane, O.; Claver, C.; Curulla-Ferre, D.; Godard, C. Advances in the preparation of highly selective nanocatalysts for the semi-hydrogenation of alkynes using colloidal approaches. Dalton Trans. 2017, 46, 12381–12403. [Google Scholar] [CrossRef] [PubMed]
  63. Du, P.; Zheng, P.; Song, S.; Wang, X.; Zhang, M.; Chi, K.; Xu, C.; Duan, A.; Zhao, Z. Synthesis of a novel micro/mesoporous composite material beta-fdu-12 and its hydro-upgrading performance for fcc gasoline. RSC Adv. 2016, 6, 1018–1026. [Google Scholar] [CrossRef]
  64. Jin, Q.; He, Y.; Miao, M.; Guan, C.; Du, Y.; Feng, J.; Li, D. Highly selective and stable pdni catalyst derived from layered double hydroxides for partial hydrogenation of acetylene. Appl. Catal. A 2015, 500, 3–11. [Google Scholar] [CrossRef]
  65. Li, C.; Fujimoto, K. Synthesis gas conversion to isobutane-rich hydrocarbons over a hybrid catalyst containing beta zeolite—Role of doped palladium and influence of the SiO2/Al2O3 ratio. Catal. Sci. Technol. 2015, 5, 4501–4510. [Google Scholar] [CrossRef]
  66. Zhu, K.; Sun, J.; Liu, J.; Wang, L.; Wan, H.; Hu, J.; Wang, Y.; Peden, C.H.F.; Nie, Z. Solvent evaporation assisted preparation of oriented nanocrystalline mesoporous mfi zeolites. ACS Catal. 2011, 1, 682–690. [Google Scholar] [CrossRef]
  67. Yu, Q.; Meng, X.; Liu, J.; Li, C.; Cui, Q. A fast organic template-free, ZSM-11 seed-assisted synthesis of zsm-5 with good performance in methanol-to-olefin. Microporous Mesoporous Mater. 2013, 181, 192–200. [Google Scholar] [CrossRef]
  68. Zaera, F. Cheminform abstract: New advances in the use of infrared absorption spectroscopy for the characterization of heterogeneous catalytic reactions. ChemInform 2015, 46. [Google Scholar] [CrossRef]
  69. Pirngruber, G.; Seshan, K.; Lercher, J. Dehydroisomerization of n-butane over Pt–ZSM5 (i): Effect of the metal loading and acid site concentration. J. Catal. 1999, 186, 188–200. [Google Scholar] [CrossRef]
  70. McKenna, F.; Mantarosie, L.; Wells, R.; Hardacre, C.; Anderson, J. Selective hydrogenation of acetylene in ethylene rich feed streams at high pressure over ligand modified Pd/TiO2. Catal. Sci. Technol. 2012, 2, 632–638. [Google Scholar] [CrossRef]
  71. Zhang, H.; Han, L.; Duan, A.; Xu, C.; Zhao, Z.; Wei, Y.; Jiang, G.; Liu, J.; Wang, D.; Xia, Z. Synthesis of micro-mesoporous materials Zsm-5/Fdu-12 and the performance of dibenzothiophene hydrodesulfurization. RSC Adv. 2017, 7, 28038–28047. [Google Scholar] [CrossRef]
  72. Kataoka, T.; Dumesic, J.A. Cheminform abstract: Acidity of unsupported and silica-supported vanadia, molybdena, and titania as studied by pyridine adsorption. ChemInform 1988, 19. [Google Scholar] [CrossRef]
  73. Klimova, T.; Peña, L.; Lizama, L.; Salcedo, C.; Gutiérrez, O.Y. Modification of activity and selectivity of nimo/sba-15 hds catalysts by grafting of different metal oxides on the support surface. Ind. Eng. Chem. Res. 2008, 48, 1126–1133. [Google Scholar] [CrossRef]
  74. Weber, R.S. Effect of local structure on the uv-visible absorption edges of molybdenum oxide clusters and supported molybdenum oxides. J. Catal. 1995, 151, 470–474. [Google Scholar] [CrossRef]
  75. Soled, S.; Wachter, W.; Wo, H. Use of zeta potential measurements in catalyst preparation. Stud. Surf. Sci. Catal. 2010, 175, 101–107. [Google Scholar]
  76. Limousy, L.; Mahzoul, H.; Hamon, L.; Siffert, B. Determination by zetametry and ‘streaming induced potential’ measurements of the amounts of catalytic precursors necessary to saturate a support. Coll. Surf. A 2001, 181, 91–97. [Google Scholar] [CrossRef]
  77. Lee, Y.-J.; Baek, S.-C.; Jun, K.-W. Methanol conversion on sapo-34 catalysts prepared by mixed template method. Appl. Catal. A 2007, 329, 130–136. [Google Scholar] [CrossRef]
  78. Zaera, F. Tuning selectivity in hydrocarbon conversion catalysis. J. Mol. Catal. A 2005, 228, 21–26. [Google Scholar] [CrossRef]
  79. He, Y.-F.; Feng, J.-T.; Du, Y.-Y.; Li, D.-Q. Controllable synthesis and acetylene hydrogenation performance of supported pd nanowire and cuboctahedron catalysts. ACS Catal. 2012, 2, 1703–1710. [Google Scholar] [CrossRef]
  80. Kim, S.K.; Lee, J.H.; Ahn, I.Y.; Kim, W.-J.; Moon, S.H. Performance of cu-promoted pd catalysts prepared by adding cu using a surface redox method in acetylene hydrogenation. Appl. Catal. A 2011, 401, 12–19. [Google Scholar] [CrossRef]
  81. Rafiaei, S.M.; Kim, A.; Shokouhimehr, M. Gadolinium triflate immobilized on magnetic nanocomposites as recyclable lewis acid catalyst for acetylation of phenols. Nanosci. Nanotechnol. Lett. 2014, 6, 309–313. [Google Scholar] [CrossRef]
  82. Hickman, D.; Schmidt, L. Production of syngas by direct catalytic oxidation of methane. Science 1993, 259, 343. [Google Scholar] [CrossRef] [PubMed]
  83. Prinz, D.; Riekert, L. Formation of ethene and propene from methanol on zeolite zsm-5. Appl. Catal. 1988, 37, 139–154. [Google Scholar] [CrossRef]
  84. Gil, B.; Zones, S.I.; Hwang, S.-J.; Bejblová, M.; Čejka, J. Acidic properties of ssz-33 and ssz-35 novel zeolites: A complex infrared and mas nmr study. J. Phys. Chem. C 2008, 112, 2997–3007. [Google Scholar] [CrossRef]
  85. Saidi, M.; Rahimpour, M.R.; Raeissi, S. Upgrading process of 4-methylanisole as a lignin-derived bio-oil catalyzed by Pt/γ-Al2O3: Kinetic investigation and reaction network development. Energy Fuels 2015, 29, 3335–3344. [Google Scholar] [CrossRef]
  86. Rahimpour, H.R.; Saidi, M.; Rostami, P.; Gates, B.C.; Rahimpour, M.R. Experimental investigation on upgrading of lignin-derived bio-oils: Kinetic analysis of anisole conversion on sulfided como/Al2O3 catalyst. Int. J. Chem. Kinet. 2016, 48, 702–713. [Google Scholar] [CrossRef]
  87. Saidi, M.; Rostami, P.; Rahimpour, H.R.; Roshanfekr Fallah, M.A.; Rahimpour, M.R.; Gates, B.C.; Raeissi, S. Kinetics of upgrading of anisole with hydrogen catalyzed by platinum supported on alumina. Energy Fuels 2015, 29, 4990–4997. [Google Scholar] [CrossRef]
  88. Saidi, M.; Rostami, P.; Rahimpour, M.R.; Gates, B.C.; Raeissi, S. Upgrading of lignin-derived bio-oil components catalyzed by pt/γ-Al2O3: Kinetics and reaction pathways characterizing conversion of cyclohexanone with H2. Energy Fuels 2015, 29, 191–199. [Google Scholar] [CrossRef]
  89. Rahimpour, M.R.; Hesami, M.; Saidi, M.; Jahanmiri, A.; Farniaei, M.; Abbasi, M. Methane steam reforming thermally coupled with fuel combustion: Application of chemical looping concept as a novel technology. Energy Fuels 2013, 27, 2351–2362. [Google Scholar] [CrossRef]
Figure 1. Selective and unselective reaction pathways for acetylene hydrogenation.
Catalysts 07 00343 g001
Figure 2. (a) N2-adsorption/desorption isotherms and (b) barrett–joyner–halenda (BJH) pore diameter distributions, of the synthesized optimum supports and (c) effect of Si/(Al + SDA) on the PSD and BET for Tetrapropylammonium hydroxide (TPAOH).
Catalysts 07 00343 g002aCatalysts 07 00343 g002b
Figure 3. Scanning electron microscopy (SEM) images of the investigation effect of different SDA on the Beta-zeolite supports synthesized with (a) without SDA, (b) TPAOH, (c) tetrapropylammonium bromide (TPABr), (d) morpholine, (e) n-butylamine.
Catalysts 07 00343 g003aCatalysts 07 00343 g003bCatalysts 07 00343 g003c
Figure 4. Transverse Electric and Magnetic Field (TEM) patterns of different Beta(i)-based catalysts, (a1,a2) 0.08%Pd0.29%Ir/H-Beta(i), (b1,b2) 0.08%Pd2.9%Ce/H-Beta(i), and (c1,c2) 0.08%Pd 1.9%Ag/H-Beta(i).
Catalysts 07 00343 g004aCatalysts 07 00343 g004bCatalysts 07 00343 g004c
Figure 5. (a) X-ray powder diffraction (XRD) patterns of the parent Beta zeolite with different SDA; (b) XRD patterns of the corresponding optimum catalysts.
Catalysts 07 00343 g005
Figure 6. Fourier–transform infrared (FTIR) spectra of the Beta-zeolite in the region (a) 400–1400 cm−1 and (b) 1400–4000 cm−1.
Catalysts 07 00343 g006
Figure 7. FTIR spectra of pyridine adsorbed on optimum catalysis (a) 200 °C and (b) 350 °C.
Catalysts 07 00343 g007
Figure 8. UV–Visible diffuse reflectance spectroscopy (UV–Vis. DRS) spectra of different catalysts.
Catalysts 07 00343 g008
Figure 9. Zeta potential of (a) supports and (b) catalysts.
Catalysts 07 00343 g009
Figure 10. Acetylene conversion, ethylene selectivity, and yield over optimum catalysts under R = 3, p = 20 bar and GHSV = 4030 h−1. (a) Acetylene conversion; (b) ethylene selectivity; (c) yield.
Catalysts 07 00343 g010
Figure 11. Effects of gas hour space velocity (GHSV) on acetylene conversion and ethylene selectivity at T = 55 °C, R = 3, and p = 20 bar over 0.08%Pd0.29%Ir/H-Beta(i) catalyst.
Catalysts 07 00343 g011
Figure 12. The conversion, selectivity and yield of 0.08%Pd0.29%Ir/H-Beta(i) as a function of time on stream at 55 °C, GHSV = 4030 h−1, R = 3 and p = 20 bar.
Catalysts 07 00343 g012
Figure 13. Temperature programmed desorption (TPD) pattern of acetylene and ethylene desorption on optimum catalysts.
Catalysts 07 00343 g013
Figure 14. Thermal Gravity Analysis-derivative thermogravimetry (TGA-DTG) patterns of fresh and used 0.08%Pd0.29%Ir/H-Beta(i) catalyst after work in 55 °C, p = 20 bar, R = 3, GHSV = 4030 h−1 for 15 h, and reduction at 150 °C.
Catalysts 07 00343 g014
Figure 15. Schematic flow diagram of the fixed-bed tubular microflow reactor. MFC: mass flow controller.
Catalysts 07 00343 g015
Table 1. Textural properties and optimum amount of Si/(Al + SDA) for different Beta-based catalysts. SDA: structure direct agents; BET: brunauer–emmett–teller, PSD: pore size distribution; DLS: dynamic light scattering.
Supportsi (mM)ii (mM)iii (mM)iv (mM) Si ( Al + SDA ) BET (m2·g−1)PSD (nm)DLS (nm)
H-Beta(0)----28.571474.781.403
H-Beta(i)35.00---19.051358.3010.312
H-Beta(ii)-26.73--20.671054.2016.718
H-Beta(iii)--81.67-13.18754.90027.940
H-Beta(iv)---97.3111.95587.40046.167
Table 2. Textural properties and optimum metal loading of the H-Beta(i)-based catalysts.
CatalystsFresh Mono-Pd/H-Beta(i)Fresh Pd-Ir/H-Beta(i)Fresh Pd-Ce/H-Beta(i)Fresh Pd-Ag/H-Beta(i)
Pd (wt%) a0.0830.0810.0810.081
Ir (wt%) a00.29400
Ce (wt%) a002.930
Ag (wt%) a0001.92
BET (m2 g−1) b-1108.9973.7850.3
PSD (nm) c-7.65.96.3
Vt (cm3 g−1) d-0.450.410.37
Vmes (cm3 g−1) c-0.440.380.33
Vmic (cm3 g−1) e-0.010.020.02
Crystal size (nm) f-121521
a: Determined by Inductively Coupled Plasma (ICP) analysis; b: Calculated by BET method; c: Mesopore volume and diameter calculated using the BJH method; d: The total pore volume was obtained at a relative pressure of 0.98 by Horvath and Kawazoe (HK) model; e: Calculated using t-plot method; f: Determined by DLS analysis.
Table 3. Amounts of Lewis (L) and Brønsted (B) acid sites determined by Fourier–transform infrared spectroscopy (FTIR) of pyridine adsorption for various catalysts.
Amount of Acid Sites ( μ m o l g )
Catalysts200 °C350 °C
LBL + BB/LLBL + BB/L
0.08%Pd1.9%Ag/H-Beta(i)87.18.395.400.09539.2039.20
0.08%Pd2.9%Ce/H-Beta(i)91.67.999.500.08640.5040.50
0.08%Pd0.29%Ir/H-Beta(i)97.46.1103.50.06343.1043.10
Table 4. Specification of inlet stream.
ComponentValue (mol%)
Ethylene65.5307
Ethane33.6406
Acetylene0.7591
Propylene0.0596
Methane0.0077
Propane0.0007
Other C4s0.0015
1,3-butadiene<0.0001
C5 + hydrocarbons<0.0001
Cyclopropane<0.0001
Methylacetylene-Propadiene (MAPD)<0.0001

