Characteristics of NixFe1−xOy Electrocatalyst on Hematite as Photoanode for Solar Hydrogen Production


1
Department of Physics, National Taiwan University, Taipei 10617, Taiwan
2
Institute of Atomic and Molecular Sciences, Academia Sinica, Taipei 10617, Taiwan
3
Department of Mechanical Engineering, National Central University, Taoyuan 32001, Taiwan
4
Department of Physics, National Central University, Taoyuan 32001, Taiwan
*
Author to whom correspondence should be addressed.
Catalysts 2017, 7(11), 350; https://doi.org/10.3390/catal7110350
Submission received: 20 September 2017
/
Revised: 15 November 2017
/
Accepted: 17 November 2017
/
Published: 20 November 2017
(This article belongs to the Special Issue Advances in Electrocatalysis)
Abstract
:The use of hematite as the photoanode for photoelectrochemical hydrogen production by solar energy has been actively studied due to its abundance, stability, and adequate optical properties. Deposition of an electrocatalyst overlayer on the hematite may increase kinetics and lower the onset potential for water splitting. NixFe1−xOy is one of the most effective electrocatalysts reported for this purpose. However, the condition and results of the previous reports vary significantly, and a comprehensive model for NixFe1−xOy/hematite is lacking. Here, we report a simple and novel chemical bath deposition method for depositing low-onset-potential NixFe1−xOy electrocatalyst on hematite. With a Ni percentage of 80% and an immersion time of 2 min, the as-prepared NixFe1−xOy overlayer raised the photovoltage from 0.2 V to 0.7 V, leading to a cathodic shift of the onset potential by 400 mV, while maintaining the same level of current density. The dependence of the electrochemical and photoelectrochemical characteristics of the photoanode on the condition of the electrocatalyst was studied systematically and explained based on energy level diagrams and kinetics.
1. Introduction
Sunlight-driven photoelectrochemical water splitting is one of the promising methods for converting solar energy to chemical energy without emission of CO [1,2,3]. To achieve this goal with high efficiency, materials used in water splitting devices should be naturally abundant, have high absorbance for solar radiation, possess proper energy level positions and fast kinetics for oxygen evolution reaction or hydrogen evolution reaction, and must be stable under the harsh working conditions. Although Groups III–V semiconductors exhibit good photoelectrochemical energy conversion efficiency [4], transition-metal oxide, such as BiVO [5,6,7,8,9], CuO [10,11,12], FeO [13,14,15,16,17,18,19], and WO [20,21] have attracted great attention as the photoanode due to their good stability and Earth-abundance. Among them, hematite (-FeO) has the potential for achieving high energy conversion efficiency because of its suitable energy bandgap of ≈2.2 eV. Further improvement of the efficiency of hematite photoanode by nanostructuring and intrinsic doping [13,19] or extrinsic doping [15,16,17,18,19] has been actively pursued.
Although nanostructured hematite holds great promise in many aspects, its inadequate surface state energy level results in a low photovoltage and thus a high onset potential for water splitting. Therefore, many works have been done to deposit various materials such as IrO [22], AlO [23,24], Co-Pi [25], Co(OH)/CoO [26], GaO [24], InO [24], and NixFe1−xOy [27,28,29] on hematite as an electrocatalyst for better energetics or faster kinetics. Among them, NixFe1−xOy shows great promise because it can greatly reduce the onset potential. Du et al. [27] used photochemical metal-organic deposition (PMOD) to deposit a 200-nm thick NiFeO film on hematite, and the decorated hematite photoanodes showed a photovoltage of 0.61 V, an onset potential of 0.61 V (vs. reversible hydrogen electrode (RHE)), and a current density of 0.6 mA/cm at 1.4 V (vs. RHE). Morales-Guio et al. [28] used electrochemical and photoelectrochemical deposition to deposit a thin (<10 nm), optically transparent FeNiO overlayer on hematite, and the FeNiO/FeO samples showed an onset potential of 0.9 V (vs. RHE) and a current density of about 0.55 mA/cm at 1.4 V (vs. RHE). With nanostructured FeO, the onset potential remained the same, but the current density increased to 3 mA/cm at 1.4 V (vs. RHE). Jang et al. [29] utilized a regrowth method to produce a hematite layer without surface disorder followed by deposition of a NiFeO overlayer by PMOD to fabricate a photoanode with a photovoltage of 0.8 V and an onset potential of 0.45 V (vs. RHE), which enabled unbiased solar water splitting with efficiency of 0.91% when used in conjunction with a Pt-decorated Si photocathode. Although all of these works revealed the great potential of NixFe1−xOy as electrocatalyst, they used different Ni-to-Fe ratios in the precursor, and the degree of reduction in the onset potential varied significantly. Therefore, a systematic study of the dependence of the electrochemical and photoelectrochemical characteristics of the photoanode on the condition of the NixFe1−xOy electrocatalyst is needed.
In this work, we demonstrated a novel and facile chemical bath deposition method for depositing NixFe1−xOy electrocatalyst on hematite as photoanode for solar hydrogen production. By varying the Ni-to-Fe ratio of the precursor and immersion time, the composition and the average thickness of the NixFe1−xOy overlayer could be easily controlled to minimize the onset potential for water splitting. With a Ni percentage of >80% and an immersion time of 2 min, the optimal performance with a photovoltage of 0.70 V, an onset potential of 0.70 V (vs. RHE), and a current density of 0.6 mA/cm at 1.4 V (vs. RHE) under simulated AM (Air Mass) 1.5 G global solar irradiation was attained. The current density at 1.0 V vs. RHE was enhanced by 30-fold with the deposition of NixFe1−xOy overlayer. The dependence of the polarization curve and the open-circuit voltage on the composition and the average thickness of the NixFe1−xOy overlayer was investigated and explained based on the energetics and kinetics of the hematite layer and the NixFe1−xOy layer.
2. Results and Discussion
The open-circuit potentials (OCP) of NixFe1−xOy/hematite photoanodes for various Ni-to-Fe ratios of the precursor at the light-on and light-off conditions are shown in Figure 1a. Without light irradiation, the OCP increased when the hematite was coated with NixFe1−xOy. The increase in OCP became larger for higher Ni-to-Fe ratio and reached the maximum of 1.34 V at a Ni-to-Fe ratio of 8:2. Further increase of Ni-to-Fe ratio resulted in a slight reduction of the OCP. With light irradiation the OCP for each photoanode was lowered, and its value stayed roughly the same (between 0.6 V and 0.7 V vs. RHE) for all Ni-to-Fe ratios. The difference between the OCPs under light-on and light-off conditions is defined as the photovoltage (explained below). As shown, the photovoltage of bare hematite photoanode was only 0.20 V, and it was raised by the addition of the NixFe1−xOy electrocatalyst, reaching the maximum of 0.70 V at the Ni-to-Fe ratio of 8:2. The photovoltage represents the capability of the photoanode to perform photo-assisted water splitting, and thus the increase in photovoltage normally results in a corresponding reduction in the onset potential for water splitting. Figure 1b shows the current density-to-potential (J–V) curves of NixFe1−xOy/hematite photoanode for various Ni-to-Fe ratios at the light-on and light-off conditions, in comparison with that of bare hematite photoanode. The onset potential of bare hematite photoanode was about 1.08 V vs. RHE, and the deposition of NixFe1−xOy on hematite lowered the onset potential significantly. The onset potential decreased with increasing Ni-to-Fe ratio; from about 1.0 V for the Ni-to-Fe ratio of 0:10 sample to 0.6 V for the Ni-to-Fe ratio of 10:0 sample. The changing trend of the onset potential was roughly consistent with the changing trend of the photovoltage both qualitatively and quantitatively. For Ni-to-Fe ratio larger than 8:2, the onset potential continued dropping, but the current density began to decrease. For water splitting without light irradiation, the onset potentials were about 1.6 V (vs. RHE) and 1.4 V (vs. RHE) for the bare hematite photoanode and the NixFe1−xOy/hematite photoanode, respectively. These numbers are consistent with those obtained in the previous work using PMOD with the same precursors [30].
Figure 2a shows the OCP of NixFe1−xOy/hematite photoanode as a function of immersion time of NixFe1−xOy deposition at the light-on and light-off conditions. The Ni-to-Fe ratio of the precursor was fixed at 8:2. Without light irradiation, the OCP increased with increasing immersion time, reached the maximum of 1.32 V at 2 min, and saturated with further increase of immersion time. With light irradiation, the OCP stayed roughly constant with immersion time. As a result, the photovoltage became larger with longer immersion time, reached the maximum of 0.70 V at 2 min, and then became saturated. Figure 2b shows the J–V curves of NixFe1−xOy/hematite photoanodes grown with various immersion times at the light-on and light-off conditions. It was found that the variation of the photovoltage and the onset potential with varying immersion time did not show similar correspondence as that observed with varying Ni-to-Fe ratio. For an immersion time of 2 min or less, the onset potential dropped to around 0.76 V regardless of the immersion time. With further increase of immersion time, the onset potential increased and the current density decreased very slowly with increasing immersion time.
To investigate the dependencies of the thickness and the morphology of as-prepared NixFe1−xOy layer on the immersion time, top-view SEM images of the photoanodes grown with various immersion times were taken after photoelectrochemical test, as shown in Figure 3. Energy-dispersive spectroscopy (EDS) examination showed that the darker region corresponded to thicker NixFe1−xOy. The increase of the fraction of darker region shown in Figure 3a–d implies that, with an immersion time of less than 2 min, the hematite layer could be only partially covered by NixFe1−xOy, and the coverage increased with increasing immersion time. Full coverage was reached at around 2 min according to EDS examination, and then the average thickness continued increasing with increasing immersion time as shown in Figure 3e,f. This observation could be used to explain the difference between the dependencies of the photovoltage and the onset potential on the immersion time. With an immersion time of <2 min, the photoanode was a hematite layer partially covered by NixFe1−xOy. Thus, it could be considered as a parallel connection of a bare hematite photoanode and a NixFe1−xOy/hematite photoanode. In the measurement of J–V curve, because the NixFe1−xOy/hematite part had a lower onset potential, it determined the overall onset potential of the combination. In the measurement of OCP, since the measurement was done in an open-circuit condition, the two parts equilibrated to determine a common Fermi level for the whole photoanode. Therefore, the equilibrated Fermi level, and thus the OCP without light irradiation, should increase with increasing coverage by NixFe1−xOy. For an immersion time longer than 2 min, a complete coverage was obtained, and both the photovoltage and the onset potential were determined only by the energy levels of the NixFe1−xOy layer and the hematite layer. Therefore, there was no significant change of photovoltage and onset potential with increasing immersion time (increasing NixFe1−xOy layer thickness), but a gradual decrease of current density due to presumably increased charge transport resistance in a thicker NixFe1−xOy layer. It was also noted that there were traces of the precursor on as-prepared samples, revealed by an EDS peak of carbon, and it was quickly removed by the highly alkaline electrolyte during the photoelectrochemical test.
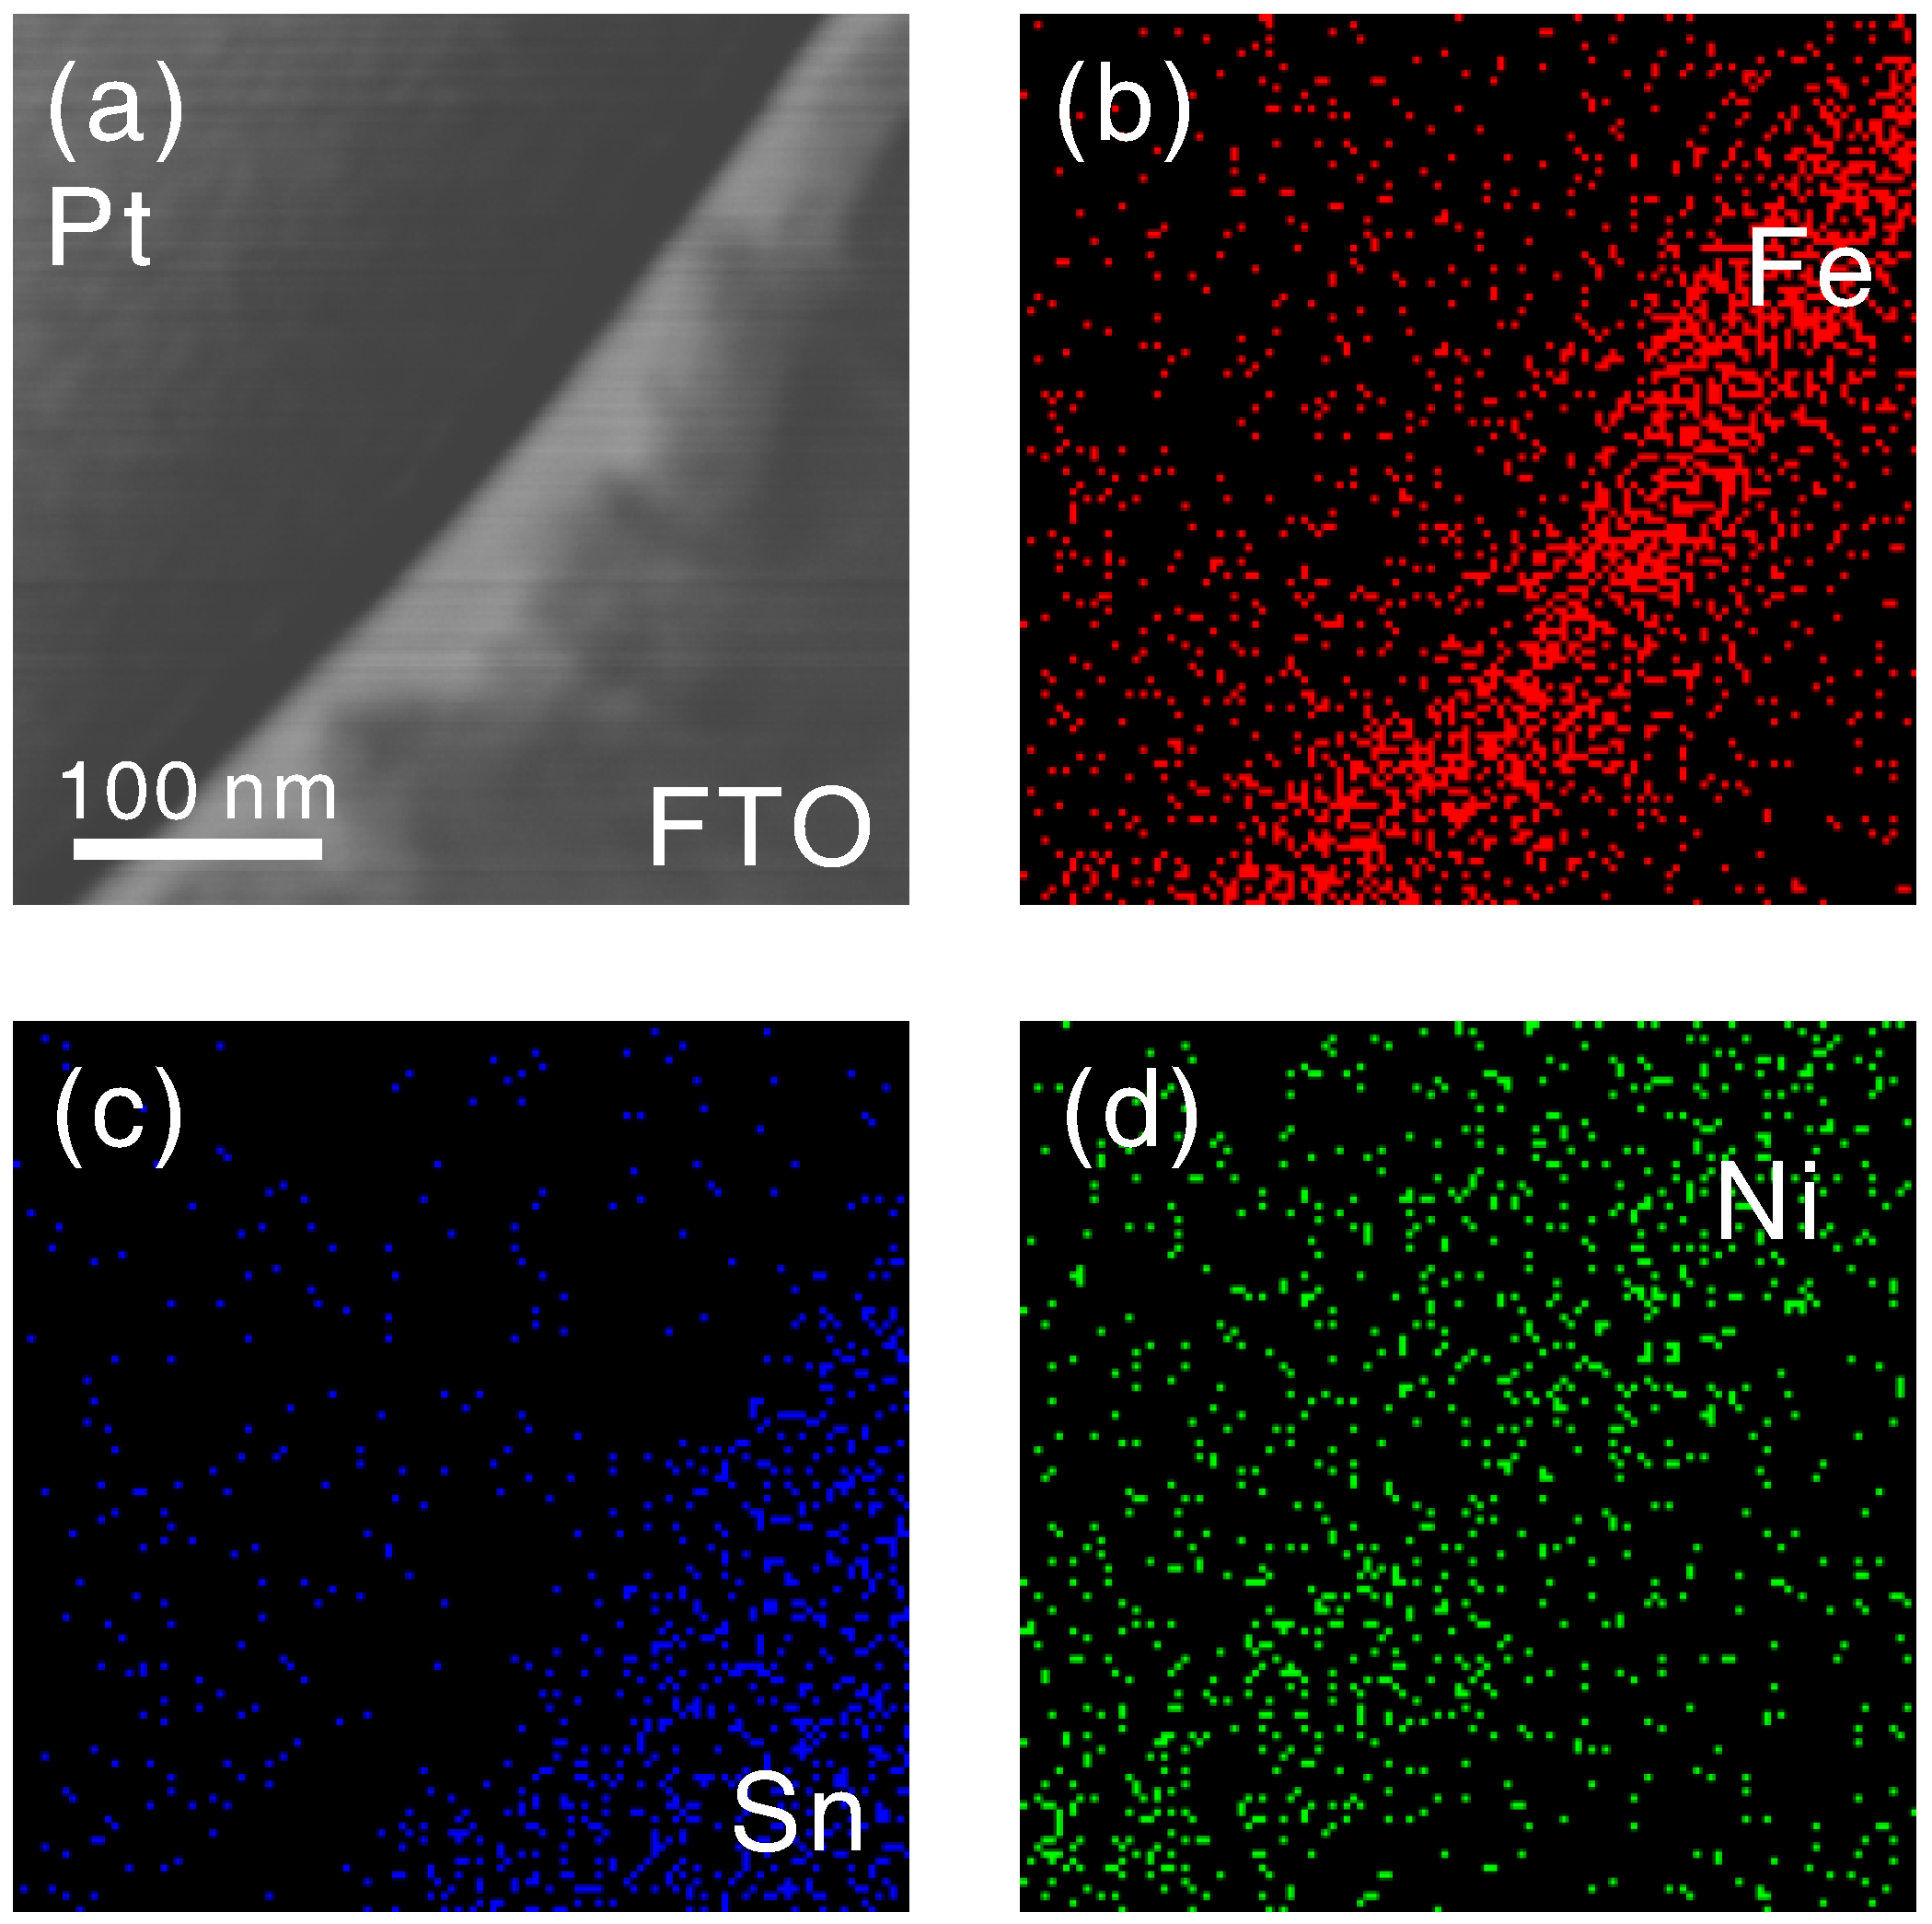
To measure the thicknesses of the hematite layer and the NixFe1−xOy layer, cross-sectional TEM images and cross-sectional EDS maps of Fe, Sn, and Ni were obtained. The results for NixFe1−xOy/hematite photoanode with a Ni-to-Fe ratio of 8:2 and an immersion time of 2 min are shown in Figure 4. The average thicknesses of the hematite layer and the NixFe1−xOy layer were both around 30 nm.
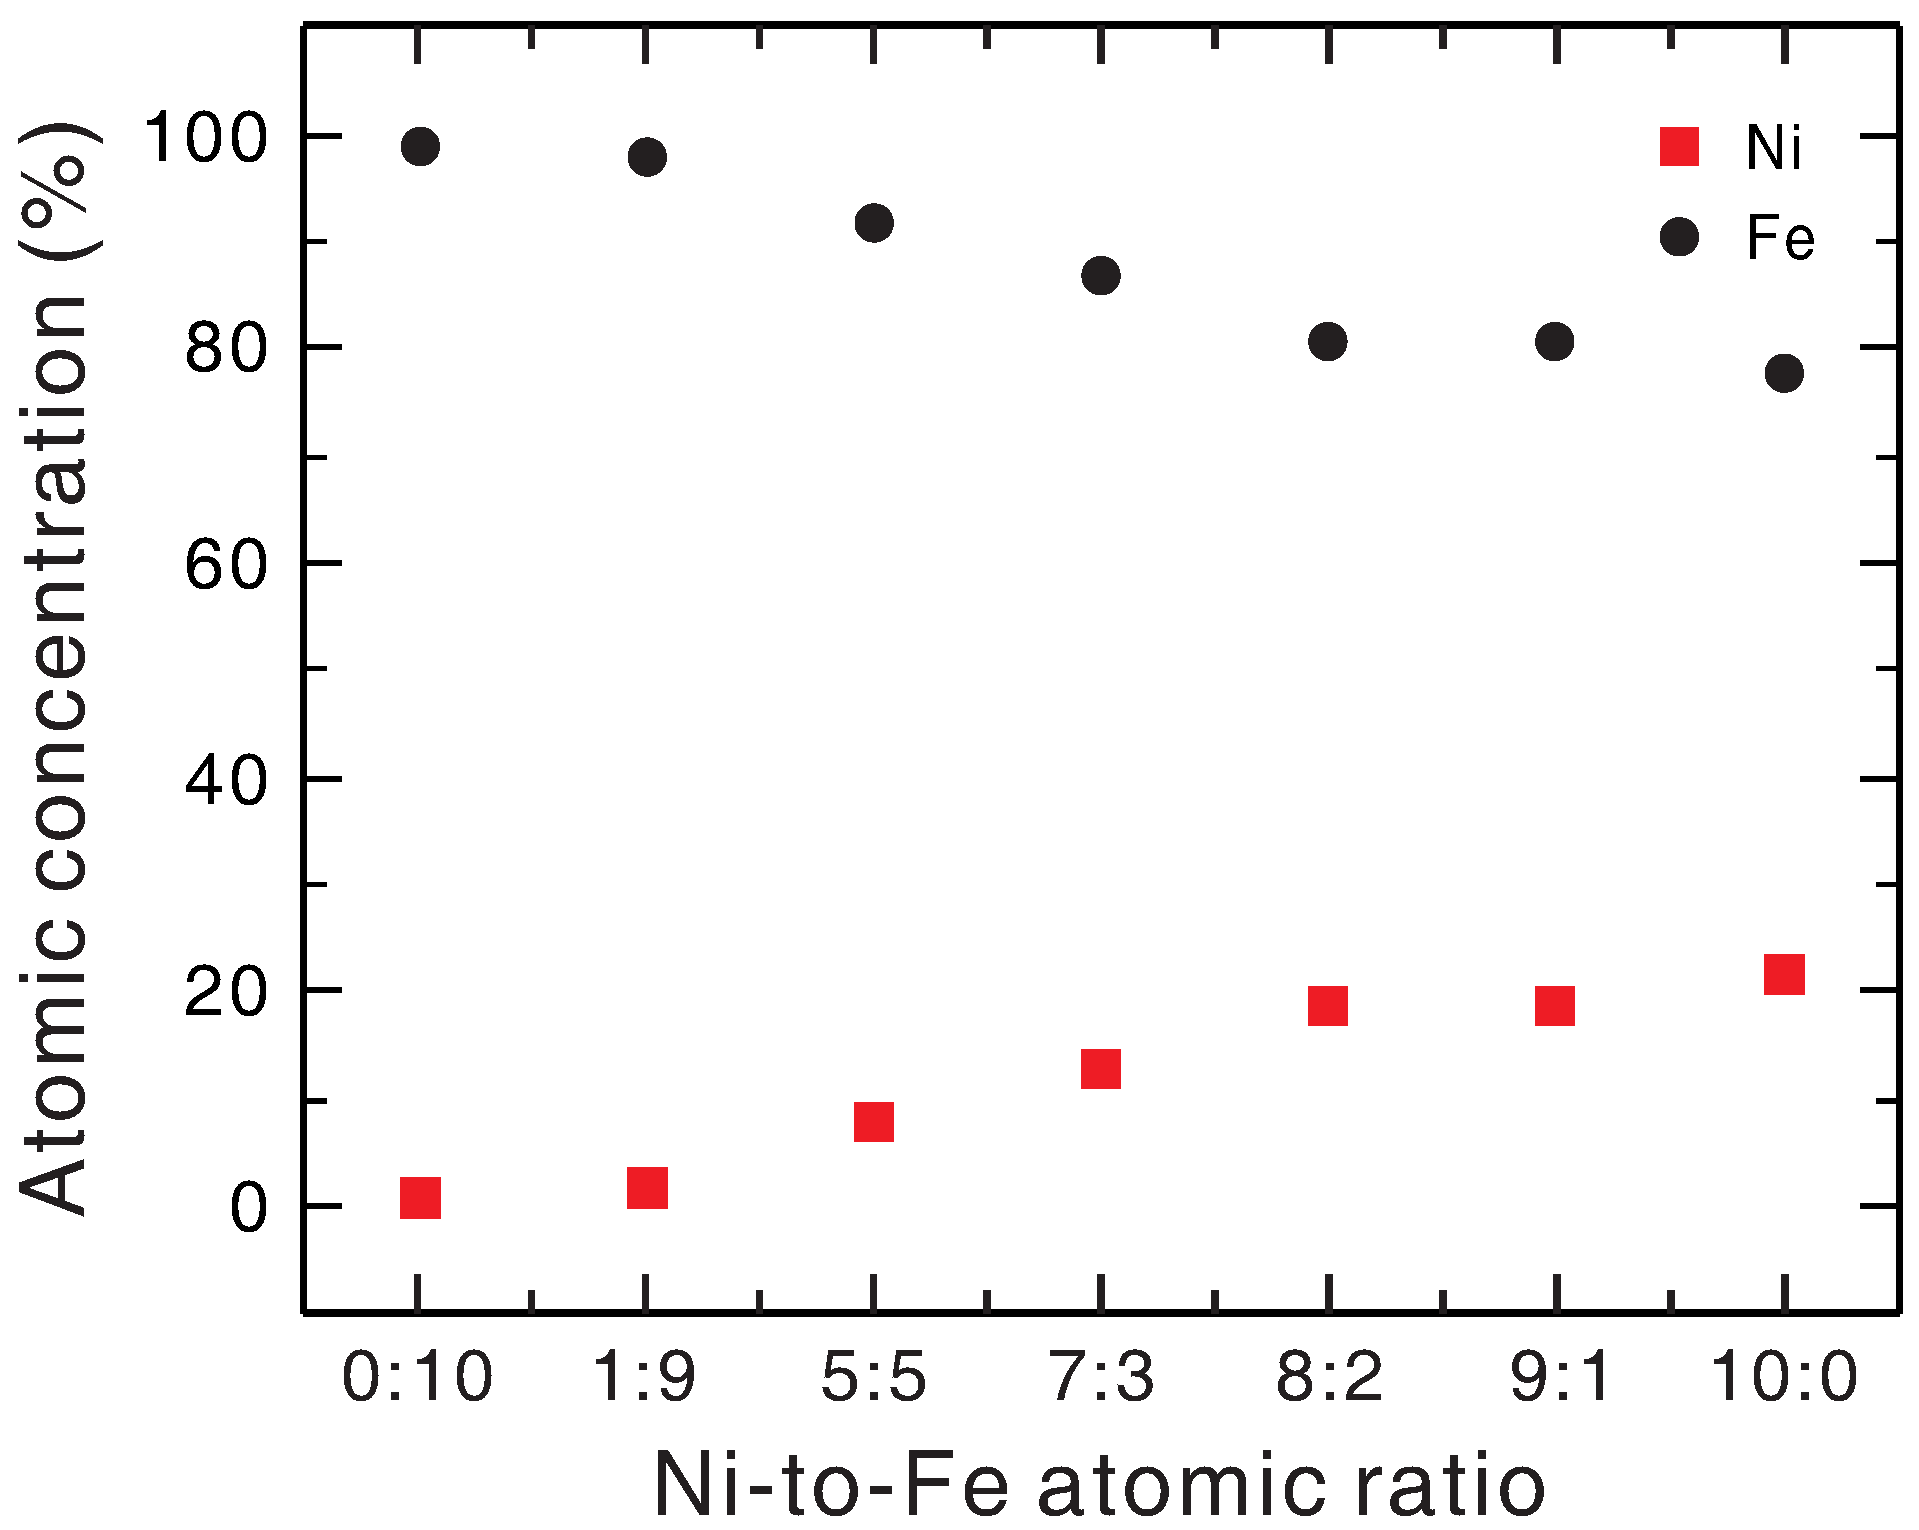
The Ni-to-Fe ratio in all of the data shown here refers to that in the precursor. To examine the actual composition of the as-prepared NixFe1−xOy layer, EDS was used to measure the Ni and Fe atomic concentrations of NixFe1−xOy/hematite photoanodes with various Ni-to-Fe ratios of the precursor after the photoelectrochemical test. The results are shown in Figure 5. As can be seen, the Ni percentage indeed increased with increasing Ni-to-Fe ratio in the precursor. Although the EDS data showed that the absolute values of concentration were not as expected for the NixFe1−xOy layer and the dependence was not in strictly linear proportion, these did not reflect the true content of the NixFe1−xOy layer. The lower Ni-to-Fe ratio readings, as compared to the actual ratios in the precursor, resulted from the fact that the EDS measurement also included the contribution from the underlying hematite layer, as revealed by that the Fe atomic concentration still took up 78% even when the as-prepared electrocatalyst did not contain Fe in its precursor.
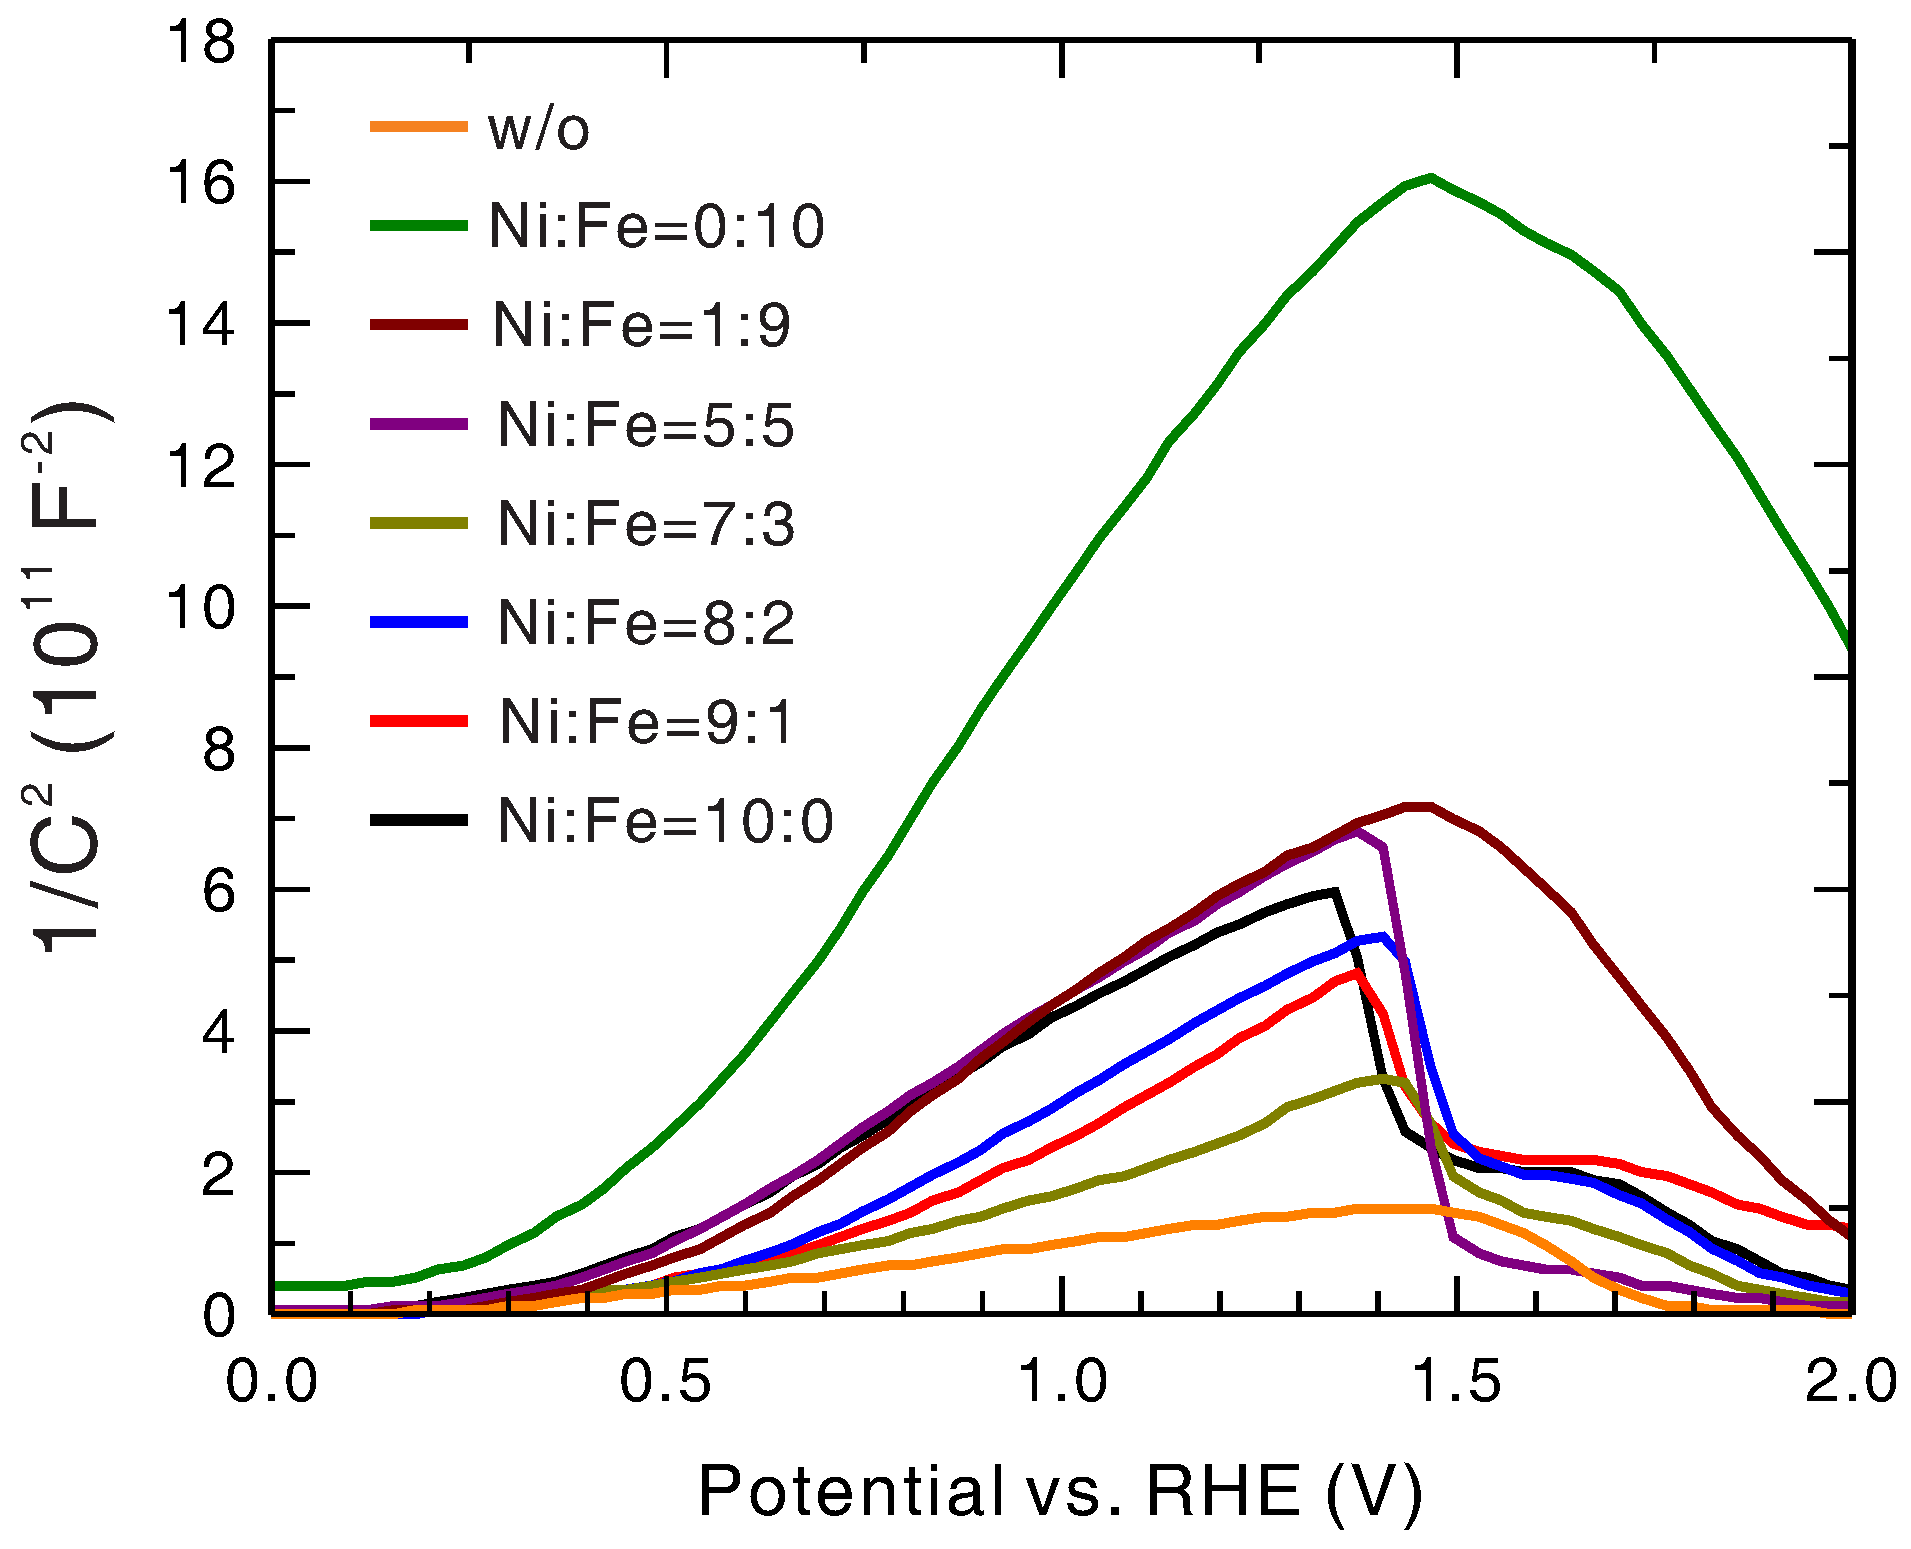
To measure the type and density of the intrinsic doping (nonstoichiometric doping) and the flat-band potential of the hematite layer, Mott–Schottky analysis [15,16] were conducted for the bare hematite photoanode and the NixFe1−xOy/hematite photoanodes with various Ni-to-Fe ratios of the precursor. The results are shown in Figure 6 and Table 1. The positive slopes of the curves in the low-potential region indicate that these photoanodes were all n-type semiconductors as expected for the general tendency of nonstoichiometric doping of hematite, justifying their use as the anode. The flat-band potential was roughly constant regardless of the presence and compositional variation of the NixFe1−xOy layer. This could be ascribed to the fact that, since the flat-band potential was determined by the original Fermi level of the hematite layer, it should not be affected by the NixFe1−xOy layer. This was also supported by the fact that the values of the flat-band potentials were close to the OCPs with light irradiation. The doping densities of hematite in these photoanodes were all on the order of 10 cm, signifying a high doping level that was beneficial for photoanode performance (better charge separation and higher electron conductivity). The variation could be attributed to from-sample-to-sample fluctuation in the pulsed-laser deposition (PLD) process of the hematite layer. This is based on the observations that the doping density of several bare hematite photoanodes made in the same production batch displayed a variation of more than a factor of 2 (data not shown) and that the doping density of the NixFe1−xOy-coated hematite did not show a systematic trend with an increasing Ni-to-Fe ratio. It was found that the presence of an NixFe1−xOy layer with a Ni-to-Fe ratio of >5:5 led to a steep drop in the Mott–Schottky curve at 1.35–1.45 V vs. RHE. This could be ascribed to the onset of charge transfer at the photoanode/electrolyte interface because the numbers matched the onset potentials for water splitting without light irradiation, as shown in Figure 1b. For the bare hematite photoanode and the NixFe1−xOy/hematite photoanodes with low Ni fraction, the linearly rising region of the Mott–Schottky curve terminated at some potential before reaching the onset potential. This could be ascribed to the complete depletion of the hematite layer. The width of the depletion layer calculated for the termination point was about 30 nm, consistent with the thickness of the hematite layer measured with TEM.
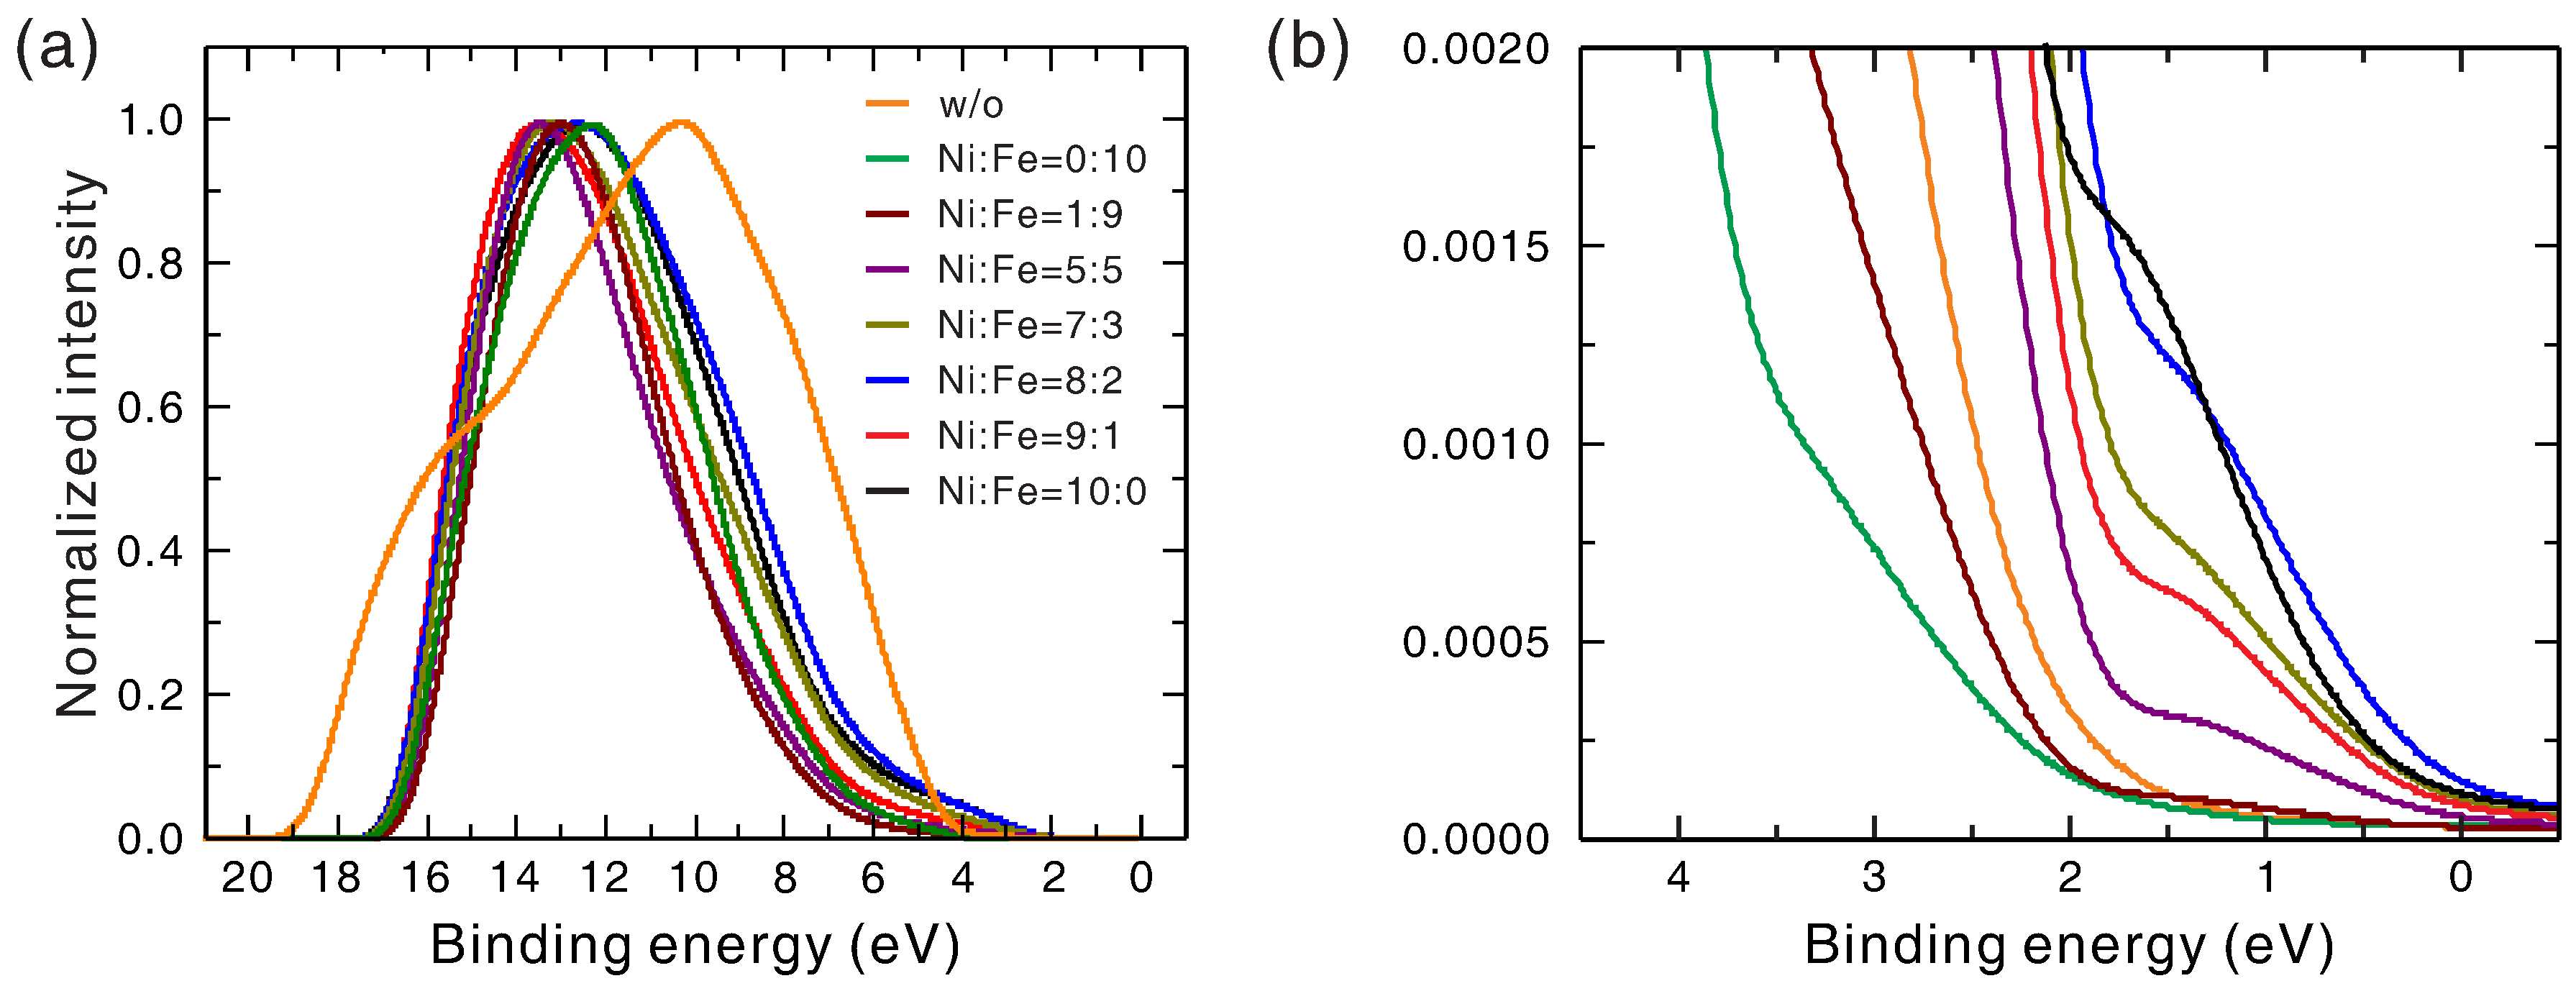
In order to build an energy level diagram that could be used to explain the dependence of the OCP and the onset potential on the Ni-to-Fe ratio, ultraviolet photoelectron spectroscopy (UPS) was used to measure the positions of the Fermi level and the valence band maximum (VBM) of the bare hematite and the NixFe1−xOy covered on hematite. The UPS spectra are shown in Figure 7, and the energies of Fermi level and VBM for each sample are shown in Table 2. From Figure 7, all NixFe1−xOy covered samples displayed a shift in the high binding-energy cutoff and an extension in the low binding-energy cutoff. The large low bind-energy cutoff of bare hematite indicated a large separation between its Fermi level and VBM (as large as its bandgap), revealing its n-type nature. The small low binding-energy cutoffs of the NixFe1−xOy electrocatalysts indicated a small separation between their Fermi level and VBM, showing that the electrocatalysts grown with this method were all of p-type intrinsic doping with similar doping density regardless of their Ni-to-Fe ratios. Furthermore, it seems that the Fermi level and the VBM of the NixFe1−xOy electrocatalyst down-shifted more with increasing Ni fraction, although an accurate determination of their values for quantitative comparison with OCPs are difficult due to the uncertainty in the definition of the cutoffs in UPS spectra. The VBM of the hematite layer was about −6.5 eV, and thus its conduction band minimum was about −4.3 eV based on the bandgap energy of 2.2 eV. Both numbers are consistent with those reported previously [1], considering the measurement uncertainly of a few tenth eV. The VBM of the NiO was about −5.2 eV, which is consistent with that reported previously (−5.4 eV) [31]. These matches justify the definitions of the high cutoff and the low cutoff used in our UPS data analysis. The different VBM energy and intrinsic doping type of the hematite layer and the FeO electrocatalyst layer indicated that the latter was likely of FeO or FeO nature, distinct from that of the hematite layer (FeO).
To study the kinetics, the J–V curves of the NiFeO/hematite photoanode and the bare hematite photoanode with and without the presence of 0.1 M NaSO as the hole scavenger (sacrificial reagent) in the electrolyte were measured [32], as shown in Figure 8. The water photo-oxidation current can be expressed as , where is the water oxidation photocurrent density, is the photocurrent density determined by the photon absorption that will be used to generate photocurrent, is the charge separation efficiency, and is the interfacial charge transfer efficiency for water oxidation [32]. Using , where is the current density measured with the presence of the hole scavenger (thus = 100%) [32], the charge transfer efficiencies at the surfaces of the NiFeO/hematite photoanode and the bare hematite photoanode were obtained as 76% and 31%, respectively, based on the current densities at 1.23 V vs. RHE (following Ref. [32]). In addition, by comparing the current density of the NiFeO/hematite photoanode with that of the bare hematite photoanode, both measured with the presence of the hole scavenger, it was found that the charge separation efficiency of the NiFeO/hematite photoanode was 1.75 times that of the bare hematite photoanode, assuming the two samples had the same . That is, the deposition of the NiFeO electrocatalyst on hematite enhanced both the charge transfer efficiency and the charge separation efficiency of the photoanode.
To characterize the stability of the NixFe1−xOy/hematite photoanode, the J–V curve of the NiFeO/hematite photoanode after 72 h continuous light-on operation at 1.23 V vs. RHE was measured, as shown in Figure 8. The current density at 1.23 V vs. RHE dropped to about 80% of its initial value after 72 h operation, while the onset potential remained roughly the same. To investigate the reason for this drop in current density, the NiFeO/hematite photoanode were characterized using SEM and EDS before and after 72 h operation. It was found that both the morphology and the elemental composition did not exhibit any significant changes after 72 h operation. On the other hand, it was noted that the epoxy used to seal the uncoated fluorine-doped tin oxide (FTO) regions and the contact lead displayed a change in its color (turning yellow) after 72 h operation. This observation and that there were no significant changes in morphology and elemental composition indicate that the drop in current density could be caused by contamination of the electrolyte by the degraded epoxy, not by degradation of the NiFeO/hematite itself.
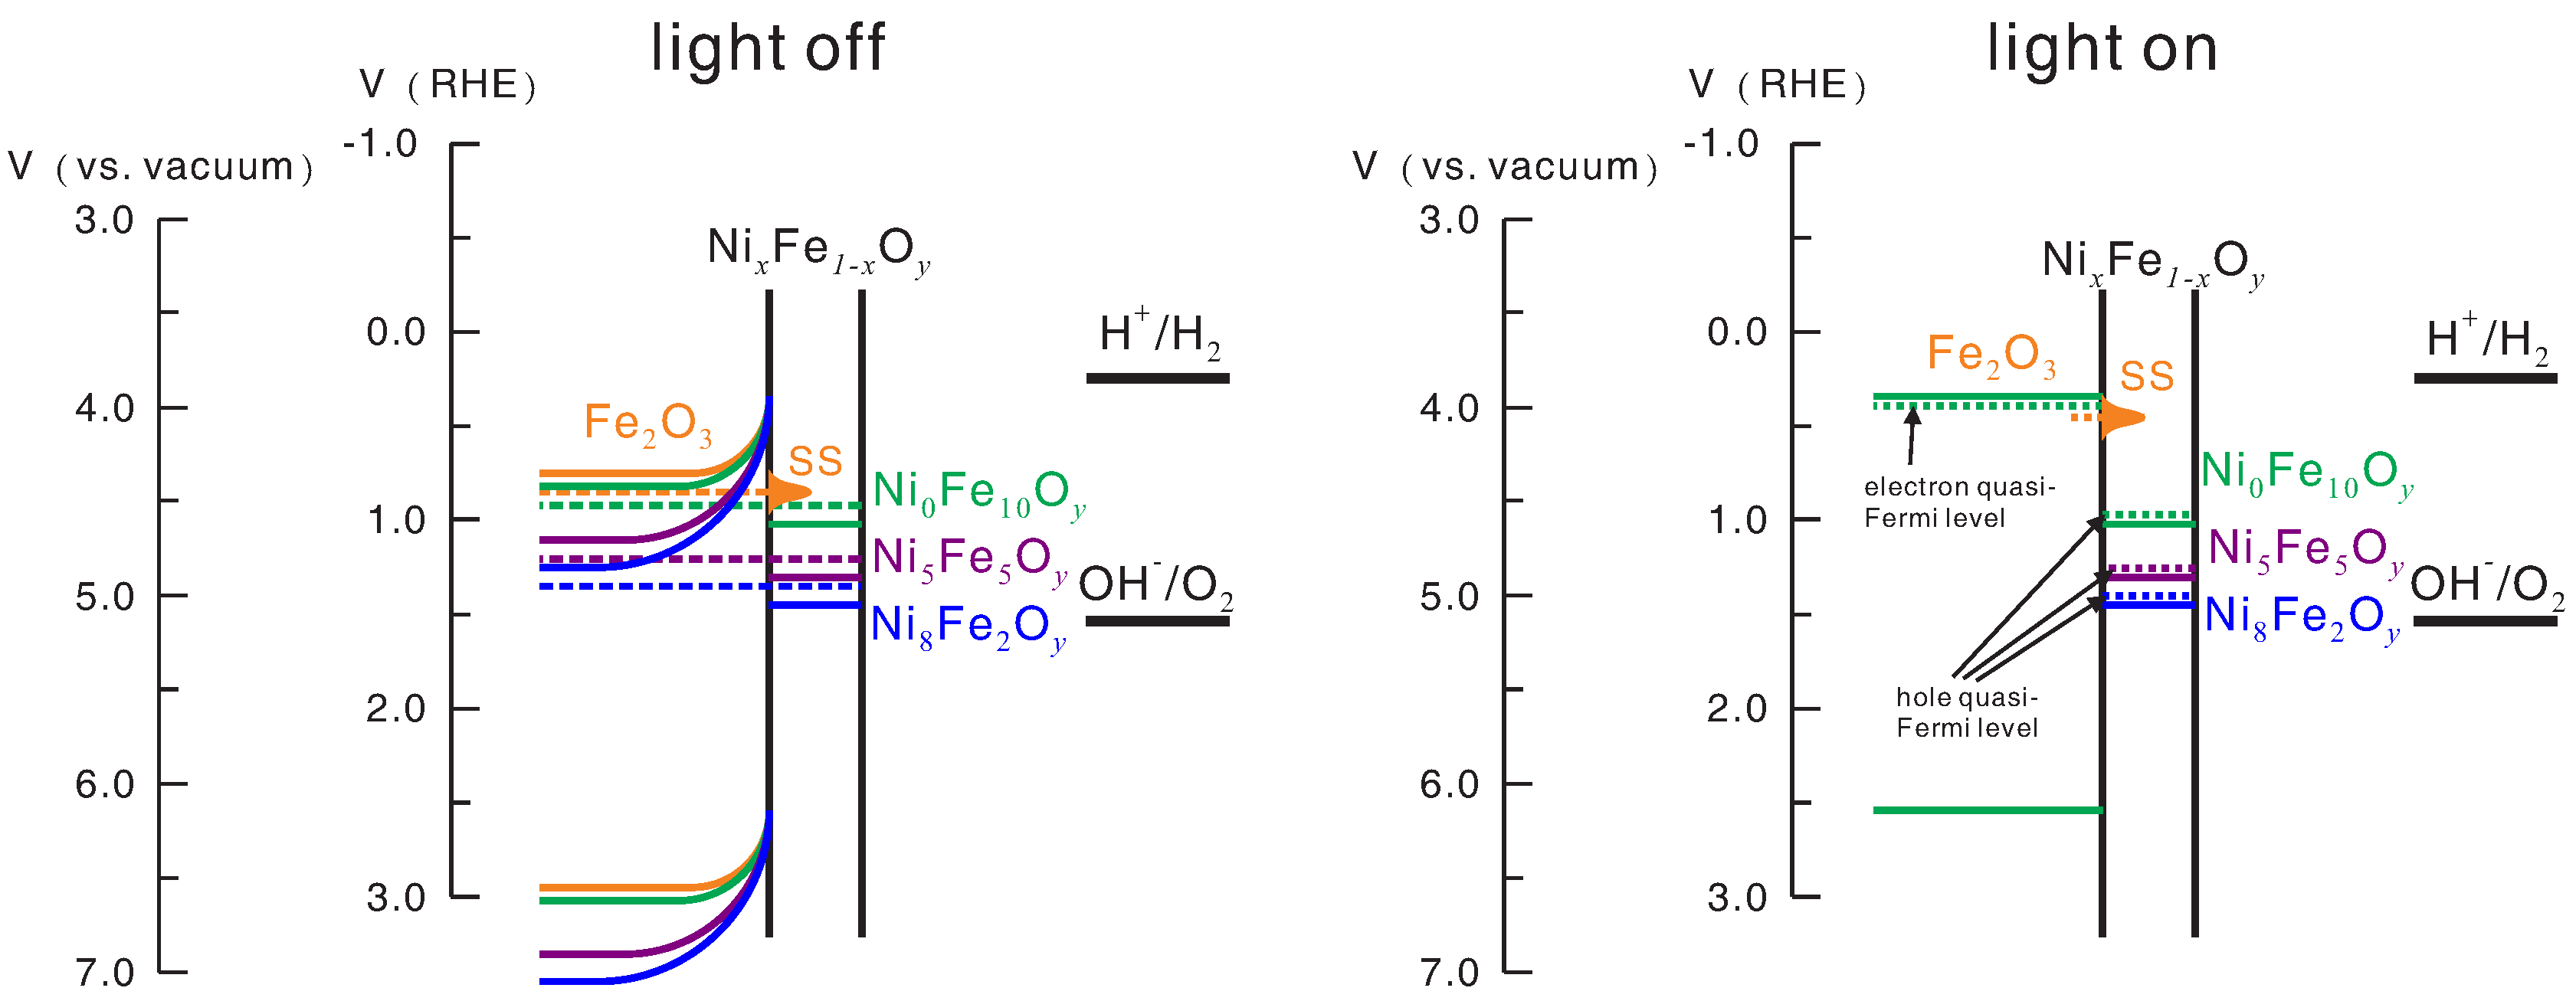
Figure 9 shows the energy level diagrams of the bare hematite photoanode and the NixFe1−xOy/hematite photoanodes, based on the results of UPS measurement, under the open-circuit condition with and without light irradiation. Under open-circuit condition and without light irradiation, the Fermi level of the hematite layer is shifted to match the Fermi level of the NixFe1−xOy layer, so the OCP is determined by the Fermi level of the NixFe1−xOy layer. This explains the increase in OCP with increasing Ni-to-Fe ratio under the condition of no light irradiation. For water splitting, the potential of the photoanode needs to be raised to down-shift the Fermi level to the position which permits transfer of holes from the electrocatalyst to the water oxidation energy level, so the onset potential for water splitting is lower for lower electrocatalyst Fermi level associated with higher Ni-to-Fe ratio. With light irradiation the electron quasi-Fermi level shifts to near the conduction band minimum of the hematite layer, so the OCPs for all cases are roughly the same. Likewise, with light irradiation, the hole quasi-Fermi level shifts to near the valence band maximum of the NixFe1−xOy layer, so the onset potential for hole transfer exhibits a dependence on the Ni-to-Fe ratio similar to that of OCP. Therefore, the difference between electron quasi-Fermi level and hole quasi-Fermi level, referred to as photovoltage, can be approximately obtained from the difference between the OCP without light irradiation (close to hole quasi-Fermi level) and the OCP with light irradiation (electron quasi-Fermi level). Note that, although for simplicity it is assumed in Figure 9 that the p-type doping densities of the electrocatalysts are much higher than the n-type doping density of the hematite so that no obvious shift of Fermi level and band bending takes place upon thermal equilibration of the two sides, all the trends described above still hold when this assumption is abrogated, except for slight changes in the values. The low photovoltage (and thus high onset potential) of the bare hematite was believed to be due to the presence of surface states [27], which affect the result in a reason similar to the presence of the electrocatalyst.
Table 3 shows the photovoltages extracted from J–V curves compared with that extracted from OCPs. It can be seen that, for the photoanodes with a Ni-to-Fe ratio higher than 8:2, the photovoltages extracted from these two methods are about the same. However, for the bare hematite and the photoanodes with lower Ni-to-Fe ratios, the photovoltage extracted from OCP is smaller than that extracted from the J–V curve. Such discrepancy may be ascribed to two reasons. Firstly, OCP is actually a measure of the thermodynamic potential of electrocatalyst or surface state, whereas the onset potential in the J–V curve is determined by not only the thermodynamic potential but also the overpotential required by charge-transfer kinetics, which also varies with different electrocatalysts [33]. Secondly, the photovoltage extracted from OCP for bare hematite in our case (0.20 V) is close to that reported by Jang et al. [29] (0.24 V) but significantly different from that reported by Morales-Guio et al. [28] (0.57 V, which is consistent with the photovoltage extracted from the J–V curve in their case). This indicates that, in our case and Jang’s case, two different kinds of surface states could be involved in determining the outcomes of these two different measurements. The variation among the results of different groups could be caused by the difference in the deposition methods. Morales-Guio et al. [28] used electrochemical impedance spectroscopy to measure charge-transfer resistance at the photoanode/electrolyte interface and found that the charge–transfer resistance at 0.8 V vs. RHE was lowered by two orders of magnitude upon FeNiO electrocatalyst deposition. This indicates that, in their case, the reduction in onset potential was due to faster water oxidation kinetics. Further investigation is necessary to clarify the relative contributions from these two factors and the discrepancy between the photovoltages extracted with the two different methods.
The chemical bath deposition (immersion) with metal-organic complex as the precursor used in this work provides a simple method for depositing NixFe1−xOy onto hematite as an effective photoanode for solar water splitting. The reason why this process can occur spontaneously at room temperature could be attributed to the similarity in the chemical properties of NixFe1−xOy to that of hematite (FeO). This is supported by the observation that deposition of NixFe1−xOy could not take place on a bare FTO substrate and the dish. Although the deposition is not conformal (forming a thin layer covering all the surfaces with uniform thickness) on a nanometer scale, the improvement in onset potential and the current density attained are comparable to all of the previous reports on NixFe1−xOy/hematite grown by much more complicated methods. It is believed that the current density could be raised dramatically by increasing the porosity and the thickness of the hematite layer and depositing thin electrocatalyst conformally in the pores to increase both the absorbance and the electrochemical surface area of the photoanode [28]. In our experiment, the increase in porosity could be accomplished by increasing the total gas pressure and/or tilting the substrate in pulsed laser deposition. The thickness could be increased by using higher laser pulse energy and more suitable on-target laser spot size. The conformal deposition of thin electrocatalyst overlayer might be achieved by reducing the precursor concentration to inhibit spontaneous deposition and using a 532 nm continuous-wave laser beam to heat the nanoporous hematite layer transiently to drive and control the deposition of NixFe1−xOy. The experiments for realizing these strategies are undergoing.
3. Materials and Methods
3.1. Pulsed Laser Deposition
The hematite photoabsorptive layer was grown on fluorine-doped tin oxide (FTO ) substrate with predeposited thin SnO layer. The SnO layer played the role of adhesive and electron transporter [17]. Both the SnO layer and the hematite layer were deposited by using pulsed laser deposition (PLD). They were deposited sequentially in the same setup. The PLD target for depositing SnO was a SnO pill made from SnO powder (Alfa Aesar, Ward Hill, MA, USA) through mechanical pressing at a pressure of 4 ton/cm and then sintering in an oven at 1200 °C for 72 h [34]. An Fe pill (99.9%, Ultimate Materials Technology, Chupei, Taiwan) as purchased was used as the PLD target for depositing the hematite layer. The two targets were mounted on a Ferris wheel-like holder, and the target being ablated could be switched under vacuum via a computer-controlled motor. The FTO substrates (7 /sq) were mounted on a heater installed on a translational stage which allowed changing the target-to-substrate distance under vacuum. An Nd:YAG laser beam of 355-nm wavelength, 8-ns pulse duration, p-polarization, and 10-Hz repetition rate (Spectra-Physics PRO-350, Santa Clara, CA, USA) was focused on the target with an incidence angle of 45°. The peak laser fluence were set at 3 J/cm, and the on-target laser spot size was 707 m × 500 m in full width at half maximum (FWHM). The deposition time, target-to-substrate distance, and ambient gas for depositing SnO were 2 min, 10 cm and 30 mtorr O, respectively. Those for depositing hematite were 2 h, 5 cm, and 30 mtorr O plus 120 mtorr N, respectively. The use of a mixture of O and N allowed independent optimizations of intrinsic n-type doping density through tuning O partial pressure (control average oxidation state) and nanoporosity through tuning the total gas pressure (control nucleation and growth and aggregation of nanoparticles). The substrate temperature was set at 600 °C during deposition and then cooled down to room temperature in 15 min.
3.2. Chemical Bath Deposition
Deposition of NiFeO electrocatalyst layer on the hematite electrode was done by using a facile chemical bath deposition method. Iron(III) 2-ethylhexanoate (50%w/w, Alfa Aesar) and nickel(II) 2-ethylhexanoate (78%w/w, Sigma Aldrich, St. Louis, MO, USA) were mixed in various Ni-to-Fe atomic ratio in hexane (J. T. Baker) to obtain a solution of 15% w/w metal complex concentration in total, and the solution was then diluted with hexane to one-tenth of the original concentration. The hematite electrode was then immersed in the precursor solution in a dish at room temperature, and the process of NiFeO deposition commenced spontaneously. The deposition process continued with time, so the effective thickness of the NiFeO layer could be controlled by the total immersion time. After the electrode was retrieved from the solution and air-dried for a short period of time, it was ready for application and characterization without the need of post-treatment. The composition of the precursor solution used here was the same as that used previously to deposit NiFeO by way of PMOD [27,29,30]. However, in the process of PMOD, the precursor solution was first casted on the hematite electrode, dried, photodecomposed with UV light, and then heat-treated. In contrast, the method demonstrated here required just one single step.
3.3. Electrochemical and Photoelectrochemical Measurements
The electrochemical and photoelectrochemical characteristics of the NiFeO/hematite photoanode, including current density-to-voltage relation (J–V curve), open-circuit potential (OCP), and Mott–Schottky curve (small-signal capacitance-to-voltage relation), were measured with a three-electrode setup using Ag/AgCl (saturated KCl) as the reference electrode and Pt plate as the counter electrode in 1.0 M KOH solution (pH = 13.6). A potentiostat (Eco Chemie Autolab PGSTAT302, Herisau, Switzerland) equipped with a frequency response analyser (FRA32M) was used for electrical measurement, and a solar simulator (Newport 91160-1000, Irvine, CA, USA) was used as the light source to provide AM 1.5 G irradiation (100 mW/cm). The modulation frequency used for Mott–Schottky measurement was 10 kHz. The conversion of the potential values from that vs. Ag/AgCl to that vs. reversible hydrogen electrode (RHE) was done by using the relation: = + 0.1976 + 0.059 × pH [35]. The doping density () and the flat-band potential ()were calculated by fitting the linear region of the Mott–Schottky curve with Mott–Schottky equation [33]:
where e, A, k, and are unit charge, area of photoanode, Boltzmann constant, electric permittivity of vacuum, and relative permittivity of hematite (ca. 80 according to Ref. [16]), respectively. The width of the depletion region (W) was calculated by using Equation [1]:
The measurements of OCP were done following the protocol stated in Ref. [33]. When using a multimeter, the +V lead was connected to the photoanode and the common lead to the Ag/AgCl reference electrode. When using a potentiostat, the working electrode (WE) lead was connected to the photoanode and the reference electrode (RE) and counter electrode (CE) leads to the Ag/AgCl reference electrode. The two methods gave the same results for all samples.
3.4. Structural Characterizations
The morphology of the prepared films were characterized with scanning electron microscopy (SEM) (Phenom-World Phenom ProX, Eindhoven, The Netherlands), field-emission scanning electron microscopy (FE-SEM) (FEI Nova NanoSEM 230, Hillsboro, OR, USA), and transmission electron microscopy (TEM) (JEOL JEM-2100F, Tokyo, Japan). The Ni-to-Fe ratios of the films and the in-plane spatial distributions of the elements were measured with X-ray energy-dispersive spectroscopy (EDS) (Phenom-World Phenom ProX). The cross-sectional spatial distributions of the elements were obtained by EDS mapping (JEOL JEM-2100F, Tokyo, Japan). The positions of the Fermi level and the valence band maximum of the bare hematite and the NiFeO electrocatalysts on hematite were measured with ultraviolet photoelectron spectroscopy (UPS) using He I line (21.22 eV photon energy) (Thermo VG-Scientific Sigma Probe, Waltham, MA, USA).
4. Conclusions
It is shown in this work that deposition of NiFeO electrocatalyst on hematite in order to produce a low-onset-potential photoanode for solar hydrogen production can be attained easily by a simple room-temperature chemical bath deposition method. The process occurs spontaneously and selectively on hematite. The Ni-to-Fe ratio and the thickness of the NiFeO layer can be easily varied by changing the Ni-to-Fe ratio of the precursor and the immersion time. The photovoltage and thus the onset potential of water splitting are found to increase with increasing Ni-to-Fe ratio and saturate at a Ni-to-Fe ratio of 8:2. This can be ascribed to the findings of UPS that all the as-prepared NiFeO electrocatalyst are of p-type intrinsic doping with similar doping density regardless of the Ni-to-Fe ratio, and the Fermi level and the VBM down-shift more with increasing Ni fraction. Under the optimal condition, a photovoltage as large as 0.70 V and an onset potential as low as 0.64 V (vs. RHE) could be achieved. A current density of 0.6 mA/cm at 1.4 V (vs. RHE) was obtained under simulated AM 1.5 G solar irradiation even with a hematite layer thickness of merely 30 nm. It could be expected that the current density can be increased greatly by increasing the thickness and the porosity of the hematite layer and depositing the electrocatalyst conformally as a thin coat. Strategies for implementing these are proposed.
Acknowledgments
The financial support from the Ministry of Science and Technology of Taiwan under contracts MOST 106-2112-M-001-032, MOST 104-2112-M-001-003, and MOST 106-2923-E-008-003-MY3 are greatly appreciated.
Author Contributions
Szu-yuan Chen and Chung-Jen Tseng led the project together and contributed to this work equally. They conceived and designed the experiments. Chih-Ping Yen and Yan-Jin Li performed the experiments. JyhpyngWang contributed to the theoretical modeling.
Conflicts of Interest
The authors declare no conflict of interest.
References
- Van de Krol, R.; Grätzel, M. (Eds.) Photoelectrochemical Hydrogen Production; Springer: New York, NY, USA, 2012. [Google Scholar]
- Gupta, R.B. (Ed.) Hydrogen Fuel: Production, Transport, and Storage; CRC Press: Boca Raton, FL, USA, 2015. [Google Scholar]
- Sasaki, K.; Li, H.W.; Hayashi, A.; Yamabe, J.; Ogura, T.; Lyth, S.M. (Eds.) Hydrogen Energy Engineering: A Japanese Perspective; Springer: Tokyo, Japan, 2016. [Google Scholar]
- Young, J.L.; Steiner, M.A.; Döscher, H.; France, R.M.; Turner, J.A.; Deutsch, T.G. Direct solar-to-hydrogen conversion via inverted metamorphic multi-junction semiconductor architectures. Nat. Energy 2017, 2, 17028. [Google Scholar] [CrossRef]
- Abdi, F.F.; Han, L.; Smets, A.H.; Zeman, M.; Dam, B.; van de Krol, R. Efficient solar water splitting by enhanced charge separation in a bismuth vanadate-silicon tandem photoelectrode. Nat. Commun. 2013, 4, 2195. [Google Scholar] [CrossRef] [PubMed]
- Kim, T.W.; Choi, K.S. Nanoporous BiVO4 photoanodes with dual-layer oxygen evolution catalysts for solar water splitting. Science 2014, 343, 990–994. [Google Scholar] [CrossRef] [PubMed]
- Pihosh, Y.; Turkevych, I.; Mawatari, K.; Uemura, J.; Kazoe, Y.; Kosar, S.; Makita, K.; Sugaya, T.; Matsui, T.; Fujita, D.; et al. Photocatalytic generation of hydrogen by core-shell WO3/BiVO4 nanorods with ultimate water splitting efficiency. Sci. Rep. 2015, 5, 11141. [Google Scholar] [CrossRef] [PubMed]
- Qiu, Y.; Liu, W.; Chen, W.; Chen, W.; Zhou, G.; Hsu, P.C.; Zhang, R.; Liang, Z.; Fan, S.; Zhang, Y.; et al. Efficient solar-driven water splitting by nanocone BiVO4-perovskite tandem cells. Sci. Adv. 2016, 2, e1501764. [Google Scholar] [CrossRef] [PubMed]
- Tolod, K.R.; Hernández, S.; Russo, N. Recent advances in the BiVO4 photocatalyst for sun-driven water oxidation: Top-performing photoanodes and scale-up challenges. Catalysts 2017, 7, 13. [Google Scholar] [CrossRef]
- Yang, Y.; Hana, J.; Ninga, X.; Tanga, H. Effect of potential on the conductivity of electrodeposited Cu2O film. Proc. SPIE 2015, 9560, 95600W-6. [Google Scholar]
- Luo, J.; Steier, L.; Son, M.K.; Schreier, M.; Mayer, M.T.; Grätzel, M. Cu2O nanowire photocathodes for efficient and durable solar water splitting. Nano Lett. 2016, 16, 1848–1857. [Google Scholar] [CrossRef] [PubMed]
- Qi, H.; Wolfe, J.; Fichou, D.; Chen, Z. Cu2O photocathode for low bias photoelectrochemical water splitting enabled by NiFe-layered double hydroxide co-catalyst. Sci. Rep. 2016, 6, 30882. [Google Scholar] [CrossRef] [PubMed]
- Cao, J.; Kako, T.; Kikugawa, N.; Ye, J. Photoanodic properties of pulsed-laser-deposited α-Fe2O3 electrode. J. Phys. D Appl. Phys. 2010, 43, 325101. [Google Scholar] [CrossRef]
- Chang, C.Y.; Wang, C.H.; Tseng, C.J.; Cheng, K.W.; Hourng, L.W.; Tsai, B.T. Self-oriented iron oxide nanorod array thin film for photoelectrochemical hydrogen production. Int. J. Hydrogen Energy 2012, 37, 13616–13622. [Google Scholar] [CrossRef]
- Hsu, Y.P.; Lee, S.W.; Chang, J.K.; Tseng, C.J.; Lee, K.R.; Wang, C.H. Effects of platinum doping on the photoelectrochemical properties of Fe2O3 electrodes. Int. J. Electrochem. Sci. 2013, 8, 11615–11623. [Google Scholar]
- Rahman, G.; Joo, O.S. Electrodeposited nanostructured α-Fe2O3 thin films for solar water splitting: Influence of Pt doping on photoelectrochemical performance. Mater. Chem. Phys. 2013, 140, 316. [Google Scholar] [CrossRef]
- Lee, M.H.; Park, J.H.; Han, H.S.; Song, H.J.; Cho, I.S.; Noh, J.H.; Hong, K.S. Nanostructured Ti-doped hematite (α-Fe2O3) photoanodes for efficient photoelectrochemical water oxidation. Int. J. Hydrogen Energy 2014, 39, 17501. [Google Scholar] [CrossRef]
- Fu, Z.; Jiang, T.; Zhang, L.; Liu, B.; Wang, D.; Wang, L.; Xie, T. Surface treatment with Al3+ on a Ti-doped a-Fe2O3 nanorod array photoanode for efficient photoelectrochemical water splitting. J. Mater. Chem. A 2014, 2, 13705–13712. [Google Scholar] [CrossRef]
- Pu, A.; Deng, J.; Li, M.; Gao, J.; Zhang, H.; Hao, Y.; Zong, J.; Sun, X. Coupling Ti-doping and oxygen vacancies in hematite nanostructures for solar water oxidation with high efficiency. J. Mater. Chem. A 2014, 2, 2491–2497. [Google Scholar] [CrossRef]
- Yoon, K.H.; Seo, D.K.; Cho, Y.S.; Kang, D.H. Effect of Pt layers on the photoelectrochemical properties of a WO3/p-Si electrode. J. Appl. Phys. 1998, 84, 3954. [Google Scholar] [CrossRef]
- Xing, Z.; Shen, S.; Wang, M.; Ren, F.; Liu, Y.; Zheng, X.; Liu, Y.; Xiao, X.; Wu, W.; Jiang, C. Efficient enhancement of solar-water-splitting by modified “Z-scheme” structural WO3-W-Si photoelectrodes. Appl. Phys. Lett. 2014, 105, 143902. [Google Scholar] [CrossRef]
- Tilley, S.D.; Cornuz, M.; Sivula, K.; Grätzel, M. Light-induced water splitting with hematite: Improved nanostructure and iridium oxide catalysis. Angew. Chem. Int. Ed. 2010, 49, 6405–6415. [Google Scholar] [CrossRef] [PubMed]
- Formal, F.L.; Tétreault, N.; Cornuz, M.; Moehl, T.; Grätzel, M.; Sivula, K. Passivating surface states on water splitting hematite photoanodes with alumina overlayers. Chem. Sci. 2011, 2, 737–743. [Google Scholar] [CrossRef]
- Hisatomi, T.; Formal, F.L.; Cornuz, M.; Brillet, J.; Nicolas Tétreault, K.S.; Grätzel, M. Cathodic shift in onset potential of solar oxygen evolution on hematite by 13-group oxide overlayers. Energy Environ. Sci. 2011, 4, 2512–2515. [Google Scholar] [CrossRef]
- Barroso, M.; Cowan, A.J.; Pendlebury, S.R.; Grätzel, M.; Klug, D.R.; Durrant, J.R. The role of cobalt phosphate in enhancing the photocatalytic activity of α-Fe2O3 toward water oxidation. J. Am. Chem. Soc. 2011, 133, 14868–14871. [Google Scholar] [CrossRef] [PubMed]
- Riha, S.C.; Klahr, B.M.; Tyo, E.C.; Seifert, S.; Vajda, S.; Pellin, M.J.; Hamann, T.W.; Martinson, A.B.F. Atomic layer deposition of a submonolayer catalyst for the enhanced photoelectrochemical performance of water oxidation with hematite. ACS Nano 2013, 7, 2396–2405. [Google Scholar] [CrossRef] [PubMed]
- Du, C.; Yang, X.; Mayer, M.T.; Hoyt, H.; Xie, J.; McMahon, G.; Bischoping, G.; Wang, D. Hematite-based water splitting with low turn-on voltages. Angew. Chem. Int. Ed. 2013, 52, 12692. [Google Scholar] [CrossRef] [PubMed]
- Morales-Guio, C.G.; Mayer, M.T.; Yella, A.; Tilley, D.; Grätzel, M.; Hu, X. An optically transparent iron nickel oxide catalyst for solar water splitting. J. Am. Chem. Soc. 2015, 137, 9927–9936. [Google Scholar] [CrossRef] [PubMed]
- Jang, J.W.; Du, C.; Ye, Y.; Lin, Y.; Yao, X.; Thorne, J.; Liu, E.; McMahon, G.; Zhu, J.; Javey, A.; et al. Enabling unassisted solar water splitting by iron oxide and silicon. Nat. Commun. 2015, 6, 7447. [Google Scholar] [CrossRef] [PubMed]
- Smith, R.D.L.; Prévot, M.S.; Fagan, R.D.; Zhang, Z.; Sedach, P.A.; Siu, M.K.J.; Trudel, S.; Berlinguette, C.P. Photochemical route for accessing amorphous metal oxide materials for water oxidation catalysis. Science 2013, 340, 60–63. [Google Scholar] [CrossRef] [PubMed]
- Jeng, J.Y.; Chen, K.C.; Chiang, T.Y.; Lin, P.Y.; Tsai, T.D.; Chang, Y.C.; Guo, T.F.; Chen, P.; Wen, T.C.; Hsu, Y.J. Nickel oxide electrode interlayer in CH3NH3PbI3 perovskite/PCBM planar-heterojunction hybrid solar cells. Adv. Mater. 2014, 26, 4107. [Google Scholar] [CrossRef] [PubMed]
- Zhao, X.; Feng, J.; Chen, S.; Huang, Y.; Sumb, T.C.; Chen, Z. New insight into the roles of oxygen vacancies in hematite for solar water splitting. Phys. Chem. Chem. Phys. 2017, 19, 1074–1082. [Google Scholar] [CrossRef] [PubMed]
- Chen, Z.; Dinh, H.N.; Miller, E. Photoelectrochemical Water Splitting: Standards, Experimental Methods and Protocols; Springer: Berlin, Germany, 2013. [Google Scholar]
- Fan, H.; Reid, S.A. Phase transformations in pulsed laser deposited nanocrystalline tin oxide thin films. Chem. Mater. 2003, 15, 564–567. [Google Scholar] [CrossRef]
- Wang, D.; Zhang, Y.; Wang, J.; Peng, C.; Huang, Q.; Su, S.; Wang, L.; Huang, W.; Fan, C. Template-free synthesis of hematite photoanodes with nanostructured ATO conductive underlayer for PEC water splitting. ACS Appl. Mater. Interfaces 2014, 6, 36–40. [Google Scholar] [CrossRef] [PubMed]
Figure 1.
(a) open-circuit potentials (OCP) and (b) Current density-to-potential (J–V) curves of NiFeO/hematite photoanodes for various Ni-to-Fe ratios of the precursor measured at the light-on (solid line) and light-off (dash line) conditions. The immersion time for depositing NiFeO was 2 min. The case without depositing the electrocatalyst layer is also shown for comparison. The error bars indicate the standard error of mean over three samples. The inset shows a photograph of a sample under chemical bath deposition.
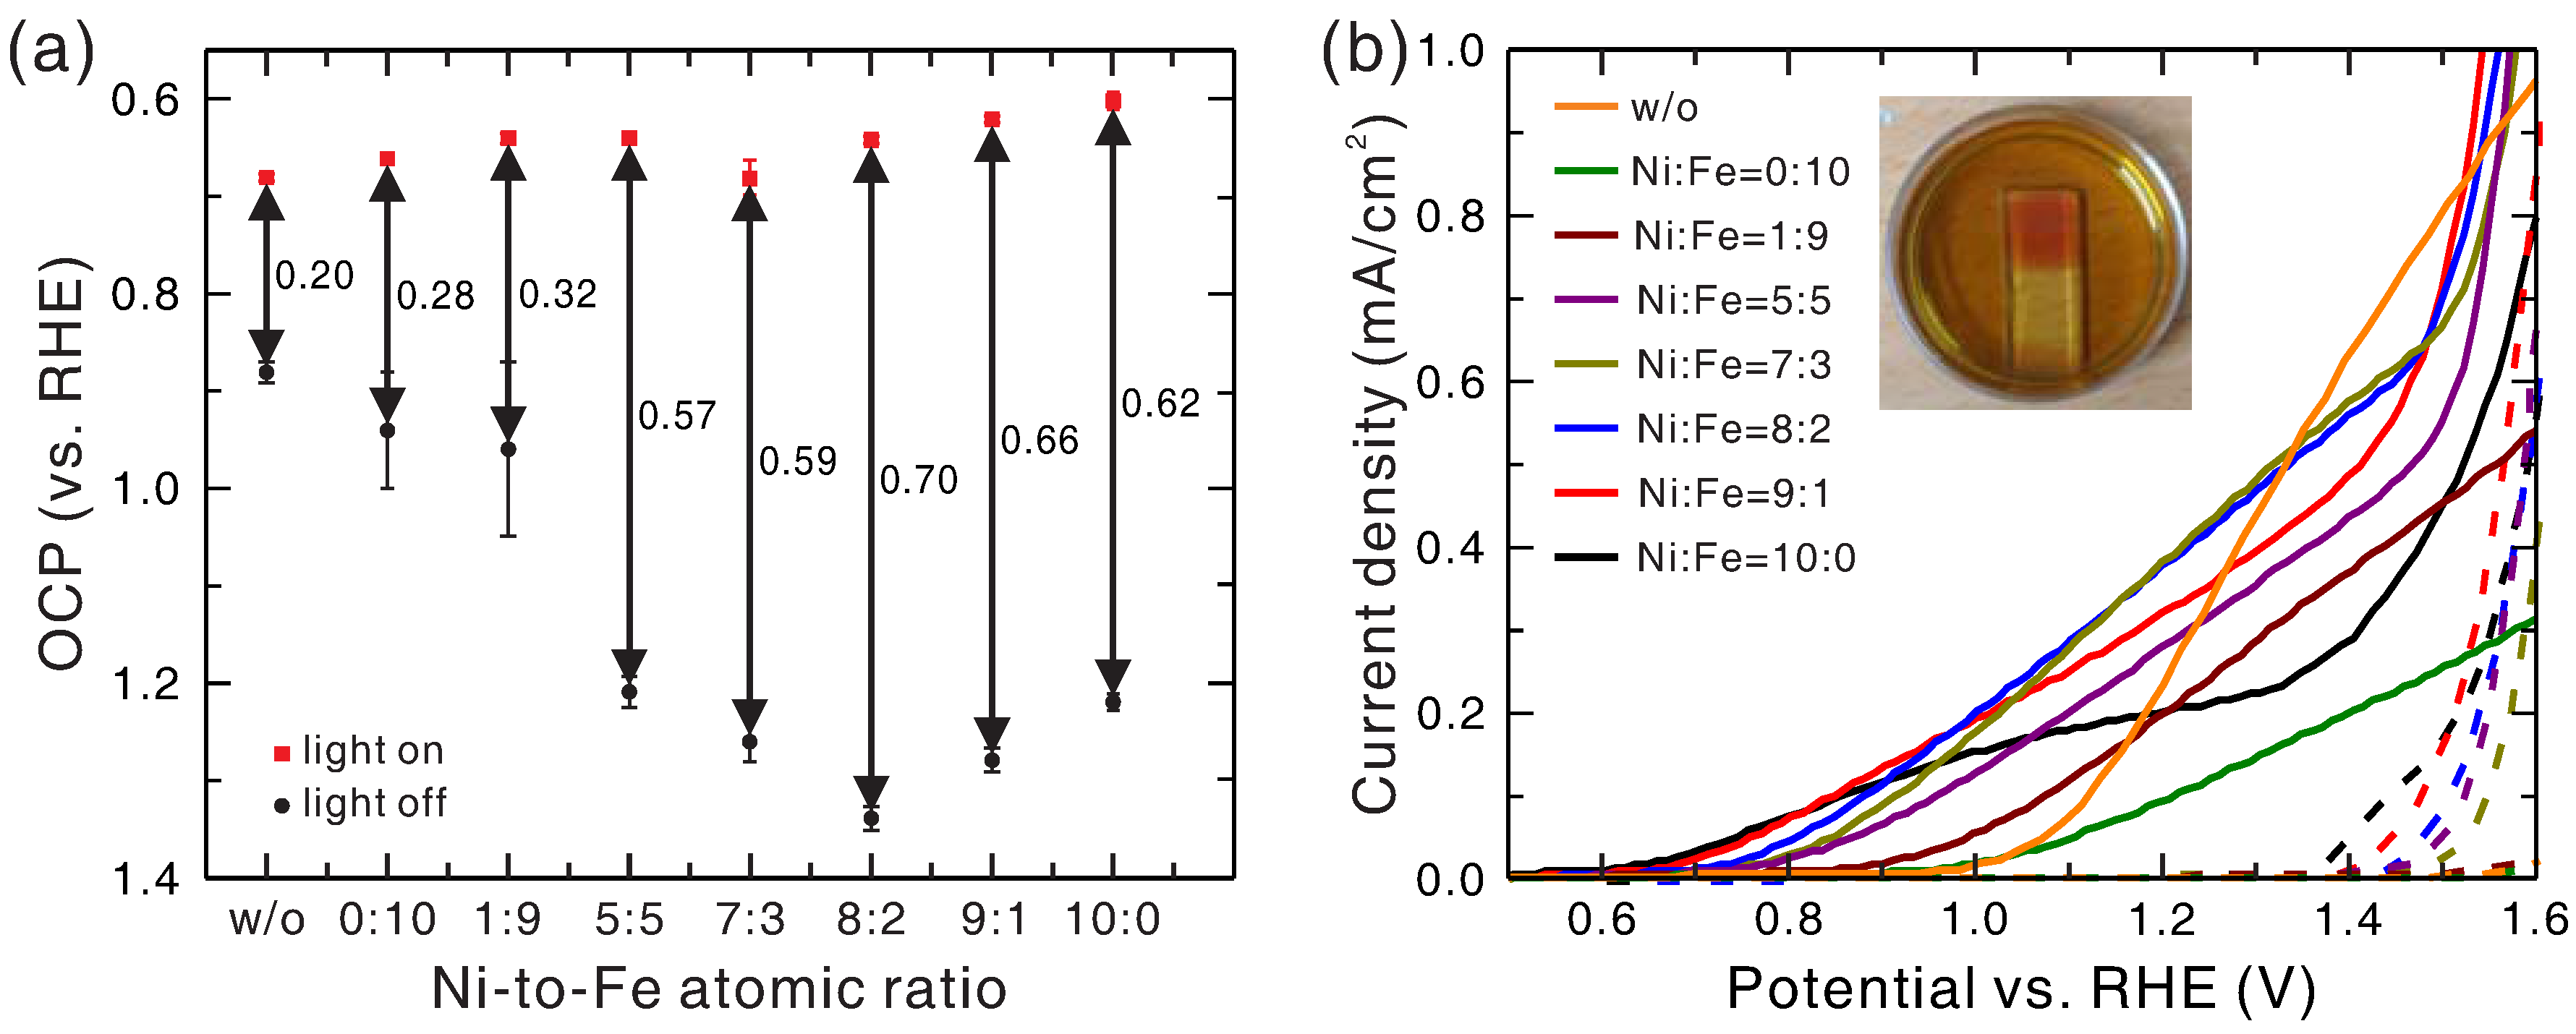
Figure 2.
(a) open-circuit potentials (OCP) and (b) J–V curves of NiFeO/hematite photoanodes grown with various immersion times measured at the light-on and light-off conditions. The Ni-to-Fe ratio of the precursor was 8:2.
Figure 2.
(a) open-circuit potentials (OCP) and (b) J–V curves of NiFeO/hematite photoanodes grown with various immersion times measured at the light-on and light-off conditions. The Ni-to-Fe ratio of the precursor was 8:2.
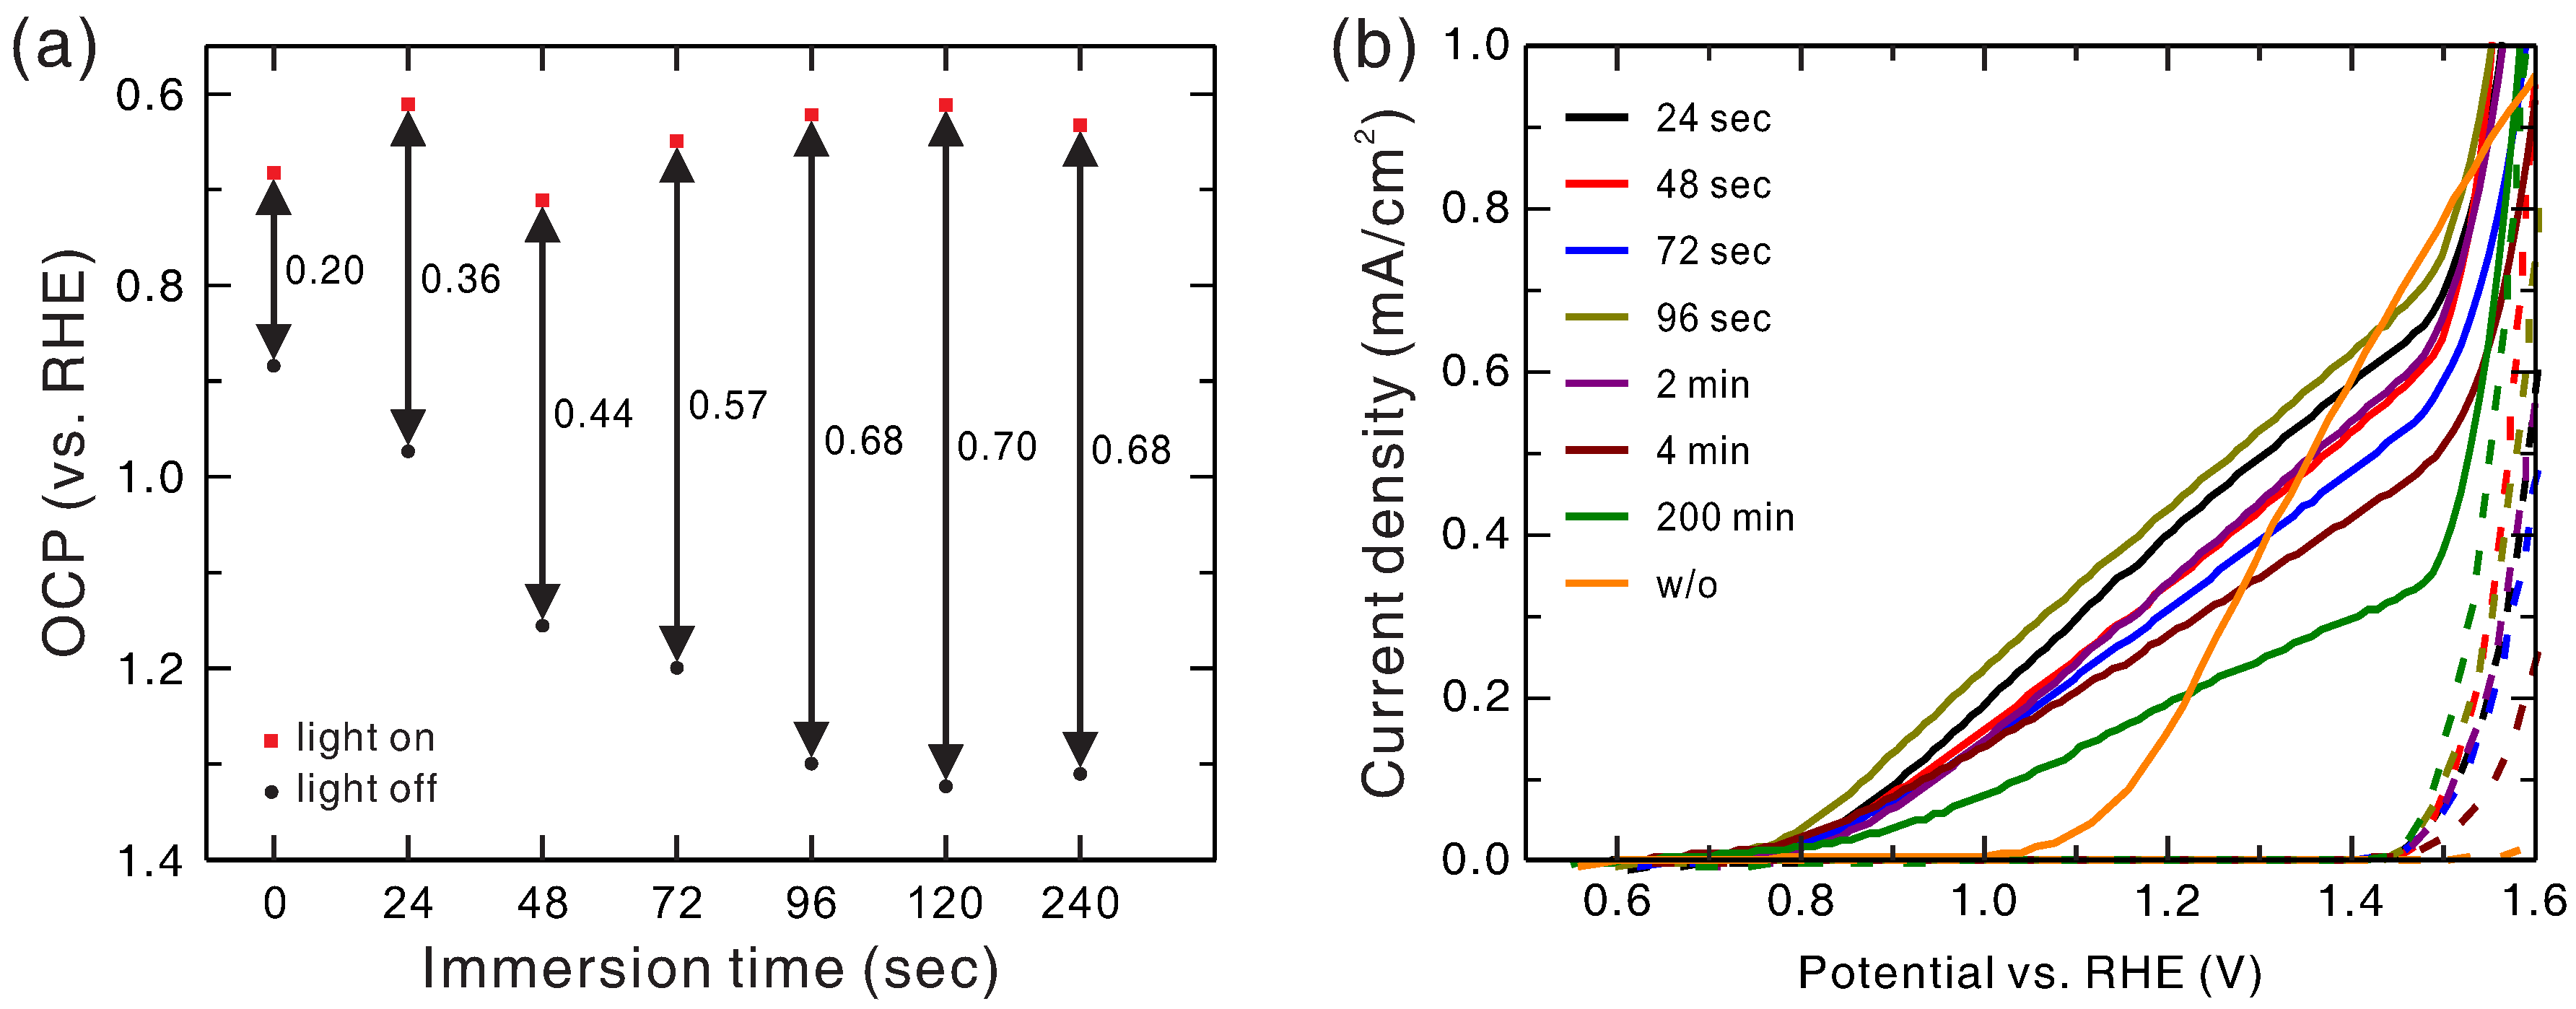
Figure 3.
Top-view SEM images of NiFeO/hematite photoanodes grown with various immersion times: (a) 0 s, (b) 48 s, (c) 96 s, and (d) 2 min. (e,f): high-resolution images of the bright region taken with field-emission SEM (FE-SEM) for the cases with an immersion time of 2 min and 20 min, respectively. The Ni-to-Fe ratio of the precursor was 8:2.
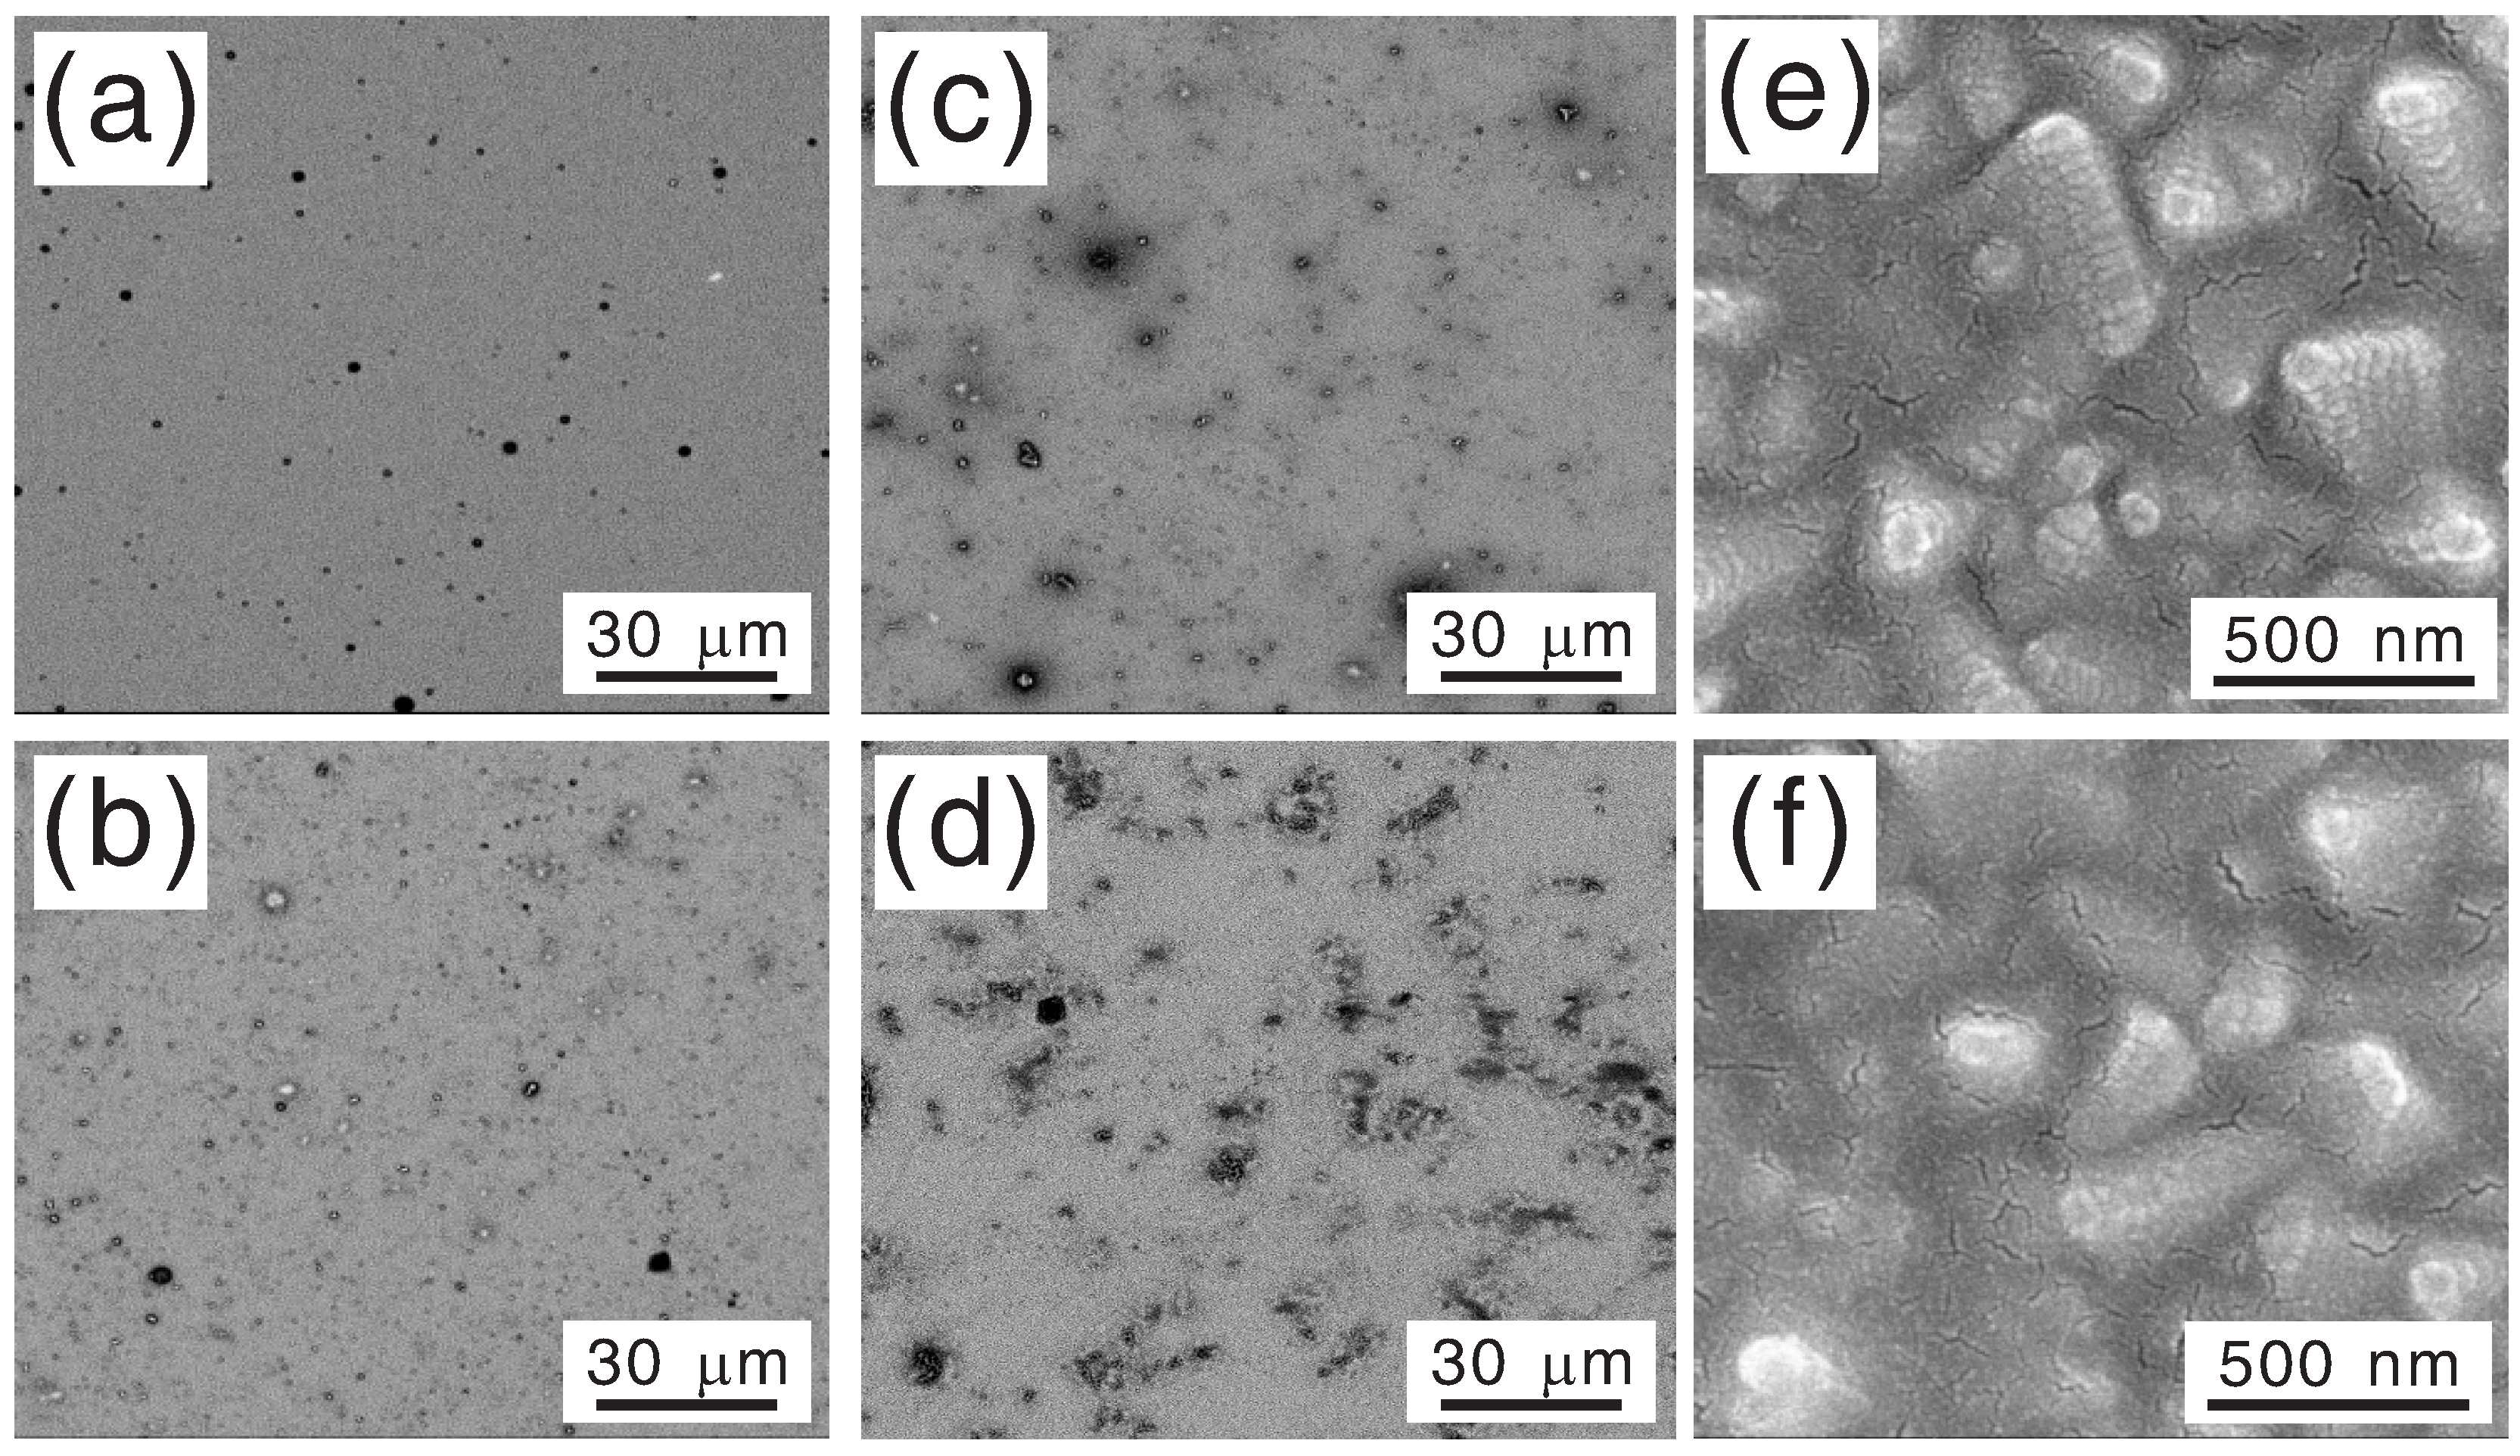
Figure 4.
(a) cross-sectional TEM image and (b–d) cross-sectional energy-dispersive spectroscopy (EDS) maps of Fe, Sn, and Ni of NiFeO/hematite photoanode grown with a Ni-to-Fe ratio of 8:2 and an immersion time of 2 min. The sample was coated with Pt for slicing with a focused ion beam prior to the measurements. The sparsely distributed points in the EDS maps are just system background, and only the denser regions indicate actual presence of the elements.

Figure 5.
Ni and Fe atomic concentrations of NiFeO/hematite photoanodes with various Ni-to-Fe ratios of the precursor measured with energy-dispersive spectroscopy (EDS), taking into account only Ni and Fe. The immersion time for depositing NiFeO was 2 min.
Figure 5.
Ni and Fe atomic concentrations of NiFeO/hematite photoanodes with various Ni-to-Fe ratios of the precursor measured with energy-dispersive spectroscopy (EDS), taking into account only Ni and Fe. The immersion time for depositing NiFeO was 2 min.

Figure 6.
Mott–Schottky curves for NiFeO/hematite photoanodes with various Ni-to-Fe ratios of the precursor measured at the light-off condition. The immersion time for depositing NiFeO was 2 min. The curve for the bare hematite photoanode is also shown for comparison.
Figure 6.
Mott–Schottky curves for NiFeO/hematite photoanodes with various Ni-to-Fe ratios of the precursor measured at the light-off condition. The immersion time for depositing NiFeO was 2 min. The curve for the bare hematite photoanode is also shown for comparison.

Figure 7.
(a) ultraviolet photoelectron spectroscopy (UPS) spectra of the bare hematite and the NiFeO electrocatalysts on hematite with various Ni-to-Fe ratios of the precursor. The immersion time for depositing NiFeO was 2 min; (b) magnified view of the low binding-energy cutoff region.
Figure 7.
(a) ultraviolet photoelectron spectroscopy (UPS) spectra of the bare hematite and the NiFeO electrocatalysts on hematite with various Ni-to-Fe ratios of the precursor. The immersion time for depositing NiFeO was 2 min; (b) magnified view of the low binding-energy cutoff region.

Figure 8.
J–V curves of the NiFeO/hematite photoanode and the bare hematite photoanode measured at the light-on and light-off conditions with and without the presence of 0.1 M NaSO as the hole scavenger (sacrificial reagent) in the electrolyte. To reveal the stability, the J–V curve of the same NiFeO/hematite photoanode measured after 72 h continuous light-on operation at 1.23 V vs. reversible hydrogen electrode (RHE) is also shown for comparison.
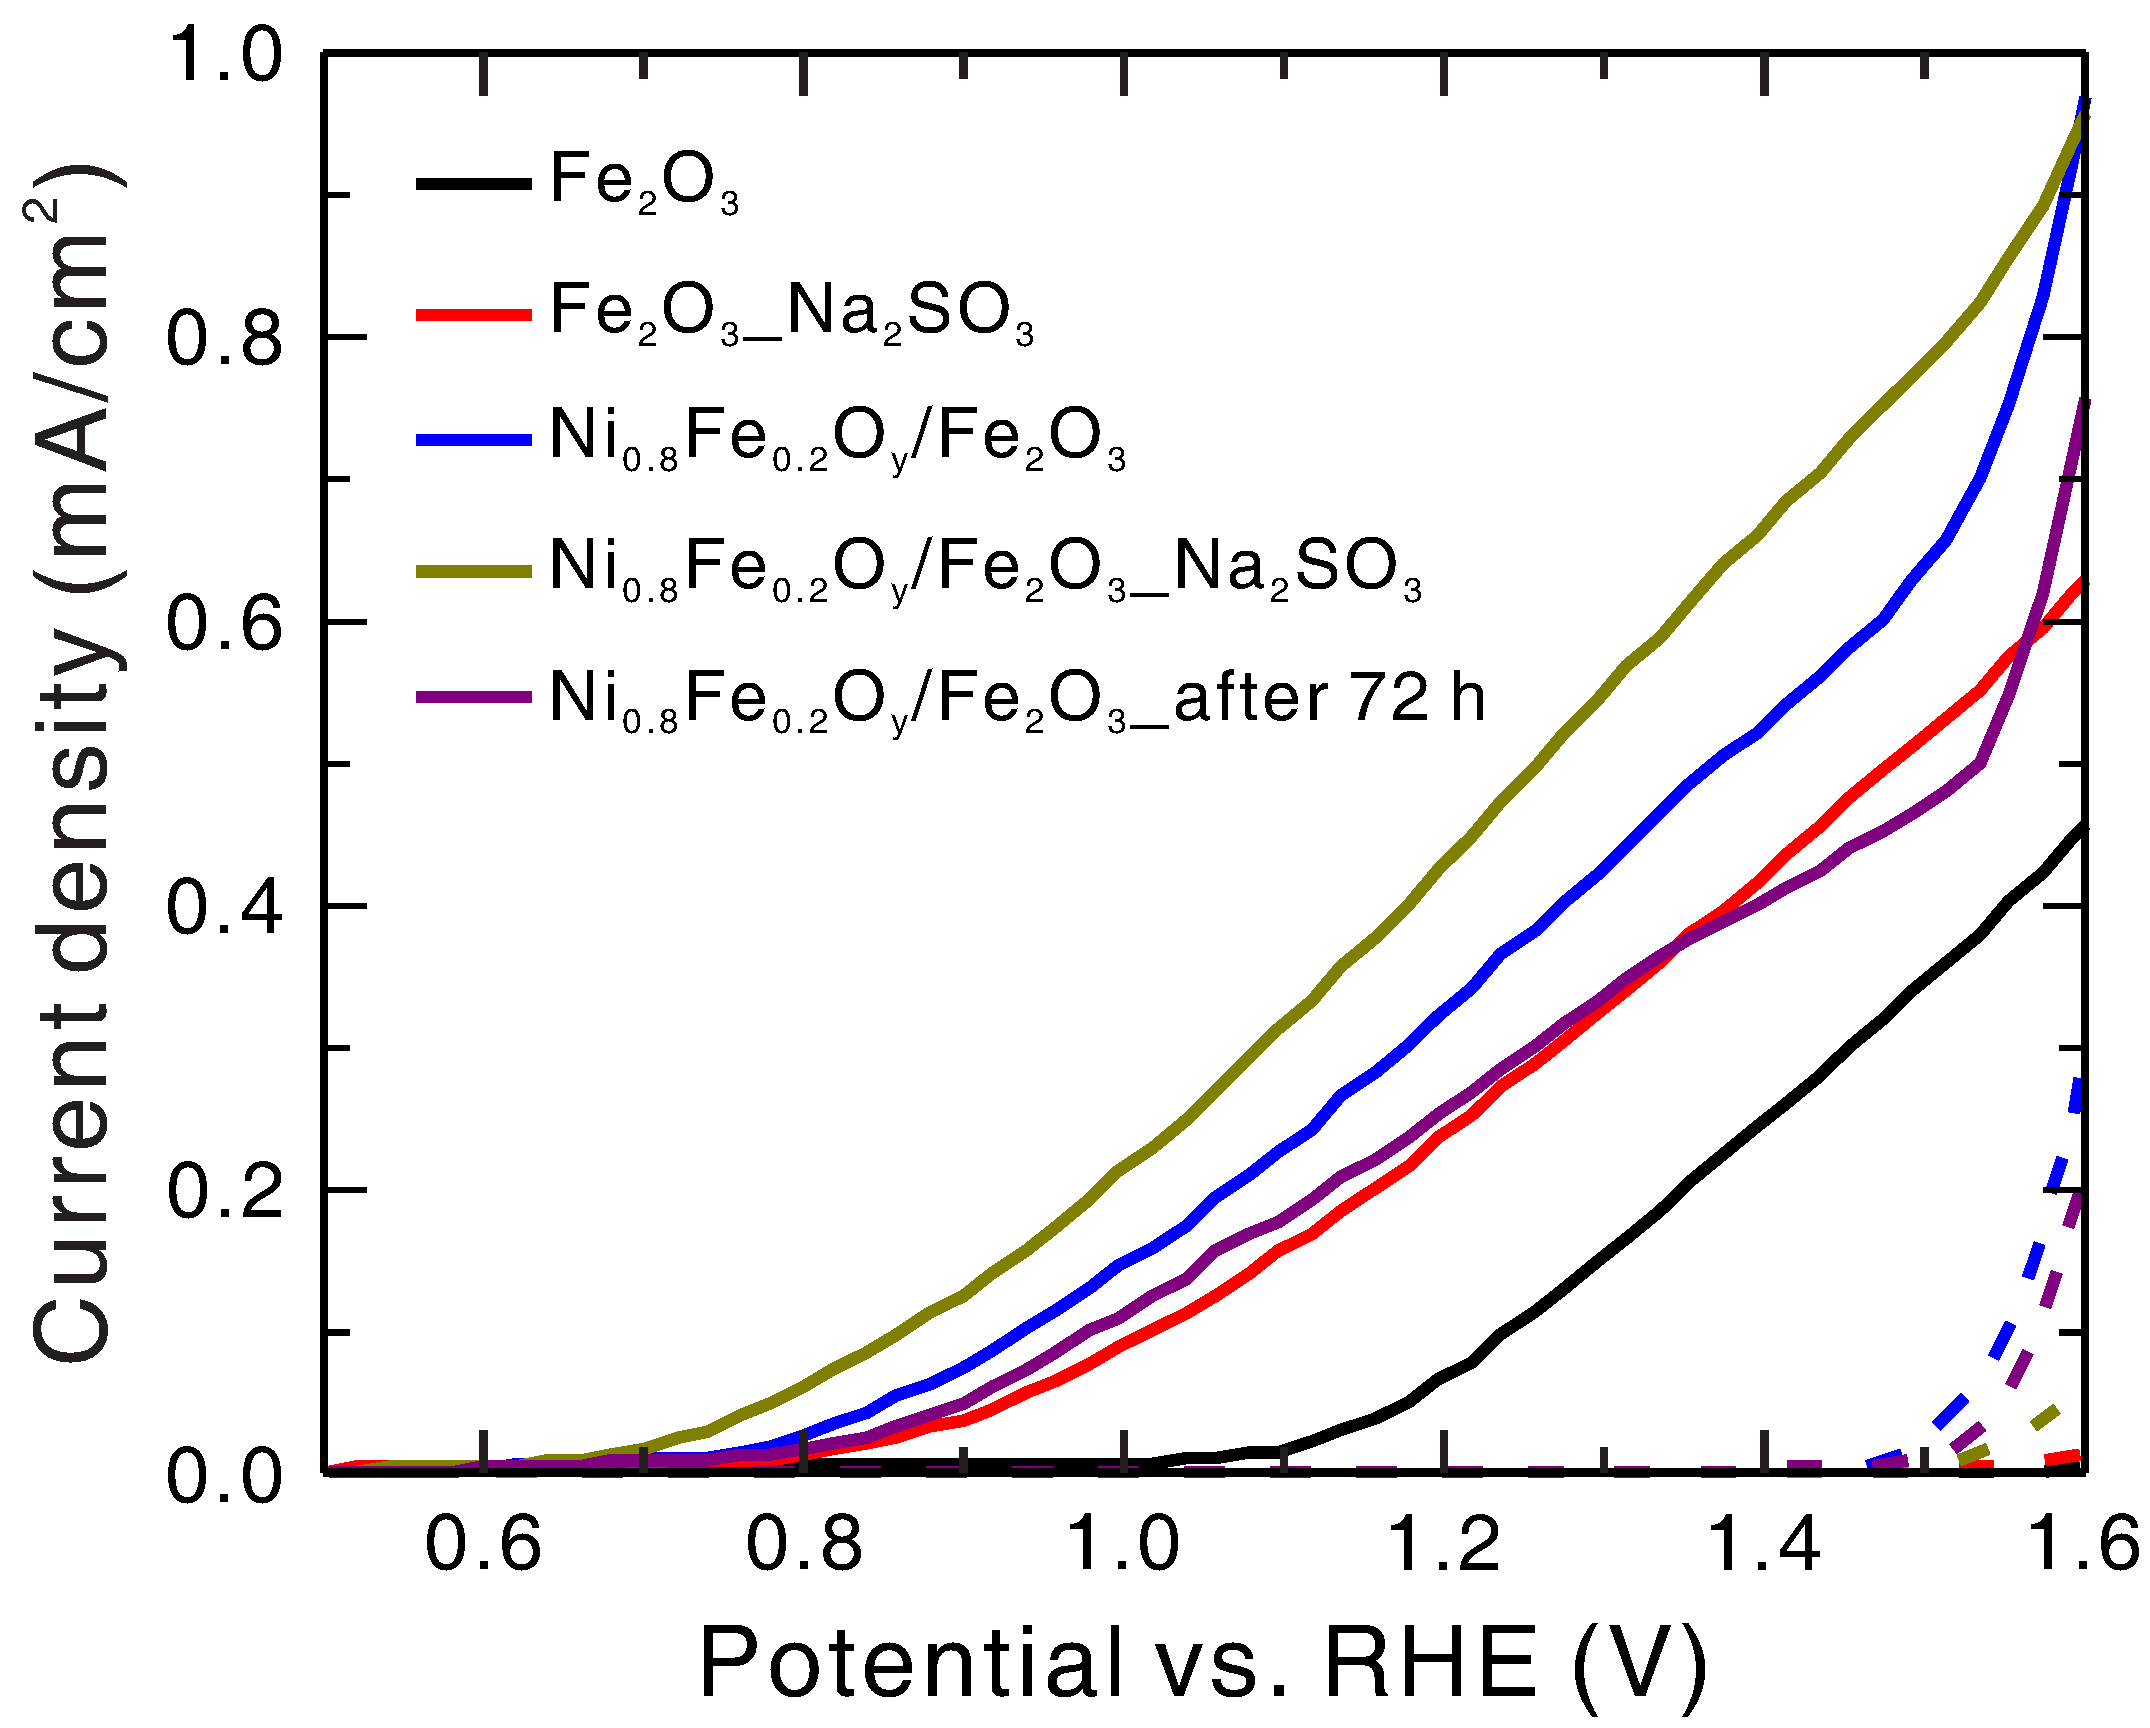
Figure 9.
Energy level diagrams of the bare hematite photoanode and the NiFeO/hematite photoanodes with various Ni-to-Fe ratios under open-circuit condition without and with light irradiation. For clarity, only three cases of different Ni-to-Fe ratios are plotted.
Figure 9.
Energy level diagrams of the bare hematite photoanode and the NiFeO/hematite photoanodes with various Ni-to-Fe ratios under open-circuit condition without and with light irradiation. For clarity, only three cases of different Ni-to-Fe ratios are plotted.

Table 1.
Information retrieved from the Mott–Schottky analysis based on the low-potential region: : doping density (electron density); : flat-band potential. RHE: reversible hydrogen electrode.
Table 1.
Information retrieved from the Mott–Schottky analysis based on the low-potential region: : doping density (electron density); : flat-band potential. RHE: reversible hydrogen electrode.
| Ni-to-Fe Ratio | w/o | 0:10 | 1:9 | 5:5 | 7:3 | 8:2 | 9:1 | 10:0 |
|---|---|---|---|---|---|---|---|---|
| (10 cm) | 12.51 | 1.07 | 2.12 | 2.55 | 6.34 | 2.86 | 3.60 | 2.64 |
| (V) vs. RHE | 0.32 | 0.43 | 0.49 | 0.43 | 0.41 | 0.54 | 0.54 | 0.39 |
Table 2.
Energies of the Fermi levels () and the valence band maxima () retrieved from ultraviolet photoelectron spectroscopy (UPS) spectra shown in Figure 7. The work function () gives the energy of the Fermi level with respect to the vacuum level and is calculated with = 21.22 eV − (−). is calculated with − = .
| Ni-to-Fe Ratio | w/o | 0:10 | 1:9 | 5:5 | 7:3 | 8:2 | 9:1 | 10:0 |
|---|---|---|---|---|---|---|---|---|
| low cutoff (eV) | 2.0 | 0.0 | 0.0 | 0.1 | 0.1 | 0.1 | 0.1 | 0.4 |
| high cutoff (eV) | 18.7 | 16.5 | 16.4 | 16.5 | 16.7 | 16.8 | 16.8 | 16.8 |
| (eV) | 4.5 | 4.7 | 4.8 | 4.8 | 4.6 | 4.5 | 4.5 | 4.8 |
| (eV) | 6.5 | 4.7 | 4.8 | 4.9 | 4.7 | 4.6 | 4.6 | 5.2 |
Table 3.
Photovoltages extracted from J–V curves (Onset− Onset) compared with that extracted from open-circuit potentials open-circuit potentials (OCP) (OCP− OCP ). All potentials are in unit of V vs. RHE. All photovoltages are in unit of V.
Table 3.
Photovoltages extracted from J–V curves (Onset− Onset) compared with that extracted from open-circuit potentials open-circuit potentials (OCP) (OCP− OCP ). All potentials are in unit of V vs. RHE. All photovoltages are in unit of V.
| Ni-to-Fe Ratio | w/o | 0:10 | 1:9 | 5:5 | 7:3 | 8:2 | 9:1 | 10:0 |
|---|---|---|---|---|---|---|---|---|
| 0.68 | 0.66 | 0.64 | 0.64 | 0.68 | 0.64 | 0.62 | 0.60 | |
| 0.88 | 0.94 | 0.96 | 1.21 | 1.26 | 1.34 | 1.28 | 1.22 | |
| 0.20 | 0.28 | 0.32 | 0.57 | 0.58 | 0.70 | 0.66 | 0.62 | |
| 0.99 | 0.96 | 0.86 | 0.75 | 0.78 | 0.74 | 0.70 | 0.66 | |
| 1.55 | 1.55 | 1.53 | 1.41 | 1.46 | 1.44 | 1.41 | 1.37 | |
| 0.56 | 0.59 | 0.67 | 0.66 | 0.68 | 0.70 | 0.71 | 0.71 |
© 2017 by the authors. Licensee MDPI, Basel, Switzerland. This article is an open access article distributed under the terms and conditions of the Creative Commons Attribution (CC BY) license (http://creativecommons.org/licenses/by/4.0/).
Share and Cite
MDPI and ACS Style
Yen, C.-P.; Li, Y.-J.; Wang, J.; Chen, S.-y.; Tseng, C.-J. Characteristics of NixFe1−xOy Electrocatalyst on Hematite as Photoanode for Solar Hydrogen Production. Catalysts 2017, 7, 350. https://doi.org/10.3390/catal7110350
AMA Style
Yen C-P, Li Y-J, Wang J, Chen S-y, Tseng C-J. Characteristics of NixFe1−xOy Electrocatalyst on Hematite as Photoanode for Solar Hydrogen Production. Catalysts. 2017; 7(11):350. https://doi.org/10.3390/catal7110350
Chicago/Turabian StyleYen, Chih-Ping, Yan-Jin Li, Jyhpyng Wang, Szu-yuan Chen, and Chung-Jen Tseng. 2017. "Characteristics of NixFe1−xOy Electrocatalyst on Hematite as Photoanode for Solar Hydrogen Production" Catalysts 7, no. 11: 350. https://doi.org/10.3390/catal7110350
Note that from the first issue of 2016, this journal uses article numbers instead of page numbers. See further details here.